Presentation type:
OS – Ocean Sciences

EGU24-2879 | Orals | OS3.2 | Highlight | Fridtjof Nansen Medal Lecture

Future trends and climate feedbacks of the biological carbon pump 

Stephanie Henson

The biological carbon pump is a series of processes that transfers organic carbon from the surface ocean into the deep ocean.  Without it, atmospheric CO2 levels would be ~ 50 % higher than pre-industrial levels.  Despite its importance, we currently struggle to understand how the strength and efficiency of the biological carbon pump varies temporally and spatially.  This makes it difficult to observe, and therefore model the pump, so our knowledge of how this important component of the global carbon cycle might respond to climate change is poor.  In this talk I’ll present recent progress on using autonomous vehicles to quantify variability in the biological carbon pump, discuss the current limitations in our understanding of the pump, and the implications of those knowledge gaps for robust modelling of the current and future pump. 

How to cite: Henson, S.: Future trends and climate feedbacks of the biological carbon pump, EGU General Assembly 2024, Vienna, Austria, 14–19 Apr 2024, EGU24-2879, https://doi.org/10.5194/egusphere-egu24-2879, 2024.

EGU24-10184 | ECS | Orals | OS1.6 | Highlight | OS Division Outstanding ECS Award Lecture

The global influence of ice-ocean interactions in Antarctica 

Alessandro Silvano

In this seminar, I will explore the oceanic processes that drive melting of the Antarctic Ice Sheet, and consequent global sea level rise. Different processes lead certain areas of the Antarctic Ice Sheet to be more susceptible to rapid ocean-driven melting, while other areas to be more resilient. I will also show the emergence of a feedback between the ice sheet and Southern Ocean: increased melting leads to warming of the oceanic waters surrounding Antarctica, with consequences for future sea level rise. I will conclude by describing how increased melting of the Antarctic Ice Sheet as well as changes in sea ice affect the global ocean abyss and its ability to store anthropogenic heat and carbon.

How to cite: Silvano, A.: The global influence of ice-ocean interactions in Antarctica, EGU General Assembly 2024, Vienna, Austria, 14–19 Apr 2024, EGU24-10184, https://doi.org/10.5194/egusphere-egu24-10184, 2024.

OS1 – Ocean Circulation and Climate

EGU24-775 | ECS | Posters on site | OS1.1

The rapid life of Arctic sea-ice ridge consolidation and melt 

Evgenii Salganik, Benjamin Lange, Christian Katlein, Ilkka Matero, Dmitry Divine, Polona Itkin, Knut Høyland, and Mats Granskog

In this study, we cover observations of the rapid consolidation and enhanced melt of Arctic sea-ice ridges. During the freezing period, the consolidated part of sea ice ridges is usually up to 1.6–1.8 times thicker than surrounding level ice. Meanwhile, during the melt season, ridges are often observed to be fully consolidated, but this process is not fully understood. We present the evolution of the morphology and temperature of a first-year ice ridge studied during MOSAiC from its formation to advanced melt. From October to May, the draft of first-year ice at the MOSAiC coring site increased from 0.3 m to 1.5 m, while from January to July, the consolidated layer thickness in the ridge reached 3.9 m. We observed several types of ridge consolidation. From the beginning of January until mid-April, the ridge consolidated slowly through heat loss to the atmosphere, with a total consolidated layer growth of 0.7 m. From mid-April to mid-June, there was a rapid increase in ridge consolidation rates, despite conductive heat fluxes not increasing. In this period, the mean thickness of the consolidated layer increased by 2.2 m. We also estimated a substantial snow mass fraction (6%–11%) of ridges using analysis of oxygen isotope composition. Our observations suggest that this sudden change was related to the transport of snow-slush inside the ridge keel via adjacent open leads that decreased ridge macroporosity, which could result in more rapid consolidation.

During the summer season, sea ice melts from the surface and bottom. The melt rates substantially vary for sea ice ridges and undeformed first- and second-year ice. Ridges generally melt faster than undeformed ice, while the melt of ridge keels is often accompanied by further summer growth of their consolidated layer, which increases their survivability. We examined the spatial variability of ice melt for different types of ice from in situ drilling, coring, and multibeam sonar scans of the remotely operated underwater vehicle. Six sonar scans performed from 24 June to 21 July were analyzed and validated using seven ice drilling transects. The area investigated by the sonar (0.4 km by 0.2 km) consisted of several ice ridges, surrounded by first- and second-year ice. We show a substantial difference in melt rates for sea ice with a different draft. We also show how ridge keels decay depending on the keel draft, width, steepness, and location relative to the surrounding ridge keel edges. We also use temperature buoy data to distinguish snow, ice surface, and bottom melt rates for both ridges and level ice. These results are important for quantifying ocean heat fluxes for different types of ice during the advanced melt and for estimating the ridge contribution to the total ice mass and summer meltwater balances of the Arctic Ocean.

How to cite: Salganik, E., Lange, B., Katlein, C., Matero, I., Divine, D., Itkin, P., Høyland, K., and Granskog, M.: The rapid life of Arctic sea-ice ridge consolidation and melt, EGU General Assembly 2024, Vienna, Austria, 14–19 Apr 2024, EGU24-775, https://doi.org/10.5194/egusphere-egu24-775, 2024.

EGU24-929 | ECS | Posters on site | OS1.1 | Highlight

Potential effects of summer Cryosat-2 sea ice thickness observations on sea ice forecast 

Ruizhe Song, Longjiang Mu, Xianyao Chen, Frank Kauker, Svetlana Loza, and Martin Losch

Skillful Arctic sea ice forecast for the melting season remains a great challenge because there is no reliable pan-Arctic sea ice thickness (SIT) data set for the summertime. A new summer Cryosat-2 SIT observation data set based on an artificial intelligence algorithm may mitigate the situation. We assess the impact of this new data set on the initialization of both short-term and long-term sea ice forecasts in the melting seasons of 2015 and 2016 in a sea-ice couple model with data assimilation. We find that the assimilation of the new summer CryoSat-2 SIT observations can reduce the summer ice edge prediction error. Further, adding SIT observations to an established forecast system with sea ice concentration assimilation leads to a more realistic short-term summer ice edge forecast in the Arctic Pacific sector. The long-term Arctic-wide SIT prediction is also improved especially before the onset of freezing. In spite of remaining uncertainties,  summer CryoSat-2 SIT observations have the potential to enhance Arctic sea ice forecast on multiple time scales.

How to cite: Song, R., Mu, L., Chen, X., Kauker, F., Loza, S., and Losch, M.: Potential effects of summer Cryosat-2 sea ice thickness observations on sea ice forecast, EGU General Assembly 2024, Vienna, Austria, 14–19 Apr 2024, EGU24-929, https://doi.org/10.5194/egusphere-egu24-929, 2024.

The Arctic region is experiencing a notable increase in precipitation, known as Arctic wetting, amidst the backdrop of Arctic warming. This phenomenon has implications for the Arctic hydrological cycle and numerous socio-ecological systems. However, the ability of climate models to accurately simulate changes in Arctic wetting has not been thoroughly assessed. In this study, we analyze total precipitation in the Arctic using station data, multiple reanalyses, and 35 models participating in the Coupled Model Intercomparison Project Phase 6 (CMIP6). By employing the moisture budget equation and an evaluation method for model performance with ERA5 reanalysis as a reference, we evaluated the models’ capability to reproduce past Arctic wetting patterns. Our findings indicate that most reanalyses and models are able to replicate Arctic wetting. However, the CMIP6 models generally exhibit an overestimation of Arctic wetting during the warm season and an underestimation during the cold season from 1979 to 2014 when compared to the ERA5 reanalysis. Further investigation reveals that the overestimation of wetting during the warm season is largest over the Arctic Ocean’s northern part, specifically the Canadian Arctic Archipelago, and is associated with an overestimation of atmospheric moisture transport. Conversely, the models significantly underestimate wetting over the Barents-Kara Sea during the cold season, which can be attributed to an underestimation of evaporation resulting from the models’ inadequate representation of sea ice reduction in that region. The models with the best performance in simulating historical Arctic wetting indicate a projected intensification of Arctic wetting, and optimal models significantly reduce uncertainties in future projections compared to the original models, particularly in the cold season and oceanic regions. Our study highlights significant biases in the CMIP6 models’ simulation of Arctic precipitation, and improving the model’s ability to simulate historical Arctic precipitation could reduce uncertainties in future projections.

How to cite: Cai, Z. and You, Q.: Arctic wetting: Performances of CMIP6 models and projections of precipitation changes, EGU General Assembly 2024, Vienna, Austria, 14–19 Apr 2024, EGU24-1673, https://doi.org/10.5194/egusphere-egu24-1673, 2024.

EGU24-1892 | ECS | Orals | OS1.1

Observations of deep near-inertial internal waves in the Eurasian Basin. 

Joel Bracamontes Ramírez and Maren Walter

The Arctic Ocean has a less energetic internal wave climate than other oceans, mainly due to the thick sea ice cover which inhibits wind interaction with the surface. With the continued decrease in summer sea ice extent and the increase in seasonal ice-free areas, wind-driven internal waves, especially in the near-inertial range, are becoming more energetic. Coupled with the fact that most of the Arctic Ocean lies north of the critical latitude for semi-diurnal tides, the shift in ice dynamics implies an increase in the importance of near-inertial waves (NIW) for the internal wave climate. In particular, increased NIW amplitude and kinetic energy in the Canadian Basin and enhanced wind-driven vertical heat fluxes and dissipation rates in the Eurasian Basin have already been observed in the upper column. In the deep ocean beyond the critical latitude, NIWs are expected to drive mixing in the interior, but it is unclear to what extent. Here, we present innovative and unprecedented deep current observations from a mooring in the Gakkel Ridge in the Eurasian Basin at 82.53°N. The presence of barotropic diurnal and semi-diurnal tides and semi-diurnal harmonics enriches the complex interplay of internal waves. By comparing the observed downward and upward NIW kinetic energy with wind speed, sea ice properties and numerical simulations, we discuss the likely surface origin of the NIW. In particular, there is a lagged correlation of <26 days between ice drift speed and downward NIW energy, and of ~15 days between wind factor and downward NIW energy. In addition, the buoyancy frequency is weaker than the local Coriolis frequency, effectively limiting NIW propagation. Evidence for wave reflection is found and also discussed, with a focus on the implications for NIW coming from the surface.

How to cite: Bracamontes Ramírez, J. and Walter, M.: Observations of deep near-inertial internal waves in the Eurasian Basin., EGU General Assembly 2024, Vienna, Austria, 14–19 Apr 2024, EGU24-1892, https://doi.org/10.5194/egusphere-egu24-1892, 2024.

The Arctic is one of Earth’s regions most susceptible to climate change. Climate models show that in a warming climate, the Arctic Ocean warms much faster than the global ocean mean, mainly due to the rapid warming of the Atlantic layer, which is called 'Arctic Ocean Amplification.' However, climate models still encounter challenges with large biases and considerable inter-model spread in the Arctic Ocean. For example, the Atlantic layer in the Arctic Ocean, simulated by the climate models, is too thick and too deep. This leads to the warming trend, and inter-annual variability of the simulated Atlantic Water that are too small compared to the observations. Here, we present Arctic Ocean dynamical downscaling simulations and projections based on a high-resolution ice-ocean coupled model, FESOM, and a climate model, FIO-ESM. The historical results demonstrate that the root mean square errors of temperature and salinity in the downscaling simulations are much smaller than those from CMIP6 climate models. The common biases, such as the overly deep and thick Atlantic layer in climate models, are significantly reduced by dynamical downscaling. Dynamical downscaling projections show that the Arctic Ocean may warm faster than the projections made by CMIP6 fully-coupled climate models.

How to cite: Shu, Q. and Wang, Q.: Dynamical downscaling simulations and future projections of the Arctic Ocean based on FESOM and FIO-ESM., EGU General Assembly 2024, Vienna, Austria, 14–19 Apr 2024, EGU24-1921, https://doi.org/10.5194/egusphere-egu24-1921, 2024.

EGU24-1922 | Posters on site | OS1.1

Estimation of Sea Ice Production in the North Water Polynya Based on Ice Arch Duration in Winter During 2006–2019 

Fengming Hui, Haiyi Ren, Mohammed Shokr, Xiao Cheng, Xinqing Li, and Zhilun Zhang

The North Water Polynya (NOW) is the largest recurrent Arctic coastal polynya. The formation of the NOW is critically dependent on the development of an ice arch that defines its northern boundary. In this study, high-resolution ENVISAT Advanced Synthetic Aperture Radar data, Sentinel-1A data, and Moderate Resolution Imaging Spectroradiometer data were employed to identify the spatio-temporal characteristics of the ice arch during 2006–2019. Polynya pixels were identified based on the thin ice thickness (TIT), using a threshold of TIT <0.2 m, from which the polynya extent, heat flux, and ice production (IP) were estimated. The results show the different locations of the ice arch in different years, with a mean duration of 132 ± 69 days. The average annual polynya extent over the 14 years is ∼38.8 ± 8 × 10³ km2, and we found that it is more closely correlated with wind speed during the winter and air temperature during early spring. The average heat flux drops from about 248 W/m2 in the winter months to about 34 W/m2 in May. The average accumulated IP varies significantly every year, with an average of 144 ± 103 km3, and peak values in March in most years. No apparent interannual trends are shown for the polynya area, heat flux, and IP during 2006–2019. The results also show that IP calculated based on the ice arch data is approximately 25% lower than that obtained by assuming a fixed time, location, and duration for the polynya.

How to cite: Hui, F., Ren, H., Shokr, M., Cheng, X., Li, X., and Zhang, Z.: Estimation of Sea Ice Production in the North Water Polynya Based on Ice Arch Duration in Winter During 2006–2019, EGU General Assembly 2024, Vienna, Austria, 14–19 Apr 2024, EGU24-1922, https://doi.org/10.5194/egusphere-egu24-1922, 2024.

Sea ice in the high latitude is an indicator of climate change and has undergone dramatic changes because of recent global warming. Synthetic aperture radar (SAR) is a relatively practical tool for sea ice monitoring because of its low sensitivity to clouds, rain, and fog, as well as its capability for high-resolution earth observation in daylight or darkness. With the progression in SAR systems from single-pol to dual-pol, quad-pol and hybrid-pol, large numbers of parameters have been proposed for sea ice classification. Even though a large number of SAR characteristics have been used to classify sea ice, it remains unclear which parameters are the most effective for different regions and seasonal or environmental conditions. Meanwhile, classification studies for fine sea ice with high spatial resolution and many sub-types of sea ice, particularly in the case of rapidly changing first-year ice (FYI), which includes new ice (NI), young ice (YI), and FYI, are rather few. NI and YI have comparatively thinner thickness, and are often classified as FYI in these studies[1].

A new method of sea ice classification based on feature selection from Gaofen-3 polarimetric SAR observations is proposed. The new approach classifies sea ice into four categories: open water, NI, YI, and FYI. Seventy parameters that have previously been applied to sea ice studies are re-examined for sea ice classification in the Okhotsk Sea near the melting point on 28 February 2020. The ‘separability index’ is used for the selection of optimal features for sea ice classification. Full polarization (σohh, SEi, Ks) and hybrid polarization parameters (σorl, CPSEirh-rv, αs) are determined as optimal. The selected parameters are used to classify NI, YI, and FYI using a SVM machine learning classifier; and classification results are validated by manually interpreted ice maps derived from Landsat-8 data.


[1]Sea ice: types and forms - Canada.ca

How to cite: Li, H. and Yang, K.: Fine resolution classification of new ice, young ice, and first-year ice based on feature selection from Gaofen-3 quad-polarization SAR, EGU General Assembly 2024, Vienna, Austria, 14–19 Apr 2024, EGU24-2666, https://doi.org/10.5194/egusphere-egu24-2666, 2024.

EGU24-2699 | Posters on site | OS1.1

Changes in ocean circulation and dissolved oxygen/nutrient distributions in the Canadian Basin 

Shigeto Nishino, Jinyoung Jung, Kyoung-Ho Cho, William Williams, Amane Fujiwara, Akihiko Murata, Motoyo Itoh, Eiji Watanabe, Mariko Hatta, Michiyo Yamamoto-Kawai, Takashi Kikuchi, Eun Jin Yang, and Sung-Ho Kang

The Arctic Ocean is facing dramatic environmental and ecosystem changes. To obtain the current baseline data, a coordinated multiship and multination pan-Arctic ship-based sampling campaign was implemented for the period between 2020 and 2022 under the project of Synoptic Arctic Survey (SAS). During the 2020 survey, unusually low dissolved oxygen and acidified water (salinity = 34.5) were found in a high-seas fishable area of the western (Pacific-side) Arctic Ocean. The data showed that the Beaufort Gyre (BG) shrunk to the east of the Chukchi Plateau (CP) and formed a front between the water within the gyre and the water from the eastern (Atlantic-side) Arctic. That phenomenon triggered a frontal northward flow along the CP. This flow likely transported the low oxygen and acidified water toward the high-seas fishable area; similar biogeochemical properties had previously been observed only on the shelf-slope north of the East Siberian Sea (ESS). Northward flows were also predominant west of the CP associated with the penetration of the water from the eastern Arctic. The northward flows would transport nutrient-rich shelf water (salinity = 32.5) from the ESS to the southwestern Canadian Basin (CB). Furthermore, the northeastward flow of the shrunk BG during the SAS period (2020-2022) could spread the nutrient-rich ESS shelf water to the northeastern CB. As a result, the nutrient concentration there during the SAS period was higher than the period when the BG enlarged to the west of CP, because the westward flow of the BG that overshot the CP inhibited the northward transport of the nutrient-rich ESS shelf water toward the southwestern CB. As a future study, we would like to combine the data from the Atlantic gateway because the ocean circulation and dissolved oxygen/nutrient distributions in the CB are largely influenced by the penetration of the water from the eastern Arctic. This is a reason why we have applied to present in this session.

How to cite: Nishino, S., Jung, J., Cho, K.-H., Williams, W., Fujiwara, A., Murata, A., Itoh, M., Watanabe, E., Hatta, M., Yamamoto-Kawai, M., Kikuchi, T., Yang, E. J., and Kang, S.-H.: Changes in ocean circulation and dissolved oxygen/nutrient distributions in the Canadian Basin, EGU General Assembly 2024, Vienna, Austria, 14–19 Apr 2024, EGU24-2699, https://doi.org/10.5194/egusphere-egu24-2699, 2024.

EGU24-3080 | Posters on site | OS1.1

No emergence of deep convection in the Arctic Ocean across CMIP6 models 

Céline Heuzé and Hailong Liu

As sea ice disappears, the emergence of open ocean deep convection in the Arctic, which would enhance ice loss, has been suggested. Here, using 36 state-of-the-art climate models and up to 50 ensemble members per model, we show that Arctic deep convection is rare under the strongest warming scenario. Only 5 models have convection by 2100, while 11 have had convection by the middle of the run. For all, the deepest mixed layers are in the eastern Eurasian basin. When the models convect, that region undergoes a salinification and increasing wind speeds; it is freshening otherwise. The models that do not convect have the strongest halocline and most stable sea ice, but those that lose their ice earliest -because of their strongly warming Atlantic Water- do not have a persistent deep convection: it shuts down mid-century. Halocline and Atlantic Water changes urgently need to be better constrained in models.  

How to cite: Heuzé, C. and Liu, H.: No emergence of deep convection in the Arctic Ocean across CMIP6 models, EGU General Assembly 2024, Vienna, Austria, 14–19 Apr 2024, EGU24-3080, https://doi.org/10.5194/egusphere-egu24-3080, 2024.

EGU24-3635 | Orals | OS1.1

Drivers of interannual salinity variability in the Arctic Ocean 

Antoine Hochet, Camille Lique, Florian Sévellec, and William Llovel

Accurate projections and attributions of Arctic ocean changes in climate models require a good understanding of the mechanisms underlying interannual salinity variability in the region. Although some mechanisms have been extensively studied in idealized settings, in particular for the dynamics of the Beaufort Gyre (BG), their applicability to the more complex system remains unclear. This study introduces a new diagnostic based on the salinity variance budget to robustly assess the mechanisms of salinity variations. The diagnostic is then applied to the Estimating the Circulation and Climate of the Ocean state estimate. 
The results indicate that the advection of salinity anomalies in the direction of the mean salinity gradient, produced by velocity anomalies is the primary source of interannual salinity variability. These velocities are primarily caused by fluctuating winds via Ekman transports.
Fluctuating surface freshwater fluxes from the atmosphere and sea ice are the second most important source of variability and cannot be neglected. The two sinks of interannual salinity variance are associated with the erosion of large-scale  mean circulation gradients by eddies and to a lesser extent to the diffusive terms. Over continental shelves, particularly over the East Siberian Shelf (ESS), ocean surface freshwater fluxes and diffusion play a more important role than in the deep basins.
We also report a strong intensification of all sources and sinks of interannual salinity variability in the BG and an opposite weakening in the ESS in the second decade of the analysis (2004-2014) with respect to the first (1993-2003). 

How to cite: Hochet, A., Lique, C., Sévellec, F., and Llovel, W.: Drivers of interannual salinity variability in the Arctic Ocean, EGU General Assembly 2024, Vienna, Austria, 14–19 Apr 2024, EGU24-3635, https://doi.org/10.5194/egusphere-egu24-3635, 2024.

EGU24-3752 | ECS | Posters on site | OS1.1

Latitudinal distribution of biomarkers across the western Arctic Ocean and the Bering Sea: an approach to assess sympagic and pelagic algal production 

Youcheng Bai, Marie-Alexandrine Sicre, Jian Ren, Vincent Klein, Haiyan Jin, and Jianfang Chen

The drastic decline of Arctic sea ice due to global warming and polar amplification of environmental changes in the Arctic basin profoundly alter primary production with consequences for polar ecosystems and the carbon cycle. In this study, we use highly branched isoprenoids (HBIs), brassicasterol, dinosterol and terrestrial biomarkers (n-alkanes and campesterol) in surface sediments to assess sympagic and pelagic algal production with changing sea-ice conditions along a latitudinal transect from the Bering Sea to the high latitudes of the western Arctic Ocean. Suspended particulate matter (SPM) was also collected in surface waters at several stations of the Chukchi Sea to provide snapshots of phytoplankton communities under various sea-ice conditions for comparison with underlying surface sediments. Our results show that sympagic production (IP25 and HBI-II) increased northward between 62°N and 73°N, with maximum values at the sea-ice edge in the Marginal Ice Zone (MIZ) between 70°N and 73°N in southeastern Chukchi Sea and along the coast of Alaska. They were consistently low at northern high latitudes (>73°N) under extensive summer sea-ice cover and in the Ice-Free Zone (IFZ) of the Bering Sea. Enhanced pelagic sterols and HBI-III occurred in the IFZ across the Bering Sea and in southeastern Chukchi Sea up to 70°N-73°N in the MIZ conditions that marks a shift of sympagic over pelagic production. In surface water SPM, pelagic sterols display similar patterns as Chl a, increasing southwards with higher amounts found in the Chukchi shelf pointing out the dominance of diatom production. Higher cholesterol values were found in the mid-Chukchi Sea shelf where phytosterols were also abundant. This compound prevailed over phytosterols in sediments, compared to SPM, reflecting efficient consumption of algal material in the water column by herbivorous zooplankton.

How to cite: Bai, Y., Sicre, M.-A., Ren, J., Klein, V., Jin, H., and Chen, J.: Latitudinal distribution of biomarkers across the western Arctic Ocean and the Bering Sea: an approach to assess sympagic and pelagic algal production, EGU General Assembly 2024, Vienna, Austria, 14–19 Apr 2024, EGU24-3752, https://doi.org/10.5194/egusphere-egu24-3752, 2024.

EGU24-3959 | ECS | Posters on site | OS1.1

Arctic Wintertime Sea Ice Lead Detection from Sentinel-1 SAR Images 

Shiyi Chen, Mohammed Shokr, Lu Zhang, Zhilun Zhang, Fengming Hui, Xiao Cheng, and Peng Qin

Leads in sea ice cover are almost linear fractures within the pack ice, and are commonly observed in the polar regions. In winter, leads promote energy flux from the underlying ocean to the atmosphere. Synthetic aperture radar (SAR) can monitor leads with a fine spatial resolution, regardless of solar illumination and atmospheric conditions. In this paper, we present an approach for automatic sea ice lead detection (SILDET) in the Arctic wintertime using Sentinel-1 SAR images. SILDET is made up of four modules: 1) a segmentation module; 2) a balance module; 3) an optimization module; and 4) a mask module. The validation results presented in this paper show that SILDET has the capability of detecting open and frozen leads at different stages of freezing. The lead map obtained from SILDET was compared to a lead dataset based on Moderate Resolution Imaging Spectroradiometer (MODIS) data and validated by the use of Sentinel-2 images. This shows that SILDET can provide a more detailed distribution of leads and better estimation of lead width and area. Compared with visual interpretation of Sentinel-1 images, the overall detection accuracy is 97.80% and the Kappa coefficient is 0.88 (for all types). The pyramid scene parsing network (PSPNet) in the segmentation module shows a better performance in detecting frozen leads, compared with the deep learning methods of UNet and DeepLabv3+. The optimization module utilizing shape features also improves the precision in detecting frozen leads. SILDET was applied to present the Arctic lead distribution in January and April 2023 with a spatial resolution of 40 m. The Arctic-wide lead width distribution follows a power law with an exponent of 1.64 ± 0.07. SILDET can be expected to provide long-term high-resolution lead distribution records.

How to cite: Chen, S., Shokr, M., Zhang, L., Zhang, Z., Hui, F., Cheng, X., and Qin, P.: Arctic Wintertime Sea Ice Lead Detection from Sentinel-1 SAR Images, EGU General Assembly 2024, Vienna, Austria, 14–19 Apr 2024, EGU24-3959, https://doi.org/10.5194/egusphere-egu24-3959, 2024.

EGU24-4291 | ECS | Orals | OS1.1

Arctic sea ice drift fields extraction based on feature tracking to MODIS imagery 

Yan Fang, Xue Wang, Gang Li, Zhuoqi Chen, Fengming Hui, and Xiao Cheng

Moderate-resolution optical imagery holds great potential in deriving Arctic sea ice drift fields because of its higher resolution than microwave radiometers and scatterometers, as well as its larger swath widths than most other optical and synthetic aperture radar (SAR) images. However, the application of such imagery is hindered by cloud influences and a lack of texture. In this study, we propose a method of deriving Arctic sea ice drift fields based on applying feature tracking to Moderate Resolution Imaging Spectroradiometer (MODIS) imagery. To enhance the quality of the feature tracking step, a bundle of digital image processing techniques is first introduced, including histogram equalization which is based on the Cumulative Distribution Function (CDF) of the sea ice area, and Laplacian filtering which enhances image texture. Various MODIS bands and A-KAZE parameter settings are subsequently compared to balance the quality of sea ice drifting fields and calculation efficiency. Three pairs of MODIS images observed in different zones of the Arctic Ocean are selected to evaluate the performance of the proposed method. International Arctic Buoy Programme (IABP) buoy data are employed for validating the derived drift vectors with MODIS imagery. The results show that our proposed method effectively increases the number of vectors and their coverage rates of the sea ice drift fields extracted with MODIS images. The coverage rates of sea ice drift fields in three regions increase from 4.8%, 2.3%, and 2.5% to 56.5%, 23.5%, and 53.0% compared to using the A-KAZE algorithm directly, respectively. The MAEs of the derived sea ice motion vectors are 707 m/d in speed and 6.4° in direction, superior to the sea ice drift products based on the Advanced Very High Resolution Radiometer (AVHRR) imagery. The proposed method enables MODIS and other medium-resolution optical data to be utilized in deriving Arctic sea ice drift fields, which is of great significance to the long-term and large-scale Arctic environment, climate, and oceanography research in the future. 

How to cite: Fang, Y., Wang, X., Li, G., Chen, Z., Hui, F., and Cheng, X.: Arctic sea ice drift fields extraction based on feature tracking to MODIS imagery, EGU General Assembly 2024, Vienna, Austria, 14–19 Apr 2024, EGU24-4291, https://doi.org/10.5194/egusphere-egu24-4291, 2024.

EGU24-6019 | ECS | Orals | OS1.1

Variability in the Arctic Ocean currents during 1990-2100 

Xiaoyan Wei, Chris Wilson, Sheldon Bacon, and Benjamin Barton

The Arctic Ocean is changing rapidly due to climate change, with significant impacts on subpolar ocean dynamics and mid-latitude regional weather. By utilizing a global, 1/12 degree, ocean sea-ice model (NEMO-SI3), which is forced at its surface by an Earth System Model, UKESM1.1, and simulates from 1981 to 2100 under scenario SSP3-7.0, we will demonstrate significant differences in the spatial structure and energy spectrum of Arctic Ocean currents among the past, the present, and the future. We will then explore the implications of changes in Arctic Ocean currents on mass transport pathways within the Arctic and transport across its boundaries. Subsequently, our study will identify the dominant physical drivers of these changes, such as sea ice melting, freshwater discharge, wind stresses, surface heat fluxes, and tides.

How to cite: Wei, X., Wilson, C., Bacon, S., and Barton, B.: Variability in the Arctic Ocean currents during 1990-2100, EGU General Assembly 2024, Vienna, Austria, 14–19 Apr 2024, EGU24-6019, https://doi.org/10.5194/egusphere-egu24-6019, 2024.

EGU24-6330 | Orals | OS1.1

Recent estimates of the sea ice volume and solid freshwater flux across the Arctic’s major export passageways 

Stephen Howell, David Babb, Jack Landy, and Mike Brady

Sea ice export from the Arctic Ocean is important to the ice mass balance and freshwater budget of the Arctic Ocean and the delivery of freshwater to the North Atlantic. Historically, estimates of the sea ice volume and solid freshwater flux across the Arctic’s major export passageways were temporally limited in terms of available ice thickness data together with low spatial resolution satellite derived sea ice motion data. However, observational advances now provide year-round estimates of ice thickness from CryoSat-2 and high spatiotemporal estimates of sea ice motion can be derived from Senitnel-1 and the RADARSAT Constellation Mission (RCM) synthetic aperture radar (SAR) satellites. In this presentation, we present the results of merging these datasets that provide new high-quality annual and monthly estimates of the sea ice volume flux across the Arctic’s major export passageways of Fram Strait, Nares Strait, Davis Strait and the Canadian Arctic Archipelago from 2016-2022. Over our study period, the annual average volume export at Fram Strait was 1586 km3 that agrees with its longer-term decline. The annual average volume export at Nares Strait and the Canadian Arctic Archipelago was 160 km3, and 43 km3, respectively that is in agreement with longer-term increases and indicates a divergent trajectory compared to Fram Strait. The annual average sea ice volume flux through Davis Strait was 816 km3, nearly double previous estimates. Annually, a total of 1912 km3 of solid freshwater was delivered to the North Atlantic from the passageways of Fram Strait and Davis Strait. Overall, our new high-quality estimates of these sea ice variables provide updated quantities for understanding recent changes in ice mass balance and freshwater budget of the Arctic Ocean and the freshwater balance of the North Atlantic, where overturning is critical to the global climate.

How to cite: Howell, S., Babb, D., Landy, J., and Brady, M.: Recent estimates of the sea ice volume and solid freshwater flux across the Arctic’s major export passageways, EGU General Assembly 2024, Vienna, Austria, 14–19 Apr 2024, EGU24-6330, https://doi.org/10.5194/egusphere-egu24-6330, 2024.

The surface Arctic Ocean is subject to rapidly changing freshwater inputs, from increasing ice melt and riverine inputs. Close monitoring of inflow waters from the Pacific and Atlantic is also needed for understanding the balance of geochemical cycles and making future predictions in the Arctic.  However, our knowledge of ocean biogeochemical data is very limited, necessitating an expansion of spatial and temporal coverage. However, the acquisition of ocean samples is hindered by the intricate sampling and analytical procedures employed both at sea and on land.

In our recent work [Hatta et al, 2021; 2023], a miniaturized, automated, microfluidic analyzer for nutrient analysis was developed using the programmable flow injection (pFI) technique.  This innovative system achieves accurate measurements with minimal reagent use, computer-controlled manipulations, and auto-calibration techniques, thus it is a promising oceanographic tool for increasing sample acquisition and determination, as well as minimizing human error.  For the pFI technique, the traditional silicate (Si) molybdenum blue method was modified by combining oxalate and ascorbic acid into a single reagent. This new method obtained a limit of detection of 514 nM Si, r.s.d. 2.1%, sampling frequency rate of 40 samples per hour, reagent consumption of 700 microliters per sample, and use of deionized (DI) water as a carrier solution. Phosphate (P) does not interfere significantly in this technique if the Si:P ratio is 4:1 or larger. Additionally, since there is no salinity influence, samples collected from the open ocean, coastal areas, or rivers can all be determined accurately using a DI water-based standard calibration covering a single small range by diluting samples to fall within this limited range.

In this contribution, this new shipboard method using programmable Flow Injection will be presented along with high-resolution Si data from the Chukchi shelf.  These data were obtained every 10-20 minutes by directly connecting the pFI platform to the underway water sampling system during the RV Mirai summer cruises. This new analytical platform will allow us to significantly expand our database and thus help to constrain and quantify geochemical processes and budgets in the Arctic Ocean.

How to cite: Hatta, M., Davis, M., and Measures, C.: Surface silicate distribution in the Chukchi-shelf region during the Arctic summer cruises using programmable flow injection technique, EGU General Assembly 2024, Vienna, Austria, 14–19 Apr 2024, EGU24-6998, https://doi.org/10.5194/egusphere-egu24-6998, 2024.

EGU24-7486 | Orals | OS1.1

Sea-ice lead dynamics in the Arctic Ocean and associated drivers 

Sascha Willmes, Günther Heinemann, and Michelle Rasic

Based on a novel sea-ice lead climatology derived from thermal-infrared satellite imagery we identify drivers of wintertime sea-ice dynamics in the Arctic Ocean. ERA-5 atmospheric reanalyses and large-scale sea-ice drift data are used to investigate the causes for prominent spatial patterns and for the inter-annual variability in the occurrence of sea-ice leads. We can show that large-scale atmospheric circulation patterns and the Arctic Oscillation determine where and to which extent leads form on weekly to monthly timescales. Events with strong lead openings can directly be associated with pronounced anomalies in wind divergence and sea-ice drift. We also show the dominant modes in the Arctic sea-ice lead variability and their relation to atmospheric circulation. Moreover, the role of ocean processes in shaping long-term spatial lead patterns in the Arctic Ocean is presented. Implications for sea-ice modelling, forecasts and future trends are discussed.

How to cite: Willmes, S., Heinemann, G., and Rasic, M.: Sea-ice lead dynamics in the Arctic Ocean and associated drivers, EGU General Assembly 2024, Vienna, Austria, 14–19 Apr 2024, EGU24-7486, https://doi.org/10.5194/egusphere-egu24-7486, 2024.

EGU24-8264 * | Orals | OS1.1 | Highlight

Still Arctic? - The changing Barents Sea 

Sebastian Gerland, Randi B. Ingvaldsen, Marit Reigstad, Arild Sundfjord, Bjarte Bogstad, Melissa Chierici, Tor Eldevik, Haakon Hop, Paul E. Renaud, Lars H. Smedsrud, Leif Christian Stige, and Marius Årthun

The Barents Sea is one of the Polar regions where current climate and ecosystem change is most pronounced. In a recent review (DOI: 10.1525/elementa.2022.00088) as a part of the cross-disciplinary Norwegian research project “The Nansen Legacy”, the current state of knowledge of the physical, chemical and biological systems in the Barents Sea is described. Here, we present some of the key findings from this review. Physical conditions in this area are characterized by large seasonal contrasts between partial sea-ice cover in winter and spring versus predominantly open water in summer and autumn. Observations over recent decades show that surface air and ocean temperatures have increased, sea-ice extent has decreased, ocean stratification has weakened, and water chemistry and ecosystem components have changed. In general changes can be described as “Atlantification” and “borealisation,” with a less “Arctic” appearance. In consequence, only the northern part of the Barents Sea can be still called “Arctic”. The temporal and spatial changes have a wider relevance reaching beyond the Barents Sea, such as in the context of large-scale climatic (air, water mass and sea-ice) transport processes. The observed changes also have socioeconomic consequences, such as for fisheries and other human activities. Recent Barents Sea mooring data shows stronger inflow of warm water from the north during winter, affecting the sea ice locally. “The Nansen Legacy” has significantly reduced Barents Sea observation- and knowledge gaps, especially for winter months when field observations and sample collections have been sparse until recent.

How to cite: Gerland, S., Ingvaldsen, R. B., Reigstad, M., Sundfjord, A., Bogstad, B., Chierici, M., Eldevik, T., Hop, H., Renaud, P. E., Smedsrud, L. H., Stige, L. C., and Årthun, M.: Still Arctic? - The changing Barents Sea, EGU General Assembly 2024, Vienna, Austria, 14–19 Apr 2024, EGU24-8264, https://doi.org/10.5194/egusphere-egu24-8264, 2024.

EGU24-8828 | Posters on site | OS1.1

Changes of mesoscale eddy activity in the Eurasian Basin from 1-km simulations 

Vasco Müller, Qiang Wang, Nikolay Koldunov, Sergey Danilov, Xinyue Li, Caili Liu, and Thomas Jung

Mesoscale eddies play a crucial role in shaping the dynamics of the Arctic Ocean, making them essential for understanding future Arctic changes and the ongoing 'Atlantification' of the region. In this study, we use simulations generated by the unstructured-mesh Finite volumE Sea ice-Ocean Model (FESOM2) with a 1-km horizontal resolution in the Arctic Ocean.

Our investigation includes multiple simulations, namely a seven-year run representing the present-day climate and a slice simulation for the end of the 21st century, representative for a 4°C warmer world. Through these simulations, we evaluate changes in Eddy Kinetic Energy (EKE) within the Eurasian Basin and analyze their correlation with factors like sea-ice cover, baroclinic conversion rate, and stratification. To deepen our understanding, we combine Eulerian properties like EKE and baroclinic conversion rate with Lagrangian properties obtained from an algorithm that automatically identifies and tracks eddies using vector geometry.

Our findings from the end-of-century slice simulation indicate a significant increase in Arctic eddy activity in the future, accompanied by retreating sea ice. The present-day simulation reveals that the seasonality of EKE is mainly influenced by changes in sea ice, with distinct drivers at different depth levels for monthly anomalies. The mixed layer shows a robust connection to sea ice variability, while deeper levels, protected by stratification, are more significantly influenced by baroclinic conversion.

How to cite: Müller, V., Wang, Q., Koldunov, N., Danilov, S., Li, X., Liu, C., and Jung, T.: Changes of mesoscale eddy activity in the Eurasian Basin from 1-km simulations, EGU General Assembly 2024, Vienna, Austria, 14–19 Apr 2024, EGU24-8828, https://doi.org/10.5194/egusphere-egu24-8828, 2024.

EGU24-9183 | ECS | Orals | OS1.1 | Highlight

Thin Ice, Large Impact: Temporal and spatial trends of Arctic thermodynamic and dynamic sea ice thickness change 

Luisa von Albedyll and Robert Ricker

The Arctic Ocean's transition from perennial sea ice to more ice-free summers has halved sea ice thickness in the last six decades, significantly impacting the Arctic climate and ecosystem. Recent trends show a slowing in ice thickness and volume decline, prompting a need to investigate the underlying seasonal and long-term feedback mechanisms of sea ice thickness change. To do so, we use a Lagrangian drift-aware sea ice thickness product (DA-SIT), combined with extensive data on thermodynamic growth conditions and sea ice deformation, to quantify thermodynamic and dynamic thickness change in selected Arctic regions. A key focus is the Multidisciplinary Drifting Observatory for the Study of Arctic Climate (MOSAiC) expedition, which provided regional-scale analysis of seasonal sea ice thickness change using airborne ice thickness measurements, sea ice deformation, and in-situ snow and thermodynamic growth data. Our study extends these findings to larger temporal and spatial scales, evaluating their pan-Arctic applicability using long-term satellite datasets. We compare the MOSAiC trajectory with different dynamic regimes and ask how representative the conditions were for the “old” and the “new” Arctic. This analysis is key to understanding future sea ice thickness change, which is of great relevance for many climate and ecosystem processes.

How to cite: von Albedyll, L. and Ricker, R.: Thin Ice, Large Impact: Temporal and spatial trends of Arctic thermodynamic and dynamic sea ice thickness change, EGU General Assembly 2024, Vienna, Austria, 14–19 Apr 2024, EGU24-9183, https://doi.org/10.5194/egusphere-egu24-9183, 2024.

EGU24-9293 | Posters on site | OS1.1

Analyzing Mesoscale Eddy Impact on the West Spitsbergen Current in the Fram Strait 

Hwa Chien, Yen-Chen Chen, Huang-Meng Chang, Ke-Hsien Fu, and Bo-Shian Wang

Accelerated melting of Arctic sea ice, a consequence of global warming, is being exacerbated by increased freshwater inputs. This has led to a significant reduction in the halocline layer within the Fram Strait, enhancing ocean stratification and creating a feedback loop that further accelerates sea ice loss. This process is critical for the formation of North Atlantic Deep Water (NADW), where the West Spitsbergen Current (WSC) plays an essential role in recirculation.

Our study delves into the characteristics and influences of mesoscale eddies in the Fram Strait, particularly focusing on their impact on the WSC recirculation and NADW formation. Conducted over three years (2021-2023) during the months of minimal sea ice cover (August to October), the research involved deploying 36 specialized surface mini buoys across the strait. Analytical methods such as horizontal dispersion coefficients, finite-size Lyapunov exponents (FSLE), Lagrangian eddy identification, and sea surface temperature (SST) e-folding time were employed to assess WSC surface dynamics, eddy activities, and air-sea heat exchange.

Notably, we observed WSC bifurcation and intense mesoscale seawater mixing in the southwest Yermak Plateau and east of Molloy Deep (MD), areas marked by a rise in SST e-folding scale time gradient and considerable heat loss to the atmosphere (approximately 120 W/m²). Surface water convergence and sinking were detected near the western side of Molloy Deep and the Hovgaard (HG) regions, coinciding with high vorticity zones. Analysis of the buoy trajectories identified 682 eddy samples, forming the basis for a statistical examination of their size, period, intensity, and cyclonic features. This analysis was complemented by correlating eddy trajectories with sea surface height anomaly (SSHA) data, showing notable alignment.

Our results reveal a predominance of anticyclonic eddies in the Fram Strait, accounting for nearly 65% of the total eddies. Further, a consistency analysis between these eddies and wind stress curl indicated that about 66% of the anticyclonic eddies in the Molloy Deep region correlate with wind stress curl patterns, suggesting wind influence in their formation

How to cite: Chien, H., Chen, Y.-C., Chang, H.-M., Fu, K.-H., and Wang, B.-S.: Analyzing Mesoscale Eddy Impact on the West Spitsbergen Current in the Fram Strait, EGU General Assembly 2024, Vienna, Austria, 14–19 Apr 2024, EGU24-9293, https://doi.org/10.5194/egusphere-egu24-9293, 2024.

EGU24-9304 | ECS | Orals | OS1.1

Distribution and characteristics of subsurface eddies in the Aleutian Basin, Bering Sea 

Kun Zhang, Haibin Song, and Linghan Meng

The subarctic Bering Sea, situated between the Pacific Ocean and Arctic Ocean, stands as one of the world's most productive oceanic regions. While the role of oceanic eddies in material transport and energy transfer has been extensively studied, surface eddies have dominated these investigations owing to advancements in remote sensing technology. Recently, attention has shifted to subsurface eddies for their influence on enhancing oceanic mixing. However, challenges persist in delineating the distribution and characteristics of subsurface eddies in the Bering Sea due to the limited effectiveness of satellite methods and the scarcity of field observation.

Multichannel seismic (MCS) data can provide high-resolution acoustic images of subsurface thermohaline fine structures, known as seismic oceanography. In this study, we integrate MCS with concurrent vessel-mounted Acoustic Doppler Current Profiles (vmADCP), expendable bathythermograph (XBT), and expendable Conductivity Temperature Depth (XCTD) data collected during cruise MGL1111, along with Argo and Copernicus Marine Service Global Ocean Physics Reanalysis data to investigate the distribution and characteristics of subsurface eddies in the Aleutian Basin.

The results underscore the presence of 44 subsurface eddies in the Aleutian Basin, primarily submesoscale with diameters averaging around 20 km. Eddy thickness spans 71.14 - 416.57 m, with eddy core depths ranging from 69.96 - 657.24 m, predominantly concentrated in the 100 - 200 m depth range; only 5 eddies exhibit core depths below 300 m. The cumulative volume of these eddies reaches approximately 434.38 × 10⁹ m3, with the majority exhibiting anticyclonic characteristics, as corroborated by concurrent ADCP data. Analysis of historical CTD data, along with concurrent XBT and XCTD data from cruise MGL1111, delineates distinct water masses—Bering Sea Upper Water (BUW), Bering Sea Intermediate Water (BIW), and Bering Sea Deep Water (BDW)—in the study area. Most identified eddies are characterized as cold core, facilitating the transport of BIW. Trajectory assessments, incorporating concurrent Argo and Copernicus Marine Service Global Ocean Physics Reanalysis data, suggest an eastern and southern origin for these eddies, predominantly propagating westward. Assuming a propagating velocity of 1 cm/s, the estimated total transport of these eddies is approximately 1.76 Sv.

We believe that these findings will contribute essential insights to the fields of marine ecology, and climate studies, enhancing our knowledge of ocean dynamics in this critical region.

How to cite: Zhang, K., Song, H., and Meng, L.: Distribution and characteristics of subsurface eddies in the Aleutian Basin, Bering Sea, EGU General Assembly 2024, Vienna, Austria, 14–19 Apr 2024, EGU24-9304, https://doi.org/10.5194/egusphere-egu24-9304, 2024.

EGU24-9400 | ECS | Posters on site | OS1.1

Spatial and temporal distribution of all Arctic Polynyas since 1979 

Hau Man Wong, Céline Heuzé, Luisa Ickes, and Lu Zhou

Polynyas, open water regions within the sea ice cover, have been observed by satellites intermittently in the Arctic region over the past few decades. Their formation is complex, requiring various drivers to precondition and trigger the opening, which then influences local and regional weather significantly. Therefore, understanding Arctic polynyas’ spatial and temporal distribution is crucial to studying the polynyas’ impacts on climate. To date, most research is local and short-term, focusing on the major active Arctic polynyas or specific events; there is a need for pan-Arctic, long-term studies of all polynyas. Here, we use all available sea ice satellite data products to investigate all Arctic polynya events since 1979, in particular their locations for each day. The location preciseness and robustness are examined by sensitivity tests, varying the sea ice concentration (20 – 40%) and thickness (10 – 30 cm) thresholds. In the meantime, polynyas’ daily area extent, event duration, and recurrence are also obtained. The results indicate that the Franz-Josef Land, Eastern Kara Sea, and Nares Strait are the most active polynya formation-prone regions during wintertime. In addition, there is an increasing trend of polynya formation across the observation period. In future work, we plan to use the retrieved locations to determine whether thermodynamics or dynamic forcings contribute most to the Arctic polynyas’ opening.

How to cite: Wong, H. M., Heuzé, C., Ickes, L., and Zhou, L.: Spatial and temporal distribution of all Arctic Polynyas since 1979, EGU General Assembly 2024, Vienna, Austria, 14–19 Apr 2024, EGU24-9400, https://doi.org/10.5194/egusphere-egu24-9400, 2024.

EGU24-10445 | ECS | Posters on site | OS1.1

Temporal and spatial variability of the oceanic front between the Atlantic Water and adjacent water masses north of Svalbard 

Stian Vikanes, Frank Nilsen, and Ragnheid Skogseth

The inflow of warm Atlantic Water (AW) into the Arctic Ocean is controlled by
oceanic fronts and air-ocean interactions north of Svalbard. The warm AW has
a significant impact on the sea ice extent and marine ecosystems in the region.
Therefore, it is crucial to understand the variability of the oceanic fronts offshore and
onshore of the AW, including their temporal and spatial characteristics, as well as
the mechanisms that govern them, such as atmospheric forcing, frontal instabilities,
and advection. However, our current understanding of the variability of these fronts
and AW north of Svalbard is limited due to lack of observational data. In this study,
we will use historical and more recent hydrographic data to analyze and describe
surface and subsurface fronts, both offshore and onshore of the AW core, in terms of
their dominant water masses along the continental slope north of Svalbard. We will
also determine the strength and position of these fronts by examining the horizontal
gradients in temperature, salinity, and density, and connect it to known changes in
the wind forcing.

How to cite: Vikanes, S., Nilsen, F., and Skogseth, R.: Temporal and spatial variability of the oceanic front between the Atlantic Water and adjacent water masses north of Svalbard, EGU General Assembly 2024, Vienna, Austria, 14–19 Apr 2024, EGU24-10445, https://doi.org/10.5194/egusphere-egu24-10445, 2024.

The polar sea ice cover exhibits narrow bands of increased deformation, resulting in the formation of leads and pressure ridges. They are referred to as linear kinematic features (LKFs). They are important features of the sea ice field as they directly influence the heat and momentum exchange between ocean and atmosphere. By doing so, they influence the development of not only the sea ice cover but also the ocean and the local climate. Conversely, LKFs are also influenced by climate changes as the sea ice cover will be affected by changes in atmospheric and ocean temperature. In this work, the LKFs in the Arctic sea ice cover in current climate are compared to those in a warmer world. An LKF detection and tracking algorithm will be used to create a climate change signal. For this, the number of LKFs as well as their lifetimes are taken into account. The data analyzed in this work is created by the ocean-sea ice model FESOM. As LKFs are highly localized features, using a high spatial resolution is crucial. The resolution used in the analyzed runs is 1km. They span over five years starting at 2010, 2050, and 2090.

How to cite: Gärtner, J.: Detecting Linear Kinematic Features in Arctic Sea Ice in a Warmer World Using High Resolution Model Output, EGU General Assembly 2024, Vienna, Austria, 14–19 Apr 2024, EGU24-10598, https://doi.org/10.5194/egusphere-egu24-10598, 2024.

EGU24-11226 | Posters on site | OS1.1

Weak signals of dense shelf water cascading in 2020 during a persisting phase of sporadic Atlantic water intrusions into the deep layer of the SW-Svalbard slope 

Patrizia Giordano, Manuel Bensi, Vedrana Kovacevic, Aniello Russo, and Leonardo Langone

The intensifying influence of warmer Atlantic Ocean waters in the Arctic, known as Arctic Atlantification, amplifies climate change effects by accelerating sea ice melting and altering ecosystems. Long-term data series are indispensable for discerning nuances in climate changes, especially when occurring in the deep ocean. They also provide a crucial temporal foundation for accurate modeling, useful to predict future scenarios and formulate effective strategies to address the challenges of climate change.

Here, we present oceanographic data collected from June 2014 to June 2023 at mooring site S1 (76°N, 14°E, 1040 m water depth), above the continental slope on the southwestern margin of Svalbard Archipelago (Fram Strait). There, the main branch of the West Spitsbergen Current transports Atlantic Water (in the upper layer) and Norwegian Sea Deep Water (below 900 m depth) poleward into the Arctic Ocean. Site S1 strategically lies at the convergence of Atlantic waters, the Arctic Ocean heat source, with waters from Storfjorden (Spitsbergen largest fjord) and shelf waters from the West Spitsbergen continental shelf. The oceanographic mooring S1 is part of the SIOS marine infrastructure network (Svalbard Integrated Arctic Earth Observing System, https://sios-svalbard.org/), and has undergone progressive instrument improvement over time, adding data collection at the intermediate layer since the summer 2022.

We focus on exploring short-term and seasonal variations in thermohaline properties, ocean currents, and particulate fluxes recorded in the deep layer over the last nine years. This analysis is undertaken in conjunction with meteorological conditions and trends in sea ice concentration. Oceanographic mooring data together with repeated Conductivity-Temperature-Depth (CTD) casts during summer surveys, show that the period 2014-2021 was characterized by the absence of dense shelf water exported at the near bottom on the slope, probably due to a limited production of dense water in the fjords, while the wind-induced vertical mixing and the resulting internal oscillations were probably favoured. During this period, a gradual decline in sea ice cover in winter is observed in the S1 area and adjacent fjords. The only exception is the winter 2020, when the sea ice extent returned apparently to pre-2013 levels, and at 1000m depth there were weak signals of cascading of dense shelf water, probably originated in the Storfjorden polynya.

Contrary to what is clearly evident in the literature regarding the increasing propagation of Atlantic waters northwards, temperature and salinity at mooring S1 showed no, or very little, positive trends over the investigated period. However, sporadic intrusions of relatively warm and saline water into the deep layer were observed. These occur most frequently in winter and are associated with the passage of internal waves that promote turbulent mixing of intermediate Atlantic waters with deep waters, facilitating the heat diffusion into the ocean depths.

How to cite: Giordano, P., Bensi, M., Kovacevic, V., Russo, A., and Langone, L.: Weak signals of dense shelf water cascading in 2020 during a persisting phase of sporadic Atlantic water intrusions into the deep layer of the SW-Svalbard slope, EGU General Assembly 2024, Vienna, Austria, 14–19 Apr 2024, EGU24-11226, https://doi.org/10.5194/egusphere-egu24-11226, 2024.

EGU24-11917 | Orals | OS1.1 | Highlight

Atlantic Water warming increases melt below Northeast Greenland's last floating ice tongue 

Claudia Wekerle, Rebecca McPherson, Wilken-Jon von Appen, Qiang Wang, Ralph Timmermann, Patrick Scholz, Sergey Danilov, and Torsten Kanzow

Rising sea level poses a significant challenge and threat to our societies, given that coastal regions are densely populated. The Greenland ice sheet has been a major contributor to global sea level rise in the last decades, particularly its marine-terminating glaciers and their extensions into the ocean. The 79 North Glacier (79NG) features Greenland's largest floating ice tongue, stretching over 80 km in length in a 20 km wide fjord. The 79NG and its neighboring glacier, the Zachariæ Isstrøm, drain the Northeast Greenland Ice Stream which covers 12% of the Greenland Ice Sheet area. Its complete melt would lead to a 1.1-m global sea level rise. Though the extent of the 79NG has not changed significantly in recent years, observations have indicated a major thinning of its ice tongue from below.  Both ocean warming and an increase in subglacial discharge from the ice sheet induced by atmospheric warming could increase the basal melt; however, available observations alone cannot tell which of these is the main driver.

In this study, we present a setup of the Finite-volumE Sea ice-Ocean Model (FESOM2.1) which explicitly resolves the ocean circulation in the cavity of the 79NG with 700 m resolution. With this novel methodology, we seamlessly connect the global and regional ocean circulation to the circulation in the cavity. Our simulation with realistic bathymetry and ice shelf geometry covers the period 1970-2021, allowing us to disentangle the drivers of the upward trend and interannual variability of basal melt. We find that ocean warming in the subsurface Atlantic Intermediate Water layer that enters the cavity below the 79NG has played a dominant role in the basal melt rate over the past 50 years. The temperature variability can be traced back across the continental shelf of Northeast Greenland to the eastern Fram Strait with a lag of 3 years, implying a predictability of the basal melt of the 79NG. In contrast, subglacial discharge has a relatively small contribution to the interannual variation of the basal melt.

How to cite: Wekerle, C., McPherson, R., von Appen, W.-J., Wang, Q., Timmermann, R., Scholz, P., Danilov, S., and Kanzow, T.: Atlantic Water warming increases melt below Northeast Greenland's last floating ice tongue, EGU General Assembly 2024, Vienna, Austria, 14–19 Apr 2024, EGU24-11917, https://doi.org/10.5194/egusphere-egu24-11917, 2024.

EGU24-12163 | ECS | Orals | OS1.1

Atlantification at the gateway of the Arctic Ocean over the last thousand years 

Francesco De Rovere, Angelo Rubino, and Davide Zanchettin

Atlantification is a major process driving rapid changes in the Arctic Ocean, e.g., sea-ice loss, warming and
salinification of the near-surface, enhanced mixing and changes in the ecosystem structure. The recent
scientific literature highlights the importance of the transport of Atlantic water as a cause of Atlantification,
but fundamental climatic processes driving this phenomenon are far from being fully understood.
Moreover, most studies focused on the analysis of recent observational data covering the last decades,
while recent studies showed that Atlantification had started in the 19th century.


In this contribution, we illustrate scope and progress of the Italian funded project “ATTRACTION: Atlantification dRiven by polAr-subpolar ConnecTIONs in a changing climate”. The project aims to provide a historical perspective on Atlantification by integrating observational evidence over the last decades, paleo-reconstructions and numerical paleoclimate simulations covering the past several centuries. We assess the capability of available tools to robustly describe coupled dynamics at the gateway of the Arctic Ocean (Fram Strait and Barents Sea), and their variations over multi-centennial periods. Furthermore, we provide a solid past reference for attribution of the ongoing Atlantification and discuss how paleoclimate simulations could support the identification of key locations for proxy-based reconstruction of the Atlantification. Toward a mechanistic understanding of Atlantification-like events over the last millennium, our assessment focus on the role of heat and salt redistribution by sub-polar dynamics by its major controls, including the Atlantic Multidecadal Overturning Circulation, the Sub-Polar Gyre and the Greenland Sea Gyre.

How to cite: De Rovere, F., Rubino, A., and Zanchettin, D.: Atlantification at the gateway of the Arctic Ocean over the last thousand years, EGU General Assembly 2024, Vienna, Austria, 14–19 Apr 2024, EGU24-12163, https://doi.org/10.5194/egusphere-egu24-12163, 2024.

EGU24-12174 | ECS | Posters on site | OS1.1

Feasibility of using C-band Synthetic Aperture Radar datasets for long term (1991-present) sea ice monitoring: towards multi-decadal analysis of sea ice type changes in the Atlantic sector of the Arctic Ocean 

Wenkai Guo, Anthony Paul Doulgeris, Johannes Lohse, Malin Johansson, Polona Itkin, Torbjorn Eltoft, Jack Landy, and Shiming Xu

We present a feasibility assessment of using several publicly available C-band wide-swath SAR datasets to derive sea ice type maps in the Atlantic sector of the Arctic Ocean from 1991 to present. This region is characterized by highly variable and dynamic sea ice conditions, and temporally consistent, large-scale monitoring of sea ice parameters is only possible through satellite remote sensing. We use data from C-band sensors including Sentinel-1, RADARSAT-2, Envisat ASAR and ERS-1/2, which have similar central frequencies and spatial resolution, to cover the study period. We evaluate comparative image classification performances and classification consistency using these datasets with common training datasets in geographically and temporally overlapping scenes and a sea ice classifier correcting for per-class incidence angle (IA) effects. Through this evaluation, we demonstrate the differences in these datasets affecting sea ice classification and the feasibility of using legacy sensors including Envisat ASAR and ERS-1/2 to extend the time series of sea ice type maps back to 1991 in our study area. This study provides theoretical support for the establishment of a multi-decadal SAR-based sea ice type product, which will contribute to the assessment of seasonal and inter-annual sea ice variations, especially the variability in new ice formation, which strongly influences physical and biogeochemical processes across the ocean-ice-atmosphere interface. This study is part of the collaborative project INTERAAC (air-snow-ice-ocean INTERactions transforming Atlantic Arctic Climate) between Norway and China, which aims at generating a reconciled multi-mission Climate Data Record (CDR) for Atlantic Arctic sea ice.

How to cite: Guo, W., Doulgeris, A. P., Lohse, J., Johansson, M., Itkin, P., Eltoft, T., Landy, J., and Xu, S.: Feasibility of using C-band Synthetic Aperture Radar datasets for long term (1991-present) sea ice monitoring: towards multi-decadal analysis of sea ice type changes in the Atlantic sector of the Arctic Ocean, EGU General Assembly 2024, Vienna, Austria, 14–19 Apr 2024, EGU24-12174, https://doi.org/10.5194/egusphere-egu24-12174, 2024.

In this study, we investigate the interannual variability of the sea ice area (SIA) in the Barents-Kara Sea (BKS) region. We explore the contributing factors to this variability, primarily focusing on oceanic influences evident in the Barents Sea Opening (BSO). The BSO, characterized by eastward warm Atlantic Water (AW) inflow, plays a crucial role in shaping the BKS SIA. While the inflow has been extensively studied, the westward-directed outflow known as Bear Island Slope Current (BISC), remains insufficiently observed. Being fed by relatively warm recirculating modified AW (mAW), the BISCs impact on the overall ocean heat transport (OHT) variability is uncertain.


Utilizing the global Finite Volume Sea Ice and Ocean Model (FESOM2.1), we derive estimates of the interannual volume transport and temperature variability of the BISC, filling the observational gap. We find that whereas the variability of BSO inflow/BISC volume transport is similar in magnitude, the temperature variability of the BISC exceeds the BSO inflow temperature variability. By linking the simulated BISC variability to BKS SIA, our findings reveal a yet unknown, strong co-variation between the volume transport of the BISC and the BKS SIA at the end of the freezing season, with a short lead time of zero to three months. We thus further examine the role of the BISC in generating interannual anomalies in the BKS SIA. Our model simulations illustrate that the volume transport of the BISC can be modified by the emergence of a secondary mAW recirculation downstream the northern AW path through the BS in the months preceding anomalously large BKS SIA. This secondary mAW recirculation is thereby increasing the volume transport of mAW leaving the BS via the BISC, reducing the amount of AW reaching the northern Barents Sea ice edge downstream. Additionally, we identify a connection between the atmospheric forcing pattern associated with the volume transport variability of the BISC and anomalous sea ice advection into the BKS as a second cause for the BISC volume transport/BKS SIA co-variability.

In general, our study emphasizes the co-variability between BKS SIA and the BISC. We highlight the role of the mAW recirculations in altering the amount of AW, and consequently ocean heat, reaching the ice edge in the northwestern Barents Sea.

How to cite: Heukamp, F. and Wekerle, C.: Variability of the Barents-Kara Sea Sea Ice Area and its Correlation with Atlantic Water Recirculation through the Barents Sea Opening, EGU General Assembly 2024, Vienna, Austria, 14–19 Apr 2024, EGU24-12688, https://doi.org/10.5194/egusphere-egu24-12688, 2024.

EGU24-13067 | Orals | OS1.1 | Highlight

Intra- and interannual variability in the Atlantic Water inflow region north of Svalbard: sea ice, hydrography, nutrients and the potential for primary production 

Angelika Renner, Arild Sundfjord, Marit Reigstad, Allison Bailey, Øyvind Lundesgaard, Randi Ingvaldsen, Melissa Chierici, Elizabeth Jones, and Agnieszka Beszczynska-Möller

Atlantic Water (AW) is the major source of heat and nutrients to the Arctic Ocean. Changing AW inflow promotes sea ice decline and borealisation of marine ecosystems and affects primary production in the Eurasian Arctic. North of Svalbard, the AW inflow dominates oceanographic conditions along the shelf break and hence the distribution of heat and nutrients in the region. However, interaction with sea ice and Polar Surface Water determines nutrient supply to the euphotic layer. Using a combination of multidisciplinary approaches such as ship-based measurements and sampling, moored sensors, remote sensing and numerical modelling, we have been monitoring and studying the AW boundary current north of Svalbard since 2012. In this presentation, I will show some of our findings with particular focus on repeated measurements from a transect across the AW inflow at 31°E, 81.5°N. Large interannual variability in hydrography, nutrients and chl a indicates varying levels of nutrient drawdown by primary producers over summer. Sea ice conditions impact surface stratification, light availability, and wind-driven mixing, with a strong potential for steering chl a concentration over the productive season. In early winter, nutrient re-supply through vertical mixing varied in efficiency, again related to sea ice conditions. The autumn re-supply elevated nutrient concentrations sufficiently for primary production but likely happened too late as high-latitude light levels limited potential autumn blooms. Multidisciplinary observations are key to gain insight into the interplay between physical, chemical, and biological drivers and to understand ongoing and future changes. They are particularly important in regions like north of Svalbard that can indicate what we can expect in the central Arctic Ocean in the future.

How to cite: Renner, A., Sundfjord, A., Reigstad, M., Bailey, A., Lundesgaard, Ø., Ingvaldsen, R., Chierici, M., Jones, E., and Beszczynska-Möller, A.: Intra- and interannual variability in the Atlantic Water inflow region north of Svalbard: sea ice, hydrography, nutrients and the potential for primary production, EGU General Assembly 2024, Vienna, Austria, 14–19 Apr 2024, EGU24-13067, https://doi.org/10.5194/egusphere-egu24-13067, 2024.

EGU24-13914 | ECS | Orals | OS1.1

Sea Ice Drift Retrieval based on Fengyun-3D Multi-Sensor Data 

Xue Wang, Zhuoqi Chen, Zhizhuo Xu, Ruirui Wang, Ran Lu, Fengming Hui, and Xiao Cheng

Under the background of global warming, sea ice changes rapidly. Sea ice drift is an important indicator for sea ice flux, atmospheric and ocean circulation, and ship navigation. Currently, the large-scale observed sea ice drift datasets are mainly obtained based on single-sensor remotely sensed data, which suffer low spatial resolution or poor spatial continuity. Considering that passive microwave radiometer and medium-resolution optical sensor complement each other in terms of spatial resolution and continuity, this study proposed a novel sea ice drift retrieval method based on Fengyun-3D (FY-3D) multi-sensor data. The proposed method is summarized as follows. First, low resolution sea ice drift fields were obtained from FY-3D Microwave Radiation Imager (MWRI) data based on the normalized cross-correlation pattern-matching method. Then, fine resolution vectors were extracted from FY-3D Medium-Resolution Spectral Imager (MERSI) data based on A-KAZE feature-tracking method. Finally, the low resolution pattern-matching vectors and fine resolution feature-tracking vectors were merged together based on Co-Kriging algorithm to obtain the final sea ice drift result. The proposed method was evaluated by comparing the buoy displacements obtained from the International Arctic Buoy Program (IABP) with the retrieved merged vectors from FY-3D remotely sensed images collected in the Beaufort Sea, the East Siberian Sea, and the Fram Strait on 2020. The results showed that the proposed method can retrieve accurate, fine resolution and spatial continuous sea ice motion fields.

How to cite: Wang, X., Chen, Z., Xu, Z., Wang, R., Lu, R., Hui, F., and Cheng, X.: Sea Ice Drift Retrieval based on Fengyun-3D Multi-Sensor Data, EGU General Assembly 2024, Vienna, Austria, 14–19 Apr 2024, EGU24-13914, https://doi.org/10.5194/egusphere-egu24-13914, 2024.

EGU24-14215 | ECS | Posters on site | OS1.1

Potential of diatoms in sediments as seeds for autumn blooms in the Pacific Arctic shelf 

Yuri Fukai, Amane Fujiwara, Shigeto Nishino, Kohei Matsuno, and Koji Suzuki

The Pacific gateway to the Arctic has a vast continental shelf spanning the northern Bering and the Chukchi Seas. Within this shelf region, diatoms are crucial in sustaining high primary production and facilitating the sinking particulate organic carbon flux from spring to summer. Consequently, the bottom sediments have abundant viable diatoms, including resting stages. Despite the importance of diatoms, our understanding of the dynamics of this organism in sediments and their capacity to initiate primary production in the Pacific Arctic shelf remains limited.

In this study, we delved into the photophysiological capabilities of diatoms in the surface sediments collected from the Chukchi Sea in autumn through a laboratory incubation experiment at 3°C under the light conditions of 300 or 30 µmol photons m-2 s-1 for seven days. This experiment revealed that diatoms, mainly Chaetoceros, quickly resumed photosynthesis after light exposure and reached the maximum photosynthetic carbon fixation rates within only several days. These results suggest that diatoms in sediments have a significant potential to function as “seeds” for bloom formation in the sunlit water column. We further examined diatom communities, including resting spores, in the water column of the Chukchi Sea during autumn using scanning electron microscopy (SEM) and DNA metabarcoding techniques, as well as environmental parameters. Consequently, intense winds and subsequent water turbulence in the shallow Chukchi caused the predominance of Chaetoceros resting spores, probably derived from the sediments, in the diatom assemblages. As speculated from the incubation experiment mentioned above, diatom resting spores from the sediments can germinate immediately in the water column. Thus, settled diatoms could work as seeds for subsequent autumn blooms by being supplied from the seafloor along with nutrient-rich water.

The recent delayed sea ice formation in the autumn Arctic leads to increased storm occurrence over open water and enhanced vertical mixing, resulting in more frequent autumn blooms. Therefore, diatoms in sediments could be one of the critical contributors to autumn blooms in the shallow Pacific Arctic.

How to cite: Fukai, Y., Fujiwara, A., Nishino, S., Matsuno, K., and Suzuki, K.: Potential of diatoms in sediments as seeds for autumn blooms in the Pacific Arctic shelf, EGU General Assembly 2024, Vienna, Austria, 14–19 Apr 2024, EGU24-14215, https://doi.org/10.5194/egusphere-egu24-14215, 2024.

EGU24-14505 | ECS | Posters on site | OS1.1

Winter to summer evolution of pCO2 in surface water of northern Greenland fjords  

Camille Akhoudas, Christian Stranne, Karl Adam Ulfsbo, Brett Thornton, and Martin Jakobsson

Ocean acidification induced by the absorption of anthropogenic CO2 and its consequences pose a potential threat to marine ecosystems around the globe. The Arctic Ocean, particularly vulnerable to acidification, provides an ideal region to investigate the progression and impacts of acidification before they manifest globally. Recent documentation of undersaturated surface waters in carbonate minerals in the Sherard Osborn fjord in northwest Greenland, a region visited for the first time in summer 2019, reveals inherent variability in biogeochemical processes. Associated with highly acidic surface waters, the partial pressure of CO2 (pCO2) was undersaturated relative to the atmosphere, indicating this study area as a CO2 sink. To comprehend variations in pCO2 in the northwest Greenland fjords and identify its drivers, we conducted a comparative study between two fjords in the region (Petermann and Sherard Osborn fjords) and used carbonate system data from the temperature minimum layer to examine the winter-to-summer evolution of pCO2 and influencing factors. Additionally, we evaluated pCO2 variations (δpCO2) concerning temperature, freshwater inputs, biological activity, and air-sea CO2 uptake to quantitatively assess the seasonal influencing factors on surface ocean pCO2. In the Sherard Osborn fjord, despite a substantial increase in surface temperature from winter to summer potentially increasing pCO2 and causing CO2 supersaturation relative to the atmosphere, freshwater inflow and biological activity reduced pCO2, resulting in CO2 undersaturation relative to the atmosphere. In the Petermann fjord, pCO2 remained lower than atmospheric levels due to a slight seasonal variation in surface temperature and significant biological activity, reducing pCO2 in surface water.

How to cite: Akhoudas, C., Stranne, C., Ulfsbo, K. A., Thornton, B., and Jakobsson, M.: Winter to summer evolution of pCO2 in surface water of northern Greenland fjords , EGU General Assembly 2024, Vienna, Austria, 14–19 Apr 2024, EGU24-14505, https://doi.org/10.5194/egusphere-egu24-14505, 2024.

EGU24-15778 | Orals | OS1.1

Genesis and Decay of Baroclinic Eddies in the Seasonally Ice-Covered Arctic Ocean 

Gianluca Meneghello, John Marshall, Camille Lique, Pål Erik Isachsen, Edward Doddridge, Jean-Michel Campin, Heather Regan, and Claude Talandier

We explore the origin and evolution of mesoscale eddies in the seasonally ice-covered interior Arctic Ocean. Observations of ocean currents show a curious, and hitherto unexplained, vertical and temporal distribution of mesoscale activity. A marked seasonal cycle is found close to the surface: strong eddy activity during summer, observed from both satellites and moorings, is followed by very quiet winters. In contrast, subsurface eddies persist all year long within the deeper halocline and below.

We find that the surface seasonal cycle is controlled by friction with sea ice, dissipating existing eddies and preventing the growth of new ones. In contrast, subsurface eddies, enabled by interior potential vorticity gradients and shielded by a strong stratification at a depth of approximately 50 m, can grow independently of the presence of sea ice. 

We address possible implications for the transport of water masses between the margins and the interior of the Arctic basin, and for climate models’ ability to capture the fundamental difference in mesoscale activity between ice-covered and ice-free regions.

How to cite: Meneghello, G., Marshall, J., Lique, C., Isachsen, P. E., Doddridge, E., Campin, J.-M., Regan, H., and Talandier, C.: Genesis and Decay of Baroclinic Eddies in the Seasonally Ice-Covered Arctic Ocean, EGU General Assembly 2024, Vienna, Austria, 14–19 Apr 2024, EGU24-15778, https://doi.org/10.5194/egusphere-egu24-15778, 2024.

EGU24-16897 | Orals | OS1.1

Assessing changes in winter sea ice deformation – from MOSAiC to the Fram Strait 

Polona Itkin and Dmitry Divine

During winter, sea ice is moving in cohesive clusters of ice plates. These clusters – hereafter named ‘Coherent Dynamic Elements’ (CDE) are composed of several areas of deformed and level ice, that slide coherently along active sea ice fractures. The largest sea ice fractures detectable from medium resolution Synthetic Aperture Radar (SAR) satellites (about 50 m spatial resolution) are the Linear Kinematic Features (LKFs). Sea ice deformation information can be estimated from the strain rates in the LKFs and as well from the geometrical characteristics of the CDEs. However, there is a sudden seasonal transition, at the point where the sea ice warms and loses its internal strength. After this transition the delineation of LKFs and CDEs from SAR becomes challenging. In this contribution we will analyze sea ice deformation during the drift of the MOSAiC expedition from October 2019 to July 2020. During this time, the expedition drifted the entire length of the Transpolar drift from the northern Laptev Sea into the Fram Strait and the sea ice surrounding it underwent numerous deformation events. The MOSAiC sea ice deformation data and the onset of the melt period is compared to the data over the Fram Strait, where the sea ice deformation can was estimated from SAR and upward looking sonar devices on fixed moorings for the period of 2010-2023. We will present the data on the changes in the onset of the melt period and show that MOSAiC year was a typical year representative for the sea ice deformation of the recent decade.

How to cite: Itkin, P. and Divine, D.: Assessing changes in winter sea ice deformation – from MOSAiC to the Fram Strait, EGU General Assembly 2024, Vienna, Austria, 14–19 Apr 2024, EGU24-16897, https://doi.org/10.5194/egusphere-egu24-16897, 2024.

EGU24-17166 | ECS | Orals | OS1.1

The Northeast Water Polynya, Greenland; Climatology, Atmospheric Forcing and Ocean Response 

Miriam Bennett, Ian Renfrew, David Stevens, and Kent Moore

The Northeast Water Polynya is a significant annually recurring summertime Arctic polynya, located off the coast of Northeast Greenland. It is important for marine wildlife and affects local atmospheric and oceanic processes. In this study, over 40 years of observational and reanalysis products (ERA5 and ORAS5) are analysed to characterise the polynya's climatology and ascertain forcing mechanisms. The Northeast Water Polynya has high spatiotemporal variability; its location, size and structure vary interannually, and the period for which it is open is changing. We show this variability is largely driven by atmospheric forcing. The polynya extent is determined by the direction of the near-surface flow regime, and the relative locations of high and low sea-level pressure centers over the region. The surface conditions also impact the oceanic water column, which has a strong seasonal cycle in potential temperature and salinity, the amplitude of which decreases with depth. The ocean reanalyses also show a significant warming trend at all depths and a freshening near the surface consistent with greater ice melt, but salinification at lower depths (~ 200 m). As the Arctic region changes due to anthropogenic forcing, the sea-ice edge is migrating northwards and the Northeast Water Polynya is generally opening earlier and closing later in the year. This could have significant implications for both the atmosphere and ocean in this complex and rapidly changing environment.

How to cite: Bennett, M., Renfrew, I., Stevens, D., and Moore, K.: The Northeast Water Polynya, Greenland; Climatology, Atmospheric Forcing and Ocean Response, EGU General Assembly 2024, Vienna, Austria, 14–19 Apr 2024, EGU24-17166, https://doi.org/10.5194/egusphere-egu24-17166, 2024.

EGU24-18118 | Posters on site | OS1.1

Arctic Ocean simulations in two high-resolution coupled climate models 

Chuncheng Guo, Mats Bentsen, Aleksi Nummelin, Mehmet Ilicak, Alok Gupta, and Andreas Klocker

Large model spread and biases exist in simulating the Arctic Ocean water mass and circulations from the latest CMIP6 coupled and ocean-sea ice-only simulations. This can be at least partly attributed to large uncertainties due to unresolved key processes in this region, and it is hoped that high resolution can - to a certain extent - come to the rescue.

In this work, we first examined two high-resolution simulations by two CMIP6-class models: 1) a multi-centennial integration of CESM (CESM-HR; ocean resolution 1/10-deg), and 2) a 50-year integration of NorESM (NorESM-MX; ocean resolution 1/8-deg). The two models show clear signs of improvements in simulating the Arctic Ocean compared to their standard 1-deg resolution counterparts, but certain biases remain, such as the incorrect pathway of the Atlantic Water and the too-deep mixed layer depth in NorESM-MX.

We then performed and analysed a similar NorESM-MX simulation, but this time with a newly developed hybrid vertical coordinate (z-density) in the ocean model (the default is isopycnal/density coordinate). ​​Experience from hybrid coordinate testing runs in standard 1-deg resolution shows e.g. much-improved water masses and sea ice extent in the Southern Ocean, mixed layer depths, and importantly more rapid equilibration to energy balance in coupled simulations. When applied in the high-resolution NorESM-MX configuration, the results with the new coordinate show a much-improved representation of the pathway of Atlantic water and the distribution of mixed layer depth in the Arctic Ocean. 

How to cite: Guo, C., Bentsen, M., Nummelin, A., Ilicak, M., Gupta, A., and Klocker, A.: Arctic Ocean simulations in two high-resolution coupled climate models, EGU General Assembly 2024, Vienna, Austria, 14–19 Apr 2024, EGU24-18118, https://doi.org/10.5194/egusphere-egu24-18118, 2024.

EGU24-18702 | ECS | Posters on site | OS1.1

Observation of temporal and spatial variability of deep near-inertial waves in the western Arctic Ocean 

Chanhyung Jeon, Samuel Boury, Kyoung-Ho Cho, Eun-Joo Lee, Jae-Hun Park, and Thomas Peacock

Near‐inertial waves are waves propagating in the interior of the ocean. Created by surface storms, they have the potential to influence the ocean environment by inducing vertical mixing. Compared to other oceans, the Arctic Ocean has low near-inertial wave activity, but might be changing. It is a challenge, however, to predict near-inertial wave activity in the Arctic Ocean due to its intricate vertical salinity and temperature stratification. Our in-situ campaign has obtained the first direct deep current measurements revealing notable temporal and spatial variability of deep near-inertial waves in the western Arctic Ocean. These observations are an important step towards a clearer depiction of the evolving energy budget, and concomitant mixing, associated with potentially high impact near-inertial wave activity in an increasingly ice-free Arctic Ocean.

How to cite: Jeon, C., Boury, S., Cho, K.-H., Lee, E.-J., Park, J.-H., and Peacock, T.: Observation of temporal and spatial variability of deep near-inertial waves in the western Arctic Ocean, EGU General Assembly 2024, Vienna, Austria, 14–19 Apr 2024, EGU24-18702, https://doi.org/10.5194/egusphere-egu24-18702, 2024.

EGU24-18990 | Posters on site | OS1.1

Extreme sea ice motion -- analysis of ice drifter buoy data in the Gulf of Bothnia  

Henri Vuollekoski, Mikko Lensu, and Jari Haapala

Sea ice and particularly its motion are problematic for vessels and structures in water areas that experience sea ice. For example, several offshore wind farms are planned to be installed in the Gulf of Bothnia, but uncertainty related to extreme sea ice motion is likely to worry potential investors. Winter navigation, particularly in the coastal boundary zone, can be difficult. While climate change is likely to decrease the average ice concentration, extrema may become more severe. 

The motion of sea ice is affected by wind, currents and internal dynamics of the ice field, which are highly complex and inadequately understood. In this study we analyze time-series of data from ice drifter buoys deployed in the Gulf of Bothnia, Baltic Sea, during 2012 - 2023. The combination of data from multiple buoys, ice charts as well as other observations and model forecasts on the atmosphere-sea-ice interaction allows for estimating various parameters for the respective ice fields, such as shear, divergence and deformation, as well as temporal and spatial variability.

How to cite: Vuollekoski, H., Lensu, M., and Haapala, J.: Extreme sea ice motion -- analysis of ice drifter buoy data in the Gulf of Bothnia , EGU General Assembly 2024, Vienna, Austria, 14–19 Apr 2024, EGU24-18990, https://doi.org/10.5194/egusphere-egu24-18990, 2024.

Currently freshwater anomaly is building up in the Beaufort gyre of the Arctic Ocean. There is a risk that this freshwater may discharge into the North Atlantic, disrupting the Atlantic Meridional Overturing Circulation (AMOC). Recent changes in Beaufort gyre size and circulation suggest this may occur soon or has already started: the North Atlantic has recently experienced its largest freshening for the last 120 years. In contrast, so far there is only limited evidence of Arctic fresh water impacting freshwater accumulation in the Labrador Sea. The North Atlantic is a region of high variability on interannual to decadal timescales, potentially affecting European and global climates.

The study focuses on changes in oceanic transports through the Arctic gateways under the Carbon Dioxide Removal (CDR) es-SSP5-3.4-ov CMIP6 emission–driven scenario 2015-2100 and analyses UKESM1 simulations. We examine historical and projected periods and compare the model results to the long-term observations in the key Arctic straits. The difference between the present-day and future model transports is in their partitioning between Fram Strait: in the future most of the Atlantic model inflow occurs via the Barents Sea (5.2 Sv northwards); model 2000-2020s and 2040-2090s Fram Strait transports are 2.4 Sv and 4.6 Sv southwards. It is worth noting that the observed Fram Strait volume transport estimates bear a large uncertainty, from 2.0±2.7 Sv southwards from moorings to 1.1±1.2 Sv from inverse modelling and 0.8 ±1.5 Sv from geostrophic analysis.

The model results show that during the increase of CO2 in the 2040s–2060s, the Beaufort Gyre is getting stronger, whereas the North Atlantic Subpolar Gyre (SPG) weakens. At the carbon dioxide removal phase (2060s–2090s) the Beaufort Gyre is strengthened while SPG weakened further. However, the cyclonic gyres in the Nordic Seas (Greenland, Iceland and Norwegian) become stronger. This points to a potential future change in the oceanic pathways between the Arctic and the North Atlantic. The corresponding heat transports due to overturning and gyres present different trends in the North Atlantic and the Arctic Ocean and different reversibility at latitudes between 26°N and 80°N, suggesting loss of immediate oceanic connectivity between the Atlantic and the Arctic via Nordic Seas. The simulations show a hysteresis in the AMOC: AMOC does not recover to the same level as before the mitigation even if the atmospheric CO2 concentration does.

Acknowledgement: We acknowledge funding from the EC Horizon Europe project OptimESM “Optimal High Resolution Earth System Models for Exploring Future Climate Changes”, grant 101081193 and UKRI grant 10039429, from the project EPOC “Explaining and Predicting the Ocean Conveyer”, EU grant 101059547 and UKRI grant 10038003, as well as from NERC highlight topics 2023 project “Interacting ice Sheet and Ocean Tipping - Indicators, Processes, Impacts and Challenges (ISOTIPIC)”. For the EU projects the work reflects only the authors’ view; the European Commission and their executive agency are not responsible for any use that may be made of the information the work contains.

How to cite: Aksenov, Y. and Rynders, S.: Transports through the Arctic gateways linked to the ocean gyres in the Carbon Dioxide removal (CDR) CMIP6 simulations, EGU General Assembly 2024, Vienna, Austria, 14–19 Apr 2024, EGU24-19583, https://doi.org/10.5194/egusphere-egu24-19583, 2024.

EGU24-19973 | ECS | Posters on site | OS1.1

Exploring links between Mixed-Layer depth and Sea Ice concentration variability in the Greenland Sea. 

Sonia Domingo, Joan Mateu Horrach, Alfredo Izquierdo, and Ángel Rodriguez

The Greenland Sea is a key player in the Atlantic Meridional Overturning Circulation (AMOC), crucial for forming dense waters through open-water convection and influencing global climate dynamics. Recent changes, such as decreasing sea ice concentration (SIC) and the shoaling of the mixed layer depth (MLD), have spurred detailed research into their impact on the AMOC. Our study, using the latest TOPAZ reanalysis, explores these changes from 1991 to 2021.

To strengthen our findings, we meticulously compare a 10-year observational dataset, validating TOPAZ's ability to reproduce processes like dense water formation and MLD evolution in the Greenland Sea. We find notable agreement, with the MLD reaching intermediate depths, and TOPAZ's overflow water density aligning with observations. Results show a decrease in SIC and a shallowing of the MLD, linked to rising surface water temperatures.

While our results indicate a similar trend, we're not ready to draw final conclusions. Further analysis is needed to understand how observational data compares to TOPAZ findings. Although reanalysis data provides valuable insights, it's crucial to validate everything with observational data. The comprehensive dataset and almost daily temporal resolution of our observational platforms significantly bolster the reliability of our conclusions.

Understanding Greenland Sea variability is vital not only for decoding its role in the AMOC but also for grasping broader implications for the global climate system. By highlighting the intricate relationship between SIC, MLD, temperature, and salinity, our research contributes to the ongoing dialogue on climate change dynamics.


How to cite: Domingo, S., Horrach, J. M., Izquierdo, A., and Rodriguez, Á.: Exploring links between Mixed-Layer depth and Sea Ice concentration variability in the Greenland Sea., EGU General Assembly 2024, Vienna, Austria, 14–19 Apr 2024, EGU24-19973, https://doi.org/10.5194/egusphere-egu24-19973, 2024.

EGU24-20222 | ECS | Orals | OS1.1

Surface Controls of Freshwater Export through Denmark Strait  

Emma Boland, Yavor Kostov, and Dani Jones

Denmark Strait is a key route for the export of freshwater from the Arctic. Understanding the controls on the amount of freshwater entering the Subpolar North Atlantic is key for understanding the implications of rapid changes in the region, such as recent observed freshening of the Arctic Ocean. We present the results of an adjoint modelling study, which uses the ECCOv4 ocean state estimate to produce a reconstruction of the freshwater transport at Denmark Strait from 1992 to 2017. The reconstruction is formed of contributions from surface fluxes of buoyancy and momentum. We investigate the relative importance of these different contributions on different spatial and temporal scales. We find that surface wind stress at up to 2 years lag dominates variability. We also find a seasonally varying pattern in the dominant lags, with winter fluxes showing peak correlations with contributions from lags of up to 4 years, whereas spring fluxes showing a peak correlations on the scale of weeks.

How to cite: Boland, E., Kostov, Y., and Jones, D.: Surface Controls of Freshwater Export through Denmark Strait , EGU General Assembly 2024, Vienna, Austria, 14–19 Apr 2024, EGU24-20222, https://doi.org/10.5194/egusphere-egu24-20222, 2024.

EGU24-20285 | Orals | OS1.1

Export of Greenland Sea Water across the Mohn Ridge as Measured by a Mooring during 2016–2018 

Jinping Zhao, Xusiyang Shen, and Tore Hattermann

Cold and dense water from the Greenland Sea, which has been found in the Lofoten Basin in the Norwegian Sea, is an important contributor to the Greenland–Scotland Ridge overflow, which feeds the deep and bottom waters in the North Atlantic. These two basins are divided by the Mohn Ridge, but there is no clear current connecting them. The aim of this study is to investigate how the Greenland Sea water enters the Lofoten Basin. We deployed a mooring on the western flank of the Mohn Ridge to measure the potential transport across the ridge during two periods: 2016/17 and 2017/18. The observation results indicate that the water above 1500 m in the Greenland Sea can be intermittently transported to the Lofoten Basin. In addition, we observed periods of flow reversal, which indicate bidirectional exchange between the two basins across the ridge. Our data from three consecutive seasons indicate that such inflows in August–September are a typical feature of the exchange across the Mohn Ridge. Net exports during these two periods into the Lofoten Basin were eltimated to be 5.86 Sv and 3.00 Sv, exhibiting noticeable interannual variations. We propose two possible mechanisms that could be driving the export. One is due to passing cyclones, which lower the sea level height along the Mohn Ridge and drive outflow. The second is due to the sudden weakening of the wind in summer, which results in outflow from the Greenland Sea through temporary geostrophic deviation.

How to cite: Zhao, J., Shen, X., and Hattermann, T.: Export of Greenland Sea Water across the Mohn Ridge as Measured by a Mooring during 2016–2018, EGU General Assembly 2024, Vienna, Austria, 14–19 Apr 2024, EGU24-20285, https://doi.org/10.5194/egusphere-egu24-20285, 2024.

EGU24-20571 | Posters on site | OS1.1

A New Sea Ice Type Concentration Retrieval Algorithm from Microwave Remote Sensing Data 

Yufang Ye, Yanbing Luo, Mohammed Shokr, Zhuoqi Chen, and Xiao Cheng

Sea ice types, e.g., first-year ice (FYI) and multi-year ice (MYI), can be discriminated based on their radiometric and scattering signatures. However, changes in ice surfaces caused by factors such as ice deformation and melt-refreeze events can lead to extensive ice type misclassification. To solve this problem, a new sea ice type concentration (SITC) algorithm from microwave observations (SITCAM) is proposed in this study. It builds upon a previous algorithm, namely ECICE, but improves from two perspectives. Firstly, a new cost function is employed, with weights indicating the separation efficiencies of microwave parameters. Secondly, a pre-classification scheme is incorporated to account for the bimodal distributions in microwave characteristics. With SITCAM, daily Arctic SITCs are retrieved for the winters of 2002–2011 using passive (AMSR-E) and active (QuikSCAT and ASCAT) microwave data. The results are compared with a sea ice age product (SIA) and evaluated with ice type samples and SAR images. Overall, SITCAM performs well on mitigating the misclassifications induced by the aforementioned factors. The Arctic MYI area agrees well with that from SIA. Compared to ECICE, the retrieval accuracy for MYI and FYI samples increases to 96% and 90%, respectively (increasing by 5% and 15%, respectively), in SITCAM. The bias in MYI concentration between the SITC retrievals and SAR-based results has reduced from 15% to 4%. Furthermore, instead of being limited to specific observations (e.g., Ku-band scatterometer data), SITCAM performs well with various combinations of microwave data, even solely passive microwave data. This universality allows for a long-term record of SITC, which enables the potential of dating SITC back to late 1970s.

How to cite: Ye, Y., Luo, Y., Shokr, M., Chen, Z., and Cheng, X.: A New Sea Ice Type Concentration Retrieval Algorithm from Microwave Remote Sensing Data, EGU General Assembly 2024, Vienna, Austria, 14–19 Apr 2024, EGU24-20571, https://doi.org/10.5194/egusphere-egu24-20571, 2024.

EGU24-1253 | ECS | Orals | OS1.2

AMOC weakening and its association with increased dynamic sea level in recent decades  

Emmanuel Eresanya, Gerard McCarthy, Jennifer MecKing, He Yinghui, and Adekunle Osinowo

The Atlantic Meridional Overturning Circulation (AMOC) is a crucial mechanism of poleward heat transport in the ocean and climate system. It modulates the redistribution of heat and carbon in the northern hemisphere. The state of AMOC in recent decades has revealed a slowdown compared to the industrial era. Its state is linked to a number of physical factors, including sea level. Along the eastern seaboard of North America, on long timescales, the imprint of the AMOC is projected onto sea level patterns. The relationship between AMOC weakening and sea level is not clearly understood. This study investigates the state of the AMOC in recent decades and its link to the regional sea level using CMIP6 and RAPID datasets.

One of the most critical questions in ocean science is whether climate models and observations of the state of the AMOC in recent decades are consistent. If these datasets show significant differences, it could lead to a bias in our projected long-term climate knowledge. This study shows the potential of sea level data to inform the evolution of the AMOC to constrain and improve future projections.

How to cite: Eresanya, E., McCarthy, G., MecKing, J., Yinghui, H., and Osinowo, A.: AMOC weakening and its association with increased dynamic sea level in recent decades , EGU General Assembly 2024, Vienna, Austria, 14–19 Apr 2024, EGU24-1253, https://doi.org/10.5194/egusphere-egu24-1253, 2024.

Ocean reanalyses covering many decades, including those with few observations, are needed to understand climate variability and to initialize and assess interannual to decadal climate predictions. The Met Office Statistical Ocean Re-Analysis (MOSORA) exploits long-range covariances to generate full-depth reanalyses of monthly ocean temperature and salinity even from sparse observations. The latest version of MOSORA presented here is for the first time an ensemble that samples uncertainties in these long-range covariances. The ensemble is created by using initial covariances from different perturbed-physics historical model runs and these are then improved with observations using an iterative process.

We demonstrate that covariances are mostly improved by iteration, and that this procedure, using very sparse observations typical of the 1960s, captures many features of analyses benefiting from modern observation density. We investigate the ensemble spread and find that salinity trends in the covariances from model runs can introduce unexpected changes in the reanalyses. In the Gulf of Guinea, there are insufficient observations to constrain the model covariances, which vary due to different model representations of Antarctic Intermediate Water. If models are improved in this region, this could lead to a better analysis of temperature and salinity.

We nudge the reanalyses into an ensemble of coupled climate models to produce estimates of the Atlantic Meridional Overturning Circulation (AMOC) back to 1960. At 26°N, the AMOC shows decadal variability consistent with observations at this latitude and shows signs of strengthening in recent years. The ensemble spread in AMOC reconstructions at this latitude increases with time as more observations interact with uncertain covariances. More observations should be able to better constrain these covariances.

At 45°N, the amount of decadal variability in the AMOC varies between members. The uncertainty of our reconstruction at this latitude varies through time partly related to the number of observations made on the western boundary, just off the Grand Banks of Newfoundland. This shows potential for targeted and sustained observations to constrain the transport into the North Atlantic subpolar gyre.

How to cite: Hermanson, L., Dunstone, N., Eade, R., and Smith, D.: An ensemble reconstruction of ocean temperature, salinity, and the Atlantic Meridional Overturning Circulation 1960–2021, EGU General Assembly 2024, Vienna, Austria, 14–19 Apr 2024, EGU24-2037, https://doi.org/10.5194/egusphere-egu24-2037, 2024.

EGU24-2054 | Posters on site | OS1.2

Multidecadal Variability of Ocean Climate and Circulation of the North Atlantic Ocean 

Alexey Mishonov, Dan Seidov, and James Reagan

The North Atlantic's surface has been heating up for decades. There was concern that the thermohaline circulation and essential climate variables, such as the seawater temperature and salinity, could endure substantial changes in response to this surface warming. The Atlantic Meridional Overturning Circulation (AMOC) has changed noticeably over the last century and possibly slowed down in recent decades. Therefore, concerns about the trajectory of the North Atlantic Ocean climate are warranted. The key to understanding the North Atlantic current climate trajectory is to identify how the decadal climate responds to ongoing surface warming.  We address this issue using objectively analyzed in-situ data from the World Ocean Atlas covering 1955-2017 and from the Simple Ocean Data Assimilation reanalysis data for 1980-2019 as fingerprints of the North Atlantic three-dimensional circulation and AMOC’s dynamics. We have found that although the entire North Atlantic is systematically warming, the climate trajectories in different sub-regions of the North Atlantic reveal diverse regional decadal variability, although the thermohaline geostrophic circulation in the North Atlantic during the most recent decade has slowed down. The warming trends in the subpolar North Atlantic lag behind the subtropical gyre and Nordic Seas warming by at least a decade. The climate and circulation in the North Atlantic remained steady from 1955 to 1994, while the last two decades (1995-2017) demonstrated a noticeable reduction in AMOC strength, which may be closely linked to changes in the geometry and strength of the Gulf Stream system.

How to cite: Mishonov, A., Seidov, D., and Reagan, J.: Multidecadal Variability of Ocean Climate and Circulation of the North Atlantic Ocean, EGU General Assembly 2024, Vienna, Austria, 14–19 Apr 2024, EGU24-2054, https://doi.org/10.5194/egusphere-egu24-2054, 2024.

EGU24-2104 | ECS | Orals | OS1.2

Recalibration of extreme multi-decadal trends in the North Atlantic Oscillation. 

Rosemary Eade, David B. Stephenson, Adam A. Scaife, and Doug M. Smith

The historical variability of the winter mean North Atlantic Oscillation (NAO) has featured periods with large multi-decadal trends which are not well represented by coupled general circulation models (CGCMs), consistent with a lack of autocorrelation in the winter mean NAO index series. Post-processing “reddening” methods are proposed, using stochastic model theory to make the autocorrelation structure of the CGCM NAO index match that of the observed NAO. Using CGCMs from the Coupled Model Intercomparison Project Phase 6 (CMIP6), these recalibration methods are shown to successfully improve the autocorrelation structure of the NAO and in turn the simulation of extreme trends. The 1963-1993 NAO trend is the maximum 31-year trend in the historical period, but without reddening the CGCMs underestimate the likelihood of this trend by a factor of ten.


CMIP6 future projections show a small systematic increase in long-term (2024-2094) NAO ensemble mean trends relative to the magnitude of the radiative forcing from ‑0.09 to 0.16 hPa/decade (range for low to high radiative forcing scenarios). This range is doubled after reddening, becoming ‑0.24 to 0.35 hPa/decade. There is also a related shift in the distribution of extreme 31-year NAO trends, which is more clearly apparent after reddening. Near-term projections of the next 31 years (2024-2054) are less sensitive to the future scenario. After reddening they still show weak-to-no forced trend in the models but have a 74% larger ensemble range (around +/- 1 standard deviation per decade). This level of internal variability could increase or decrease regional climate change signals in the Northern Hemisphere by magnitudes that are greatly underestimated when using raw climate model output.

How to cite: Eade, R., Stephenson, D. B., Scaife, A. A., and Smith, D. M.: Recalibration of extreme multi-decadal trends in the North Atlantic Oscillation., EGU General Assembly 2024, Vienna, Austria, 14–19 Apr 2024, EGU24-2104, https://doi.org/10.5194/egusphere-egu24-2104, 2024.

EGU24-2646 | ECS | Orals | OS1.2

On the Formation and Maintenance of the Interannual Variability of the North Atlantic Oscillation 

Yang Yang, X. San Liang, and Wei-Bang He

Motivated by the observation that the interannual variability of the North Atlantic Oscillation (NAO) is associated with the ensemble emergence of individual NAO events occurring on the intraseasonal time scale, one naturally wonders how the intraseasonal processes cause the interannual variability, and what the dynamics are underlying the multiscale interaction. Using a novel time-dependent and spatially localized multiscale energetics formalism, this study investigates the dynamical sources for the NAO events with different phases and interannual regimes. For the positive-phase events (NAO+), the intraseasonal-scale kinetic energy (K1) over the North Atlantic sector is significantly enhanced for NAO+ occurring in the negative NAO winter regime (NW), compared to those in the positive winter regime (PW). It is caused by the enhanced inverse cascading from synoptic transients and reduced energy dispersion during the life cycle of NAO+ in NW. For the negative-phase events (NAO), K1 is significantly larger during the early and decay stages of NAO in NW than that in PW, whereas the reverse occurs in the peak stage. Inverse cascading and baroclinic energy conversion are primary drivers in the formation of the excessive K1 during the early stage of NAO in NW, whereas only the latter contributes to the larger K1 during the decay stage of NAO in NW compared to that in PW. The barotropic transfer from the mean flow, inverse cascading and baroclinic energy conversion are all responsible for the strengthened K1 in the peak stage of NAO in PW.

How to cite: Yang, Y., Liang, X. S., and He, W.-B.: On the Formation and Maintenance of the Interannual Variability of the North Atlantic Oscillation, EGU General Assembly 2024, Vienna, Austria, 14–19 Apr 2024, EGU24-2646, https://doi.org/10.5194/egusphere-egu24-2646, 2024.

EGU24-2686 | ECS | Posters on site | OS1.2

Deep Atlantic Multidecadal Variability 

Jiajun Yang, Jianping Li, and Qirong An

Investigating deep‐sea temperature variability is essential for understanding deep‐sea variability and its profound impacts on climate. The first mode in the Atlantic is referred to as Deep Atlantic Multidecadal Variability (DAMV), characterized by a north‐south dipole pattern in the mid‐high latitudes with a quasi‐period of 20‐50 years. The DAMV and Atlantic Multidecadal Variability, despite a statistical discrepancy, may be different responses to ocean heat transport (OHT) driven by the Atlantic Meridional Overturning Circulation (AMOC) at distinct depths separately. The relationship between the DAMV and the AMOC is established, indicating the AMOC is likely to transport surface heat downwards by deep convection and contribute to such dipole pattern in the deep Atlantic. Furthermore, meridional OHT proves the AMOC can explain the DAMV variation as a dynamic driver. These results reinforce the importance of deep‐sea studies concerning the Atlantic climate system.

How to cite: Yang, J., Li, J., and An, Q.: Deep Atlantic Multidecadal Variability, EGU General Assembly 2024, Vienna, Austria, 14–19 Apr 2024, EGU24-2686, https://doi.org/10.5194/egusphere-egu24-2686, 2024.

A new thermodynamic potential of seawater is found with the temperature variable being Conservative Temperature.  From this thermodynamic potential all the thermodynamic variables of seawater can be calculated.  This thermodynamic potential adds to the two other thermodynamic potentials, the Gibbs function and the Helmholtz function, which have been known for more than a century.  Because of the advantages of using Conservative Temperature instead of in situ temperature, it is expected that the new thermodynamic potential will replace the Gibbs function in oceanography.  The new thermodynamic potential can be expressed as the sum of two parts, one depending on enthalpy and the other on entropy, and it is shown that there is a clean separation between the thermodynamic properties such as specific volume and sound speed that depend only on enthalpy, and those that depend also on enthalpy such as in situ temperature. 

How to cite: McDougall, T.: The new thermodynamic potential of seawater in terms of Conservative Temperature , EGU General Assembly 2024, Vienna, Austria, 14–19 Apr 2024, EGU24-2756, https://doi.org/10.5194/egusphere-egu24-2756, 2024.

Our recent research underscores the pivotal roles of the Tibetan Plateau and Antarctica in the development of the Atlantic Meridional Overturning Circulation (AMOC). This study rigorously investigates how these two regions collectively influence the AMOC, using coupled model’s sensitive experiments that sequentially introduce the Tibetan Plateau followed by Antarctica (TP2AT), and then in the reverse order (AT2TP). The rise of the Tibetan Plateau markedly alters atmospheric moisture transport patterns in the Northern Hemisphere, leading to a fresher North Pacific and a saltier North Atlantic. This change is the key to shifting deep-water formation from the North Pacific to the North Atlantic, thereby initiating the AMOC. Antarctica’s contribution is primarily linked to its impact on the strength and position of atmospheric westerlies over the high latitudes of the Southern Hemisphere, which strengthens the AMOC by enhancing Ekman upwelling and Agulhas leakage in the Southern Ocean. The synergistic effect of the Tibetan Plateau and Antarctica is instrumental in forming the contemporary pattern of the AMOC. The TP2AT scenario is more effective in establishing the AMOC compared to AT2TP. In the latter scenario, a strong Pacific Meridional Overturning Circulation (PMOC) exists before the introduction of the Tibetan Plateau. The rise of the Tibetan Plateau must first terminate the PMOC before initiating the AMOC.

How to cite: Tong, M., An, F., and Yang, H.: The Dominant Role of the Tibetan Plateau and the Antarctic in Establishing the Atlantic Meridional Overturning Circulation, EGU General Assembly 2024, Vienna, Austria, 14–19 Apr 2024, EGU24-3019, https://doi.org/10.5194/egusphere-egu24-3019, 2024.

EGU24-3216 | Orals | OS1.2

Florida Current: four decades of steady state at 27°N 

Denis Volkov, Ryan Smith, Rigoberto Garcia, Molly Baringer, William Johns, Benjamin Moat, and David Smeed

The Florida Current (FC) provides the majority of the northward volume and heat transports for both the meridional overturning and the horizontal gyre circulations in the subtropical North Atlantic. A unique, sustained observing system in the Florida Straits at about 27°N, consisting of voltage measurements recorded from a submarine telecommunication cable installed between Florida and Grand Bahama Island, paired with regular calibration and validation cruises, was established in 1982. Since then, the recorded cable voltage time series has enabled over 40 years of quasi-continuous, daily estimates of the FC volume transport. The cable data constitutes the longest observational record of any boundary current and a key component of the Atlantic Meridional Overturning Circulation (AMOC) in existence. By this measure, it can be representative of the AMOC weakening, suggested by climate models and proxy-based reconstructions.

Here, we reassess the record-long change in the FC strength by revising the processing of voltages measured on the submarine cable. With the increased length of the cable record, we show that it has become necessary to account for the secular change in the Earth’s geomagnetic field, especially when studying processes on decadal and longer time scales. We calculate the corrected estimates of the FC volume transport and show that (i) the FC strength has not declined as reported recently, but has remained remarkably stable since 1982, and (ii) with the corrected FC record, the AMOC at ~26.5°N exhibits a decadal-scale variability rather than a long-term decline.

The results of this study indicate that, if climate models are correct that the AMOC is slowing or will soon slow down, this slowdown has not yet been reflected in the FC, or the observational record is still too short to detect it with confidence. The existing records are just starting to resolve decadal-scale signals relevant to climate variability. Continued observations are thus necessary for detection and mechanistic understanding of climate-related changes and for validating and improving ocean and climate models.

How to cite: Volkov, D., Smith, R., Garcia, R., Baringer, M., Johns, W., Moat, B., and Smeed, D.: Florida Current: four decades of steady state at 27°N, EGU General Assembly 2024, Vienna, Austria, 14–19 Apr 2024, EGU24-3216, https://doi.org/10.5194/egusphere-egu24-3216, 2024.

EGU24-3406 | Orals | OS1.2

Summer fresh layers and winter mixed layers in the western Subpolar Gyre 

Femke de Jong and Nora Fried

The strength of the Atlantic Meridional Overturning Circulation has been tied to deep convection in the subpolar North Atlantic. The depth of convection in winter, and the density of its product, depends on the balance between the water column stratification at the end of summer and the buoyancy removed through cooling in winter. As climate change progresses, ocean stratification is expected to increase as a result of warming and increasing fluxes of freshwater from the Arctic and Greenland, which in turn may weaken convection. Recently, a large freshwater anomaly has been seen to go round the Subpolar Gyre and has been speculated to increase stratification to the point where it inhibited convection in the Irminger Sea in 2019. However, less is known about near surface salinity in other years.

Both the extent of the upper ocean summer fresh layer and the winter mixed layers are investigated using Argo profiles and gridded salinity products. Particularly the westernmost basins of the North Atlantic Subpolar Gyre are characterized by a strong seasonal cycle in near surface salinity. Fresh layers of around 50 m depth form over spring and summer and are diluted through mixing with deeper, more saline waters in winter. Larger fresh anomalies are seen in recent years, but Argo profiles show that this upper ocean freshwater can still be mixed over the water column if winter cooling is strong enough. This diminishes the fresh signal in amplitude, while spreading it over a much thicker layer. In the Labrador Sea and south of Greenland this can be seen in mixed layers over 1000 m deep, but even in the Irminger Sea fresh mixed layers down to 800 m were recorded in the winter of 2021-2022. Concomitantly, the western Subpolar Gyre has exhibited a freshening of the upper to intermediate water column that may partly be related to this spreading of freshwater over the water column. Documenting the strength and variability of the near surface summer fresh layer, and the extent to which it can be incorporated into winter mixed layers or not, will help project how deep convection may transition to a less frequent or weaker state in the future.

How to cite: de Jong, F. and Fried, N.: Summer fresh layers and winter mixed layers in the western Subpolar Gyre, EGU General Assembly 2024, Vienna, Austria, 14–19 Apr 2024, EGU24-3406, https://doi.org/10.5194/egusphere-egu24-3406, 2024.

We use Voluntary Observing Ship (VOS) observations available form the ICOADS collection for estimating surface fluxes in the North Atlantic for the period from 1900-2022. One problem of the use of VOS observations for deriving long-term air-sea flux time series is associated with inhomogeneous in space and time sampling, especially during the period prior WW2. Another problem is associated with systematic biases in a number of VOS state variables (first of all cloud cover) for the first part of 20th century. To derive surface flux anomalies we first reconstruct turbulent heat fluxes from 1900 onwards for the whole North Atlantic from EQ to 70 N. To homogenize sampling density and obtaine more robust estimates we use the procedure of sub-sampling for the earlier decades and then integrate computed turbulent heat fluxes in the coordinates of steering parameters (vertical surface temperature and humidity gradients on one hand and wind speed on the other). Biases in cloud cover are associated with changes in the observational practices of in the early 1950s when WMO implemented new standardized coding system. These biases have the effect of systematic underestimation of total cloud cover during 1900-1940 compared to the past WW2 period ranging from 0.3 to 1 octa and imply biases in short- and long-wave radiation of up to 10 W/m2 and 4 W/m2 respectively. We explored all sources of these biases using direct analysis of early 20th century log-books and performed correction of cloud cover using cloud cover probability density functions. Then short- and long-wave radiative fluxes were computed using state of the art bulk parameterizations. Thus, we obtained long-term time series of turbulent heat fluxes and radiative fluxes for 120-yr period 1900-2022. Analysis of centennial trends shows upward change in sensible plus latent flux ranging from 3 to 14 W/m2 during 120 years, while the increase over the last 40 years amounts to 6-7 W/m2 with the major growth during the 1990s and early 2000s. Radiative fluxes demonstrated increase in short-wave radiation (positive directed to the ocean) of 3-5 W/m2 in the Atlantic subtropics and mid latitudes and weak or close to zero trends in long-wave radiation. While changes in radiative fluxes partially compensate opposite trends in turbulent fluxes, the upward tendency in ocean heat budget (atmosphere gains) remains significant with magnitude of 2-6 W/m2 over 120-yr period. Interdecadal variability of surface turbulent fluxes is of an order of magnitude stronger compared to the radiative fluxes (10-20 W/m2 vs 0.5-2 W/m2), thus implying the dominant role of turbulent fluxes on forming long-term changes of the ocean heat budget. Further interdecadal variability of surface heat budget is discussed in the context of the North Atlantic multidecadal variations.

Research is funded by RSF project # 23-47-00030.

How to cite: Gulev, S. and Aleksandrova, M.: Revealing long-term changes in the North Atlantic air-sea fluxes from provisionally corrected VOS observations (1900-2022), EGU General Assembly 2024, Vienna, Austria, 14–19 Apr 2024, EGU24-3420, https://doi.org/10.5194/egusphere-egu24-3420, 2024.

EGU24-3457 | Orals | OS1.2

A glimpse into the future: The 2023 temperature extremes in the North Atlantic in the context of longer-term climate change 

Till Kuhlbrodt, Ranjini Swaminathan, Paulo Ceppi, and Thomas Wilder

In the year 2023, we have seen extraordinary extrema in high sea-surface temperature (SST) in the North Atlantic which are outside the 4-sigma envelope of the 1982-2011 daily timeseries. Here we take a first look at the large-scale, longer-term drivers of these extrema. Earth’s net global energy imbalance (in the 12 months up to September 2023) amounts to +1.9 W/m2 as part of a remarkably large upward trend, ensuring continuous heating of the ocean. However, the regional radiation budget over the North Atlantic does not show signs of a significant step increase from less negative aerosol forcing since 2020 as was suggested elsewhere. While the temperature in the top 100 m of the global ocean has been rising in all basins since about 1980, specifically the Atlantic basin has continued to further heat up since 2016. Similarly, salinity in the top 100 m of the ocean has increased in recent years specifically in the Atlantic basin. Outside the North Atlantic, around 2015 a substantial negative trend for sea-ice extent in the Southern Ocean has begun, leading to record low sea-ice extent in 2023. We suggest analysing the 2023 temperature extremes in the North Atlantic in the context of these recent global-scale ocean changes. Analysing climate and Earth System model simulations of the future, we find that the extreme SST in the North Atlantic and the extreme in Southern Ocean sea-ice extent in 2023 lie at the fringe of the expected mean climate change for a global surface-air temperature warming level (GWL) of 1.5°C, and closer to the average at a 3.0°C GWL. Understanding the regional and global drivers of these extremes is indispensable for assessing frequency and impacts of similar events in the coming years.

How to cite: Kuhlbrodt, T., Swaminathan, R., Ceppi, P., and Wilder, T.: A glimpse into the future: The 2023 temperature extremes in the North Atlantic in the context of longer-term climate change, EGU General Assembly 2024, Vienna, Austria, 14–19 Apr 2024, EGU24-3457, https://doi.org/10.5194/egusphere-egu24-3457, 2024.

EGU24-3534 | ECS | Posters on site | OS1.2

Perturbation Potential Energy Bridging North Atlantic Ocean Forcing to Atmospheric Multidecadal Variability in the North Atlantic  

Hongyuan Zhao, Jianping Li, Yuan Liu, Emerson Delarme, and Ning Wang

The North Atlantic sea surface temperature anomalies (SSTA) are considered an important origin of the North Atlantic atmospheric multidecadal variability. Employing the perturbation potential energy (PPE) theory, we analyzed the energetics linking North Atlantic Ocean forcings to atmospheric multidecadal variability. Supporting the previous model results, a cyclic pattern involving the Atlantic multidecadal oscillation (AMO) and North Atlantic tripole (NAT) is observed: positive AMO phase (AMO+, similarly hereafter) →NAT→AMO→NAT+, with a phase lag of approximately 15~20 years. An atmospheric mode characterized by basin-scale sea level pressure anomaly in the North Atlantic is associated with the AMO, which is termed as the North Atlantic uniformity (NAU). The AMO+ induces positive uniform PPE anomalies over the North Atlantic through precipitation heating, leading to decreased energy conversion to perturbation kinetic energy (PKE) and a large-scale anomalous cyclone. For the NAT+, tripolar SSTA result in tripolar PPE anomalies through accumulated tripolar precipitation. Anomalous energy conversions occur where the PPE anomaly gradient is large, which is explained by an energy balance derived from thermal wind relationship. The PKE around 15°N and 50°N (25°N and 75°N) increases (decreases), forming the anomalous anticyclone and cyclone at subtropical and subpolar region, respectively, known as the North Atlantic Oscillation (NAO). The reverse holds for the NAT and AMO. As the phases of the ocean modes alternate, the energetics induce the NAU, NAO, NAU+, and NAO+ in sequence. The SSTA-PPE-PKE energetics processes contribute a comprehensive understanding of how the ocean influences atmosphere in the North Atlantic.

How to cite: Zhao, H., Li, J., Liu, Y., Delarme, E., and Wang, N.: Perturbation Potential Energy Bridging North Atlantic Ocean Forcing to Atmospheric Multidecadal Variability in the North Atlantic , EGU General Assembly 2024, Vienna, Austria, 14–19 Apr 2024, EGU24-3534, https://doi.org/10.5194/egusphere-egu24-3534, 2024.

EGU24-3655 | ECS | Posters on site | OS1.2

Shoaled glacial Atlantic Ocean Circulation despite vigorous tidal Dissipation: Vertical Stratification matters 

Yugeng Chen, Pengyang Song, Xianyao Chen, and Gerrit Lohmann

During the Last Glacial Maximum (LGM), tidal dissipation was about three times higher than today, which could have led to a considerable increase in vertical mixing. This would enhance the glacial Atlantic Meridional Overturning Circulation (AMOC), contradicting the shoaled AMOC as indicated by paleo proxies. Here, we conduct ocean model simulations to investigate the impact of background climate conditions and tidal mixing on the AMOC during LGM. Our results show that the shoaled glacial AMOC is mainly due to strong glacial ocean stratification and enhanced glacial Antarctic Bottom Water (AABW), irrespective of enhanced tidal dissipation. Enhanced tides only play an important role if they are applied to a present background climate with relatively weak ocean stratification. Given the critical role of AMOC in (de-)glacial climate evolution, our results highlight the complex interactions of ocean stratification and tidal dissipation that have been neglected so far.

How to cite: Chen, Y., Song, P., Chen, X., and Lohmann, G.: Shoaled glacial Atlantic Ocean Circulation despite vigorous tidal Dissipation: Vertical Stratification matters, EGU General Assembly 2024, Vienna, Austria, 14–19 Apr 2024, EGU24-3655, https://doi.org/10.5194/egusphere-egu24-3655, 2024.

EGU24-3719 | ECS | Posters on site | OS1.2

An observation-based estimate of the Atlantic meridional freshwater transport from 2004 to 2012 

Huayi Zheng, Lijing Cheng, Yuying Pan, and Chenyu Zhu

Meridional freshwater transport in the Atlantic Ocean (AMFT) plays a vital role in the Atlantic meridional overturning circulation and global climate change, but an accurate estimate of AMFT time series remains challenging.

This study uses an indirect approach that combines the observation of ocean salinity, surface evaporation and precipitation observations to derive AMFT and its uncertainty from 2004 to 2012, by solving the ocean freshwater budget equation. The method provides an independent estimation of AMFT, complementary to array observation and model/reanalysis data. The climatology, interannual and trend of AMFT based on indirect method are analyzed.

Climatologically, there is a strong southward AMFT between 18.5°S and 33.5°S, and a shift to northward from 18.5°S to 66.5°N. The highest transport occurs at 3.5°S (-0.29±0.09 Sv) and 39.5°N (-0.52±0.08 Sv). The estimation based on direct observation and reanalysis data are compared to give a clear understanding of AMFT climatology.

The interannual variability of AMFT exhibits meridional coherence from 33.5°S to 66.5°N, except for the lag propagation near 44ºN, the boundary of the subpolar and subtropical North Atlantic. The peaks and valleys of AMFT align with El Niño-Southern Oscillation (ENSO) variation. In the south of 44.5ºN, a southward anomalous AMFT appears during the La Nina events, such as January 2006 (-0.13 Sv), January 2008 (-0.16 Sv), and November 2010 (0 Sv) for 20ºS-44.5ºN mean. Conversely, northward AMFT increases when ONI peaks, 0.07Sv and 0.17Sv for 20ºS-44.5ºN mean in November 2008 and January 2010, respectively. The corresponding relationship between ENSO and AMFT suggest a potentially remote impact of ENSO on the Atlantic Ocean.

The derived time series indicates that, throughout the Atlantic Ocean, there is an increasing trend of northward AMFT from 2004 to 2012 when AMOC weaken, resulting in a freshwater divergence in the South Atlantic and subtropical North Atlantic, as well as a freshwater convergence in the subpolar North Atlantic.

Additionally, we discuss the definition of freshwater transport, considering its dependence on reference salinity. Analyzing the impact of reference salinity on MFT estimation based on a theoretical model, we find that the choice of reference salinity has little impact when there is no net volume transport. Therefore, reference salinity does not significantly affect the AMFT discussed in this study.

How to cite: Zheng, H., Cheng, L., Pan, Y., and Zhu, C.: An observation-based estimate of the Atlantic meridional freshwater transport from 2004 to 2012, EGU General Assembly 2024, Vienna, Austria, 14–19 Apr 2024, EGU24-3719, https://doi.org/10.5194/egusphere-egu24-3719, 2024.

EGU24-3813 | ECS | Orals | OS1.2

Wind Steering of Mid-latitude Eastern Pathway of AMOC 

Sifan Gu, Zhengyu Liu, Sijia Zou, Shaoqing Zhang, Yangyang Yu, and Chengfei He

The spreading pathway of the North Atlantic Deep Water (NADW), which is the lower limb of the Atlantic Meridional Overturning Circulation (AMOC), determines how climate change signals are transported throughout the global ocean. NADW is suggested to be transported from the subpolar Atlantic to the subtropics in the western basin by the deep western boundary current and the eddy-driven interior pathway west of the Mid-Atlantic Ridge (MAR). However, much less attention has been paid to AMOC cross-gyre transport in the eastern basin. Here, combining hydrographic observations and reanalysis, we identify a robust mid-depth Eastern Pathway located east of the MAR, which is further corroborated by model simulations with various resolutions, including eddy-resolving simulations. The Eastern Pathway accounts for half of the NADW transport across the intergyre boundary. Sensitivity experiments suggest that the mid-depth Eastern Pathway is formed by basin-scale ocean circulation dynamics due to wind steering on the intergyre communicating window instead of bottom topography. Our results provide a new paradigm for the AMOC pathway and call for further investigations on the climate response and variabilities associated with different AMOC pathways.

How to cite: Gu, S., Liu, Z., Zou, S., Zhang, S., Yu, Y., and He, C.: Wind Steering of Mid-latitude Eastern Pathway of AMOC, EGU General Assembly 2024, Vienna, Austria, 14–19 Apr 2024, EGU24-3813, https://doi.org/10.5194/egusphere-egu24-3813, 2024.

EGU24-3819 | ECS | Posters on site | OS1.2

Ocean warming acceleration in Atlantic tied to the changes in ocean heat transport 

Yuying Pan and Lijing Cheng

Change in ocean warming rate is essential for evaluating the current climate change and predict future climate conditions. It has been confirmed that in the context of accelerated warming of the Earth climate system, the global oceans have been warming, especially since the 21st century, with a certain rate of acceleration. Because the local ocean heat content (OHC) changes are mainly balanced by the net sea surface heat flux (FS) and the oceanic heat divergence/convergence (OHD), the acceleration of ocean warming is closely related to the trend of the latter two. In this study, we first calculate the oceanic meridional heat transport (MHT) as a residual of energy budget including OHC, FS, and heat related to sea ice volume changes (Qice), and then adjust the discrepancy caused by systematic errors in different data and mismatch between them on a monthly basis. Our estimated MHT is compared to the results from RAPID observations, which shows good agreement between the two, with a correlation coefficient of 0.73 in the time series during January 2009 - December 2020. Based on the multiple datasets, we further evaluate the accelerated/decelerated changes in Atlantic OHC associated with the ocean and air-sea energy flow changes. The results show that during 1985-2016, in the north Atlantic Ocean, the ocean warming is slowing down, which are mainly dominated by the decreased OHD, while the southern Atlantic Ocean is accelerating warming mainly caused by the strengthened OHD. Therefore, MHT changes accompanied by the energy flow within the ocean play a more important role to the regional ocean warming acceleration than the changes in regional sea air heat exchange. The methodology we use here provides a method to estimate the heat transports, and can be used to analysis the ocean warming rates and Earth’s energy changes, and to detect the future climate variability.  

How to cite: Pan, Y. and Cheng, L.: Ocean warming acceleration in Atlantic tied to the changes in ocean heat transport, EGU General Assembly 2024, Vienna, Austria, 14–19 Apr 2024, EGU24-3819, https://doi.org/10.5194/egusphere-egu24-3819, 2024.

EGU24-4035 | Posters on site | OS1.2

The past and projected future freshwater flux from Arctic land ice 

Jonathan Bamber, Zelu Zhang, and Adam Igneczi

We have developed a freshwater flux (FWF) time series aimed at providing a benchmark data set for testing the sensitivity of ocean and coupled GCMs to realistic, plausible future FWF forcing alongside a 70 year reconstruction of past fluxes. Here we build on previous work that reconstructed the freshwater flux (FWF) from Arctic glaciers and the Greenland Ice Sheet from reanalysis (Bamber et al., 2018). First, we use ERA5 reanalyses, a regional climate model and satellite observations to reconstruct the FWF for all Arctic land ice from 1950-2021, partitioned into solid and liquid phases around the coastline of glaciated sectors of the Arctic. We then project the FWF forward until 2100 using estimates of Greenland Ice Sheet melt derived from a structured expert judgement assessment for two temperature scenarios that approximate business as usual and a Paris Agreement limit to warming (Bamber et al., 2019; Bamber et al., 2022). Fluxes from glaciers and ice caps (GIC) are derived from GIC projections for equivalent temperature scenarios. We develop projections for both the median and 95th percentile melt estimates to provide FWF forcing that encompasses the plausible future range from Arctic land ice. To achieve this, we assumed a linear increase in mass loss from 2021 onward such that the integral up to 2100 matches the estimates in the structured expert analysis. The geographic distribution of melt anomalies are scaled according to present-day anomalies in runoff and solid ice discharge from the ice sheet. For the high end case (business as usual, 95th percentile) this equates to a FWF anomaly from the Greenland Ice Sheet of about 0.16 Sv by mid century and 0.3 Sv by 2100, representing an unlikely but plausible FWF entering, primarily, the sub-polar North Atlantic.


Bamber, J. L., M. Oppenheimer, R. E. Kopp, W. P. Aspinall, and R. M. Cooke (2019), Ice sheet contributions to future sea-level rise from structured expert judgment, Proc. Nat. Acad. Sci., 116(23), 11195-11200, doi:10.1073/pnas.1817205116.

Bamber, J. L., M. Oppenheimer, R. E. Kopp, W. P. Aspinall, and R. M. Cooke (2022), Ice Sheet and Climate Processes Driving the Uncertainty in Projections of Future Sea Level Rise: Findings From a Structured Expert Judgement Approach, Earth's Future, 10(10), e2022EF002772, doi:https://doi.org/10.1029/2022EF002772.

Bamber, J. L., A. J. Tedstone, M. D. King, I. M. Howat, E. M. Enderlin, M. R. van den Broeke, and B. Noel (2018), Land Ice Freshwater Budget of the Arctic and North Atlantic Oceans: 1. Data, Methods, and Results, Journal of Geophysical Research: Oceans, 123(3), 1827-1837, doi:10.1002/2017jc013605.


How to cite: Bamber, J., Zhang, Z., and Igneczi, A.: The past and projected future freshwater flux from Arctic land ice, EGU General Assembly 2024, Vienna, Austria, 14–19 Apr 2024, EGU24-4035, https://doi.org/10.5194/egusphere-egu24-4035, 2024.

EGU24-4366 | ECS | Orals | OS1.2

North Atlantic subtropical mode water formation controlled by Gulf Stream fronts 

Jingjie Yu, Bolan Gan, Lixin Wu, Gokhan Danabasoglu, R. Justin Small, Allison H. Baker, Fan Jia, Zhao Jing, Xiaohui Ma, Haiyuan Yang, and Zhaohui Chen

The North Atlantic Ocean hosts the largest volume of global subtropical mode waters (STMWs), serving as heat, carbon, and oxygen silos in the ocean interior. STMWs are formed in the Gulf Stream region where thermal fronts are pervasive with strong feedbacks to atmosphere. However, their roles in the STMW formation have been overlooked. Using eddy-resolving global climate simulations, we find that suppressing local frontal-scale ocean-to-atmosphere (FOA) feedback leads to STMW formation being reduced almost by half. This is because FOA feedback enlarges STMW outcropping, attributable to the mixed layer deepening associated with cumulative excessive latent heat loss due to higher wind speeds and greater air-sea humidity contrast driven by the Gulf Stream fronts. Such enhanced heat loss overshadows the stronger restratification induced by vertical eddy and turbulent heat transport, making STMW colder and heavier. With more realistic representation of FOA feedback, the eddy-present/rich coupled global climate models reproduce the observed STMWs much better than the eddy-free ones. Such improvement in STMW production cannot be achieved even with the oceanic resolution solely refined but without coupling to the overlying atmosphere in oceanic general circulation models. Our findings highlight the need to resolve FOA feedback to ameliorate the common severe underestimation of STMW and associated heat and carbon uptakes in earth system models.

How to cite: Yu, J., Gan, B., Wu, L., Danabasoglu, G., Small, R. J., Baker, A. H., Jia, F., Jing, Z., Ma, X., Yang, H., and Chen, Z.: North Atlantic subtropical mode water formation controlled by Gulf Stream fronts, EGU General Assembly 2024, Vienna, Austria, 14–19 Apr 2024, EGU24-4366, https://doi.org/10.5194/egusphere-egu24-4366, 2024.

EGU24-4367 | ECS | Orals | OS1.2

Intensified Atlantic Multidecadal Variability in a warming climate 

Shujun Li, Lixin Wu, and Yiting Wang

The Atlantic Multidecadal Variability (AMV) is a basin-scale natural mode of the sea surface temperature (SST) in the North Atlantic, exerting a global impact, including contribution to the multidecadal Sahel drought and subsequent recovery and the post-1998 global warming hiatus. How greenhouse warming affects AMV remains unclear. Here, using models with multi-century-long outputs of future climate, we find an intensified AMV under greenhouse warming. Surface warming and freshwater input from sea ice melt increase surface buoyancy, leading to a slowdown of Atlantic Meridional Overturning Circulation (AMOC). Reduced vertical mixing associated with the suppressed oceanic deep convection results in a thinned mixed layer and its variability, favoring stronger AMV SST variability. Further, a weakened AMOC and associated meridional heat advection prolong the lifespan of the AMV, providing a long time for the AMV to grow. Thus, multidecadal global surface fluctuations and the associated climate extremes are likely to be more intense.  

How to cite: Li, S., Wu, L., and Wang, Y.: Intensified Atlantic Multidecadal Variability in a warming climate, EGU General Assembly 2024, Vienna, Austria, 14–19 Apr 2024, EGU24-4367, https://doi.org/10.5194/egusphere-egu24-4367, 2024.

The Gulf Stream is a vital limb of the North Atlantic circulation that influences regional climate, sea level, and hurricane activity. Given the Gulf Stream's relevance to weather and climate, many studies have attempted to estimate trends in its volumetric transport from various datasets, but results have been inconclusive, and no consensus has emerged whether it is weakening with climate change. Here we use Bayesian analysis to jointly assimilate multiple observational datasets from the Florida Straits to quantify uncertainty and change in Gulf Stream volume transport since 1982. We find with virtual certainty (probability P>99%) that Gulf Stream volume transport through the Florida Straits declined by 1.2 ± 1.0 Sv in the past 40 years (95% credible interval). This significant trend has emerged from the dataset only over the past ten years, the first unequivocal evidence for a recent multidecadal decline in this climate-relevant component of ocean circulation.

How to cite: Piecuch, C. and Beal, L.: Robust weakening of the Gulf Stream during the past four decades observed in the Florida Straits, EGU General Assembly 2024, Vienna, Austria, 14–19 Apr 2024, EGU24-4666, https://doi.org/10.5194/egusphere-egu24-4666, 2024.

EGU24-4707 | Orals | OS1.2

Twenty years of observing the Atlantic Meridional Overturning Circulation (AMOC) at 26N 

Ben Moat, David Smeed, William Johns, Shane Elipot, Darren Rayner, Ryan Smith, Denis Volkov, Jules Kajtar, Tillys Petit, and Julie Collins

The RAPID-MOCHA-WBTS (hereafter RAPID) array is an observing system designed to study the Atlantic Meridional Overturning Circulation (AMOC). It is an international collaboration between the National Oceanography Centre, University of Miami, and NOAA. The primary goals of the RAPID array are to observe and understand changes in the AMOC over time, and improve our understanding of how changes in the ocean circulation system may influence regional and global climate patterns. The array consists of a network of moored instruments, which measure ocean temperature, salinity, dissolved oxygen, and flow velocities.

The AMOC at 26◦N has now been continuously measured by the RAPID array over the period April 2004 to present (20 years of observing). This record provides unique insight into the variability of the large-scale ocean circulation, previously only measured by sporadic snapshots of basin-wide transport from hydrographic ship sections. The continuous measurements have unveiled striking variability on timescales of days to a decade, driven largely by wind forcing, contrasting with previous expectations about a slowly varying buoyancy-forced overturning circulation.

We will present the history of the RAPID observational array and its contribution to AMOC science.

How to cite: Moat, B., Smeed, D., Johns, W., Elipot, S., Rayner, D., Smith, R., Volkov, D., Kajtar, J., Petit, T., and Collins, J.: Twenty years of observing the Atlantic Meridional Overturning Circulation (AMOC) at 26N, EGU General Assembly 2024, Vienna, Austria, 14–19 Apr 2024, EGU24-4707, https://doi.org/10.5194/egusphere-egu24-4707, 2024.

EGU24-5278 | ECS | Orals | OS1.2

The role of a weakening AMOC in shaping future Euro-Atlantic atmospheric circulation 

Andrea Vito Vacca, Katinka Bellomo, Federico Fabiano, and Jost von Hardenberg

Climate change simulations predict a weakening of the Atlantic Meridional Overturning Circulation (AMOC). In the North Atlantic, where the deep convection occurs, the AMOC has a particularly marked influence. Here, the AMOC decline could have significant implications for the evolution of weather patterns, resulting in societal risks for densely populated areas of Europe. 

We employ the Weather Regime framework to analyse the change in the daily variability of large-scale atmospheric circulation in three coordinated experiments from the CMIP6 archive (i.e., ssp2-4.5, ssp5-8.5 and abrupt-4xCO2). We find that models that simulate a larger AMOC decline feature a net increase in NAO+ regime frequency and persistence compared to models that simulate a smaller AMOC decline. We show that this is due to the influence of a reduced warming of the subpolar North Atlantic (SPNA) on mean geopotential height, caused by the AMOC weakening. We further show that this also causes the storm track to strengthen due to an increased baroclinicity of the atmosphere in the region, with possible consequences on future extreme events.

Overall, our results suggest that the evolution of the Euro-Atlantic atmospheric circulation depends on the AMOC decline. We conclude that ocean circulation is a main driver of NAO variability in projections of future climate change, in addition to previously known drivers. 

How to cite: Vacca, A. V., Bellomo, K., Fabiano, F., and von Hardenberg, J.: The role of a weakening AMOC in shaping future Euro-Atlantic atmospheric circulation, EGU General Assembly 2024, Vienna, Austria, 14–19 Apr 2024, EGU24-5278, https://doi.org/10.5194/egusphere-egu24-5278, 2024.

EGU24-5412 | ECS | Orals | OS1.2

Role of Ocean Memory in Subpolar North Atlantic Decadal Variability 

Hemant Khatri, Richard Williams, Tim Woollings, and Doug Smith

The decadal variability in the subpolar North Atlantic Ocean heat content is significantly influenced by the atmosphere. The impact of seasonal-annual atmospheric perturbations lasts for many years in the oceans due to the ocean's long memory. The anomalous air-sea heat fluxes and winds associated with atmospheric perturbations first rapidly modify upper ocean temperatures, initiating a short-term or local ocean response. Subsequently, these modifications can alter meridional heat transport rates, leading to anomalous heat convergence persisting for several years—a long-term or far-field ocean response—in the subpolar ocean (Khatri et al., 2022, Geophys Res Lett).

We propose a novel technique that incorporates these two ocean responses to evaluate ocean memory and examine its role in driving decadal ocean variability. Here, we combine heat budget analysis with linear response theory to examine how the North Atlantic Oscillation (NAO), which captures about 40% of atmospheric variability, controls the decadal variability in upper ocean temperatures and quantify the associated ocean memory. Utilising CMIP6 climate model outputs and observations, our estimations suggest ocean memory for the subpolar North Atlantic to be between 10 to 20 years. Furthermore, we find that the NAO strongly influences long-term ocean variability, explaining 30% to 40% of subpolar ocean heat content variability on decadal timescales. Specifically, the impact of seasonal atmospheric events on the ocean persists for more than a decade through a combination of local and far-field ocean responses. The proposed ocean memory-based framework, integrating local and far-field ocean effects into a single metric, can be utilised to analyse how relatively short-timescale atmospheric variability drives changes in the ocean state over decadal timescales.

How to cite: Khatri, H., Williams, R., Woollings, T., and Smith, D.: Role of Ocean Memory in Subpolar North Atlantic Decadal Variability, EGU General Assembly 2024, Vienna, Austria, 14–19 Apr 2024, EGU24-5412, https://doi.org/10.5194/egusphere-egu24-5412, 2024.

EGU24-6046 | Orals | OS1.2

The role of subtropical mode waters in the variability of meridional heat transport in the North Atlantic subtropical gyre 

David A. Smeed, William E. Johns, Ryan H. Smith, Daren Rayner, Denis L. Volkov, Shane Elipot, Tillys Petit, Jules B. Kajtar, Elaine L. McDonagh, and Ben Moat

The AMOC is usually defined as the maximum of the overturning streamfunction.    The time series produced by the RAPID-MOCHA-WBTS observing array uses a streamfunction calculated in depth space.     Using data from the RAPID-MOCHA-WBTS array along with additional data from the WBTS sections in the Florida Straits and other hydrographic data, we have made a time series of the overturning streamfunction calculated in density space.  The streamfunction in density space reveals the shallow overturning cell associated with subtropical mode waters (STMW) that is obscured in the depth-space streamfunction.    The time series of the data also reveal that inter-annual variability in the amount of STMW in the Florida Straits is linked to changes in meridional heat transport.

How to cite: Smeed, D. A., Johns, W. E., Smith, R. H., Rayner, D., Volkov, D. L., Elipot, S., Petit, T., Kajtar, J. B., McDonagh, E. L., and Moat, B.: The role of subtropical mode waters in the variability of meridional heat transport in the North Atlantic subtropical gyre, EGU General Assembly 2024, Vienna, Austria, 14–19 Apr 2024, EGU24-6046, https://doi.org/10.5194/egusphere-egu24-6046, 2024.

EGU24-6116 | ECS | Orals | OS1.2

Early warning signals of AMOC collapse from North Atlantic array observations 

Emma Smolders, René van Westen, and Henk Dijkstra

The Atlantic Meridional Overturning Circulation (AMOC), one of the most prominent climate tipping elements on Earth, can potentially collapse as a consequence of surface freshwater input in the North Atlantic. A collapse from its current strong northward overturning state would have major impacts for the global climate system. Although available reconstructions appear to indicate a gradual weakening of the AMOC over the last century, the proximity of the climate system to a potential future collapse of the AMOC remains unknown. Here, we use the results of the first AMOC tipping event modelled in a state-of-the-art Global Climate Model, the Community Earth System Model (CESM), to identify regions and variables that play a key role in a forthcoming AMOC collapse and can therefore serve as early-warning signals (EWS). We analyse the statistical EWS properties using two steady state simulations with the same CESM version, the steady state simulations differ in the distance to the AMOC tipping point. These results will subsequently be used to assess the usefulness of observations from the SAMBA, RAPID and OSNAP arrays to determine whether the present-day AMOC is approaching a tipping point.

How to cite: Smolders, E., van Westen, R., and Dijkstra, H.: Early warning signals of AMOC collapse from North Atlantic array observations, EGU General Assembly 2024, Vienna, Austria, 14–19 Apr 2024, EGU24-6116, https://doi.org/10.5194/egusphere-egu24-6116, 2024.

EGU24-6506 | ECS | Orals | OS1.2

Eighteen Degree Water Dynamics Viewed from an Ensemble  

Luolin Sun, Takaya Uchida, Thierry Penduff, Bruno Deremble, and William Dewar

The subtropical mode water in the North Atlantic, often referred to as ‘eighteen-degree water’ (EDW), has been investigated based on observational and theoretical studies. We here discuss the mechanism of EDW by using an ensemble-based approach which offers the advantage of separating the eddy field from the mean flow without making implicit assumptions on the temporal or spatial scales of the eddies. We employ an ensemble of North Atlantic Ocean simulations partially coupled with the atmosphere at mesoscale permitting resolution (1/12°), and determine EDW as a pool of the Ertel potential vorticity (PV) lower than the surroundings. Our results suggest that the maintenance of EDW can be explained by the down-gradient eddy PV fluxes balancing the mean flow: the low PV in the formation region is transported by the eddy fluxes to the pool and mixes with the surrounding high PV.  

How to cite: Sun, L., Uchida, T., Penduff, T., Deremble, B., and Dewar, W.: Eighteen Degree Water Dynamics Viewed from an Ensemble , EGU General Assembly 2024, Vienna, Austria, 14–19 Apr 2024, EGU24-6506, https://doi.org/10.5194/egusphere-egu24-6506, 2024.

EGU24-6918 | Posters on site | OS1.2

Asymmetries between phases of Atlantic Multi-decadal Variability in the CMIP6 multi models 

Haedo Baek, Dong Eun Lee, Yeong-Ho Kim, Young-Gyu Park, Hye-jI Kim, and Eun Young Lee

The Atlantic Multidecadal Variability (AMV) is a phenomenon in which North Atlantic Sea Surface Temperature Anomalies (SSTAs) occur almost simultaneously in the subpolar and tropical regions, imprinting their impact not only on neighboring countries but also on the global climate system.Due to its long lifespan, the natural variability associated with AMV seriously amplifies the uncertainty of future climate projections, as the exact mechanisms of the AMV remain unknown despite numerous previous studies.In this study, we investigate the asymmetry in two opposite phases of AMV in different models using preindustrial control experiments from 46 different models participating in the Coupled Model Intercomparison Project 6 (CMIP6). Overall, we find a well-fitted positive linear relationship for tropical Atlantic SSTAs with respect to subpolar SSTAs among 46 models. However, when investigating the model sensitivity between two opposite AMV phases in each model, we find that the strength and phase preference in terms of the tropical SSTA sensitivity to subpolar SSTA widely vary, resulting in AMV+ preferred groups, AMV- preferred groups, or symmetric AMV groups.Among the three groups, the characteristics of models in the AMV+ preferred group are found to be most distinctive. It is most notable with the AMV+ preferred models that the net surface heat flux in the subpolar Atlantic adds heat from the atmosphere into the ocean during the positive AMV phase due to a robust hemispheric reduction of the Westerlies and the Trades.In contrast, it is clearly indicated with the AMV+ preferred model during negative phases of AMV, or with all other model groups during both AMV phases, that subpolar SSTAs associated with AMV originate from the ocean, rather than the atmosphere.This contrast in subpolar A-O interaction found in the AMV+ preferred model can be partially explained as the result of competition between subpolar and tropical SST influences, involving surface ocean feedback in the Tropical Atlantic. As the AMV+ positive group shows a significantly larger weakening of the westerlies and trade winds during AMV+, the vertical cold advection due to Ekman divergence becomes significantly weaker during positive AMV, resulting in warm SSTAs. In addition to the Wind-Evaporation-SST feedback, this Wind-upwelling-SST feedback associated with equatorial convergence further intensifies SSTAs and the tropical positive feedback. Further investigation reveals that the reason for the asymmetric AMV+ preference is in the nonlinear feedback mechanism: positive SST anomalies strengthen the stratification to help local warming driven by anomalous downwelling, whereas negative SST anomalies weaken the stratification and hinder local cooling driven by anomalous upwelling.

How to cite: Baek, H., Lee, D. E., Kim, Y.-H., Park, Y.-G., Kim, H., and Lee, E. Y.: Asymmetries between phases of Atlantic Multi-decadal Variability in the CMIP6 multi models, EGU General Assembly 2024, Vienna, Austria, 14–19 Apr 2024, EGU24-6918, https://doi.org/10.5194/egusphere-egu24-6918, 2024.

EGU24-7739 | Orals | OS1.2

Non-stationarity in the NAO–Gulf Stream SST front interaction 

Alessio Bellucci, Luca Famooss Paolini, Nour-Eddine Omrani, Panos Athanasiadis, Paolo Ruggieri, Casey Patrizio, and Noel Keenlyside

The interaction between the North Atlantic Oscillation (NAO) and the latitudinal shifts of the Gulf Stream sea surface temperature front (GSF) has been the subject of extensive investigations. There are indications of non-stationarity in this interaction, but differences in the methodologies used in previous studies make it difficult to draw consistent conclusions. Furthermore, there is a lack of consensus on the key mechanisms underlying the response of the GSF to the NAO. This study assesses the possible non-stationarity in the NAO–GSF interaction and the mechanisms underlying this interaction during 1950–2020, using reanalysis data. Results show that the NAO and GSF indices covary on the decadal timescale but only during 1972–2018. A secondary peak in the NAO–GSF covariability emerges on multi-annual timescales but only during 2005–2015. The non-stationarity in the decadal NAO–GSF co-variability is also manifested in variations in their lead–lag relationship. Indeed, the NAO tends to lead the GSF shifts by 3 years during 1972–1990 and by 2 years during 1990–2018. The response of the GSF to the NAO at the decadal timescale can be interpreted as the joint effect of the fast response of wind-driven oceanic circulation, the response of deep oceanic circulation, and the propagation of Rossby waves. However, there is evidence of Rossby wave propagation only during 1972–1990. Here it is suggested that the non-stationarity of Rossby wave propagation caused the time lag between the NAO and the GSF shifts on the decadal timescale to differ between the two time periods.

How to cite: Bellucci, A., Famooss Paolini, L., Omrani, N.-E., Athanasiadis, P., Ruggieri, P., Patrizio, C., and Keenlyside, N.: Non-stationarity in the NAO–Gulf Stream SST front interaction, EGU General Assembly 2024, Vienna, Austria, 14–19 Apr 2024, EGU24-7739, https://doi.org/10.5194/egusphere-egu24-7739, 2024.

EGU24-7850 | Posters on site | OS1.2

Subinertial Variability in Four Southeast Greenland Fjords in Realistic Numerical Simulations 

Renske Gelderloos, Thomas Haine, and Mattia Almansi

Natural variability at subinertial frequencies (time scale of several days) plays an important role in the interaction between Greenland’s fjords, the continental shelf, and shelf-break exchange with the deep basins. In this study we identified the nature and driving mechanisms of this variability in four fjords in Southeast Greenland, in three high-resolution numerical simulations. We find two dominant frequency ranges in along-fjord velocity, volume transport of Atlantic Water, and along-fjord heat transport: one around 2–4 days and one around 10 days. The higher frequency is most prominent in the two smaller fjords (Sermilik Fjord and Kangerdlugssuaq Fjord), while the lower frequency peak dominates in the larger fjords (Scoresby Sund and King Oscar Fjord). The cross-fjord structure of variability patterns is determined by the fjord's dynamic width, while the vertical structure is determined by the stratification in the fjord. The dominant frequency range is a function of stratification and fjord length, through the travel time of resonant internal Kelvin waves. We find that the subinertial variability is the imprint of Coastal Trapped Waves, which manifest as Rossby-type waves on the continental shelf and as internal Kelvin-type waves inside the fjords. Between 50% and 80% of the variability in the fjord is directly forced by Coastal Trapped Waves propagating in from the shelf, with an additional role played by alongshore wind forcing on the shelf.

How to cite: Gelderloos, R., Haine, T., and Almansi, M.: Subinertial Variability in Four Southeast Greenland Fjords in Realistic Numerical Simulations, EGU General Assembly 2024, Vienna, Austria, 14–19 Apr 2024, EGU24-7850, https://doi.org/10.5194/egusphere-egu24-7850, 2024.

EGU24-7929 | ECS | Posters on site | OS1.2

Observed variability of AMOC transport components at 11°S 

Anna Christina Hans, Rebecca Hummels, Peter Brandt, and Rodrigue Anicet Imbol Koungue

The Atlantic meridional overturning circulation (AMOC) is a key feature of the oceanic circulation and has a big impact on regional weather and global climate. As the characteristics of the northward return flow of the AMOC crossing the equator are crucial for deep water formation at high latitudes in the North Atlantic, the AMOC variability in the South Atlantic is of particular interest. Here, we present observations of several components of the upper branch of the AMOC at 11°S taken from the Tropical Atlantic Circulation and Overturning at 11°S (TRACOS) array. We focus on the transport time series and seasonal to interannual variability of the North Brazil Undercurrent at the western boundary, the Angola Current at the eastern boundary and the upper layer AMOC transport composed of the geostrophic interior and the Ekman transports. The two boundary currents are derived from 10 years of direct moored current measurements. For the geostrophic interior transport, transport anomalies are derived from 10 years of bottom pressure measurements at the eastern and western continental margin at 300 m and 500 m depth and from sea level anomaly data. In all three analysed time series, no long-term trend is visible, and seasonal to interannual variability dominates. Water mass characteristics of the NBUC show a salinification in the central water range.

How to cite: Hans, A. C., Hummels, R., Brandt, P., and Imbol Koungue, R. A.: Observed variability of AMOC transport components at 11°S, EGU General Assembly 2024, Vienna, Austria, 14–19 Apr 2024, EGU24-7929, https://doi.org/10.5194/egusphere-egu24-7929, 2024.

A part of the uncertainties in global climate model projections over Europe arise from their underestimation of multidecadal variability in the winter-time North Atlantic Oscillation (NAO). This underestimation, however, remains poorly understood. Past studies have linked the weak multidecadal NAO variability in models to an underestimated atmospheric response to North Atlantic sea surface temperature variability. Using the CMIP6 large ensemble of climate models, we explore statistical relationships with physical drivers that may contribute to intermodel spread in NAO variability. We find a significant intermodel correlation between multidecadal NAO variability and multidecadal stratospheric polar vortex variability, as well as a stratosphere-troposphere coupling parameter that quantifies the relationship between stratospheric winds and the NAO. Models with the lowest NAO variance are associated with weaker polar vortex variability and a weaker stratosphere-troposphere coupling parameter. The identification of this relationship suggests that modelled spread in multidecadal NAO variability has the potential to be reduced by improved knowledge of observed multidecadal stratospheric variability, although observational records are currently too short to provide a robust constraint on these indices.

How to cite: Maycock, A., Bonnet, R., and McKenna, C.: Model spread in the multidecadal variability of the winter North Atlantic Oscillation connected to stratosphere-troposphere coupling, EGU General Assembly 2024, Vienna, Austria, 14–19 Apr 2024, EGU24-8426, https://doi.org/10.5194/egusphere-egu24-8426, 2024.

EGU24-8474 | ECS | Posters on site | OS1.2

Assessing North Sea carbon and nutrient cycle responses to regional and global climate change 

A.C. (Cuun) Koek, R. (Richard) Bintanja, and W.H. (Willem) Van de Poll

The North Sea is a very productive and heavily exploited continental shelf sea that absorbs considerable quantities of atmospheric CO2. The fraction of absorbed CO2 1) flowing out towards the North Atlantic and 2) buried in sediments, is highly uncertain, rendering future changes of the system difficult to predict. As part of the NoSE (North Sea-Atlantic Exchange) project, this study focuses on the present-day and future roles of the North Sea within the wider carbon and biogeochemical systems of the Atlantic Ocean. Specifically, in this study we will assess the response of carbon and nutrient cycling in the North Sea and the adjacent North Atlantic Ocean to regional and global climate change.

            The carbon cycle configuration of state-of-the-art Earth System Model EC-Earth3, EC-Earth3-CC (atmosphere: IFS36r4; land surface: HTESSEL; Ocean: NEMO3.6; Sea ice: LIM3; Dynamic vegetation: LPJ-GUESS; Atmospheric composition: TM5; Ocean biogeochemistry: PISCES) was used to simulate both present-day (1981 – 2020) and future (2071 – 2100) climate, marine biogeochemistry, ocean primary production and nutrient distributions. Here, we present a validation of the EC-Earth3-CC present-day climatologies in the North Sea and adjacent parts of the North Atlantic Ocean, using existing observational datasets. We also compare the EC-Earth3-CC results to other global (CMIP6) and regional climate models to infer how EC-Earth3-CC biases compare to deficiencies in other models. Furthermore, we will address the response of the North Sea carbon and nutrient fluxes and budgets to regional and global climate change by comparing the present-day and future climatologies.

            This study will reveal new insights into the cycling of carbon and nutrients in the North Sea, their exchange with the Atlantic Ocean, and how these processes may evolve in the future.

How to cite: Koek, A. C. (., Bintanja, R. (., and Van de Poll, W. H. (.: Assessing North Sea carbon and nutrient cycle responses to regional and global climate change, EGU General Assembly 2024, Vienna, Austria, 14–19 Apr 2024, EGU24-8474, https://doi.org/10.5194/egusphere-egu24-8474, 2024.

EGU24-8498 | Posters on site | OS1.2

Where does the AMOC peak? Assesssing regional variations in North Atlantic Overturning from GLORYS12  

Caroline Katsman, David Oldenhuis, Dennis Vermeulen, and Renske Gelderloos

The Atlantic Meridional Overturning Circulation (AMOC) transports vast amounts of heat to high latitudes, and is largely responsible for Western Europe’s relatively mild climate. Climate models project the AMOC will weaken substantially over the 21st century, which impacts weather, climate, sea level and the oceanic carbon cycle. In many studies, the AMOC state is described in a condensed two-dimensional view or even by means of a single metric, which leaves many aspects of its complex 3D-structure underexposed. By revealing the sharp contrast in overturning strength between the western and eastern subpolar gyre (SPG), the recent OSNAP observations emphasized the importance of considering the AMOC in 3D.

In this study, we explore this further by analyzing the characteristics of the overturning in density space in the North Atlantic SPG on a regional scale, and over time periods ranging from seasons to decades. For this, we use model data from the high-resolution GLORYS12 reanalysis, spanning the period 1993-2020. Following the approach applied in OSNAP, the overturning is assessed from alongstream changes in boundary current transport in specific density classes. This analysis is performed for the entire SPG, for its major basins (Iceland Basin, Irminger Sea, and Labrador Sea) and for smaller segments along the boundary currents, thus providing detailed insights in variations of the overturning varies along the entire SPG boundary.

The mean overturning from GLORYS12 for 1993-2020 is 23.8 Sv, distributed as 41%, 29%, and 30% for the Iceland Basin, Irminger Sea, and Labrador Sea respectively, and peaking at increasingly higher densities in alongstream direction. Within each basin, a pronounced seasonal cycle can be identified, with the maximum overturning occurring in March and the minimum in September. Over the entire reanalysis period, the overturning strength in both the Iceland Basin and Irminger Sea exhibits a weak decreasing trend, whereas the Labrador Sea displays a weak increasing trend

The subdivision in shorter segments reveals large spatial differences in overturning, both with regard to its overall strength and its distribution over density classes. However, these outcomes are less robust than the analyses on the scale of the major basins, as the flow is highly variable and numerical uncertainties associated with offline overturning calculations become more prominent.

Further research is needed to properly interpret these regional variations, and thereby improve our understanding of the AMOC dynamics and its sensitivity to changing oceanic and atmospheric forcing conditions. Linking them to local processes known to govern the overturning (i.e., formation of dense waters in the interior of marginal seas and their export, formation of dense waters within the boundary current system itself and the exchange of waters via overflows) seems a viable route.

How to cite: Katsman, C., Oldenhuis, D., Vermeulen, D., and Gelderloos, R.: Where does the AMOC peak? Assesssing regional variations in North Atlantic Overturning from GLORYS12 , EGU General Assembly 2024, Vienna, Austria, 14–19 Apr 2024, EGU24-8498, https://doi.org/10.5194/egusphere-egu24-8498, 2024.

EGU24-8528 | ECS | Posters on site | OS1.2

The RAPID-Evolution Project: Towards a low-cost and sustainable observing system of the AMOC at 26°N 

Tillys Petit, Ben Moat, Adam Blaker, Chris Cardwell, Shane Elipot, James Harle, Matthieu Le Henaff, Nick Higgs, William Johns, Jules Kajtar, Darren Rayner, Bablu Sinha, David Smeed, Ryan Smith, and Denis Volkov

Direct measurements of the Atlantic Meridional Overturning Circulation (AMOC) and meridional heat transport (MHT) are necessary to better understand the impact of anthropogenic greenhouse gas emissions for the global climate system. The RAPID-MOCHA-WBTS array at 26°N is the only trans-Atlantic observing system to provide 20 years of continuous measurements of the AMOC and MHT. While the design of the array has continuously evolved as our understanding of the AMOC has advanced and as new technologies have become available, the goal of the RAPID-evolution project is now to design a lower cost and sustainable observing system to continue the measurements at the accuracy required by users. Using the dataset gathered since 2004 and ocean reanalysis, a first objective seeks to evaluate the sensitivity of the AMOC estimate to the choice of methodology and data included in the calculation. The project includes the development of a new high-resolution ocean model to identify the short and longer term impacts of incorporating these datasets in the AMOC estimation. Recent technological developments also enable new approaches that could provide better and more cost-effective calculation of the AMOC. The RAPID-Evolution project investigates these approaches and develops methodologies to make use of them, including a new variation of the stepping method using glider deployments and the telemetry of mooring data via an autonomous vehicle.

How to cite: Petit, T., Moat, B., Blaker, A., Cardwell, C., Elipot, S., Harle, J., Le Henaff, M., Higgs, N., Johns, W., Kajtar, J., Rayner, D., Sinha, B., Smeed, D., Smith, R., and Volkov, D.: The RAPID-Evolution Project: Towards a low-cost and sustainable observing system of the AMOC at 26°N, EGU General Assembly 2024, Vienna, Austria, 14–19 Apr 2024, EGU24-8528, https://doi.org/10.5194/egusphere-egu24-8528, 2024.

EGU24-8598 | Orals | OS1.2

Drivers and Impacts of Changing Subpolar North Atlantic Surface Temperature and Salinity 

Simon Josey, Jeremy Grist, and Bablu Sinha

Two aspects of Subpolar North Atlantic variability are explored using observations and model analysis. The first aspect is the autumn-winter seasonal reduction of sea surface temperature (SST). In a climate change simulation with the HadGEM3-GC3.1-HM model, a strong increase in the magnitude of the seasonal temperature reduction (STR) is found in sea-ice affected regions and the subpolar gyre. Similar results are obtained from an observational analysis using the HadISST dataset. In both cases, the STR has increased in magnitude by up to 0.3 ºC per decade over 1951-2020. The primary driver for the increased STR is a greater sensitivity of SST to heat loss due to increased surface stratification brought about predominantly by warming of the northern ocean regions. The increase in STR, leads to a greater winter meridional SST gradient, with potential consequences for increasing winter storminess. The second aspect is an investigation of the atmospheric impacts of surface salinity anomalies through modification of mixed layer properties and the surface heat exchange. For this analysis, the seasonal evolution of two 20-member ensembles of HadGEM3-GC3.1-HM have been undertaken with and without an imposed initial winter salinity anomaly in the western Subpolar North Atlantic that is similar in magnitude to the Great Salinity Anomaly. The evolution of the perturbed model runs will be examined with a focus on the consequences for European spring-summer climate conditions.

How to cite: Josey, S., Grist, J., and Sinha, B.: Drivers and Impacts of Changing Subpolar North Atlantic Surface Temperature and Salinity, EGU General Assembly 2024, Vienna, Austria, 14–19 Apr 2024, EGU24-8598, https://doi.org/10.5194/egusphere-egu24-8598, 2024.

Pressure on the ocean's "sidewalls" - the global continental slope - is strongly dynamically constrained by the steep topography. As a result we find that, even in an eddy-rich ocean model, its variability exhibits coherence over many thousands of kilometres. Here, we examine the time-mean pressures and show how they reflect a combination of global wind-driven signals, interaction with the Antarctic Circumpolar Current and the AMOC, which is seen in the development of pressure around the boundary of the North Atlantic. The need for pressure to be single-valued around the global continental slope ensures that these factors must come to a consistent balance, which shows that two remote factors together must come into a balance with the AMOC. We elucidate how these factors interact, and illustrate them with diagnostics from a 1/12 degree ocean model.

How to cite: Hughes, C. and Gururaj, S.: Remote influence of (or on?) the Atlantic Meridional Overturning Circulation: A boundary pressure perspective., EGU General Assembly 2024, Vienna, Austria, 14–19 Apr 2024, EGU24-8720, https://doi.org/10.5194/egusphere-egu24-8720, 2024.

EGU24-8826 | ECS | Posters on site | OS1.2

Deep Circulation in the North Atlantic from Ocean Bottom Seismometer Noise: Insights from the UPFLOW/iReverb Project 

Afonso Loureiro, Maria Tsekhmistrenko, Alex Saoulis, Carlos Corela, Rui Vieira, Jesus Reis, Rui Caldeira, Miguel Miranda, and Ana Ferreira

Ocean Bottom Seismometers (OBS) face unique challenges in recording seismic events due to their exposure to harsh oceanic conditions. The UPFLOW project deployed 50 OBS of various instrument types in the North Atlantic Ocean. The iReverb project aims to investigate the tidally-modulated current-induced noise generated by water flow around the instrument's frame.

This study presents an analysis of seasonal variations in tidal-induced noise on different OBS types across the Azores, Madeira and Canaries region. 

In some instances, the detected harmonics allow the identification of individual frame components contributing to the noise, offering, on the one hand, insights into potential mitigation solutions for future deployments. On the other hand, our project's main focus - large-scale detection of non-seismic or current-induced reverberation events on OBS - provides valuable data for mapping resonances and tracking ocean currents. 

Our study uses machine learning/deep learning algorithms, automating the mapping of resonances across large datasets and obtaining a proxy for Ocean Bottom Circulation (OBC) patterns.

Here, we present a brief overview of our methodology, describe our results and compare them to classical oceanographic methods to determine ocean currents.

This project was funded by the UPFLOW project (ERC grant 101001601), and by the Portuguese Fundação para a Ciência e a Tecnologia (FCT) I.P./MCTES through national funds (PIDDAC) – UIDB/50019/2020 (DOI: 10.54499/UIDB/50019/2020), UIDP/50019/2020 (DOI: 10.54499/UIDP/50019/2020) and LA/P/0068/2020 (DOI: 10.54499/LA/P/0068/2020).

How to cite: Loureiro, A., Tsekhmistrenko, M., Saoulis, A., Corela, C., Vieira, R., Reis, J., Caldeira, R., Miranda, M., and Ferreira, A.: Deep Circulation in the North Atlantic from Ocean Bottom Seismometer Noise: Insights from the UPFLOW/iReverb Project, EGU General Assembly 2024, Vienna, Austria, 14–19 Apr 2024, EGU24-8826, https://doi.org/10.5194/egusphere-egu24-8826, 2024.

EGU24-9171 | ECS | Orals | OS1.2

Observing the volume and property changes of the Water Masses in the Nordic Seas 

Lucas Almeida, Nicolas Kolodziejczyk, and Camille Lique

The Nordic Seas, where cold and fresh Arctic waters mix with warmer and saltier North Atlantic waters, play a crucial role in the ocean circulation system. This region is also the place of intense water mass transformations, with a conversion of lighter waters into denser waters that contribute to the lower limb of the Atlantic Meridional Overturning Circulation. In recent years, the region has experienced Atlantification, characterized by an increased contribution of Atlantic waters, leading to a warming in the upper layers. This study aims to investigate the impact of Atlantification on the properties of water masses in the Nordic Seas. We have used ISAS, an optimal interpolation from ARGO data with a monthly time series spanning 2002 to 2020, the ANDRO dataset for computing geostrophic velocities from ARGO float drift, and the ERA5 dataset for air-sea flux exchanges. The Nordic Seas are divided into four basins: the Greenland Sea (GS), the Icelandic Plateau (IP) in the west, and the Lofoten Basin and Norwegian Basin in the east. The water column is divided into three water masses based on potential density (𝞼0): surface (𝞼0 < 27.8 kg m-3), intermediate (27.8 < 𝞼0 < 28.0 kg m-3), and deeper water mass (28.0 < 𝞼0 < 28.07 kg m-3). Based on the observational datasets, we estimate the variations of the volume of each water mass, the transport within and outside the basins, and the surface-forced Water Mass Transformation (WMT). The eastern basins are experiencing surface warming, particularly after 2013, accompanied by an increase in the volume of the same water mass. Moreover, the volume of intermediate water masses is decreasing. In the Norwegian Basin, surface-forced transformations dominate the volume changes, while the Lofoten Basin experiences a significant influence from both surface-forced transformation and the import of warm waters from the south. In the western basins, both the intermediate and deeper water masses are increasing in volume encompassing a larger depth range , with a smaller trend in the Icelandic Plateau. In the Greenland Sea, the WMT are dominating these changes and the region is mostly exporting denser waters. In contrast, in the Icelandic Plateau the intermediate water is mostly explained by differences in the transports, and the deeper water masses by the surface transformation. We conclude that the changes observed in the Nordic Seas water masses result from a combination of local changes driven by air-sea fluxes and the advection of warmer waters. Monitoring the relative contributions of remote and local processes involved in WMT will help us to better understand and anticipate the ongoing and future shifts in the Nordic Seas conditions. 

How to cite: Almeida, L., Kolodziejczyk, N., and Lique, C.: Observing the volume and property changes of the Water Masses in the Nordic Seas, EGU General Assembly 2024, Vienna, Austria, 14–19 Apr 2024, EGU24-9171, https://doi.org/10.5194/egusphere-egu24-9171, 2024.

EGU24-9943 | ECS | Orals | OS1.2

Emerging impacts of enhanced Greenland melting on Labrador Sea dynamics 

Ilana Schiller-Weiss, Torge Martin, and Franziska Schwarzkopf

Meltwater input to the subpolar North Atlantic from the Greenland ice sheet has been steadily increasing in the past decades due to global warming. To identify the impacts of this enhanced freshwater input since the late 1990s, we use output from the eddy-rich model VIKING20X (1/20˚) running two nearly identical simulations from 1997–2021 only differing in the freshwater input from Greenland: one with realistic interannually varying runoff increasing in the early 2000s and the other continued after 1997 using the local, grid-cell climatology of 1961–2000 maintaining the mean seasonal runoff cycle. Here, runoff is based on the JRA55-do reanalysis (Tsujino et al., 2018, Ocn.Mod.), which includes the Bamber et al. (2018, JGR-O) Greenland runoff and calving record, where liquid and solid discharge is combined into a single liquid flux entering the ocean through the surface and coast. Apart from this, atmospheric forcing is identical between the two runs. To our knowledge this is the first set of twin experiments with a most realistic, well validated, eddy-rich ocean model to assess the impact of the current, observed increase in Greenland ice sheet mass loss. 

We find that the majority of the additional freshwater remains within the boundary current. This enhances the density gradient between the fresh and cool slope current and the warm and salty waters of the interior Labrador Sea and leads to a small (.01 m/s) but significant increase in boundary current speed in our experiment. Both, the faster slope current and the enhanced shelf–interior density gradient increase the potential for intensified eddy shedding into the interior Labrador Sea. This more dynamic regime fosters the eddy-driven import of fresh boundary current waters (Polar Water and meltwater) into the nearby deep convection regions. Lastly, our experiments indicate a role of enhanced Greenland runoff in the eastward shift of deep convection reported by Rühs et al. (2021, JGR-O) for the recent period 2015–2018. The experiment with realistically increased runoff exhibits meltwater tracer mixed only to shallower depths before transferred east into the Irminger Sea leading to a weaker stratification in the upper to mid-depth Irminger Sea than in the experiment with less, climatological runoff, which would enable or at least support deep convection southeast of Greenland.

How to cite: Schiller-Weiss, I., Martin, T., and Schwarzkopf, F.: Emerging impacts of enhanced Greenland melting on Labrador Sea dynamics, EGU General Assembly 2024, Vienna, Austria, 14–19 Apr 2024, EGU24-9943, https://doi.org/10.5194/egusphere-egu24-9943, 2024.

EGU24-10107 | Orals | OS1.2

Modelling the North Atlantic: How parameterizations affect model biases and uncertainties 

Stephan Juricke, Ekaterina Bagaeva, Sergey Danilov, and Nikolay Koldunov

In this presentation, we discuss the role of a variety of parameterizations for simulating ocean dynamics in the North Atlantic and how they contribute to biases and model uncertainties. Their effect is analyzed via a range of diagnostics and model setups.

Many of the crucial processes in the ocean still need to be parameterized in state-of-the-art global ocean and climate models. Among those processes are mesoscale ocean eddies and mixed layer dynamics which cannot be fully resolved in most multidecadal simulations. However, they play a crucial role in setting the dynamic and hydrographic conditions in the North Atlantic and the global oceans. Increasing resolution tends to improve some of the long-standing ocean biases, but is very costly and makes it difficult to disentangle which specific processes or boundary conditions are driving certain improvements.

A consequence of imperfect process parameterizations are systematic errors resulting in large model biases. Furthermore, they can lead to inaccurate representation of the chaotic evolution of the ocean system, leading to insufficient representations of forecast uncertainties via ensemble simulations. In the North Atlantic, both of these consequences play a large role, leading to strong model biases and a general underdispersion of ensemble forecasts.

Classical biases of ocean models at so called eddy-permitting resolution, where mesoscale eddies are barely resolved, are related to overdissipation of kinetic energy and enhanced diffusion of tracers. We introduce a set of parameterizations that tackle the overdissipation of kinetic energy via specific viscosity schemes, including schemes that reinject some of the overdissipated energy back into the system. A combination of such schemes reduces classical ocean biases such as the North Atlantic cold bias by enhancing eddy activity and improving the path of mean currents such as the Gulf Stream. In addition, we demonstrate how stochastic methods can be used to account for parameterization uncertainties in the North Atlantic, quantifying the role of parameterization errors in ocean and climate simulations. These new schemes come at a small additional computational cost, especially compared to higher resolution simulations, and provide a means of understanding the origin of model biases and uncertainties.

How to cite: Juricke, S., Bagaeva, E., Danilov, S., and Koldunov, N.: Modelling the North Atlantic: How parameterizations affect model biases and uncertainties, EGU General Assembly 2024, Vienna, Austria, 14–19 Apr 2024, EGU24-10107, https://doi.org/10.5194/egusphere-egu24-10107, 2024.

EGU24-11088 | ECS | Posters on site | OS1.2

Pathways of Glacial Meltwater from the Hudson Strait into the North Atlantic Ocean: Insights from Eddy-Resolving Model Simulations 

Sara Martin Alis, Olivier Marchal, Alan Condron, and Sean (Si-Yuan) Chen

A long-standing question in paleoclimate research concerns the fate and consequences of the glacial water released into the ocean from the Laurentide Ice Sheet (LIS) during the last deglaciation. In this presentation, we will describe detailed simulations of the pathways of glacial meltwater released from the LIS which have been obtained from an eddy-resolving, regional configuration of the general circulation model of the MIT (MITgcm) coupled with a sea-ice model. Emphasis will be placed on glacial meltwater discharged from Hudson Strait into the Labrador Sea and on its interaction with the North Atlantic Current (NAC). Our regional configuration of the MITgcm represents the glacial Atlantic between 34.5oN and 67oN at a horizontal resolution of 1/20o, with 61 vertical levels (21 levels in the upper 100 m), and with continental shelves removed (sea level lowered by 130 m). The relatively fine spatial grid permits the simulation of the mesoscale eddy field and of the baroclinic structure of the buoyant current produced by the meltwater inflow. Surface forcing is provided by the atmospheric conditions during the last glacial maximum which have been simulated by a global climate model (Community Climate System Model v.3). Our preliminary results show that the meltwater current from Hudson Strait flows to the SE along the continental slope of Labrador and Newfoundland and sheds anticyclonic eddies which carry offshore meltwater and are entrained by the NAC near the Grand Banks. In turn, the meltwater influences the NAC through its effect on seawater density, suggesting a new mechanism by which glacial water fluxes may change large-scale circulation in the North Atlantic. In our presentation, attention will be paid on the influence of the meltwater on the strength and structure of the NAC near and downstream of the Grand Banks.

How to cite: Martin Alis, S., Marchal, O., Condron, A., and Chen, S. (.-Y.: Pathways of Glacial Meltwater from the Hudson Strait into the North Atlantic Ocean: Insights from Eddy-Resolving Model Simulations, EGU General Assembly 2024, Vienna, Austria, 14–19 Apr 2024, EGU24-11088, https://doi.org/10.5194/egusphere-egu24-11088, 2024.

Wintertime variability of both the strength of the jet stream and the North Atlantic Oscillation (NAO) index have been correlated in decadal time scale. Both have positive trends since the 1960s which have been recently proposed to be connected to anthropogenic global warming. At the same time there is a rich literature explaining both the observed variability and also the discrepancy with circulation models in which the variability is usually much smaller. Among the proposed mechanisms were “tug-of-war” between the tropics and the Arctic lower troposphere and surface temperatures, Arctic amplification, polar vortex strength. However, none of those forcing can not explain the trends in all the studied period.


The motivation behind the present study is to find a mechanism which can explain the variability and trend in the whole period of accelerated global warning, that is since the middle of the previous century. One possible candidate can be warming of the troposphere and cooling of the stratosphere, both well established results of the increase in greenhouse gas forcing. Together with the lowering of the tropopause altitude with increasing latitude, this results in warming south of the jet stream and cooling north of it, increasing the very gradient which sustains a thermal wind such as the jet stream.


The results of early analysis show that the greenhouse related tropospheric warming / stratospheric cooling is a plausible candidate for the driver of changes in the wintertime jet stream strength and related NAO changes supporting the notion that NAO may head towards constant positive values. However the question remains why such changes are only visible in the Atlantic sector and not elsewhere in the mid-latitudes of the Northern Hemisphere. The multidecadal wintertime NAO changes seemed related with the AMO/AMV variability of North Atlantic SST values at least until the 1990s. This leaves the possibility that both Atlantic SSTs and greenhouse gas forcing are drivers of the variability in the wintertime jet stream strength.


How to cite: Piskozub, J.: Anthropogenic influence on wintertime jet stream strength in the Atlantic sector. Is it real? Is it Atlantic SST mediated?, EGU General Assembly 2024, Vienna, Austria, 14–19 Apr 2024, EGU24-11572, https://doi.org/10.5194/egusphere-egu24-11572, 2024.

EGU24-11980 | ECS | Posters on site | OS1.2

How does tropical Atlantic Multidecadal Variability develop? 

Balaji Senapati, Christopher H. O’Reilly, and Jon Robson

Atlantic Multidecadal Variability (AMV) has been linked to climate variability in many regions across the globe. However, the mechanisms through which the AMV develops remain unclear. Modelling studies show that global teleconnections from the AMV are sensitive to how the tropical branch is represented, though understanding how the decadal Sea Surface Temperature (SST) anomalies develop in this region has received little attention. Here, we present a quantitative examination of the generation of tropical AMV using SST restoring experiments. In contrast to the generally proposed mechanisms of wind-flux-SST or cloud feedback, this study provides new insight into the dominance and crucial role of upper ocean dynamics, particularly concerning the mixed layer depth. Given the sensitivity of tropical AMV on global implications, the accurate simulation of the upper ocean dynamics in coupled climate models becomes imperative.

How to cite: Senapati, B., O’Reilly, C. H., and Robson, J.: How does tropical Atlantic Multidecadal Variability develop?, EGU General Assembly 2024, Vienna, Austria, 14–19 Apr 2024, EGU24-11980, https://doi.org/10.5194/egusphere-egu24-11980, 2024.

EGU24-12078 | ECS | Posters on site | OS1.2

Understanding the influence of Atlantic Meridional Overturning Circulation interannual variability on European cold extremes 

Eduardo Alastrué de Asenjo, Jana Sillmann, and Johanna Baehr

Changes in the Atlantic Meridional Overturning Circulation (AMOC) impact the redistribution of heat across the climate system and can therefore influence surface temperatures over land. A large AMOC weakening, frequently analysed through idealised model simulations (e.g., freshwater hosing experiments), would lead to a strong cooling over the Northern Hemisphere. This cooling is most pronounced for winter months, suggesting a potential influence on cold extreme events; and for Europe, this influence has been hinted at. However, whether a more realistic interannual variability in the AMOC, rather than an idealised long-term weakening, also influences European mean temperatures and cold extremes is thus far unknown.

To unravel this issue, we use the historical simulations of the 50-member MPI-ESM1.2-LR large ensemble, whose size is particularly suitable for analysing extremes. In these simulations, we categorise European temperatures based on their preceding interannual AMOC strengths. For yearly mean temperatures in a pre-industrial climate, we find that the distribution of temperatures following weak interannual AMOC strengths is significantly shifted towards colder values compared to years preceded by strong interannual AMOC strengths. Among all seasons, this shift is largest in winter; and spatially it is accentuated for northern latitudes. When considering present-day climate, the same shift still occurs, although less pronounced and strongest now for Eastern Europe. For daily extreme cold temperatures, the distribution of events is again colder following years of prevalent weak AMOC strengths; and this difference also becomes less clear and moves south-eastward in present-day climate. We complete the analysis by looking at the potential chain of physical atmospheric mechanisms that explains not only the connection between AMOC strengths and European extreme cold temperatures but also the evolution of this connection in the recent past.

How to cite: Alastrué de Asenjo, E., Sillmann, J., and Baehr, J.: Understanding the influence of Atlantic Meridional Overturning Circulation interannual variability on European cold extremes, EGU General Assembly 2024, Vienna, Austria, 14–19 Apr 2024, EGU24-12078, https://doi.org/10.5194/egusphere-egu24-12078, 2024.

EGU24-12614 | ECS | Orals | OS1.2

The influence of tides on the AMOC in an eddy-permitting global general circulation model 

Federica Borile, Paola Cessi, Doroteaciro Iovino, and Nadia Pinardi

The energy budget of the global ocean circulation highlights the importance of winds and tides as primary energy sources. Tidal influence extends throughout the water column, particularly in regions of rough topography where internal waves are generated, leading to the conversion of energy from barotropic to baroclinic high-frequency modes. Our study explores the impact of tidal forcing on the general circulation using different experiments of a mesoscale-permitting global ocean model, with the addition of a topographic wave drag parametrization for unresolved scales. The focus is specifically on the Atlantic meridional overturning circulation (AMOC). Our findings reveal that tides interact with mesoscale structures, either reinforcing or weakening the mean circulation based on the dynamic conditions of the flow. On a basin scale, we find that the meridional circulation is weakened by tides on multidecadal time scales, despite robust interannual variability. We analyze these impacts in the momentum balance, concentrating on the role of tides in altering the AMOC geostrophic balance.

How to cite: Borile, F., Cessi, P., Iovino, D., and Pinardi, N.: The influence of tides on the AMOC in an eddy-permitting global general circulation model, EGU General Assembly 2024, Vienna, Austria, 14–19 Apr 2024, EGU24-12614, https://doi.org/10.5194/egusphere-egu24-12614, 2024.

EGU24-12743 | ECS | Posters on site | OS1.2

Holocene Variability of the AMOC as derived from 231Pa/230Th 

Lukas Gerber, Jörg Lippold, Finn Süfke, Ole Valk, Manuel Ehnis, Saskia Tautenhahn, Lars Max, Cristiano M. Chiessi, Marcel Regelous, Sönke Szidat, and Frerk Pöppelmeier

Climate models and paleo-reconstructions suggest that alterations in the Atlantic Meridional Overturning Circulation (AMOC) are not only indicators but also drivers of climate changes. Therefore, the AMOC is considered a critical tipping element within Earth’s climate system. Many lines of evidence indicate that the last glacial termination was characterised by large swings in AMOC strength, yet proxy evidence remains ambiguous about centennial-scale fluctuations during the Holocene. Inconsistencies persist regarding the timing, spatial pattern, and intensity of North Atlantic deep-water production. This study evaluates the variability of the AMOC during the Holocene based on several marine sediment cores covering the North Atlantic in high temporal resolution. For this, we exploit the 231Pa/230Th proxy, which indicates the bottom water advection strength. Additionally, past particle fluxes were reconstructed to determine a possible influence of particle composition and particle rain rate on the 231Pa/230Th signal. This study thus aims to extend existing paleo-circulation reconstructions of the AMOC from the last deglacial period with more recent analyses. Five new high-resolution 231Pa/230Th down-core records from different oceanographic settings and water depths in the North Atlantic consistently exhibit low variability throughout the entire Holocene. The 231Pa/230Th records generally display deviations of ± 10% from their respective Holocene mean. A generalised additive model (GAM) was fitted to the timeseries to detect mean North Atlantic trends within the different Holocene-normalised datasets. This model exhibits a virtually constant 231Pa/230Th level throughout the Holocene, interrupted by two time periods of slightly increased ratios, indicative of a weaker AMOC. The first time period is within the timeframe of the 8.2 ka event, characterised by a sudden cold spell across parts of the Northern Hemisphere. During this interval, four of the five timeseries show slightly elevated 231Pa/230Th ratios, although two records within this period hold a reduced sampling resolution. This limited temporal resolution and the shortness of the event make it challenging to decidedly conclude on the magnitude of the AMOC weakening during this time. The second period of higher 231Pa/230Th coincides with the 4.2 ka event and is only evident from the ODP 1063 data (Bermuda Rise). However, these higher 231Pa/230Th ratios can be explained by increased bottom scavenging of 231Pa presumably caused by benthic storms, induced by the transfer of eddy kinetic energy from the surface to the deep ocean. Consequently, atmospheric forcing during the 4.2 ka event seems to be a more plausible explanation than a paleoceanographic cause for the observed higher 231Pa/230Th. In conclusion, our study suggests that deep ocean circulation in the North Atlantic did not exhibit high variability on sub-millennial time scales, but has remained relatively stable throughout the Holocene.

How to cite: Gerber, L., Lippold, J., Süfke, F., Valk, O., Ehnis, M., Tautenhahn, S., Max, L., Chiessi, C. M., Regelous, M., Szidat, S., and Pöppelmeier, F.: Holocene Variability of the AMOC as derived from 231Pa/230Th, EGU General Assembly 2024, Vienna, Austria, 14–19 Apr 2024, EGU24-12743, https://doi.org/10.5194/egusphere-egu24-12743, 2024.

Thermal variability in the subpolar North Atlantic Ocean may be understood in terms of opposing fast and slow responses to atmospheric events, such as involving the response to the North Atlantic Oscillation (NAO). What is unclear is the associated ocean carbon response to atmospheric events, and how that response differs from the thermal response? Here, we diagnose the output from a full Earth system model, UKESM1 piControl simulation integrated over 1100 years, and analyse the transient response to a composite NAO event, derived from combining 270 NAO+ and 246 NAO- individual events. The carbon response is then separated into a fast and slow response to the onset of a single NAO event. During a NAO+ event, there is an initial local response extending over the first one to two years involving anomalous surface cooling and air-sea uptake of carbon in the subpolar gyre. Consequently, there is a reduction in heat storage and an increase in ocean dissolved inorganic carbon (DIC), together with enhanced mixed-layer entrainment of nutrients leading to an increase in biological export of carbon. There is then a delayed response extending for a further 10 years, involving an influx of warm and salty waters through ocean advection, which also carries an increase in both alkalinity and dissolved inorganic carbon. Hence, the ocean thermal and carbon responses  involve  a combination of fast, local responses to atmospheric  forcing (involving air-sea exchange, entrainment and biological export) plus a slow, far-field response to prior atmospheric events (involving ocean redistribution of heat, salt, alkalinity and carbon together with continued air-sea exchange). The thermal and carbon responses differ in that the thermal response involves opposing signs in the fast and slow contributions, while the carbon response involves reinforcing fast and slow contributions. This asymmetry is primarily due to opposing signs in the fast contributions with surface cooling leading to a reduction in heat storage, but an increase in carbon storage. Hence, the ocean memory of an atmospheric event is greater for carbon than for heat. 

How to cite: Williams, R. and Khatri, H.: Reinforcing fast and slow carbon responses to atmospheric events in the subpolar North Atlantic , EGU General Assembly 2024, Vienna, Austria, 14–19 Apr 2024, EGU24-12828, https://doi.org/10.5194/egusphere-egu24-12828, 2024.

EGU24-13381 | ECS | Posters on site | OS1.2

Imperfect emergency brake: Can delayed Solar Radiation Modification revert AMOC and SPG weakening?  

Claudia Wieners, Daniel Pflüger, Leo van Kampenhout, René Wijngaard, and Henk Dijkstra


Solar Radiation Modification (SRM) is a collection of hitherto hypothetical methods that would reflect a small fraction of incoming solar radiation, thereby cooling the Earth and reducing the impact of greenhouse gas forcing, albeit imperfectly.  The best-researched method so far is Stratospheric Aerosol Injection (SAI), which would work by injecting a reflective aerosol (e.g. sulphate) or a precursor gas (e.g. SO2) into the stratosphere.

Previous studies (e.g., Tilmes et al, 2018, 2020, Xie et al., 2022) have shown that SAI and other SRM methods can reduce or even prevent Atlantic Meridional Overturning Circulation (AMOC) weakening. No dedicated study has however been done on the effect of SRM on the Subpolar Gyre (SPG). Also, most SRM modelling studies focus on present-day (2020) or at least speedy initialization of SRM. In reality, SRM might only begin many decades from now, if at all. In our study, we investigate whether delaying SRM will cause irreversible changes to the AMOC and the SGP.


To this end we compare three scenarios in the CESM2 model:

  • Control: An extreme warming scenario (RCP8.5) without SAI
  • SAI2020: As Control, but keeping global mean surface temperature constant by means of SAI from 2020 onwards
  • SAI2080: As Control, but starting SAI from 2080 such as to bring global mean surface temperature to 2020 levels and keeping it constant thereafter.

These are extreme scenarios, not intended to represent plausible policy choices but meant to investigate whether irreversibility can occur in principle.

We find that in Control AMOC weakens from 16 Sv in 2020 to 7 Sv in 2100, while in SAI2020, it only weakens to 12 Sv. In SAI2080, AMOC stops weakening after 2080, but does not recover (at least till 2100) to the strength it has in SAI2020. Thus, delayed SAI cannot quickly revert AMOC weakening, if at all. This has effects on the local climate, in particular overcooling around the North Atlantic, and even the interhemispheric temperature gradient.

In addition, we find for Control, that deep convection (i.e. deep mixed layers in winter) ceases in the Labrador sea around 2050 and south of Iceland around 2070. Under SAI2020, deep convection remains active south of Iceland. Under SAI2080, deep convection does not recover by 2100.

We conclude that SAI is not a perfect “emergency brake” for global warming: If action is delayed, changes in ocean circulation persist at least for several decades. However, we stress that other, including political, factors must be taken into account when considering (near-term) SAI, and that phasing out greenhouse gas emissions must remain the primary tool of climate policy. 

How to cite: Wieners, C., Pflüger, D., van Kampenhout, L., Wijngaard, R., and Dijkstra, H.: Imperfect emergency brake: Can delayed Solar Radiation Modification revert AMOC and SPG weakening? , EGU General Assembly 2024, Vienna, Austria, 14–19 Apr 2024, EGU24-13381, https://doi.org/10.5194/egusphere-egu24-13381, 2024.

EGU24-13748 | Posters on site | OS1.2

Surface factors controlling the volume of accumulated Labrador Sea Water 

Yavor Kostov, Marie-José Messias, Herlé Mercier, David P. Marshall, and Helen L. Johnson

We explore historical variability in the volume of Labrador Sea Water (LSW) using ECCO, an ocean state estimate configuration of the Massachusetts Institute of Technology general circulation model (MITgcm). The model’s adjoint, a linearization of the MITgcm, is set up to output the lagged sensitivity of the watermass volume to surface boundary conditions. This allows us to reconstruct the evolution of LSW volume over recent decades using historical surface wind stress, heat, and freshwater fluxes. Each of these boundary conditions contributes significantly to the LSW variability that we recover, but these impacts are associated with different geographical fingerprints and arise over a range of time lags. We show that the volume of LSW accumulated in the Labrador Sea exhibits a delayed response to surface wind stress and buoyancy forcing outside the convective interior of the Labrador Sea, at important locations in the North Atlantic Ocean. In particular, patterns of wind and surface density anomalies can act as a “traffic controller” and regulate the North Atlantic Current’s (NAC) transport of warm and saline subtropical water masses that are precursors for the formation of LSW. This propensity for a delayed response of LSW to remote forcing allows us to predict a limited yet substantial and significant fraction of LSW variability at least a year into the future.  Our analysis also enables us to attribute LSW variability to different boundary conditions and to gain insight into the major mechanisms that drive volume anomalies in this deep watermass. We point out the important role of key processes that promote the formation of LSW both in the Irminger and Labrador Seas: buoyancy loss and preconditioning along the NAC pathway, in the Iceland Basin, the Irminger Sea, and the Nordic Seas.

How to cite: Kostov, Y., Messias, M.-J., Mercier, H., Marshall, D. P., and Johnson, H. L.: Surface factors controlling the volume of accumulated Labrador Sea Water, EGU General Assembly 2024, Vienna, Austria, 14–19 Apr 2024, EGU24-13748, https://doi.org/10.5194/egusphere-egu24-13748, 2024.

The North Atlantic Subpolar Gyre (SPG) plays an important role in climate predictability and influences climate variability due to its complex coupling with the atmospheric circulation in the North Atlantic and the Atlantic Meridional Overturning Circulation (AMOC). In this study, we investigate the impact of sea surface temperature (SST) variability in the SPG on atmospheric circulation patterns and climate extremes. We use the EC-Earth3 model (T255~80 km) and perform four sets of AMIP-type ensemble experiments with four different prescribed SST anomalies, each with 10 members and spanning 35 years from 1980 to 2014. The experimental design allows the climatic impact of SPG SST variability to be isolated from other global SST modes. Our results show that SPG SST anomalies directly influence atmospheric circulation between 30-75°N, causing zonally oriented wave-like anomalies. Notably, a warm SST anomaly in the subpolar gyre causes strong low-pressure anomalies over the North Atlantic and North Pacific, leading to warming of regions mainly between 45-60°N and cooling of regions mainly between 60-75°N. We find that the anomalous temperatures are particularly pronounced over the North American continent. We also investigate the indirect effects of SPG variability through its synergy with the North Atlantic and North Pacific SSTs, as well as the atmospheric teleconnections and extreme events associated with SPG variability. The results underline the importance of the SPG for the atmospheric circulation, the teleconnections, the regional climate and the extreme events.

How to cite: Karami, M. P., Koenigk, T., and Schenk, F.: Unravelling the impact of subpolar gyre variability on climate extremes and variability:  Insights from an ensemble atmospheric model study, EGU General Assembly 2024, Vienna, Austria, 14–19 Apr 2024, EGU24-15292, https://doi.org/10.5194/egusphere-egu24-15292, 2024.

EGU24-15604 | Orals | OS1.2

Detecting climatic change in AMOC observations 

Gerard McCarthy, Guillaume Hug, David Smeed, and Ben Moat

The detection of trends and variations in the Atlantic Meridional Overturning Circulation (AMOC) is an important and at times controversial topic. On average, CMIP6 models project a 1 Sv/decade decrease in the strength of the AMOC in response to anthropogenic climate change. Atlantic subpolar decadal sea surface temperature variations of 0.5º indicate an associated change in AMOC strength of 2 Sv. These are challenging thresholds of signal detection for AMOC observing.


Estimates of the AMOC streamfunction, such as those from the RAPID array, have a number of sources of variability ranging from short term Ekman transport to variations in the strength of North Atlantic Deep Water associated with deep water formation that have a slower timescale. Climate model studies have shown that Ekman transport contributes little to the signal of future AMOC decline.


We look at the nearly 20 years of data from the RAPID array from a signal to noise perspective. Fluctuations associated with Ekman transport are the largest contribution to noise in the AMOC estimates and hold no signal of low frequency change. Deeper layers show more of the low frequency signal. We amplify this low frequency signal by removing the impact of noise derived from the Ekman transport on the deep temperature and salinity. Finally, we show that the best place for detection of low frequency, climatic changes in AMOC is in the deepest North Atlantic Deep Water, with the noise of the wind removed.

How to cite: McCarthy, G., Hug, G., Smeed, D., and Moat, B.: Detecting climatic change in AMOC observations, EGU General Assembly 2024, Vienna, Austria, 14–19 Apr 2024, EGU24-15604, https://doi.org/10.5194/egusphere-egu24-15604, 2024.

EGU24-15696 | Orals | OS1.2

Enhanced northward ocean transport of anthropogenic carbon through recovery of overturning circulation may be affecting North Atlantic CO2 uptake efficiency 

Pete Brown, Elaine McDonagh, Richard Sanders, Ben Moat, Eleanor Frajka-Williams, Brian King, Lidia Carracedo, Andrew Watson, Ute Schuster, Anita Flohr, William Johns, and Molly Baringer

Of the additional carbon dioxide added to the atmosphere by human activities the ocean absorbs approximately a quarter, with a disproportionate fraction accumulating at depth in the North Atlantic due to the combined action of northward ocean transport (through the meridional overturning circulation) and strong air-sea fluxes. Combining repeat hydrography with circulation estimates from the RAPID mooring array at 26N it was found that between 2004 and 2012 these two processes were roughly equal in magnitude, but decreasing ocean transports were tipping the balance more towards air-sea uptake over time as the AMOC weakened. New observations from 2012 to 2022 show that this process has now reversed - a recovering AMOC combined with increasing loadings of carbon is now transporting substantially greater quantities of anthropogenic carbon northwards into the North Atlantic. Changes in regional air-sea fluxes suggests that the increased northward ocean carbon transport may be affecting CO2 uptake capacity downstream.

How to cite: Brown, P., McDonagh, E., Sanders, R., Moat, B., Frajka-Williams, E., King, B., Carracedo, L., Watson, A., Schuster, U., Flohr, A., Johns, W., and Baringer, M.: Enhanced northward ocean transport of anthropogenic carbon through recovery of overturning circulation may be affecting North Atlantic CO2 uptake efficiency, EGU General Assembly 2024, Vienna, Austria, 14–19 Apr 2024, EGU24-15696, https://doi.org/10.5194/egusphere-egu24-15696, 2024.

EGU24-15728 | ECS | Orals | OS1.2

AMOC representation in the North Atlantic in a forced ocean model 

Simon Wett, Monika Rhein, Arne Biastoch, and Eleanor Frajka-Williams

The Atlantic Meridional Overturning Circulation (AMOC) plays a vital role in the climate of Europe and the North Atlantic region by redistributing heat and freshwater in the Atlantic. Climate model studies project an AMOC decline under global warming in the 21st century. However, they disagree on the magnitude and timescales of the weakening. Thus, assessing model performance regarding the representation of the AMOC remains essential. Observational estimates can serve as important benchmarks to understand AMOC variability in ocean models. AMOC observations at different monitoring arrays in the North Atlantic have shown strong variability on multiple time scales and no long-term trend. We analyze the AMOC at the North Atlantic Changes (NOAC) array line at 47°N in the high-resolution forced VIKING20X model simulation from 1980 to 2021. The mean AMOC strength is within the range of the NOAC observations. However, the VIKING20X AMOC exhibits a decreasing trend from the mid-1990s until 2010. This decrease coincides with significant cooling and freshening in the subpolar North Atlantic in VIKING20X. In agreement with NOAC observations, VIKING20X shows meridional connectivity between the NOAC and RAPID AMOC when the NOAC AMOC leads by about one year, though less distinct. This agreement indicates a common mechanism, determining the meridional connectivity in observations and VIKING20X. These mechanisms must be understood and represented in climate models to make informed projections of the future AMOC and its role in the climate system. Furthermore, ocean models and gridded observational data sets could help complement new approaches to monitoring the AMOC at key locations using novel methods and instrumentation, such as drift-free bottom pressure sensors, which could help resolve the geostrophic reference level.

How to cite: Wett, S., Rhein, M., Biastoch, A., and Frajka-Williams, E.: AMOC representation in the North Atlantic in a forced ocean model, EGU General Assembly 2024, Vienna, Austria, 14–19 Apr 2024, EGU24-15728, https://doi.org/10.5194/egusphere-egu24-15728, 2024.

EGU24-16016 | ECS | Orals | OS1.2

Mid-20th Century Atlantic Circulation informed by Modern Observations and Models  

Guillaume Hug, Gerard McCarthy, Ben Moat, and Emma Worthington

The Atlantic Meridional Overturning Circulation (AMOC) is a driving force in the redistribution of heat on our planet and has a particularly large impact on the climate of the Northern Hemisphere and Europe. Reliability of coupled model projections has been questioned due to a body of evidence that the multi-model mean of climate models disagree with observational proxies for the AMOC, in particular in the mid-20th century. In turn, the reliability of these observational proxies has been questioned as they are not direct observations of the AMOC.

In order to study the variations of AMOC during the 20th century, we have developed layered models based on a limited number of time series: Ekman transport and the Florida Strait, as well as the density time series of the Thermocline, Antarctic Intermediate Waters (AAIW), Upper North Atlantic and Lower North Atlantic Deep Waters (UNADW, LNADW). These models, using the deep AMOC branches, are trained with modern RAPID measurements at 26N and compared to each other.

We use these models to predict, from hydrographic profiles, an estimate of the strength of the AMOC during the (mid) 20th century. Locations where EN4 profiles may be relevant to the reconstruction are identified using ocean model data that correlate temperature and salinity with the location of the RAPID measurement. The linear contribution of wind stress is also removed from the density time series using simple linear regression. Our aim is to provide, in the light of modern direct observations, an answer on the reliability of AMOC reconstructions and historical climate simulations during the mid-20th century.

How to cite: Hug, G., McCarthy, G., Moat, B., and Worthington, E.: Mid-20th Century Atlantic Circulation informed by Modern Observations and Models , EGU General Assembly 2024, Vienna, Austria, 14–19 Apr 2024, EGU24-16016, https://doi.org/10.5194/egusphere-egu24-16016, 2024.

EGU24-16264 | ECS | Orals | OS1.2

Greenland Tip Jet in the future: Declining Surface Heat Loss in a High-Resolution CESM Simulation (2015-2099) 

Aleksandr M. Fedorov, Claudia E. Wieners, Marieke Femke de Jong, and Henk A. Dijkstra

The Greenland Tip Jet is a strong westerly wind generated by the interaction between the synoptic Icelandic Low and the steep Greenland orography. Tip Jets were not extensively explored until the beginning of 2000s when gridded atmospheric products reached temporal and spatial resolution high enough to resolve such mesoscale wind events. This mesoscale wind affects surface heat and freshwater content in the area to the southeast of Greenland and then it causes intensification of deep water formation in the Irminger Sea. Through this increase in deep convection intensity, Tip Jets can potentially affect the large scale Atlantic Meridional Overturning Circulation (AMOC) transport on daily-centennial time scales. Given Tip Jets’ role in deep convection, the research question arises: Will the influence of Tip Jets on AMOC change in the future? In the current research, we aim to fill the gap on the Tip Jet variability in the 21st century using the high resolution (0.25°) CESM 1.3 future climate simulation forced with RCP 8.5 for 2015-2099. We identify Tip Jets, estimate future composite anomalies of the surface heat flux and wind stress associated with Tip Jet events, and define the leading factors of their variability in the 21st century. Our analysis reveals no significant trends in Tip Jet frequency or wind stress for 2015-2099. Although no long-term changes are modelled in Tip Jets and wind stress, upward surface heat flux decreases both during Tip Jet days and during the whole winter season (DJFM) in the area to the southeast of Greenland. We attribute this decrease in surface cooling to changes in air-sea temperature difference (Ta – SST). To the east of Cape Farewell, the atmosphere is warming faster than water, causing Ta – SST to shrink during the 21st century. The observed trend in Ta – SST subsequently appears in surface latent and sensible heat fluxes growth for 2015-2099. Therefore, the more rapid warming of the atmosphere compared to the ocean leads to an increase in background latent and sensible heat, resulting in less cold being transported to the central Irminger Sea during Tip Jets. We showed that Tip Jets will likely continue to affect heat and freshwater content in the Irminger sea, however, the character of this influence will be different with climate change during the 21st century. 

How to cite: Fedorov, A. M., Wieners, C. E., de Jong, M. F., and Dijkstra, H. A.: Greenland Tip Jet in the future: Declining Surface Heat Loss in a High-Resolution CESM Simulation (2015-2099), EGU General Assembly 2024, Vienna, Austria, 14–19 Apr 2024, EGU24-16264, https://doi.org/10.5194/egusphere-egu24-16264, 2024.

The subpolar North Atlantic assumes a key role in ventilating the ocean’s interior as it is a primary site for deep water formation. Dissolved oxygen concentrations exhibit high sensitivity to climate variability and changes due to the interplay between sea-surface temperature fluctuations and ocean stratification. This relationship not only affects the solubility of dissolved oxygen but also modulates its transport from the near-surface ocean to the interior, known as ventilation. We collected sixty years of observations, spanning from 1960 to 2022, from three different datasets: GLODAPV2, WOD18 and BGC-Argo. These data underwent rigorous secondary quality control process, which adjusted biases between GLODAPV2 and WOD18, as well as BGC-Argo to minimize systematic errors. We conducted an in-depth analysis of the long-term changes and interannual variability in dissolved oxygen, apparent oxygen utilization (AOU), oxygen utilization rate (OUR) and water mass ages within the upper 2000 meters of the water column. Our specific focus encompassed the Subpolar Mode Water (SPMW), Intermediate Water (IW) and Labrador Sea Water (LSW). The computation of OUR and water mass ages in particular relied on tracer data such as chlorofluorocarbons (CFCs) and Sulphur hexafluoride (SF6) to estimate ventilation ages via the Transit Time Distribution (TTD) method. OUR provides insights into local oxygen consumption due to remineralization of organic matter, while the total AOU is the integrated OUR along the pathway of the water parcel. Therefore, identifying these parameters enables to distinguish between the primary drivers behind oxygen variations in the subpolar North Atlantic, namely air-sea gas exchanges, ocean circulation, and marine biology.

How to cite: Stendardo, I. and Steinfeldt, R.: Ventilation changes in the Subpolar North Atlantic: Insights from Six Decades of Oxygen Observations and Tracer-Based Age Analysis, EGU General Assembly 2024, Vienna, Austria, 14–19 Apr 2024, EGU24-16353, https://doi.org/10.5194/egusphere-egu24-16353, 2024.

EGU24-16587 | ECS | Orals | OS1.2

Simulated Atlantic Meridional Overturning Circulation in a warmer climate and the linkage with the North Atlantic convection using EC-Earth-HR 

René Gabriel Navarro Labastida, Mehdi Pasha Karami, Torben Koenigk, Agatha de Boer, and Marie Sicard

This study aims to analyze the effect of increasing atmospheric CO2 concentrations on the Atlantic Meridional Overturning Circulation (AMOC) and its dependence on convection in the  Labrador (LAB) and Greenland (GIN) Seas. We have used EC-Earth3-HR, the high-resolution version of the global coupled climate model EC-Earth3 in this study. EC-Earth3-HR has a resolution of about 0.25 degrees in the ocean and 40 km in the atmosphere. In contrast to the HighResMIP-protocol, EC-Earth3-HR has undergone a tuning process and a multi-centennial spin-up has been performed. The set of experiments analyzed here consists of a pre-industrial control simulation (piControl), a one percent per year increase in CO2 experiment (1pctCO2) branching from year 250 of our piControl simulation, and two experiments with fixed CO2 concentrations (400.9 ppm and 551.5 ppm) branch off from two points corresponding to global temperature anomalies of around 1°C and 2°C in the 1pctCO2 experiment. Here we have defined deep convection as the mean mixed volume in March, with deep convection equal to zero when the mixed-layer is shallower than a critical depth. Our preliminary results suggest that as the climate warms, the North Atlantic waters become warmer and fresher, promoting the weakening of the North Atlantic deep convection and a subsequent reduction in AMOC strength (up to 20% reduction). The simulated overturning circulation weakening seems to be dominated by changes in LAB deep convection with GIN convection contributing less. Circulation changes in the pre-industrial and the different CO2 concentration experiments are dominated by a strong decadal variability. Compared to the standard resolution EC-Earth3-version, the use of a high resolution leads to deeper ocean mixing in LAB and GIN. More analysis has to be done on the way to clarify to what extent increased resolution affects our results in comparison with previous studies.

How to cite: Navarro Labastida, R. G., Karami, M. P., Koenigk, T., de Boer, A., and Sicard, M.: Simulated Atlantic Meridional Overturning Circulation in a warmer climate and the linkage with the North Atlantic convection using EC-Earth-HR, EGU General Assembly 2024, Vienna, Austria, 14–19 Apr 2024, EGU24-16587, https://doi.org/10.5194/egusphere-egu24-16587, 2024.

EGU24-17617 | Orals | OS1.2

Atlantic meridional nutrient transport 2004-2018 timeseries: insights into inorganic nutrient pool reorganization by the AMOC  

Lidia I. Carracedo, Elaine McDonagh, Richard Sanders, Mark Moore, Herlé Mercier, Pete Brown, Sinhué Torres-Valdés, Edward W. Mawji, Molly Baringer, David Smeed, and Gabriel Rosón

North Atlantic (NA) biological productivity and resulting carbon uptake (Biological Carbon Pump, BCP) are supported by the northward transport of nutrients by the upper limb of the Atlantic Meridional Overturning Circulation (AMOC). Changes in the strength of the AMOC are subject to influence ocean nutrient cycling and the efficiency of the BCP. In this study, we present evidence for non-steady state behaviour based on 14 years of observations (2004-2018) at 26.5°N. Our results show significant (>80%) nutrient transport variability tightly related to AMOC alongside predominantly net southward nutrient transport exceeding total nutrient sources. Changes over the observational period indicate: i) increasing NA BCP efficiency (remineralized:preformed ratio); ii) decreasing NA nutrient inventory, except towards the end of the period when the system was closer to balance.

How to cite: Carracedo, L. I., McDonagh, E., Sanders, R., Moore, M., Mercier, H., Brown, P., Torres-Valdés, S., Mawji, E. W., Baringer, M., Smeed, D., and Rosón, G.: Atlantic meridional nutrient transport 2004-2018 timeseries: insights into inorganic nutrient pool reorganization by the AMOC , EGU General Assembly 2024, Vienna, Austria, 14–19 Apr 2024, EGU24-17617, https://doi.org/10.5194/egusphere-egu24-17617, 2024.

EGU24-17710 | ECS | Orals | OS1.2

Circulation of freshwater over the Labrador shelf and into the interior subpolar North Atlantic 

Elodie Duyck and Eleanor Frajka-Williams

Increasing freshwater input from Greenland and the Arctic could potentially affect the stratification of the water column in the Labrador Sea, and weaken deep convection. While freshwater export from the West Greenland shelf to the interior Labrador Sea is well-documented, little to no exchange is believed to take place off the Labrador Shelf.
In this study, we use drifters deployed on the Greenland and Labrador shelves since 2019 to deepen our understanding of the Labrador shelf surface circulation and cross-shelf exchanges. Trajectories confirm that fresh surface waters from Baffin Bay, Hudson Bay, and the West Greenland Current join to form the Labrador Current with two distinct velocity cores: one at the shelf break and a second inshore coastal core. The recent drifter observations provide further detail about the shelf circulation including topographically-steered exchanges between the main core and the coastal core of the Labrador Current, and confirm the absence of direct connection between Baffin and Hudson Bays, and the interior Labrador Sea. Instead, substantial export takes place between Flemish Cap and the tail of the Grand Banks, with the export location dependent on upstream circulation.
Freshwater originating from the Baffin and Hudson Bays, and the west Greenland ice sheet, is unlikely to directly impact the Labrador Sea deep convection region. Their mixing and diluting along this longer pathway complicate their potential influence on deep convection in the Subpolar North Atlantic.

How to cite: Duyck, E. and Frajka-Williams, E.: Circulation of freshwater over the Labrador shelf and into the interior subpolar North Atlantic, EGU General Assembly 2024, Vienna, Austria, 14–19 Apr 2024, EGU24-17710, https://doi.org/10.5194/egusphere-egu24-17710, 2024.

EGU24-19638 | ECS | Posters on site | OS1.2

Relating excess and redistributed temperature to the Turner Angle in the subtropical North Atlantic using GO-SHIP observations and Machine Learning 

Matthew Clark, Dafydd G. Evans, Elaine McDonagh, and Fatma Jebri

The ocean takes up 93% of the warming in the climate system. Here, we develop methods to isolate this warming signature using multidecadal observations in the North Atlantic. As part of GO-SHIP, repeat ship-based CTD hydrographic observations have been made across the A05 section in the North Atlantic at 24.5˚N. These are climate quality observations of relatively high spatial resolution along the section, providing a unique opportunity to monitor the state of Atlantic physical properties and biogeochemistry. The A05 section has been occupied approximately every 5 years since 1992. Temperature and salinity variability across A05 is influenced by several factors, including air-sea interaction and the effects of anthropogenically driven climate change. Excess temperature is a measure of the amount of extra temperature in the ocean due to post-industrial atmospheric CO2, whereas redistributed temperature quantifies the reorganisation of ocean temperature structure by ocean circulation and mixing. Existing methods to decompose the excess and redistributed temperature changes rely on estimates of the anthropogenic carbon change. The Turner angle, which represents the angle between the theta-s curve and an isopycnal in theta-s space, provides an index of the relative contributions of temperature and salinity on stratification, and thus, on water column stability. Using data from A05, we explore how temporal shifts in temperature and salinity affect the Turner angle, with the aim of using this relationship to separate the excess and redistributed components of change without relying on estimates of anthropogenic carbon. We will establish the relationship between excess and redistributed temperature and Turner angle using Machine Learning tools and the known link between anthropogenic carbon and excess temperature. This approach will enable the use of the Turner angle-based method in areas without any carbon data.

How to cite: Clark, M., Evans, D. G., McDonagh, E., and Jebri, F.: Relating excess and redistributed temperature to the Turner Angle in the subtropical North Atlantic using GO-SHIP observations and Machine Learning, EGU General Assembly 2024, Vienna, Austria, 14–19 Apr 2024, EGU24-19638, https://doi.org/10.5194/egusphere-egu24-19638, 2024.

Two major trans-basin mooring arrays, the Rapid Climate Change-Meridional Overturning Circulation and Heatflux Array (RAPID) at 26.5°N since 2004 and the Overturning in the Subpolar North Atlantic Program (OSNAP) situated at 53°–60°N since 2014, have been continuously monitoring the Atlantic
Meridional Overturning Circulation (AMOC). This study explores the connectivity of AMOC across these two mooring lines from a novel adiabatic perspective utilizing a model-based data set. The findings unveil significant in-phase connections facilitated by the adiabatic basinwide redistribution of water between the two lines on a monthly timescale. This adiabatic mode is a possible cause for the observed subpolar AMOC seasonality by OSNAP. Furthermore, the Labrador Sea was identified as a hotspot for adiabatic forcing of the overturning circulations, primarily attributed to its dynamic isopycnal movements.

How to cite: Han, L.: AMOC Connectivity Between the RAPID and OSNAP Lines Revealed by a Model-Based Dataset, EGU General Assembly 2024, Vienna, Austria, 14–19 Apr 2024, EGU24-20241, https://doi.org/10.5194/egusphere-egu24-20241, 2024.

EGU24-313 | ECS | Orals | OS1.3 | Highlight

Multi-decadal changes in water mass properties of the South Indian Ocean along 110°E 

Meng Han, Helen Phillips, Nathan Bindoff, Ming Feng, and Ramkrushnbhai Patel

Two hydrographic voyages separated by 56 years reveal significant changes in the watermass properties in the southeast Indian Ocean along 110°E. The observations from the International Indian Ocean Expedition in 1963 and the reoccupation of the line in 2019 covered the full ocean depth from 40°S to 11°S, measuring physical, chemical, and biological properties. We focus on the physical and biogeochemical properties in watermass layers of the global meridional overturning circulation and the Indian Ocean’s shallow overturning cells.  The subtropical high salinity water (STHW), which forms the lower branch of the shallow overturning cells, has warmer and increased salinity. Subantarctic Mode Water has cooled and freshened on density levels and Antarctic Intermediate Water (AAIW) has warmed and increased in salinity. Both the SAMW and AAIW watermasses have decreased dissolved oxygen content but increased concentrations of nitrate and phosphate. The results show that changes within watermasses follow their northward pathways, suggesting influences from their formation regions, modified by interior mixing along the overturning pathways.

How to cite: Han, M., Phillips, H., Bindoff, N., Feng, M., and Patel, R.: Multi-decadal changes in water mass properties of the South Indian Ocean along 110°E, EGU General Assembly 2024, Vienna, Austria, 14–19 Apr 2024, EGU24-313, https://doi.org/10.5194/egusphere-egu24-313, 2024.

EGU24-727 | ECS | Orals | OS1.3 | Highlight

Indian Summer Monsoon Rainfall trends over 1979-2022 driven by ocean warming and anomalous wind patterns. 

Ligin Joseph, Nikolaos Skliris, Dipanjan Dey, and Robert Marsh

India receives 80% of its annual rainfall during the Indian Summer Monsoon (ISM) season from June to September. The climate model simulations of Coupled Model Intercomparison Project 6 (CMIP6) robustly indicate a strengthening of the Indian summer monsoon rainfall in a warming climate, despite a reduced land-sea thermal contrast. In this study, we analysed the ISM precipitation trend over India from 1979 to 2022 using rain gauge, satellite-derived, and atmospheric re-analysis data. The results show a broad-scale increasing precipitation trend over major parts of India. However, there is strong spatial variability, with a pronounced precipitation increase over Western India and decreasing precipitation in parts of north-eastern India. The precipitation trend pattern is associated with sea surface temperature (SST) and wind anomalies over the Indian Ocean. Observations indicate a basin-scale warming of the Indian Ocean (IO) that is more prominent in the west equatorial region and Arabian Sea (AS), altering the east-west SST gradient over this period, which is associated with increased equatorial winds during the summer monsoon period. Evaporation correspondingly increases over the Indian Ocean, with widespread increases along the typical atmospheric moisture transport pathway over the western Indian Ocean during the summer monsoon, driven by both ocean surface warming and increasing winds. Increased evaporation results in more moisture being available in the atmosphere over the western Indian Ocean, which subsequently feeds ISM precipitation. Furthermore, a strong correlation between the AS moisture transport and the ISM rainfall has been noticed over the central and western parts of India, where increased precipitation trends exist. A moisture budget trend analysis over Western India suggests that the large increase in moisture convergence in this area is driven by increased moisture entering from the AS concomitant with strongly reduced outgoing moisture transport through the eastern and northern boundaries. A detailed analysis shows that the increased moisture convergence in Western India is predominantly attributed to changes in the wind pattern driven by anomalously reduced winds in the northern part of the peninsula. In addition, the teleconnections between ISM rainfall and large-scale natural climate variability modes such as ENSO and IOD were also shown to modulate precipitation variations over India during the considered period at inter-annual to multi-decadal scales. 

How to cite: Joseph, L., Skliris, N., Dey, D., and Marsh, R.: Indian Summer Monsoon Rainfall trends over 1979-2022 driven by ocean warming and anomalous wind patterns., EGU General Assembly 2024, Vienna, Austria, 14–19 Apr 2024, EGU24-727, https://doi.org/10.5194/egusphere-egu24-727, 2024.

The Indian Ocean dipole (IOD) has a significant impact on the global atmospheric circulation and contributes to determining important aspects of local and global environments. Although the IOD events can significantly cause SST anomalies and chlorophyll fluctuations in the western Indian Ocean, there is still very little known about the interannual variability of the Arabian Sea oxygen minimum zone (ASOMZ) under the influence of these remote forcing processes. In this study, a coupled physical-biogeochemical numerical model was used to investigate the dynamical response of the ASOMZ to extreme negative (2016) and positive (2019) IOD events. Our findings revealed that the suboxic area of the ASOMZ reduced (expanded) by about 27% (about 28%) after the negative (positive) IOD event. Compared to the 2019 pIOD event, approximately 2.5 times more oxygen-rich water was delivered into the Arabian Sea during the 2016 nIOD event, replenishing dissolved oxygen (DO) consumed by intensified upwelling-induced enhanced remineralization of particulate organic matter (POM), thereby increasing the DO concentration in the Gulf of Aden. Conversely, more POM from the upwelling regions in the western Arabian Sea was transported to the central Arabian Sea, leading to a subsequent decrease in DO concentration there. These findings contributed to our understanding of the ASOMZ's response to IOD events, which is essential for studying the Arabian Sea's marine ecosystem.

How to cite: Zhang, Z.: Dynamical Response of the Arabian Sea Oxygen Minimum Zone to the Extreme Indian Ocean Dipole Events, EGU General Assembly 2024, Vienna, Austria, 14–19 Apr 2024, EGU24-1410, https://doi.org/10.5194/egusphere-egu24-1410, 2024.

EGU24-1583 | ECS | Orals | OS1.3

The Influence of Freshwater Input on the Evolution of the 1995 Benguela Niño 

Leo Costa Aroucha, Joke Lübbecke, Mareike Körner, Rodrigue Anicet Imbol Koungue, and Founi Mesmin Awo

Benguela Niño events are characterized by strong warm sea surface temperature (SST) anomalies off the Angolan and Namibian coasts. In 1995, the strongest event in the satellite era took place, impacting fish availability in both Angolan and Namibian waters. In this study, we use direct observations, satellite data, and reanalysis products to investigate the impact that the up-until-now unnoticed mechanism of freshwater input from Congo River discharge (CRD) and precipitation had on the evolution of the 1995 Benguela Niño. Before the onset phase of the event, anomalous rainfall in November/December 1994 at around 6ºS, combined with a high CRD, generated a low salinity plume. The plume was advected into the Angola-Namibia region in the following February/March 1995 by an anomalously strong poleward surface current generated by the relaxation of the southerly winds and shifts in the coastal wind stress curl. The presence of this low surface salinity anomaly of about -2 psu increased ocean stability by generating barrier layers, thereby reducing the turbulent heat loss, since turbulent mixing acted on a weak vertical temperature gradient. A mixed layer heat budget analysis demonstrates that southward advection of Angolan waters drove the warming at the onset of the event, while reduced mixing played the main role at the event’s peak. We conclude that a freshwater input contributed to the SST increase in this exceptionally strong event and suggest that this input can influence the SST variability in Angola-Namibia waters through a combination of high CRD, precipitation, and the presence of a strong poleward surface current.

How to cite: Costa Aroucha, L., Lübbecke, J., Körner, M., Imbol Koungue, R. A., and Awo, F. M.: The Influence of Freshwater Input on the Evolution of the 1995 Benguela Niño, EGU General Assembly 2024, Vienna, Austria, 14–19 Apr 2024, EGU24-1583, https://doi.org/10.5194/egusphere-egu24-1583, 2024.

EGU24-2595 | Orals | OS1.3

Emergence of the Central Atlantic Niño 

Lei Zhang, Chunzai Wang, Weiqing Han, Michael McPhaden, Aixue Hu, and Wen Xing

The Atlantic Niño is characterized by sea surface warming in the equatorial Atlantic, which can trigger La Niña - the cold phase of El Niño-Southern Oscillation (ENSO). Although observations show that the Atlantic Niño has weakened by approximately 30% since the 1970s, its remote influence on ENSO remains strong. Here we show that this apparent discrepancy is due to the existence of two types of Atlantic Niño with distinct patterns and climatic impacts, which we refer to as the central and eastern Atlantic Niño. Our results show that with equal strength, the central Atlantic Niño has a stronger influence on tropical climate than its eastern counterpart. Meanwhile, the eastern Atlantic Niño has weakened by approximately 50% in recent decades, allowing the central Atlantic Niño to emerge and dominate the remote impact on ENSO. Given the distinct climatic impacts of the two types, it is necessary to distinguish between them and investigate their behaviors and influences on climate in future studies.

How to cite: Zhang, L., Wang, C., Han, W., McPhaden, M., Hu, A., and Xing, W.: Emergence of the Central Atlantic Niño, EGU General Assembly 2024, Vienna, Austria, 14–19 Apr 2024, EGU24-2595, https://doi.org/10.5194/egusphere-egu24-2595, 2024.

EGU24-2956 * | ECS | Orals | OS1.3 | Highlight

Future Indian Ocean warming patterns 

Sahil Sharma, Kyung-Ja Ha, Ryohei Yamaguchi, Keith B. Rodgers, Axel Timmermann, and Eui-Seok Chung

Most future projections conducted with coupled general circulation models simulate a non-uniform Indian Ocean warming, with warming hotspots occurring in the Arabian Sea (AS) and the southeastern Indian Ocean (SEIO). But little is known about the underlying physical drivers. Here, we are using a suite of large ensemble simulations of the Community Earth System Model 2 to elucidate the causes of non-uniform Indian Ocean warming. Strong negative air-sea interactions in the Eastern Indian Ocean are responsible for a future weakening of the zonal sea surface temperature gradient, resulting in a slowdown of the Indian Ocean Walker circulation and the generation of southeasterly wind anomalies over the AS. These contribute to anomalous northward ocean heat transport, reduced evaporative cooling, a weakening in upper ocean vertical mixing and an enhanced AS future warming. In contrast, the projected warming in the SEIO is related to a reduction of low-cloud cover and an associated increase in shortwave radiation. Therefore, the regional character of air-sea interactions plays a key role in promoting future large-scale tropical atmospheric circulation anomalies with implications for society and ecosystems far outside the Indian Ocean realm.

How to cite: Sharma, S., Ha, K.-J., Yamaguchi, R., Rodgers, K. B., Timmermann, A., and Chung, E.-S.: Future Indian Ocean warming patterns, EGU General Assembly 2024, Vienna, Austria, 14–19 Apr 2024, EGU24-2956, https://doi.org/10.5194/egusphere-egu24-2956, 2024.

EGU24-3250 | Orals | OS1.3 | Highlight

Indian Ocean Dipole Intensifies Benguela Niño Through Congo River Discharge 

Michael McPhaden, Sreelekha Jarugula, Leo Aroucha, and Joke Luebbecke

Benguela Niños are periodic episodes of unusual El Niño-like warming in the upwelling zone off the coast of southwest Africa with significant impacts on marine ecosystems, coastal fisheries and regional weather variability.  The strongest Benguela Niño in the past 40 years occurred in February-April 1995 with areal average sea surface temperature (SST) anomalies of 2°C and local anomalies up to 4°C off the coast of Angola and Namibia.  Benguela Niños are generated through a combination of remote and regional wind-forced dynamical processes originating within the Atlantic basin. However, a recent study has argued that the extraordinary warming observed in early 1995 resulted from southward advection of unusually high fresh water discharge from the Congo River, which led to the formation of thin mixed layers that trapped heat near the surface to boost coastal SSTs. 

The purpose of this presentation is to show that a strong Indian Ocean Dipole (IOD) that peaked in September-November 1994 was the reason for the high Congo River discharge in early 1995. IOD events are roughly the Indian Ocean equivalent of El Niño and La Niña events in the Pacific, which are generated though anomalous coupled interactions between surface winds and SSTs. It has been previously demonstrated that the IOD can affect eastern tropical Atlantic sea surface salinity through Congo River basin hydrology.  In particular, positive IOD events (warm SSTs in the western Indian Ocean and cold SSTs in the east) like that which occurred in 1994 lead to elevated Congo River discharge and subsequently lower eastern tropical Atlantic sea surface salinity.  However, it has not been previously shown how these the end-to-end processes originating with IOD development can affect Benguela Niños.

We use a variety of data sets and reanalyses (both oceanic and atmospheric) to show how during the 1994 IOD event, moisture was transported through the atmosphere from the western Indian Ocean to the Congo River basin where it converged and rained out to increase Congo River discharge.  The freshwater discharge in turn was advected southward in early 1995 which resulted in formation of thin surface mixed layers atop thick barrier layers that arrested the entrainment of cold subsurface waters, thereby amplifying Benguela Nino SSTs. We further show that this sequence of events has occurred at other times, as for example during a weak 2015 IOD and subsequent 2016 Benguela Niño.  These results suggest that the significant temporal lags between IOD development, Congo River basin rainfall, river discharge, and offshore accumulation of freshwater offer opportunities for improved seasonal forecasting of Indian Ocean impacts on the Atlantic through ocean-atmosphere-land interactions.

How to cite: McPhaden, M., Jarugula, S., Aroucha, L., and Luebbecke, J.: Indian Ocean Dipole Intensifies Benguela Niño Through Congo River Discharge, EGU General Assembly 2024, Vienna, Austria, 14–19 Apr 2024, EGU24-3250, https://doi.org/10.5194/egusphere-egu24-3250, 2024.

EGU24-3828 | ECS | Posters on site | OS1.3

Equatorial wave diagnosis for the Atlantic Niño with an ocean reanalysis 

Qingyang Song

There has been a long-standing need for a rapid-detection method for waves using simulation data for Atlantic Niño events. This study addresses this by utilizing an ocean reanalysis.  The proposed method firstly decomposes the climatological values and anomalies at each grid point are decomposed into the first four baroclinic modes based on their local density profiles, then the wave energy flux is calculated by means of a group-velocity-based scheme.  In the instance during the 2019 Niño event, the decomposed geopotential can well reproduce the displacement of the thermocline during the event. The obtained wave energy fluxes confirm the significant influence of subseasonal Kelvin waves on the event and also suggest that wave energy from off-equatorial regions likely preconditioned the event. This study is thus a useful tool for diagnosing the equatorial waveguide and can support the warning systems for Atlantic Niño events.

How to cite: Song, Q.: Equatorial wave diagnosis for the Atlantic Niño with an ocean reanalysis, EGU General Assembly 2024, Vienna, Austria, 14–19 Apr 2024, EGU24-3828, https://doi.org/10.5194/egusphere-egu24-3828, 2024.

EGU24-6857 | ECS | Orals | OS1.3

Seasonality of Mixing at Tropical Instability Wave Fronts in the Atlantic Ocean  

Mia Sophie Specht, Johann Jungclaus, and Jürgen Bader

Tropical Instability Waves (TIWs) in both Pacific and Atlantic Ocean have been shown to play a role in modulating upper ocean mixing. However, previous studies on the modulation of TIW related mixing are based on small numbers of TIWs. These approaches do not allow for the consideration of temporal variability, which can lead to discrepancies in the findings. In this study, we analyze 12-years of simulation output from the comprehensive, global, high-resolution ocean model ICON, to show for the first time that deep reaching mixing at TIW fronts in the Atlantic Ocean follows a distinct seasonal cycle. We find that, regardless of whether TIWs are present earlier in the year, mixing primarily occurs in boreal summer when the vertical shear of the mean zonal currents also reaches its maximum. Our results suggest that in the Atlantic Ocean, shear at the TIW fronts related to the wave itself is generally not large enough to trigger deep reaching mixing. Instead, the background shear in addition to the TIW related shear also needs to be sufficiently large to generate mixing. This additional background shear is strongly modulated by the seasonality of the South Equatorial Current (SEC). Hence, the SEC and its temporal variability contribute to the generation and modulation of deep reaching mixing at TIW fronts in the Atlantic Ocean.

How to cite: Specht, M. S., Jungclaus, J., and Bader, J.: Seasonality of Mixing at Tropical Instability Wave Fronts in the Atlantic Ocean , EGU General Assembly 2024, Vienna, Austria, 14–19 Apr 2024, EGU24-6857, https://doi.org/10.5194/egusphere-egu24-6857, 2024.

EGU24-7178 | Orals | OS1.3 | Highlight

Winter Convective Mixing Mediating Coupling of N-gain and -loss in the Arabian Sea 

Arvind Singh, Himanshu Saxena, Deepika Sahoo, Sipai Nazirahmed, Niharika Sharma, Deepak Kumar Rai, and Sanjeev Kumar

Marine dinitrogen (N2) fixation fuels primary production and thereby influences the Earth’s climate. Yet, its geographical distribution and controlling environmental parameters remain debatable. We measured N2 fixation rates from the two spatially and physicochemically contrasting regions of the Arabian Sea during the winter monsoon: (a) the colder and nutrient-rich waters in the northern region owing to winter convection and (b) the warmer and nutrient-poor waters in the southern region unaffected by winter convection. We found higher N2 fixation rates at the surface of northern region due to convective mixing driven supply of phosphate (intuitively iron also) from the underlying suboxic waters, whereas the lower rates in the southern region are attributable to the limited supply of iron. N2 fixation was favoured by high nutrients concentration in the euphotic waters, whereas remained unaffected by nutrients availability in the aphotic waters. We conclude that diazotrophs dwelling in the euphotic zone chose phosphate and iron over fixed nitrogen-poor waters. However, we found that among oligotrophic waters, anticyclonic eddy extremes the barrier of fixed nitrogen supply and thereby elevates N2 fixation. While the Arabian Sea loses about 20 to 40% of the global ocean fixed nitrogen, we estimate that N2 fixation in the Arabian Sea offsets only up to 42% of its fixed nitrogen-loss by denitrification, but this offset could be higher if diazotrophic activity is further examined up to the deeper depths of the Arabian Sea.

How to cite: Singh, A., Saxena, H., Sahoo, D., Nazirahmed, S., Sharma, N., Rai, D. K., and Kumar, S.: Winter Convective Mixing Mediating Coupling of N-gain and -loss in the Arabian Sea, EGU General Assembly 2024, Vienna, Austria, 14–19 Apr 2024, EGU24-7178, https://doi.org/10.5194/egusphere-egu24-7178, 2024.

EGU24-7353 | ECS | Orals | OS1.3

Mechanisms of the Indian Ocean surface warming pattern in CMIP5 and 6 models 

Gopika Suresh, Sadhvi Kwatra, Jérôme Vialard, Vincent Danielli, Neetu Suresh, and Matthieu Lengaigne

The latest assessment report of the Intergovernmental Panel on Climate Change highlights an accelerated warming of the Indian Ocean (IO) compared to the global average. Coupled Model Intercomparison Project Phase 5 and 6 (CMIP5/6) projections also indicate a distinct warming pattern, reminiscent of the Indian Ocean Dipole (IOD), characterized by enhanced warming in the Arabian Sea and western Indian Ocean alongside a reduction in the IO branch of the Walker Cell. This study uses an SST heat budget adapted from Zhang and Li (2014, hereafter ZL14) across 46 CMIP5/6 simulations, to examine the drivers of the IO mean warming and its spatial distribution, for both the multi-model mean (MMM) and inter-model diversity.

Differing from the prior ZL14 approach, this study incorporates feedback related to downward longwave heat fluxes. While ZL14 highlighted downward longwave fluxes as the main driver of the IO average warming, our results reveal a dominant role of latent heat flux changes for both the MMM and diversity. These changes are further related to a basin-scale wind speed reduction, linked to the winter monsoon & IO Walker cell branch weakening.

Regarding the spatial pattern, our results emphasize a key role in the Bjerknes feedback in driving the IOD-like pattern for both the MMM and inter-model diversity. There is indeed a strong relationship across models between the IOD-like warming pattern, rainfall increase over the western IO, weakened equatorial easterlies, an east-west dipole in thermocline anomalies and the contribution of oceanic processes to surface warming. In the Arabian Sea, the enhanced warming is controlled by a seasonally varying balance, with the evaporative cooling feedback dominating during spring and summer when upwellings are strong, and the wind speed reduction associated with the winter monsoon weakening dominating later in the year.

Overall, these results call for more comprehensive process-oriented studies with more sophisticated approaches (ocean or coupled model sensitivity experiments) to unravel the IO warming mechanisms.

Keywords: Indian Ocean warming, Air-Sea Interaction, IOD-like warming, Walker cell weakening, Arabian sea warming, Coupled model intercomparison project (CMIP)

How to cite: Suresh, G., Kwatra, S., Vialard, J., Danielli, V., Suresh, N., and Lengaigne, M.: Mechanisms of the Indian Ocean surface warming pattern in CMIP5 and 6 models, EGU General Assembly 2024, Vienna, Austria, 14–19 Apr 2024, EGU24-7353, https://doi.org/10.5194/egusphere-egu24-7353, 2024.

EGU24-8544 | Posters on site | OS1.3

Changes in the Variability and Teleconnections of the Northeastern Tropical Atlantic Upwelling Region around 2000 

Joke Lübbecke, Belén Rodríguez-Fonseca, Marta Martin-Rey, Teresa Losada, Elsa Mohino, and Irene Polo

Sea Surface Temperatures (SST) in the Northeastern Tropical Atlantic upwelling region off Senegal and Mauritania feature pronounced variability on interannual time scales with impacts on the marine ecosystem. While part of this variability results from wind stress and wind stress curl-driven changes in local upwelling, the roles of air-sea heat fluxes, horizontal advection and potentially remotely forced thermocline variations have also been discussed. Here the relative roles of these forcing mechanisms and how they change over the time period from 1958 to 2020 are investigated utilizing reanalysis products as well as output from a general ocean circulation model (NEMO) forced by the atmospheric JRA55-do forcing. In the configuration analyzed (VIKING20X), oceanic resolution is increased to 1/20º over the Northern Atlantic via a two-way nesting approach, allowing for a better representation of the near-coastal upwelling region.

Interestingly, while interannual SST variability in the eastern equatorial Atlantic and the Angola Benguela region has decreased since 2000 and is projected to further decrease in the future, there is an increase of SST variability in the Northeastern Tropical Atlantic. To understand this increase, we address the roles of changes in local wind forcing and the connection to the equatorial region via the propagation of equatorial and coastal trapped waves. Along with the altered SST variability, teleconnection patterns related the Northeastern Tropical Atlantic, in particular with the El Niño – Southern Oscillation, also changed.    

How to cite: Lübbecke, J., Rodríguez-Fonseca, B., Martin-Rey, M., Losada, T., Mohino, E., and Polo, I.: Changes in the Variability and Teleconnections of the Northeastern Tropical Atlantic Upwelling Region around 2000, EGU General Assembly 2024, Vienna, Austria, 14–19 Apr 2024, EGU24-8544, https://doi.org/10.5194/egusphere-egu24-8544, 2024.

EGU24-8829 | ECS | Orals | OS1.3

An assessment of equatorial Atlantic interannual variability in OMIP simulations 

Arthur Prigent and Riccardo Farneti

The eastern equatorial Atlantic (EEA) seasonal cycle and interannual variability of the sea surface temperature strongly influence the climate of the surrounding continents. It is thus crucial that models used in both climate predictions and future climate projections are able to simulate them accurately. In that context, the EEA seasonal cycle and interannual variability are evaluated over the period 1985-2004 in models participating to the Ocean Model Intercomparison Project Phases 1 and 2 (OMIP1 and OMIP2). The main difference between OMIP1 and OMIP2 simulations is their atmospheric forcing: CORE-II and JRA55-do, respectively. Seasonal cycles of the equatorial Atlantic zonal winds, sea level anomaly and sea surface temper- ature in OMIP1 and OMIP2 are comparable to reanalysis datasets. Yet, some discrepancies exist in both OMIP ensembles: the thermocline is too diffusive and there is a lack of cooling during the development of the Atlantic cold tongue. In addition, the vertical ocean velocity in the eastern equatorial Atlantic in boreal summer is larger in OMIP1 than in OMIP2 simulations. The EEA interannual sea surface temperature variability in the OMIP1 ensemble mean is found to be 51% larger (0.62 ± 0.04 ˚C) than the OMIP2 ensemble mean (0.41 ± 0.03 ˚C). Sensitivity experiments demonstrate that the discrepancy in interannual sea surface temperature variability between OMIP1 and OMIP2 is mainly attributed to their wind forcing. While the April-May- June zonal wind variability in the western equatorial Atlantic is similar in both forcing, the zonal wind variability peaks in April for JRA55-do and in May for CORE-II. Differences in surface heat fluxes between the two atmospheric forcing datasets have no significant impacts on the simulated interannual SST variability.

How to cite: Prigent, A. and Farneti, R.: An assessment of equatorial Atlantic interannual variability in OMIP simulations, EGU General Assembly 2024, Vienna, Austria, 14–19 Apr 2024, EGU24-8829, https://doi.org/10.5194/egusphere-egu24-8829, 2024.

EGU24-10500 | ECS | Posters on site | OS1.3

Decadal Variability of the Indonesian Throughflow’s Vertical Structure and the Impact on Heat and Salinity Transport 

Daniel Waitzmann, Shouyi Wang, Delia W. Oppo, and Caroline C. Ummenhofer

The Indonesian Throughflow, a low-latitude passage of the global conveyor belt, transfers water from the tropical Pacific to the Indian Ocean, modulating the properties of both oceans. Observational and modelling studies have shown that the interannual and decadal variability of the Indonesian Throughflow is closely linked to the leading climate modes of the tropical Pacific, namely the El Niño Southern Oscillation and the Interdecadal Pacific Oscillation; further, it is modulated by variability in the Indian Ocean, especially in the outflow region. The Indonesian Throughflow volume transport variability affects salinity and temperature transport and ocean-atmosphere exchange in the Indo-Pacific warm pool. The Makassar Strait transport represents about 80% of the total Indonesian Throughflow transport and is, therefore, a good proxy for the Indonesian Throughflow transport. Observations from the Indonesian Seas have been used to explain the variability on seasonal to interannual time scales. However, due to the lack of long observational time series in the region, assessing the variability and driving mechanisms on longer time scales is challenging. Here, we use transient runs of a high-resolution coupled ocean-atmosphere model to address the decadal variability of the Indonesian Throughflow and its change under global warming over the time period 1850-2102. We assess how heat content, salinity, and volume transport in the Makassar Strait region change on these timescales and how they contribute to the heat and freshwater transport changes. In addition, we investigate the vertical structure of the Indonesian Throughflow variability and its driving mechanisms. This involves understanding how Indonesian Throughflow variability is connected more broadly to large-scale conditions in the Pacific and Indian Oceans. The results presented here may motivate further analysis using multiple simulations of the high-resolution model configurations conducted as part of HighResMIP to assess the forced changes to the Indonesian Throughflow under RCP8.5 forcing in a highly dynamic ocean region that plays a pivotal role in global heat and freshwater transport.

How to cite: Waitzmann, D., Wang, S., Oppo, D. W., and Ummenhofer, C. C.: Decadal Variability of the Indonesian Throughflow’s Vertical Structure and the Impact on Heat and Salinity Transport, EGU General Assembly 2024, Vienna, Austria, 14–19 Apr 2024, EGU24-10500, https://doi.org/10.5194/egusphere-egu24-10500, 2024.

EGU24-12377 | Posters on site | OS1.3 | Highlight

Developing a 3.5-million-year benchmark record of Indian Ocean Dipole variability  

Stefanie Kaboth-Bahr, Oliver Kern, and André Bahr

The Indian Ocean Dipole (IOD) is the primary mode of interannual sea surface temperature variability (SST) in the tropical Indian Ocean. The climatic effects of the IOD are diverse and geographically widespread. Extreme flood events in eastern Africa, weakened summer monsoon intensity over India and Southeast Asia, and severe droughts in Australia are among the most significant societal consequences of IOD variability. These extreme climate events caused by the IOD are predicted to become more common as greenhouse gas emissions increase. However, despite its significance, surprisingly little is known about IOD variability during the geological past, which would allow for a better assessment of its sensitivity to atmospheric CO2 level changes in the future. This study presents the first insights into the spatio-temporal complexity of the IOD over the past 3.5 million years. We utilize geochemical proxy data (XRF core scanning, stable oxygen, and carbon isotopes, as well as Mg/Ca paleothermometry of planktonic foraminifera) derived from Site ODP 709, situated in the western equatorial Indian Ocean - a critical region for IOD forcing.

How to cite: Kaboth-Bahr, S., Kern, O., and Bahr, A.: Developing a 3.5-million-year benchmark record of Indian Ocean Dipole variability , EGU General Assembly 2024, Vienna, Austria, 14–19 Apr 2024, EGU24-12377, https://doi.org/10.5194/egusphere-egu24-12377, 2024.

EGU24-14029 | Orals | OS1.3

Exploring 6-month lead predictability of the Atlantic zonal mode in CMIP6 

Ingo Richter, Tomoki Tozuka, Yu Kosaka, Shoichiro Kido, and Hiroki Tokinaga

Skillful prediction of the equatorial Atlantic zonal mode (AZM) remains challenging, with many prediction systems dropping below an anomaly correlation coefficient (ACC) of 0.5 beyond a lead time of 3 months. Since the El Niño-Southern Oscillation (ENSO) is well known to have global impacts, it could be expect to be a useful predictor of the AZM but its influence on the adjacent equatorial Atlantic basin is inconsistent. This is perhaps best exemplified by the fact that the extreme 1982 and 1997 El Niño events were followed by Atlantic zonal mode (AZM) events of the opposite sign.

Here we re-examine the potential role of ENSO in the predictability of the AZM using pre-industrial control simulations (piControl) from the Coupled Model Intercomparison Phase 6 (CMIP6). The observed correlation between boreal winter (DJF) sea-surface temperature (SST) in the Niño 3.4 region and the following summer (JJA) SSTs in the ATL3 region is close to zero, indicative of the inconsistent relation between the two. Individual models, however, exhibit a wide range of behaviors with correlations ranging from about -0.5 to +0.5. While the influence of ENSO on equatorial Atlantic SST is inconsistent, the influence of ENSO on surface winds over the equatorial Atlantic is rather robust. All models show a negative correlation between DJF Niño 3.4 SST and boreal spring (MAM) surface winds over the western equatorial Atlantic. In addition, we find that SSTs in the South Atlantic act as a precursor to AZM events. Based on these relations, we construct a multi-linear regression model to predict AZM events in JJA based on Pacific and Atlantic SST in DJF. In most climate models, this simple scheme can predict AZM events with an ACC above 0.5 during ENSO years. We will discuss to what extent these insights may help in the prediction of real-world AZM events.

How to cite: Richter, I., Tozuka, T., Kosaka, Y., Kido, S., and Tokinaga, H.: Exploring 6-month lead predictability of the Atlantic zonal mode in CMIP6, EGU General Assembly 2024, Vienna, Austria, 14–19 Apr 2024, EGU24-14029, https://doi.org/10.5194/egusphere-egu24-14029, 2024.

EGU24-14272 | ECS | Orals | OS1.3

Anomalous Seawater Radiocarbon Depletion Event during Glacial Interval in the Equatorial Indian Ocean Thermocline 

Sanjit Kumar Jena, Ravi Bhushan, Partha Sarathi Jena, Nisha Bharti, Sudheer Athiyarath Krishnan, Ajay Shivam, and Ankur Dabhi

The role of intermediate water mass in ocean circulation is well acknowledged from the global oceanographic and climatic perspectives. Abnormal depletions in the upper oceanic radiocarbon concentrations during the last deglaciation have been attributed to the southern ocean sourced aged CO2 ventilations via Antarctic intermediate waters. However, the fundamental origin and nature of the source, and its spatio-temporal variability still remains a question.

The present study reconstructs the radiocarbon records of the upper Equatorial Indian Ocean (EIO) over the last 44 ka using the radiocarbon dating of depth-specific planktonic foraminifers. The results reveal an extremely depleted radiocarbon interval in the EIO thermocline between 25-34 ka during the Marine Isotopic Stage 3 – Marine Isotopic Stage 2 (MIS3-MIS2) transition. The Reunion hotspot and/or the Amsterdam Island appear to be the responsible source(s) of contemporaneous hydrothermal dead carbon supply into the EIO thermocline. However, the deglacial thermocline radiocarbon depletions were primarily caused by the southern ocean sourced aged CO2 ventilations only. The radiocarbon records also indicate a well stratified upper oceanic condition prevailing over the EIO during the last 44 ka.

How to cite: Jena, S. K., Bhushan, R., Jena, P. S., Bharti, N., Athiyarath Krishnan, S., Shivam, A., and Dabhi, A.: Anomalous Seawater Radiocarbon Depletion Event during Glacial Interval in the Equatorial Indian Ocean Thermocline, EGU General Assembly 2024, Vienna, Austria, 14–19 Apr 2024, EGU24-14272, https://doi.org/10.5194/egusphere-egu24-14272, 2024.

EGU24-14616 | ECS | Posters on site | OS1.3

Volcanic ash likely triggers N2 fixation in the Andaman Sea  

Himanshu Saxena, Deepika Sahoo, Ajayeta Rathi, Sipai Nazirahmed, Sanjeev Kumar, and Arvind Singh

Marine N2 fixation fuels the growth of primary producers, drives marine carbon export fluxes, and in turn, influence the Earth’s climate. While the Bay of Bengal is at least explored, the Andaman Sea, which is adjacent to the only active volcano of the south Asia and is separated from the Bay of Bengal by the Andaman and the Nicobar Islands to its west, has never been explored for its viability to N2 fixation. The warm and oligotrophic surface waters and suboxic subsurface waters of these two basins may provide suitable stimulus for N2 fixation. We investigated N2 fixation in the euphotic and the oxygen minimum zones of the Bay of Bengal and the Andaman Sea during the autumn inter-monsoon. We found that N2 fixation is about an order of magnitude higher in the surface waters of the Andaman Sea than the Bay of Bengal, attributable to the relatively high iron input associated with volcanic ash deposition in the Andaman Sea. We underscored that N2 fixation at the immediate sea surface (sampled manually through a bucket) is largely four times higher than the subsurface waters at 10 m depth (sampled through CTD) in the northeastern Indian Ocean. Our findings imply that the traditional CTD rosette sampling is unable to capture the surface N2 fixation activity, and therefore, previously reported N2 fixation rates in the global ocean are likely to be massively underestimated.

How to cite: Saxena, H., Sahoo, D., Rathi, A., Nazirahmed, S., Kumar, S., and Singh, A.: Volcanic ash likely triggers N2 fixation in the Andaman Sea , EGU General Assembly 2024, Vienna, Austria, 14–19 Apr 2024, EGU24-14616, https://doi.org/10.5194/egusphere-egu24-14616, 2024.

EGU24-15235 | ECS | Posters on site | OS1.3

Bayesian optimization of ocean mixed layer parameterizations 

Marta Mrozowska, Markus Jochum, James Avery, Ida Stoustrup, and Roman Nuterman

Global climate is highly sensitive to tropical sea surface temperature. Accurately representing the tropical SST remains a significant challenge for general circulation and climate models. One of the largest sources of uncertainty is the vertical turbulent mixing. To accurately represent the distribution of ocean mixed layer depths, turbulence closure schemes necessitate careful tuning. This is most commonly done manually by comparing with mixed layer depth climatologies. Advancements in machine learning research introduce a new strategy: automated tuning. Veropt, an add-on to the python ocean model Veros, uses Gaussian processes to emulate an objective function in a multi-dimensional parameter space. We present a surprising combination of changes to the default parameters of the commonly used turbulent kinetic energy (TKE) closure scheme that minimise the model bias in tropical mixed layer depth.

How to cite: Mrozowska, M., Jochum, M., Avery, J., Stoustrup, I., and Nuterman, R.: Bayesian optimization of ocean mixed layer parameterizations, EGU General Assembly 2024, Vienna, Austria, 14–19 Apr 2024, EGU24-15235, https://doi.org/10.5194/egusphere-egu24-15235, 2024.

EGU24-17728 | ECS | Orals | OS1.3

Merging Process of the Great Whirl and the Socotra Gyre in 2019 

Lingxing Dai, Xingwei Jiang, Yifan Xia, Minyang Wang, Shilin Tang, and Yan Du

The Great Whirl (GW) and the Socotra Gyre (SoG), two prominent anticyclonic eddies in the western Arabian Sea, exhibit strong dynamic interactions. This study reports a case of the merging of the GW and the SoG recorded by Argo floats in September 2019. Combined with satellite observations and a state-of-the-art ocean reanalysis, we show that the merging process was first detected at the subsurface layer (~150 m depth) rather than the surface. As the original water inside the GW is cooler than the SoG, the merging created a baroclinic structure between the eddies. The density gradients associated with the baroclinic structure drive strong subsurface geostrophic currents following the thermal wind relationship, leading to the fast merging at 100-200 m depth. Energy analysis shows that the predominant energy source for the merged eddy was the barotropic and baroclinic instability. The dissipative processes caused the rapid decay of the merged eddy. The merging process induced sub-mesoscale activities and promoted ocean vertical exchanges south of Socotra Island.

How to cite: Dai, L., Jiang, X., Xia, Y., Wang, M., Tang, S., and Du, Y.: Merging Process of the Great Whirl and the Socotra Gyre in 2019, EGU General Assembly 2024, Vienna, Austria, 14–19 Apr 2024, EGU24-17728, https://doi.org/10.5194/egusphere-egu24-17728, 2024.

The tropical Indian Ocean presents a distinctive opportunity to investigate monsoon-induced changes in primary productivity and ocean hydrography. Planktic foraminifera, with their unique ecological preferences, are well-suited for reconstructing past environmental conditions. Different species of planktic foraminifera exhibit varied responses to changes in the physico-chemical parameters of the ambient water. This study presents a high-resolution planktic foraminiferal assemblage from the marine sediment core SSD004 GC03 for the last 24,000 years from the tropical Indian Ocean. The record includes 24 planktic foraminifera species with G. bulloides, G. glutinata, G. ruber, G. sacculifer, N. dutertrei and G. menardii  being the most abundant. The species are categorized into eutrophic, oligotrophic, mixed layer, and thermocline assemblages. Notably, during the last glacial maximum (LGM; 19.0-23.0 ka), a significant abundance of mixed layer assemblage is observed between 21.0-19.0 kyr. Heinrich stadial 1 (~15.0-18.0 ka) and the Younger Dryas (~11.-12.9 ka) periods exhibit a lower mixed layer assemblage and a higher thermocline assemblage. The Bølling-Allerød (~12.9-15.0 ka) period is characterized by a sudden increase in mixed-layer assemblages. The abundance of eutrophic species G. bulloides and G. glutinata during the LGM and Holocene indicates increased surface productivity influenced by the Northeast Monsoon and the strong Southwest Monsoon, respectively. The results underscore the unique and intricate dynamics of the studied region, primarily influenced by both the southwest and northeast monsoons.

How to cite: Rai, S. and Singh, D. P.: Planktic foraminifera reflects surface productivity and hydrographic changes in the tropical Indian Ocean during the last 24,000 years, EGU General Assembly 2024, Vienna, Austria, 14–19 Apr 2024, EGU24-17818, https://doi.org/10.5194/egusphere-egu24-17818, 2024.

EGU24-17832 | ECS | Posters on site | OS1.3

The Atlantic sibling: a reconciling vision on the nature of El Niño’s “little brother”  

Cosimo Enrico Carniel, Gian Luca Borzelli, Aniello Russo, and Sandro Carniel

The Atlantic Niño, also referred to as Atlantic zonal mode, equatorial Atlantic mode or, sometimes, El Niño’s little brother, is an important source of the year-to-year variability of the tropical Atlantic, consisting in an irregular oscillation of the Sea Surface Temperature (SST) in the eastern part of the basin. The physical mechanism underlying the activation of the oscillation is a matter of debate; some theories, termed dynamical, explain the Atlantic Niño as an ENSO-like phenomenon initiated by internal waves excited by the relaxation of easterly winds in the western tropical Atlantic and/or by the reflection of Rossby waves impinging the western Atlantic boundary. Some other theories, called thermodynamic, attribute the eastern tropical Atlantic SST variability to thermodynamic processes induced by off equatorial heat fluxes. Here, by using Sea Surface Height (SSH) data provided by orbiting altimeters and heat fluxes deduced from horizontal currents and Temperature-Salinity (TS) profiles provided by the Copernicus project, we show that, at least in the period Jan 1993-Dec 2021, both mechanisms were active and two sub-periods can be identified: the first, between Jan 1993 and Dec 2009, in which the eastern tropical Atlantic temperature variability can be explained reasonably well in terms of heat advected from the south by horizontal currents and, another period, between Jan 2010 and Dec 2021, in which the temperature variability of the eastern tropical Atlantic is explained by displacements of the thermocline induced by internal Kelvin waves propagating along the equatorial wave-guide. Finally, by using daily SST anomaly data over the period Jan 1940-Dec 2022, we show that the SST variability in the eastern tropical Atlantic and in the Angola-Benguela upwelling region are well correlated with each other with a lag slightly lower than a month and the SST in the Angola-Benguela region leading, suggesting a positive feedback between off equatorial heat availability and increasing SST in the eastern tropical Atlantic.

How to cite: Carniel, C. E., Borzelli, G. L., Russo, A., and Carniel, S.: The Atlantic sibling: a reconciling vision on the nature of El Niño’s “little brother” , EGU General Assembly 2024, Vienna, Austria, 14–19 Apr 2024, EGU24-17832, https://doi.org/10.5194/egusphere-egu24-17832, 2024.

EGU24-19767 | Orals | OS1.3 | Highlight

Impact of the Atlantic Niño on California Ecosystem predictability 

Belen Rodríguez-Fonseca, Mercedes Pozo, Jerome Fiechter, Steven Bograd, and Mike Jacox

The Atlantic Niño is the dominant mode of sea surface temperature variability in the tropical Atlantic at interannual time scales. In the last decades this mode of variability has been identified as a driver of the Pacific Niño, increasing its predictability. The mechanism involved in the relation between the Atlantic Niño and ENSO is through the modification of the Walker Cell, altering surface winds in the western Pacific and triggering oceanic kelvin waves. These kelvin waves propagate to the east in the equatorial Pacific and along the north and South American coasts, altering the structure of the water column. The impact of this teleconnection on eastern boundary current upwelling systems has not been analyzed so far. This work demonstrates, for the first time, the impact of the Atlantic Niño on physical and biogeochemical processes in the California Current ecosystem, by the alteration of wind-driven coastal upwelling and the modification of upwelled source water properties. The mechanism relates an Atlantic Niño with enhanced production due to the uplifting of isopycnals, which that supplies more nutrients to the euphotic zone and enhances primary production and subsequent vertical export and remineralization at depth. In addition, statistical prediction is performed, indicating strong predictability of California Current biogeochemical variability from the equatorial Atlantic anomalous SSTs more than one year ahead.


How to cite: Rodríguez-Fonseca, B., Pozo, M., Fiechter, J., Bograd, S., and Jacox, M.: Impact of the Atlantic Niño on California Ecosystem predictability, EGU General Assembly 2024, Vienna, Austria, 14–19 Apr 2024, EGU24-19767, https://doi.org/10.5194/egusphere-egu24-19767, 2024.

EGU24-1534 * | ECS | Orals | OS1.5 | Highlight

Increased future ocean heat uptake constrained by Antarctic sea ice extent 

Linus Vogt, Casimir de Lavergne, Lester Kwiatkowski, Jean-Baptiste Sallée, Thomas L. Frölicher, and Jens Terhaar

The ocean is the major sink of excess heat from anthropogenic climate change, and has so far prevented global warming from already surpassing the limits set by the Paris Agreement. This warming of the ocean impacts metabolic processes in marine species and causes sea level rise, more frequent extreme events, and ocean deoxygenation. The current generation of Earth system models has large uncertainties in projections of historical and future ocean heat uptake. Reducing this uncertainty is paramount for informing climate mitigation and adaptation measures.
Here we demonstrate that the amount of future global ocean heat uptake is strongly linked to present day Antarctic sea ice extent, so that satellite observations of sea ice can be used to reduce the uncertainty of future ocean heat uptake. Antarctic sea ice extent serves as an indicator of the baseline climate state of the Southern Ocean, and is linked to ocean heat uptake through hemispheric-scale cloud feedbacks. Climate models typically simulate insufficient Antarctic sea ice, a warm bias in Southern Ocean surface temperatures and insufficient Southern Hemisphere low cloud concentrations, negatively biasing future ocean heat uptake. Using present day Antarctic sea-ice extent observations as an emergent constraint allows to reassess the cumulative ocean heat uptake from 2024 to 2100 under a high-emissions scenario, yielding an increased estimate with reduced uncertainty of 2596 ± 216 ZJ.
Our findings indicate that ocean heat uptake and its associated impacts will likely be greater than previously estimated, and underline the climatic significance of recent observed changes in Antarctic sea ice, which may foreshadow changes in oceanic and atmospheric warming rates.

How to cite: Vogt, L., de Lavergne, C., Kwiatkowski, L., Sallée, J.-B., Frölicher, T. L., and Terhaar, J.: Increased future ocean heat uptake constrained by Antarctic sea ice extent, EGU General Assembly 2024, Vienna, Austria, 14–19 Apr 2024, EGU24-1534, https://doi.org/10.5194/egusphere-egu24-1534, 2024.

EGU24-1702 | ECS | Posters on site | OS1.5

The Effects of Mesoscale Eddies on Southern Ocean Carbon and Biogeochemistry 

Lydia Keppler, Matthew Mazloff, Ariane Verdy, Sarah Gille, Lynne Talley, Yassir Eddebbar, Veronica Tamsitt, and Nicola Guisewhite

The Southern Ocean modulates global biogeochemical (BGC) cycles substantially, affecting biological production and the global air-sea balance of carbon dioxide and interior dissolved oxygen content. Concurrently, the Southern Ocean is rich in highly dynamic mesoscale eddies. These eddies have the potential to alter local carbon, nutrient, and oxygen distributions through eddy pumping, stirring, and trapping. Additionally, the strong westerly winds could result in significant eddy-induced Ekman pumping counteracting the eddy pumping effects. However, the impact of mesoscale eddies on upper-ocean Southern Ocean biogeochemistry has not been quantified observationally at a regional scale.

We now have nearly a decade of BGC observations from Argo floats deployed as part of the Southern Ocean Carbon and Climate Observations and Modeling project (SOCCOM). In addition, the Mesoscale Eddy Trajectory Atlas, version 3.2, delayed time (Meta3.2DT) database provides us with a robust assessment of eddies as detected by satellite altimeter measurements. Together, the two datasets allow us to investigate the three-dimensional structure of the biogeochemistry in Southern Ocean eddies. Here, we co-locate Southern Ocean eddies with BGC Argo floats to characterize composite vertical and horizontal structures of dissolved inorganic carbon (DIC), oxygen, and nitrate inside anticyclonic and cyclonic eddies compared to the mean climatological fields. We conduct this analysis in several subregions with different dominant processes. We find positive DIC and nitrate anomalies in cyclonic eddies, which we attribute to upward eddy pumping. We also find positive oxygen anomalies near the surface, which we attribute to upwelled nutrients that enhance biological production, leading to enhanced photosynthesis. At depth, we find negative oxygen anomalies in cyclonic eddies, which may be driven both by enhanced respiration due to increased biological production as well as the heaving of isopycnals via eddy pumping. The opposite is true for anticyclonic eddies due to downward eddy pumping (negative DIC and nitrate anomalies; negative oxygen anomalies near the surface and positive oxygen anomalies at depth). The magnitudes of the eddy imprints on biogeochemistry vary by region, indicating that stratification and other background signals influence the magnitude of the effect of eddies in a region. Our findings can help us to interpret the influence of mesoscale eddies on the Southern Ocean carbon fluxes and biogeochemistry, including assessing the relative dominance of eddy pumping and eddy-induced Ekman pumping in different subregions of the Southern Ocean.

How to cite: Keppler, L., Mazloff, M., Verdy, A., Gille, S., Talley, L., Eddebbar, Y., Tamsitt, V., and Guisewhite, N.: The Effects of Mesoscale Eddies on Southern Ocean Carbon and Biogeochemistry, EGU General Assembly 2024, Vienna, Austria, 14–19 Apr 2024, EGU24-1702, https://doi.org/10.5194/egusphere-egu24-1702, 2024.

EGU24-3332 | ECS | Posters on site | OS1.5

Comparing float pCO2 profiles in the Southern Ocean to ship data reveals discrepancies 

Chuqing Zhang, Yingxu Wu, Peter J. Brown, David Stappard, Amavi N. Silva, and Toby Tyrrell

The Southern Ocean plays a crucial role in the global carbon cycle. Recently, the utilization of biogeochemical (BGC) Argo float data has provided valuable insights into the uptake and release of carbon dioxide (CO2) by this region. However, significant uncertainty remains regarding the accuracy of pCO2 (partial pressure of CO2) values derived from float data. In this study, we compared pCO2 estimates obtained from float pH data with those from ship-collected data across the Southern Ocean, employing pCO2-depth, pCO2-O2 and CO2-O2 vssaturation plots to assess the degree of agreement between these two datasets. Our findings reveal significant systematic differences. A preliminary analysis, ignoring other factors, found that the float data is consistently higher, on average, than the ship data at equivalent depths and oxygen levels. We tested the hypothesis that inaccurate float pH data or float pCO2 correction process is the main cause of the pCO2 difference, by quantifying other factors that could produce systematic differences, including: (i) spatial sampling bias, (ii) seasonal bias, (iii) errors in estimated alkalinity, (iv) errors in carbonate system constants, and (v) higher levels of anthropogenic CO2 in float data. However, none of the other factors were found to be able to fully account for the discrepancies, suggesting issues with float pH data quality and/or the float pCO2 correction process. Additional analysis included refinements to ship-based and float-based pCO2 before intercomparison. Overall, we estimate that, in the Southern Ocean, surface pCO2 from floats is biased high by, on average, at least 10 μatm.

How to cite: Zhang, C., Wu, Y., Brown, P. J., Stappard, D., Silva, A. N., and Tyrrell, T.: Comparing float pCO2 profiles in the Southern Ocean to ship data reveals discrepancies, EGU General Assembly 2024, Vienna, Austria, 14–19 Apr 2024, EGU24-3332, https://doi.org/10.5194/egusphere-egu24-3332, 2024.

EGU24-3601 | ECS | Posters on site | OS1.5

Deep winter mixed layer anchored by the meandering Antarctic Circumpolar Current: Cross-basin variations 

Zihan Song, Shang-Ping Xie, Lixiao Xu, Xiao-Tong Zheng, Xiaopei Lin, and Yu-Fan Geng

The Southern Ocean features some of the deepest winter mixed layers on Earth, crucial for water mass formation and the storage of anthropogenic heat. The winter mixed layer depth (MLD) significantly varies across basins, exceeding 300 m in the Indian and Pacific sectors but less than 150 m in the Atlantic. Current climate models simulate a distribution that is too broad and struggle to accurately represent this inter-basin variation. Using observational data and a global atmospheric model, this study investigates the contribution of surface buoyancy flux and background stratification to inter-basin MLD variations.

The surface heat flux is decomposed into broad-scale and frontal-scale variations, both of which are influenced by the Antarctic Circumpolar Current’s (ACC) structure. At the broad-scale, the meandering ACC path is accompanied by a zonal wavenumber-1 structure of sea surface temperature with a warmer Pacific than Atlantic; under the prevailing westerly winds, this temperature contrast results in larger surface heat loss facilitating deeper MLD in the Indian and Pacific than the Atlantic. At the frontal-scale, intensified ACC fronts in the Indian sector further strengthen heat loss to the north. Surface freshwater flux pattern largely follows that of evaporation and reinforces the heat flux pattern, especially in the southeast Pacific.

Background stratification also significantly varies across the Southern Ocean, influencing MLD pattern. In the Atlantic and western Indian oceans where the ACC is at a low latitude (45°S), solar heating, intrusions of subtropical gyres and energetic mesoscale eddies together maintain strong stratification. In the southeast Pacific, in comparison, the ACC reaches its southernmost latitude (56°S), far away from the Subtropical Front. This creates a weaker stratification that allows deep mixed layers to form.

How to cite: Song, Z., Xie, S.-P., Xu, L., Zheng, X.-T., Lin, X., and Geng, Y.-F.: Deep winter mixed layer anchored by the meandering Antarctic Circumpolar Current: Cross-basin variations, EGU General Assembly 2024, Vienna, Austria, 14–19 Apr 2024, EGU24-3601, https://doi.org/10.5194/egusphere-egu24-3601, 2024.

EGU24-3930 | ECS | Orals | OS1.5 | Highlight

Emergent constraint on future anthropogenic carbon and excess heat uptake in the Southern Ocean 

Timothée Bourgeois, Nadine Goris, Jörg Schwinger, and Jerry F. Tjiputra

The Southern Ocean is a major sink of anthropogenic carbon and excess heat. In this region, the Earth system model projections of these sinks provided by the CMIP5 and CMIP6 scenario experiments show a large model spread. This contributes significantly to the large uncertainties in the overall climate sensitivity and remaining carbon budgets for ambitious climate targets. Hence, a reduction in the uncertainty of the future Southern Ocean carbon and heat sinks is urgently needed.

Globally, Bronselaer and Zanna (2020) identified an emergent coupling between anthropogenic carbon and excess heat uptake, highlighting that the passive-tracer behavior of these two quantities is dominant under high-emissions scenarios. This coupling indicates that the use of a single observational constraint might be sufficient to reduce projection uncertainties in both anthropogenic carbon and excess heat uptake. Here, we use this approach for the northern limb of the Southern Ocean (30°S-55°S) where the subduction of intermediate and mode water is known to drive carbon and heat uptake. We found that, in this region, the variations in the models’ contemporary water-column stability over the first 2000 m is highly correlated to both their future anthropogenic carbon uptake and excess heat uptake efficiency. Using observational data of water-column stability, we reduce the uncertainty of future estimates of (1) the cumulative anthropogenic carbon uptake by up to 53% and (2) the excess heat uptake efficiency by 28%. Independent studies have found similar constraints in the Southern Ocean and globally, strengthening our findings (Liu et al., 2023; Newsom et al., 2023; Terhaar et al., 2021, 2022), and pinpointing that a better representation of water-column stratification in Earth system models is essential to improve future anthropogenic climate change projections.

Bourgeois, T., Goris, N., Schwinger, J., and Tjiputra, J. F.: Stratification constrains future heat and carbon uptake in the Southern Ocean between 30°S and 55°S, Nat Commun, 13, 340, https://doi.org/10.1038/s41467-022-27979-5, 2022.

Bronselaer, B. and Zanna, L.: Heat and carbon coupling reveals ocean warming due to circulation changes, Nature, 584, 227–233, https://doi.org/10.1038/s41586-020-2573-5, 2020.

Liu, M., Soden, B. J., Vecchi, G. A., and Wang, C.: The Spread of Ocean Heat Uptake Efficiency Traced to Ocean Salinity, Geophys. Res. Lett., 50, e2022GL100171, https://doi.org/10.1029/2022GL100171, 2023.

Newsom, E., Zanna, L., and Gregory, J.: Background Pycnocline Depth Constrains Future Ocean Heat Uptake Efficiency, Geophys. Res. Lett., 50, e2023GL105673, https://doi.org/10.1029/2023GL105673, 2023.

Terhaar, J., Frölicher, T. L., and Joos, F.: Southern Ocean anthropogenic carbon sink constrained by sea surface salinity, Sci. Adv., 7, eabd5964, https://doi.org/10.1126/sciadv.abd5964, 2021.

Terhaar, J., Frölicher, T. L., and Joos, F.: Observation-constrained estimates of the global ocean carbon sink from Earth system models, Biogeosciences, 19, 4431–4457, https://doi.org/10.5194/bg-19-4431-2022, 2022.

How to cite: Bourgeois, T., Goris, N., Schwinger, J., and Tjiputra, J. F.: Emergent constraint on future anthropogenic carbon and excess heat uptake in the Southern Ocean, EGU General Assembly 2024, Vienna, Austria, 14–19 Apr 2024, EGU24-3930, https://doi.org/10.5194/egusphere-egu24-3930, 2024.

Subantarctic Mode Water is a water mass with nearly vertically homogeneous physical properties in the Southern Ocean, which exhibits variability at various time scales. This study investigates the low-frequency variability of upper-ocean temperature in the Central Pacific Subantarctic Mode Water (CPSAMW) formation region since the 1980s using an eddy-resolving ocean model and two observation-based products. It is found that the CPSAMW core layer temperature has significant low-frequency variability, with an unusually cold period around 2000 and warm periods around 2005 and 2015, respectively. This low-frequency variability is closely related to the change in local mixed layer temperature, which in turn is mainly attributed to the change in surface latent heat flux resulting from the change in wind speed. Further analysis indicates that the low-frequency variability of wind speed in the CPSAMW formation region is dominated mainly by the Interdecadal Pacific Oscillation (IPO) and to a lesser extent by the Southern Annular Mode (SAM). This study reveals the relationship in the low-frequency variability of CPSAMW temperature with the IPO and SAM, and provides insight into the remote influence of Pacific decadal variability on SAMW variability.

How to cite: Jing, W., Luo, Y., and Zhang, R.: Low-frequency variability of upper-ocean temperature in the Central Pacific Subantarctic Mode Water formation region since the 1980s, EGU General Assembly 2024, Vienna, Austria, 14–19 Apr 2024, EGU24-4301, https://doi.org/10.5194/egusphere-egu24-4301, 2024.

EGU24-5853 | ECS | Posters on site | OS1.5

A physiological approach to parameterising variable Diatom Si:N ratios using a quota model to reproduce nutrient addition experiments in the Southern Ocean 

Jacob Harper, Mark Moore, Ben Ward, Adrian Martin, and Toby Tyrrell

The Si:N ratio of diatoms in the Southern Ocean (SO) is increased in response to iron limitation resulting in enhanced removal of Si from the surface waters that are entrained into the Subantarctic Mode Water (SAMW) leaving it Si deficient. Biogeochemical models usually employ direct parameterisations to represent this phenomenon empirically, however minor differences in how this process is parameterised can lead to large disparities in model results due to the large influence of SAMW on productivity in the lower latitudes. We explore the complexities of parameterisation using data from a recent cruise of the ‘Carbon Uptake and Seasonal Traits in Antarctic Remineralisation Depth’ (CUSTARD) project. This project undertook a series of factorial nutrient addition experiments including Fe, Mn and Si, along 89° W between 54° S and 59.99° S. Experimental results reinforced that Si:N ratio is dependent not only on Fe but also Si availability. To properly reproduce this data, a quota model was altered to allow phytoplankton to uptake and store luxury quantities of nutrients to then be used for growth from internal pools. This model was able to successfully reproduce quantitative patterns of nutrient limitation and the Fe-Si dependency of diatom Si:N ratios through an explicit physiological approach without the need for a direct parameterisation. Such methodology is both more authentic to the natural control of diatom stoichiometry and may avoid the potential for artificial responses created by direct parameterisations.

How to cite: Harper, J., Moore, M., Ward, B., Martin, A., and Tyrrell, T.: A physiological approach to parameterising variable Diatom Si:N ratios using a quota model to reproduce nutrient addition experiments in the Southern Ocean, EGU General Assembly 2024, Vienna, Austria, 14–19 Apr 2024, EGU24-5853, https://doi.org/10.5194/egusphere-egu24-5853, 2024.

EGU24-6438 | ECS | Orals | OS1.5

The Evolving Relative Role of Stratospheric Ozone and Greenhouse Gasses in Modifying the Southern Ocean Carbon Sink from 1950-2100 

Tereza Jarníková, Corinne Le Quéré, Steven Rumbold, and Colin Jones

Southern Ocean winds have strengthened and moved poleward in the latter half of the 20th century, which has been attributed to the depletion of stratospheric ozone and to climate warming from rising greenhouse gas concentrations. Both ozone recovery and changing greenhouse gas concentrations are expected to continue modulating wind structure throughout the 21st century. Here, we quantify the relative roles of ozone and greenhouse gases on Southern Ocean wind structure from 1950-2100 using the UK Earth System Model (UKESM1) model output, with a combination of three scenarios of ozone and two scenarios of greenhouse gas evolution. Both ozone depletion and increases in greenhouse gas concentration act to increase wind speed over the Southern Ocean. The influence of ozone is predominant in summer winds, while the influence of greenhouse gases acts in all seasons. We show that wind speeds return close to their original levels by the end of the 21st century under a low-greenhouse gas scenario with ozone recovery. The influence of ozone on wind speed was dominant in the 1950-2000 time-period, but not in the 21st century when the influence of greenhouse gases becomes two to three times larger than that of ozone, even in the low emissions scenario. We find significant effects of both ozone scenario and greenhouse gas emissions on physical-oceanographic variables (sea surface temperature, mixed layer depth, and overturning circulation). Finally, we quantify the relative contributions of these physical changes to the evolving carbon sink of the Southern Ocean, and discuss how wind-induced physical changes can alter ecosystem processes and the associated carbon export to the deep ocean.

How to cite: Jarníková, T., Le Quéré, C., Rumbold, S., and Jones, C.: The Evolving Relative Role of Stratospheric Ozone and Greenhouse Gasses in Modifying the Southern Ocean Carbon Sink from 1950-2100, EGU General Assembly 2024, Vienna, Austria, 14–19 Apr 2024, EGU24-6438, https://doi.org/10.5194/egusphere-egu24-6438, 2024.

EGU24-7355 | ECS | Posters on site | OS1.5

Coupled atmosphere-sea-ice-ocean feedback accelerates rapid sea ice decline in Weddell Sea in high-resolution global climate model 

Dae-Won Kim, Thomas Jung, Navajyoth Puthiyaveettil, Wonsun Park, Tido Semmler, Axel Timmermann, and Martina Zapponini

Sea ice extent around the Antarctic exhibits a high level of variability on interannual and longer timescales, characterized by a positive trend since the satellite era and interruptions due to e.g., the emergence of the Maud Rise Polynya in 2016. Given the relatively short period of observational data and the high level of natural variability, it has remained challenging to unequivocally identify the anthropogenic fingerprint in Antarctic sea ice. Moreover, to properly study the Antarctic sea ice and its response to future warming, it is necessary to capture important dynamics, such as polynyas, the Antarctic slope current, and coastal leads. Many models within the CMIP6 model portfolio do not even have the spatial resolution to adequately resolve these features. This implies that their Antarctic projections may not be as trustworthy and robust as those for the Arctic Ocean.

In this study we employ the high-resolution OpenIFS-FESOM (AWI-CM3) coupled general circulation (nominally 30 km atmosphere and 4-25 km ocean resolutions) to investigate the Antarctic sea ice response to greenhouse warming, following a SSP5-8.5 greenhouse gas emission scenario. Our simulation exhibits a sudden decline of Antarctic sea ice in the Weddell Sea (WS) which can be explained by a combination of physical processes that involve continued strengthening of westerlies, increased atmosphere-ocean momentum transfer due to sea ice decline, a spin-up of the Weddell-Sea Gyre and slope current and corresponding vertical and horizontal supply of heat into the Weddell Sea. The resulting decrease of sea ice further leads to heat accumulation in austral summer due to the absorption of short-wave radiation, which can further weaken winter sea ice extent and intensify the momentum transfer and associated heat transport into the Weddell Sea gyre.  

Our study highlights the relevance of positive atmosphere-sea ice-ocean feedbacks in triggering the abrupt decline in Antarctic sea ice.  

How to cite: Kim, D.-W., Jung, T., Puthiyaveettil, N., Park, W., Semmler, T., Timmermann, A., and Zapponini, M.: Coupled atmosphere-sea-ice-ocean feedback accelerates rapid sea ice decline in Weddell Sea in high-resolution global climate model, EGU General Assembly 2024, Vienna, Austria, 14–19 Apr 2024, EGU24-7355, https://doi.org/10.5194/egusphere-egu24-7355, 2024.

EGU24-7520 | ECS | Posters on site | OS1.5

Intensification of the Antarctic slope current due to freshwater forcing in a warmer climate 

Myeong-Hyeon Kim, Gyuseok Yi, June-Yi Lee, Axel Timmermann, Wonsun Park, and Sun-Seon Lee

The Antarctic slope current (ASC) flows westward along the Antarctic coastlines and influences heat exchange across the Antarctic continental shelf. Therefore, it could play an important role in regulating the Southern Ocean circulation by affecting processes such as ice melting and water mass formation. However, clarifying the mechanism and change of ASC in future climate using high-resolution climate model is still challenging. We showthat ASC is projected to accelerate in response to CO2 increases by comparing present-day and CO2 increased simulations (2×CO2 and 4×CO2)conducted with the fully coupled ultra-high-resolution Community Earth System Model. The intensification of ASC was attributable to an increase in the gradient of sea surface height due to a decrease in salinity through geostrophic balance. This freshening was dominated by sea ice melting, while increases in runoff and precipitation minus evaporation played a minor role with regional and seasonal dependence. These results increased understanding about the future change of ASC using high-resolution simulations and have important implications for changes in mesoscale ocean circulation and the climate of Southern Ocean.

How to cite: Kim, M.-H., Yi, G., Lee, J.-Y., Timmermann, A., Park, W., and Lee, S.-S.: Intensification of the Antarctic slope current due to freshwater forcing in a warmer climate, EGU General Assembly 2024, Vienna, Austria, 14–19 Apr 2024, EGU24-7520, https://doi.org/10.5194/egusphere-egu24-7520, 2024.

EGU24-9682 | Orals | OS1.5 | Highlight

The Imprint of Sea Ice Cover on the Biological Carbon Pump in the Southern Ocean 

Moritz Holtappels and Marwa Baloza

The Seasonal Ice Zone (SIZ) around Antarctica covers an area of 16 Mio km2 and is considered the largest biogeochemical province in the Southern Ocean. Despite a well-documented control of sea ice on primary production, its large-scale effect on the biological carbon pump, i.e. the sinking of organic carbon into deep waters and ultimately to the sediments, remains poorly constrained. Here we demonstrate that the degree of sea ice cover during the growth season is a strong predictor for carbon remineralization rates in underlying sediments. We compiled the available benthic rate measurements for the SIZ and found that more than 80% of the variability can be explained by only two environmental factors: long-term occurrence of moderate sea ice cover in the summer season, and water depth. The empirical model was used to map the benthic carbon remineralization for the entire SIZ, showing elevated rates especially at the Antarctic Peninsula and the Amundsen Sea in West Antarctica, and the D’Urville Sea, Davis Sea and Prydz Bay in East Antarctica. Altogether, benthic remineralization in the entire SIZ summed up to 46 Tg C per year, of which 71% can be assigned to shelf sediments. Applying an empirical function for the burial rate, the total organic carbon supply to the sediments was estimated to be 52 Tg C per year and the carbon export from the euphotic zone (<100m) was calculated to be ~500 Tg C per year. In summary, the results illustrate the dominant influence of sea ice dynamics on the biological carbon pump and suggest that anticipated changes in Antarctic sea ice will have a significant effect on the biological carbon sequestration in the Southern Ocean.

How to cite: Holtappels, M. and Baloza, M.: The Imprint of Sea Ice Cover on the Biological Carbon Pump in the Southern Ocean, EGU General Assembly 2024, Vienna, Austria, 14–19 Apr 2024, EGU24-9682, https://doi.org/10.5194/egusphere-egu24-9682, 2024.

EGU24-9949 | ECS | Posters on site | OS1.5

Long-term temperature trends in Antarctic water masses across the New Zealand–Antarctica chokepoint  

Antonino Ian Ferola, Yuri Cotroneo, Giorgio Budillon, Pasquale Castagno, Pierpaolo Falco, Giannetta Fusco, Enrico Zambianchi, and Giuseppe Aulicino

A 29-year time series of summer Expendable Bathythermographs (XBT) data collected along the New Zealand-Antarctica 'chokepoint' of the Antarctic Circumpolar Current (ACC) was used to analyse the temperature variability of the surface and intermediate layers of the Southern Ocean (SO) from 1994 to 2023. Our findings confirm previous studies, showing an overall warming of the SO over the past 30 years and that the northernmost portion of the ACC exhibits significant warming, while areas south of the Polar Front experience no significant temperature trends.
Additionally, as different masses across the Antarctic Circumpolar Current can be representative of different regions of the SO on a variety of spatial and temporal scales, we focused on the estimation of the temperature trend associated. Our analysis reveals strong warming trends of approximately 0.27°C/decade and 0.13°C/decade respectively for Sub Antarctic Mode Water - SAMW and Antarctic Intermediate Water - AAIW over the study period, while Antarctic Surface Water - AASW and Circumpolar Deep Water - CDW show negligible and/or not significant trends.

How to cite: Ferola, A. I., Cotroneo, Y., Budillon, G., Castagno, P., Falco, P., Fusco, G., Zambianchi, E., and Aulicino, G.: Long-term temperature trends in Antarctic water masses across the New Zealand–Antarctica chokepoint , EGU General Assembly 2024, Vienna, Austria, 14–19 Apr 2024, EGU24-9949, https://doi.org/10.5194/egusphere-egu24-9949, 2024.

EGU24-10622 | ECS | Orals | OS1.5

 Reconstructing the 2003-2022 Sea Level Anomalies field in ice-covered regions of the Southern Ocean 

Cosme Mosneron Dupin, Jean-Baptiste Sallée, Pierre Veillard, Casimir de Lavergne, Pierre Prandi, and Yannice Faugère

Despite its pivotal role in the climate system, subpolar circulation in the Southern Ocean remains poorly observed, primarily owing to the physical limitations of conventional satellite altimetry in ice-covered regions. However, recent progress in processing methods now enables precise SLA (Sea Level Anomalies) estimations within sea-ice fractures and leads.

Thanks to these advances, previous studies were able to construct altimetry maps with a complete Southern Ocean coverage over the period 2011-2019. It allowed for the quantification of its full SLA seasonal cycle. Here, we introduce a novel SLA product that encompasses both open and ice-covered oceanic domains, and covers a larger temporal expanse amounting to two decades (2003-2022). Employing an optimal interpolation approach, multiple satellite missions, namely Envisat, Cryosat, SARAL/AltiKa, and Sentinel-3, are combined together, improving spatial resolution and increasing temporal range. A newly developed algorithm ensures the seamless continuity of observations, bridging the observational disconnect between open-ocean and leads data points.

The robustness of the derived SLA product is corroborated against in-situ data from moorings and bottom pressure recorders. The observed seasonal cycle aligns consistently with the existing literature. Overall, the temporal extent of this dataset provides, for the first time, the opportunity to investigate the interannual variability of the whole Southern Ocean circulation through observational data.

How to cite: Mosneron Dupin, C., Sallée, J.-B., Veillard, P., de Lavergne, C., Prandi, P., and Faugère, Y.:  Reconstructing the 2003-2022 Sea Level Anomalies field in ice-covered regions of the Southern Ocean, EGU General Assembly 2024, Vienna, Austria, 14–19 Apr 2024, EGU24-10622, https://doi.org/10.5194/egusphere-egu24-10622, 2024.

EGU24-10878 | Posters on site | OS1.5

Water Mass Changes and Carbon Uptake by Subantarctic Pacific Waters 

Maribel I. García-Ibáñez, Paula C. Pardo, Peter J. Brown, Gareth Lee, Adrian Martin, Sophy Oliver, Katsia Pabortsava, Pablo Trucco-Pignata, and Dorothee C.E. Bakker

The Southern Ocean (SO) is a critical component of the global carbon cycle, acting as a significant sink for atmospheric carbon dioxide (CO2). Understanding the intricate processes governing CO2 uptake in the SO is paramount for comprehending the global carbon budget and predicting future climate scenarios. Recent observations suggest that changes in SO water masses, driven by climate-induced alterations in temperature and circulation patterns, can significantly impact CO2 uptake. Understanding these feedbacks is crucial for predicting the SO's future role as a carbon sink and its broader implications for climate mitigation efforts. In this work, we determine changes in the water mass composition and their characteristics, including their CO2 content, along the CUSTARD transect (54ºS-59ºS 90ºW) in Subantarctic Pacific waters. The CUSTARD transect crosses a region of formation of mode and intermediate waters. We use an extended Optimum Multiparameter (eOMP) analysis and data from three repeats of the CUSTARD transect in 1993 (expocode 316N19930222; data from GLODAPv2.2023), 2005-2006 (316N20050821 and 316N20060130; from GLODAPv2.2023), and 2019-2020 (74EQ20191202; the CUSTARD cruise). We observe isopycnal heaving in the southern part of the transect from 1993 to 2020. In the upper ocean (neutral density (γn) < 27.2 kg m-3), isopycnal heaving is linked to a temperature decrease of up to -2ºC and a salinity decrease of up to -0.15 between 1993 and 2005, extending to γn < 27.5 kg m-3 in 2019-2020. The physicochemical changes in the upper ocean are linked to changes in the water mass composition, including an increase in the volume of Antarctic Surface Water and Antarctic Intermediate Water and a decrease in the volume of SubAntarctic Mode Water over the 18-year study period. These water mass changes are accompanied by decreases in concentrations of oxygen, dissolved nutrients, and total alkalinity, along with an increase in total dissolved inorganic carbon of up to 40 µmol kg-3  for γn < 27.5 kg m-3 from 1993 to 2019-2020. For 27.5 kg m-3 < γn <28.2 kg m-3, salinity increased by 0.05 from 1993 to 2005 and by 0.15 over the 18-year studied period in the southern part of the transect. This salinity increase extends northward in 2019-2020. These changes in salinity are linked to an increase in Circumpolar Deep Water volume. In the deep layer (γn > 28.2 kg m-3), Ross Sea Bottom Water replaces Adélie Bottom Water from 1993 to 2019-2020. The changes in water mass composition observed along the CUSTARD transect indicate circulation variations linked to the Southern Annular Mode (SAM), with a prevalent positive phase since 1995. Positive SAM pahses increase upwelling south of the Antarctic Polar Front and downwelling in the Subantarctic Zone. Due to these circulation changes, the SO’s uptake of atmospheric CO2 decreases during positive SAM phases, which are predicted to intensify with climate change.

How to cite: García-Ibáñez, M. I., Pardo, P. C., Brown, P. J., Lee, G., Martin, A., Oliver, S., Pabortsava, K., Trucco-Pignata, P., and Bakker, D. C. E.: Water Mass Changes and Carbon Uptake by Subantarctic Pacific Waters, EGU General Assembly 2024, Vienna, Austria, 14–19 Apr 2024, EGU24-10878, https://doi.org/10.5194/egusphere-egu24-10878, 2024.

EGU24-11356 | Posters on site | OS1.5

Stronger Southern Ocean carbon uptake in high-resolution ocean biogeochemistry simulations 

Lavinia Patara, Judith Hauck, Jan Klaus Rieck, Malin Ödalen, Andreas Oschlies, and Özgür Gürses

It is increasingly recognized that the way Southern Ocean mesoscale eddies are represented in ocean models influences air-sea CO2 fluxes and their response to climate change. In this study, we assess the Southern Ocean carbon uptake since the 1960s in a hierarchy of global ocean biogeochemistry models (GOBMs) based on the NEMO-MOPS and FESOM-REcoM models. The horizontal resolutions of the GOBMs range from 1° and 0.5° resolutions (“eddy-parameterized”) to 0.25° and 0.1° resolutions (“eddy-rich”, where eddies are explicitly represented). We find that the “eddy-rich” models have steeper density surfaces across the ACC with respect to “eddy-parameterized” models, in better agreement with observations. A larger amount of deep waters low in anthropogenic carbon (Cant) is thereby transported to the surface, leading to a 10% higher Cant uptake and storage. Natural CO2 (Cnat), which integrated over the whole Southern Ocean is directed into the ocean, shows a somewhat higher ingassing in the “eddy-rich” models. As a result, the net CO2 uptake is about 14% higher in the “eddy-rich” with respect to the “eddy-parameterized” models. Trends over the 1958-2018 period reveal a gradual wind-driven reduction of Cnat uptake in all configurations, but this trend is about 40% weaker in the 0.1° model with respect to the lower resolution models. At the same time, the upward trend in the residual meridional overturning circulation (MOC) is weaker in the 0.1° model, supporting the hypothesis of a more pronounced “eddy-compensation” of the wind-driven Cnat trends. Our study suggests that GOBMs using standard eddy parameterizations may underestimate the net and anthropogenic CO2 uptake by about 10%, and emphasizes the importance of adequately simulating mesoscale eddies for better constraining the Southern Ocean carbon uptake in changing climate conditions.

How to cite: Patara, L., Hauck, J., Rieck, J. K., Ödalen, M., Oschlies, A., and Gürses, Ö.: Stronger Southern Ocean carbon uptake in high-resolution ocean biogeochemistry simulations, EGU General Assembly 2024, Vienna, Austria, 14–19 Apr 2024, EGU24-11356, https://doi.org/10.5194/egusphere-egu24-11356, 2024.

EGU24-12418 | ECS | Orals | OS1.5

The Weddell Sea atmospheric CO2 uptake: An overview of its seasonal cycle and relationship to sea ice 

Elise Droste, Mario Hoppema, Dorothee Bakker, Oliver Huhn, and Peter Landschützer

The Weddell Sea has previously been estimated to be a net atmospheric CO2 sink, transporting anthropogenic CO2 to deeper parts of the ocean. However, a paucity of spatial and temporal observational data coverage hinders a complete understanding of its (seasonal and interannual) variability, how it is affected by seasonal sea ice cover, and how it may change with rapidly changing Antarctic sea ice regimes. We provide a status overview of all available partial pressure CO2 (pCO2) observations and estimates in the Weddell Sea, including SOCAT, GLODAP, and SOCCOM float datasets. We identify a particular lack of data on the continental shelves. Floats fill the wintertime-gap by obtaining year-round data, but are restricted to the open ocean and water depths of at least 2000 m. The collated dataset illustrates a seasonal cycle for the Weddell Sea, in which the summertime CO2 uptake can be strong with a mean of -1.2 mol m2 yr-1, but extremely variable (± 2.2 mol m2 yr-1). Some of the summertime CO2 uptake is compensated by wintertime CO2 outgassing, particularly in the northern Weddell Sea where sea ice cover is lowest and wind speeds are high. We use additional reanalysis and observational data-based products to perform a further analysis of differences between subregions within the Weddell Sea. Results show that most regions have a strong seasonal cycle in the sea-air CO2 gradient, with mean amplitudes ranging between 27 µatm (Northern Weddell Sea) and 100 µatm (eastern Peninsula shelf regions). However, wintertime outgassing is largely restricted by sea ice cover in all regions. The central Weddell Sea seems to be a particularly important region for net CO2 uptake, which is partly explained by the timing of wintertime sea ice advance before the surface pCO2 oversaturates with respect to atmospheric CO2. These results imply that the timing of sea ice advance or retreat can have high impact on the net CO2 uptake of the Weddell Sea.

How to cite: Droste, E., Hoppema, M., Bakker, D., Huhn, O., and Landschützer, P.: The Weddell Sea atmospheric CO2 uptake: An overview of its seasonal cycle and relationship to sea ice, EGU General Assembly 2024, Vienna, Austria, 14–19 Apr 2024, EGU24-12418, https://doi.org/10.5194/egusphere-egu24-12418, 2024.

EGU24-12655 | ECS | Posters on site | OS1.5

Temporal scales of mesoscale eddy-induced horizontal and vertical transport of carbon, heat and oxygen in the Southern Ocean.  

Mariana Salinas-Matus, Nuno Serra, Fatemeh Chegini, and Tatiana Ilyina

The Southern Ocean (SO) has been identified as one of the most widespread mesoscale eddy fields observed in the ocean. However, historically in the SO, eddy effects on the carbon cycle have been poorly understood, especially quantitatively, due to sparse observations in the SO and limited computational resources restricting model resolution. Recently, the importance of representing mesoscale eddies in the SO for generating reliable transient simulations and global climate projections has been suggested. This work focuses on comprehending and quantifying the vertical and horizontal eddy-induced transport of carbon, heat, and oxygen in the upper ocean (first 300 m) across time scales ranging from inter-annual to high frequency. It aims to elucidate the impact of these processes on the ocean's uptake of carbon, heat, and oxygen. Studying these three components helps to distinguish  the role of biogeochemical and physical processes, due to the shared and distinct mechanisms that affect them. As the main tool, we used simulations made with the ocean component of the ICON model, coupled with the biogeochemical model HAMOCC. We employed a hierarchy of model resolutions, ranging from eddy-parameterized to eddy-resolved resolutions, to elucidate the role of representing eddies in facilitating/impeding air-sea fluxes.

How to cite: Salinas-Matus, M., Serra, N., Chegini, F., and Ilyina, T.: Temporal scales of mesoscale eddy-induced horizontal and vertical transport of carbon, heat and oxygen in the Southern Ocean. , EGU General Assembly 2024, Vienna, Austria, 14–19 Apr 2024, EGU24-12655, https://doi.org/10.5194/egusphere-egu24-12655, 2024.

EGU24-13132 | Posters on site | OS1.5

Variability in upper ocean properties around the South Orkney Islands, Antarctica 

Angelika Renner, Sebastian Menze, Elizabeth Jones, Emma Young, Sally Thorpe, and Eugene Murphy

The South Orkney Islands region is a highly productive environment situated between the Weddell Sea to the south and Scotia Sea to the north. Complex bathymetry around the island plateau strongly influences circulation and water mass exchanges. While the general, large-scale patterns in currents and hydrography are fairly well described, more detailed studies into spatial and temporal variability are mostly lacking, especially for the upper water column. In this study, we present hydrographic and ocean current observations from two surveys across the plateau conducted in January 2016 and 2019. The data confirm the dominant, topographically steered boundary current associated with the Weddell Front, which follows the continental slope around the southern edge of the South Orkney Plateau towards its northeastern side. During this passage, core characteristics of Weddell Sea water masses become eroded through interaction with other water masses. Where the Weddell Front first meets the plateau on its western side, large variability in currents is observed, possibly due to eddy activity and likely promoting mixing and water mass transformation. Differences in water mass characteristics between the two years are likely related to very different climatic conditions in the months prior to the surveys with opposing sea ice states, and large differences in regional winds, and air and sea surface temperatures. On the northwestern South Orkney Plateau, two canyons are particular hotspots for Antarctic krill, and the larger canyon was surveyed with high resolution, repeat transects. These repeated observations show high day-to-day variability in both currents and hydrography, possibly forced by short-term wind variability driving or restricting water exchange between the canyon and the deeper ocean. This suggests that the elevated krill abundance associated with the canyons may be due to several mechanisms, including retention by the local currents, interactions between the currents and krill behaviour, and potentially increased phytoplankton growth due to additional nutrient availability driven by the highly dynamic environment.

How to cite: Renner, A., Menze, S., Jones, E., Young, E., Thorpe, S., and Murphy, E.: Variability in upper ocean properties around the South Orkney Islands, Antarctica, EGU General Assembly 2024, Vienna, Austria, 14–19 Apr 2024, EGU24-13132, https://doi.org/10.5194/egusphere-egu24-13132, 2024.

EGU24-13207 * | ECS | Orals | OS1.5 | Highlight

Unprecedented changes in the Southern Ocean detected by satellites 

Alessandro Silvano, Rafael Catany, Estrella Olmedo, Veronica González-Gambau, Antonio Turiel, Carolina Gabarró, Aina García-Espriu, Cristina González-Haro, F. Alexander Haumann, Aditya Narayanan, Alberto Naveira Garabato, and Roberto Sabia

The Southern Ocean has experienced unprecedented changes since 2016. Most notably are 1) a reduction in sea ice cover and 2) the appearance of offshore polynyas not seen since the 1970s. Several hypotheses have been put forward to explain both these events, including atmospheric (e.g. winds, atmospheric rivers) and oceanic (e.g. upwelling) drivers. To help explain what has occurred over the past decade we use the first regional product of sea surface salinity (SSS) in the Southern Ocean derived by satellites as part of the SO-FRESH project. We combine this new dataset with sea ice observations from satellites as well as with in situ observations and models to show that both atmospheric and oceanic processes are involved in the observed changes, highlighting the complexity of the ice-ocean-atmosphere system in the Southern Ocean.


How to cite: Silvano, A., Catany, R., Olmedo, E., González-Gambau, V., Turiel, A., Gabarró, C., García-Espriu, A., González-Haro, C., Haumann, F. A., Narayanan, A., Naveira Garabato, A., and Sabia, R.: Unprecedented changes in the Southern Ocean detected by satellites, EGU General Assembly 2024, Vienna, Austria, 14–19 Apr 2024, EGU24-13207, https://doi.org/10.5194/egusphere-egu24-13207, 2024.

EGU24-13382 | ECS | Orals | OS1.5

Southern Ocean upwelling: Climatology and long-term trends 

Fanglou Liao, Kunde Yang, Yaping Wang, Guandong Gao, Peng Zhan, Daquan Guo, Zipeng Li, and Ibrahim Hoteit

The Southern Ocean upwelling is the most globally significant upwelling branch, and it plays a crucial role in redistributing water, heat, salt, and carbon on a global scale. The aim of this study is to enhance the understanding of this upwelling system, focusing primarily on the climatology and long-term trends of the Southern Ocean upwelling, both historical and projected, using global climate models. The simulated large-scale upwelling in the Southern Ocean is ~0.5 m/day. Although the spatial distribution pattern of the simulated Southern Ocean upwelling appears similar across different models, the strength of the upwelling is highly sensitive to resolution, generally showing stronger upwelling in eddy-permitting and eddy-resolving models. The most intense upwelling is predominantly concentrated around five major topographic features; this finding is consistent with those of previous studies. Our analysis of an eddy-resolving climate model shows no discernible trend during a historical period (1850–2005) and under a business-as-usual emission scenario in the 21st century (2006-2100). However, significant multidecadal variations are evident from this eddying model, which may be related to the low-frequency variations in the wind-stress curl and eddy kinetic energy. Notably, two lower-resolution climate models cannot very well simulate this multidecadal variations, and there is no consensus regarding its intensification or weakening. Our results suggest that wind stress is likely to increase under a scenario of comparatively high greenhouse gas emissions in the future; however, elevated vertical stratification of seawater may act as a barrier to the intensification of the upwelling.

How to cite: Liao, F., Yang, K., Wang, Y., Gao, G., Zhan, P., Guo, D., Li, Z., and Hoteit, I.: Southern Ocean upwelling: Climatology and long-term trends, EGU General Assembly 2024, Vienna, Austria, 14–19 Apr 2024, EGU24-13382, https://doi.org/10.5194/egusphere-egu24-13382, 2024.

EGU24-17291 | Posters on site | OS1.5

Modelling of multiyear variability of oceanographic variables in the area surrounding South Georgia, Southern Ocean 

Ragnhild Daae, Ingrid Ellingsen, and Cian Kelly

The area surrounding South Georgia in the Southern Ocean is a highly productive area. This study seeks to interpret the oceanographic processes within this area by using high resolution model data. Emphasizing multiyear variability, our investigation centres on hydrography, currents, mesoscale eddies, upwelling phenomena, and their profound impact on vertical mixing.

Using data from two distinct model domains, our study encompasses the finer details facilitated by both larger and smaller resolution scales. The larger 'mother' domain with 4 km horizontal resolution, and its smaller counterpart at 800 m resolution, offer nuanced perspectives on the region's dynamics and their resolution-dependency.

This modelling initiative forms an integral part of a larger project, SFI Harvest, aimed at developing a coupled physical-biological model specifically for understanding primary production dynamics in the Southern Ocean. SFI Harvest is a long-term centre for research-based innovation, where our part is to better understand the spatiotemporal variability for sustainable harvesting of krill in the Southern Ocean.

How to cite: Daae, R., Ellingsen, I., and Kelly, C.: Modelling of multiyear variability of oceanographic variables in the area surrounding South Georgia, Southern Ocean, EGU General Assembly 2024, Vienna, Austria, 14–19 Apr 2024, EGU24-17291, https://doi.org/10.5194/egusphere-egu24-17291, 2024.

EGU24-17353 | ECS | Posters on site | OS1.5

Impact of Wind Stress Curl on the Eddy Saturation of the Antarctic Circumpolar Current from a Barotropic Perspective 

Sima Dogan, Caroline Muller, Louis-Philippe Nadeau, and Antoine Venaille

Eddy saturation, a phenomenon where east-west transport remains insensitive to changes in wind stress, is believed to play a crucial role in explaining the behavior of the Antarctic Circumpolar Current (ACC). Two distinct mechanisms are known to lead to eddy saturation: (i) baroclinic instability in stratified flows and (ii) topographic-barotropic instability in unstratified flows. This study focuses on eddy saturation resulting from topographic-barotropic instability in a doubly periodic domain. Previous findings have shown that topographic-barotropic instability, typically occurring within a specific range of wind stress, is significantly influenced by the geometry of the topography. We investigate how the introduction of wind stress curl affects the occurrence and the dynamics of eddy saturation. Our findings demonstrate that wind stress curl and its interaction with topography is crucial in understanding the eddy saturation and, consequently, for determining the zonal transport of the ACC. In the doubly periodic domain, a dependence is observed between the zonal transport and the wind stress variations in relation to mean wind stress,  associated with the form stress composed by the interaction with bottom topography with singular and multiple ridges.

How to cite: Dogan, S., Muller, C., Nadeau, L.-P., and Venaille, A.: Impact of Wind Stress Curl on the Eddy Saturation of the Antarctic Circumpolar Current from a Barotropic Perspective, EGU General Assembly 2024, Vienna, Austria, 14–19 Apr 2024, EGU24-17353, https://doi.org/10.5194/egusphere-egu24-17353, 2024.

The Southern Ocean considerably influences the global climate by exchanging heat and carbon between the deep ocean and the surface. Historically, it mitigated surface warming by absorbing 70% of excess heat and over 10% of human-induced CO2 emissions. The future of this role is strongly linked to salinity changes, as salinity controls, through its influence on the density stratification, the vertical exchange of water masses, heat and carbon.  A strong freshening of the Southern Ocean surface waters in the decades before 2016 has resulted in increased surface density stratification all around Antarctica. This enhanced stratification reduces the mixing between deep and surface waters, and in particular the vertical mixing of carbon-rich deep waters into the surface layer. By comparing post-2010 hydrographic sections in the GLODAP database to the climatology, we observe consistent and significant anomalies in the biogeochemical properties of the top 500 m of all the sectors of the Southern Ocean. While the surface layer is freshening, salinity, temperature, dissolved inorganic carbon (DIC) and total alkalinity (TA) increase in the subsurface layer. We find that this increase results from the shallowing of upper circumpolar deep water south of 50°S. We investigate the variability in properties of the surface and subsurface layers over the last decade, as well as the impact of such changes on the potential fugacity of CO2 to better understand how the change in stratification may impact the air-sea CO2 flux.

How to cite: Olivier, L. and Haumann, A.: Changes in salinity driven stratification and impacts on the deep-water CO2 ventilation in the Southern Ocean, EGU General Assembly 2024, Vienna, Austria, 14–19 Apr 2024, EGU24-17470, https://doi.org/10.5194/egusphere-egu24-17470, 2024.

Recent observations show that mass loss from Antarctic ice sheets and ice shelves is accelerating and is projected to increase further in the coming decades. The resulting freshwater input from melting of the grounded ice sheet and ice shelves is expected to have significant impacts on Southern Ocean dynamics that could also feedback onto the global climate system and its future changes. However, most state-of-the-art coupled models do not include interactive ice sheets and shelves, resulting in large uncertainty in future climate projections. Additionally, the physical response within the Southern Ocean and beyond remains elusive and largely dependent on the model used and the experimental design.

Here, we present results from a model participating in the Southern Ocean Freshwater Input from Antarctica (SOFIA) initiative, an international model intercomparison project in which freshwater is added to the ocean surrounding Antarctica to simulate the otherwise missing ice-sheet mass loss. Contrary to most models participating in SOFIA, we have performed our experiments with an ocean-sea ice model in which sea surface salinity restoring is deactivated and previously computed restoring-induced surface fluxes are provided at the ocean surface in order to keep a stable climate. Besides the missing atmospheric feedback, an ocean-only SOFIA experiment allows the investigation of the ocean's response to Antarctic freshwater discharge and, through the comparison with SOFIA coupled models, the quantification of the role of atmospheric feedbacks.

Preliminary results, based on a suite of experiments using varying strengths of the freshwater perturbation, are presented for both Southern Ocean physics and dynamics, with implications for the global circulation.

How to cite: Farneti, R.: Southern Ocean response and sensitivity to idealized freshwater perturbation experiments, EGU General Assembly 2024, Vienna, Austria, 14–19 Apr 2024, EGU24-17598, https://doi.org/10.5194/egusphere-egu24-17598, 2024.

EGU24-17657 | ECS | Posters on site | OS1.5

Global ocean ventilation: a comparison between a general circulation model and data-constrained inverse models 

Bruno Millet, Casimir de Lavergne, William Gray, Mark Holzer, and Didier Roche

Ocean ventilation, or the transfer of tracers from the surface boundary layer into the ocean interior, is a critical process in the climate system. Here, we assess steady-state ventilation patterns and rates in three models of ocean transports: a 1° global configuration of the Nucleus for European Modelling of the Ocean (NEMO), version 2 of the Ocean Circulation Inverse Model (OCIM), and the Total Matrix Intercomparison (TMI). We release artificial dyes in six surface regions of each model and compare equilibrium dye distributions as well as ideal age distributions. We find good qualitative agreement in large-scale dye distributions across the three models. However, the distributions indicate that TMI is more diffusive than OCIM, itself more diffusive than NEMO. NEMO simulates a sharp separation between bottom and intermediate water ventilation zones in the Southern Ocean, leading to a weaker influence of the latter zone on the abyssal ocean. A shallow bias of North Atlantic ventilation in NEMO contributes to a stronger presence of the North Atlantic dye in the mid-depth Southern Ocean and Pacific. This isopycnal communication between the North Atlantic surface and the mid-depth Pacific is very slow, however, and NEMO simulates a maximum age in the North Pacific about 900 years higher than the data-constrained models. Possible causes of this age bias are interrogated with NEMO sensitivity experiments. Implementation of an observation-based 3D map of isopycnal diffusivity augments the maximum age, due to weaker isopycnal diffusion at depths. We suggest that tracer upwelling in the subarctic Pacific is underestimated in NEMO and a key missing piece in the representation of global ocean ventilation in general circulation models.

How to cite: Millet, B., de Lavergne, C., Gray, W., Holzer, M., and Roche, D.: Global ocean ventilation: a comparison between a general circulation model and data-constrained inverse models, EGU General Assembly 2024, Vienna, Austria, 14–19 Apr 2024, EGU24-17657, https://doi.org/10.5194/egusphere-egu24-17657, 2024.

EGU24-18195 | Posters on site | OS1.5

RoSES: The Role of the Southern Ocean in the Earth System 

Elaina Ford and Romy Hall

The Southern Ocean is a key component in the Earths global carbon cycle and associated climate dynamics, as a primary hotspot for the oceanic sink of anthropogenic carbon dioxide (CO2). However, our understanding of the vital processes in this area was limited. In recognition of this critical knowledge gap, the Natural Environment Research Council (NERC) invested £7 million in a pioneering research programme spanning five years, under the Role of the Southern Ocean in the Earth System (RoSES) programme. The overarching objective of this ambitious endeavour was twofold: to substantially reduce uncertainty in 21st-century global climate change projections and to lay a robust scientific foundation to guide international climate policy.

The strength of the RoSES programme is built on the synergies between five distinct but interwoven projects:-

  • SONATA focussed on the Southern Ocean's biological and physical processes, and the relationship between oceanic currents and marine life that ultimately influences carbon sequestration.
  • SARDINE assessed the Southern Ocean's role in regulating global nutrient cycles, a key aspect with impacts on carbon dynamics and, consequently, climate patterns.
  • PICCOLO focussed on phytoplankton and their role as carbon consumers, examining how these tiny organisms contribute to the Southern Ocean's carbon sink.
  • CUSTARD investigated the Southern Ocean's role in atmospheric CO2 uptake, further enriching the understanding of this vast region's carbon dynamics.
  • CELOS focussed on the Southern Ocean's contribution to the global ocean overturning circulation, a critical component in the Earth's climate system.

Each of these projects focussed on different element within the Southern Ocean domain, collectively seeking to uncover its carbon dynamics and unravel the complexities associated with anthropogenic CO2.

This poster will provide an overview of the delivery and management of the RoSES programme and will signpost to the outputs and dissemination activities of those associated with the programme here at EGU2024.

How to cite: Ford, E. and Hall, R.: RoSES: The Role of the Southern Ocean in the Earth System, EGU General Assembly 2024, Vienna, Austria, 14–19 Apr 2024, EGU24-18195, https://doi.org/10.5194/egusphere-egu24-18195, 2024.

EGU24-19204 | ECS | Posters on site | OS1.5

Eddy effects on South Atlantic Ventilation Pathways using Lagrangian trajectories   

Simon Schäfers, Alexa Griesel, and Manita Chouksey

The Southern Ocean takes up a significant amount of anthropogenic CO2 emissions by subduction, as dense water masses get displaced northward and form the Antarctic Intermediate Water (AAIW).  Subducting oceanic water masses encapsulate dissolved atmospheric gases and retard anthropogenic climate change by taking up about a quarter of industrial CO2 emissions, nearly half of which in the Southern Ocean. However, the processes that control the water mass formation and their ventilation pathways, relevant to climate change remain actively researched. Southern Ocean dynamics are strongly influenced by mesoscale eddies which are likely to intensify in a warmer global climate, raising the question on the role and importance of eddies in shaping the ventilation pathways and in oceanic tracer and heat uptake. Previous results using Lagrangian backtracking and tracer simulations in the South Atlantic Ocean indicate heterogeneous source regions and pathways for AAIW, suggesting the potential role of eddies in addition to wind stress-induced Ekman Transport. Here we investigate the impact of mesoscale eddies on the subduction timescales and ventilation pathways of the AAIW in the South Atlantic Ocean.  
   
We use an eddy-resolving 1/10 degree ocean model (Parallel Ocean Program) with a Lagrangian particle tracking algorithm (Parcels) following discrete particles from the interior of the South Atlantic AAIW backward in time until they reach the mixed layer after tracking them for 100 years. In total 105 particles were released in the South Atlantic Ocean between 15° and 40°S in depths that meet the density criteria of 26.8 to 27.4 kg/m3  for the AAIW. The experiment was performed on a repeated year velocity field with daily mean data from 1990. For comparability, we performed the same experiment on a decadal mean state, eliminating mesoscale eddy activity. The Transit Time Distributions (TTD) inferred from the backtracking of Lagrangian trajectories aid in quantifying eddy effects on the advection time scales, source regions, and pathways of the AAIW. We expect eddy effects to alter the position and time scales of the subduction process and affect the importance of specific routes, such as the cold and warm water routes.

How to cite: Schäfers, S., Griesel, A., and Chouksey, M.: Eddy effects on South Atlantic Ventilation Pathways using Lagrangian trajectories  , EGU General Assembly 2024, Vienna, Austria, 14–19 Apr 2024, EGU24-19204, https://doi.org/10.5194/egusphere-egu24-19204, 2024.

EGU24-291 | ECS | Orals | OS1.6 | Highlight

Oceanic gateways to Antarctic grounding lines - Impact of critical access depths on sub-shelf melt 

Lena Nicola, Ronja Reese, Moritz Kreuzer, Torsten Albrecht, and Ricarda Winkelmann

Melting underneath the floating ice shelves surrounding the Antarctic continent is a key process for the stability of the Antarctic Ice Sheet and therefore its current and future mass loss. Troughs and sills on the continental shelf play a crucial role in modulating sub-shelf melt rates, as they can allow or block the access of relatively warm, modified Circumpolar Deep Water to ice-shelf cavities.

In our study (Nicola et al., subm.), we identify potential oceanic gateways that could allow the access of warm water masses to Antarctic grounding lines based on critical access depths inferred from high-resolution bathymetry data. We analyse the properties of water masses that are currently present in front of the ice shelf and that might intrude into the respective ice-shelf cavities in the future. We use the ice-shelf cavity model PICO to estimate an upper limit of melt rate changes in case all warm water masses up to a certain depth level gain access to the cavities. The identification of oceanic gateways is thus valuable for assessing the potential of ice-shelf cavities to switch from a 'cold' to a 'warm' state, which could result in widespread ice loss from Antarctica.

How to cite: Nicola, L., Reese, R., Kreuzer, M., Albrecht, T., and Winkelmann, R.: Oceanic gateways to Antarctic grounding lines - Impact of critical access depths on sub-shelf melt, EGU General Assembly 2024, Vienna, Austria, 14–19 Apr 2024, EGU24-291, https://doi.org/10.5194/egusphere-egu24-291, 2024.

EGU24-609 | ECS | Orals | OS1.6

High resolution pH measurements at the edge of the Dotson Ice shelf using state-of-the-art autonomous technologies. 

Daisy Pickup, Karen Heywood, Dorothee Bakker, Emily Hammermeister, Socratis Loucaides, Yixi Zheng, Gareth Lee, Patricia Yager, and Rob Hall

The global ocean takes up about a quarter of anthropogenic carbon dioxide emissions, with the Southern Ocean playing a disproportionately large role. This uptake has led to changes in the Southern Ocean's carbonate chemistry, reducing pH through ocean acidification. The Amundsen Sea, West Antarctica, is surrounded by rapidly melting ice shelves, that may be impacting the carbonate balance of this coastal region. Near the Dotson Ice Shelf, we collected the first high-resolution, full-depth pH dataset using a Lab-on-Chip spectrophotometric sensor attached to an autonomous profiling ocean glider. The sensor collected data within 10 km of the Dotson Ice Shelf over a 19-day period in January/February 2022 and captured the variability that results from summertime biogeochemical and physical processes. In the upper 150 m, net primary production dominates variation in pH, producing a maximum pH of 8.34 (on the total hydrogen scale) in front of Dotson Ice Shelf, where chlorophyll fluorescence also peaks. Below 150 m, pH is generally lower, likely as a result of net respiration. The inflow of modified Circumpolar Deep Water near the east side of Dotson Ice Shelf exhibits a slightly elevated pH (0.05 units) compared to surrounding deep waters. The meltwater-laden outflow that exits on the west side of the ice shelf at depths between 300 - 500 m displays a lower pH (0.1 units) relative to the surrounding waters, which shoals and mixes, reducing pH in the overlying surface waters. In the coastal current along Dotson Ice Shelf, an unusual subsurface maximum in pH (0.1 units at 150 m, compared to surrounding waters) is observed and is also associated with increased chlorophyll fluorescence. Possible explanations for the observed features are discussed. These high-resolution findings reveal the potential of pH measurements on an autonomous vehicle for investigating difficult to access regions with glacial melt.

How to cite: Pickup, D., Heywood, K., Bakker, D., Hammermeister, E., Loucaides, S., Zheng, Y., Lee, G., Yager, P., and Hall, R.: High resolution pH measurements at the edge of the Dotson Ice shelf using state-of-the-art autonomous technologies., EGU General Assembly 2024, Vienna, Austria, 14–19 Apr 2024, EGU24-609, https://doi.org/10.5194/egusphere-egu24-609, 2024.

The ice sheets flowing into the Amundsen Sea, West Antarctica, are losing mass faster than most others about the continent due to rapid basal melting of their floating ice shelf extensions. A key oceanographic control of the rate of ice-shelf basal melting is a warm eastward undercurrent that flows along the continental shelf break and eventually towards the ice shelves. On monthly timescales surface winds drive fast barotropic variability in the undercurrent. On decadal timescales, however, undercurrent variability is not well understood. We present model results that show that on decadal timescales undercurrent variability opposes wind variability, with this being a consequence of sea-ice and ice-shelf freshwater flux variability. Specifically, periods of fast (more eastward) undercurrent are a result of enhanced brine rejection north of the continental shelf break, which enhances the cross-slope pressure gradient at depth and accelerates the undercurrent baroclinically. Opposite anomalies in the sea-ice freshwater flux decelerate the undercurrent. A positive feedback mechanism between the undercurrent and ice-shelf basal melt strengthens the undercurrent anomalies. Lastly, we show that variability in sea-ice freshwater fluxes, and by extension the Amundsen Sea undercurrent and ice-shelf basal melt, can be attributed to tropical Pacific variability impacting atmospheric conditions over the Amundsen Sea.

How to cite: Haigh, M. and Holland, P.: Freshwater fluxes drive decadal variability of the Amundsen Sea undercurrent and ice-shelf basal melt, EGU General Assembly 2024, Vienna, Austria, 14–19 Apr 2024, EGU24-1302, https://doi.org/10.5194/egusphere-egu24-1302, 2024.

EGU24-1729 | ECS | Posters on site | OS1.6

Revisiting the iceberg thickness distribution in Southern Ocean simulations. 

Anna Olivé Abelló, Pierre Mathiot, Nicolas Jourdain, Yavor Kostov, and Paul Holland

The acceleration of glaciers in the Antarctic ice sheet amplifies the flow of icebergs into the Southern Ocean. The presence of these icebergs has a significant impact on the penetration of warm water toward ice shelves and can also induce the formation of large polynyas when grounded, thereby promoting dense water formation. The existing implementation of the Lagrangian iceberg module in NEMO does not consider the Antarctic ice-shelf thicknesses from which the icebergs are originated, so the model cannot represent whether icebergs are thin enough to cross the shallow bathymetric ridges. In the present model, the iceberg masses, thicknesses, and size distribution are prescribed a priori as input parameters irrespective of the source ice-shelf characteristics. In addition, the categorization of iceberg classes and the scaling of smaller icebergs are not optimized, which is a strong limitation for climate modelling. Hence, the main aim of this study is to improve the thickness distribution of the calved icebergs based on ice shelf characteristics, decrease the computational cost of the model, and assess how these improvements alter the lifespan of the icebergs and their freshwater flux distribution across Antarctica.

The new approach has been implemented in a 0.25° Southern Ocean configuration of the NEMO ocean–sea-ice model. We used a power-law probability distribution function of iceberg occurrence as a function of iceberg area and a tabular iceberg definition to establish the thickness distribution for the small iceberg categories, imposing that each class exhibits the same total mass. In order to reduce computational costs, we constrained the frequency of icebergs released per class so that the smaller classes of multiple icebergs are gathered into one particle. Our preliminary results show that the iceberg thickness distribution, implemented as a function of areas, is supported by in-situ observations measured from high-resolution SAR-1 satellite images. The released icebergs display a typical thickness per class depending on the ice shelf's source, with a broader distribution when more calving classes are established. Ultimately, the findings reveal that accounting for realistic Antarctic ice-shelf thicknesses leads to thicker icebergs, particularly in larger classes, consequently increasing the mass that each transports westward around Antarctica. Future iceberg simulations, carried out for 25 years, will assess the iceberg's sensitivity to the maximum iceberg area, the number of different sizes and the area bounds used to define each size, among others. It is also expected that these simulations will also unveil high-melting regions and high iceberg densities in regions where icebergs ground, and will determine if fragmentation processes are needed to achieve realistic iceberg lifespans.

How to cite: Olivé Abelló, A., Mathiot, P., Jourdain, N., Kostov, Y., and Holland, P.: Revisiting the iceberg thickness distribution in Southern Ocean simulations., EGU General Assembly 2024, Vienna, Austria, 14–19 Apr 2024, EGU24-1729, https://doi.org/10.5194/egusphere-egu24-1729, 2024.

EGU24-2153 | ECS | Orals | OS1.6

Ocean Circulation and Ice Shelf Melting in the Bellingshausen Sea 

Emma White, Adrian Jenkins, Paul Holland, Jan de Rydt, and Miguel Morales-Maqueda

A modified version of warm Circumpolar Deep Water (CDW) is able to flow onto the continental shelf in the Bellingshausen Sea, leading to high melt rates beneath the floating ice shelves. Data are presented from a 2007 research cruise to the Bellingshausen Sea, during which temperature, salinity and dissolved oxygen measurements were made at 253 stations. These observations provide detailed insights into the physical oceanographic regime of the region and its impact on the ice shelves, particularly in the western Bellingshausen Sea where few other ship-based observations exist. The transport of CDW across the shelf break at Marguerite Trough and Belgica Trough is assessed, as well as the modification of CDW properties as it flows onto the continental shelf. The spatial variability seen in water masses across the Bellingshausen Sea and regional circulation patterns are also evaluated. Finally, we present an assessment of the meltwater production and circulation within the ice shelf cavities.

How to cite: White, E., Jenkins, A., Holland, P., de Rydt, J., and Morales-Maqueda, M.: Ocean Circulation and Ice Shelf Melting in the Bellingshausen Sea, EGU General Assembly 2024, Vienna, Austria, 14–19 Apr 2024, EGU24-2153, https://doi.org/10.5194/egusphere-egu24-2153, 2024.

EGU24-3500 | Orals | OS1.6

How much can we get from Gade's mixing line? 

Louis-Alexandre Couston

Gade’s meltwater mixing line theory is consistent with numerous under-ice ocean observations. However, it is built on an assumption that is difficult to test with field measurements, especially near the ice boundary, which is that the effective salt and temperature diffusivities are equal. In this presentation, I will discuss the validity of Gade’s mixing line theory and show how it can be used to predict melt rates, using results from direct numerical simulations of a canonical model for externally forced ice-ocean boundary layers. I will first demonstrate that the effective salt and temperature diffusivities are approximately equal across most of the boundary layer in the well mixed regime. Then, I will show how knowledge of one turbulent diffusivity (salt, temperature, or thermal driving) can be combined with knowledge of one vertical profile in the bulk (salt, temperature, or thermal driving) to predict the heat and salt fluxes at the ice-ocean boundary.

How to cite: Couston, L.-A.: How much can we get from Gade's mixing line?, EGU General Assembly 2024, Vienna, Austria, 14–19 Apr 2024, EGU24-3500, https://doi.org/10.5194/egusphere-egu24-3500, 2024.

EGU24-3579 | ECS | Orals | OS1.6

Turbulent heat exchange between Circumpolar Deep Water and Winter Water on the Amundsen Sea Continental Shelf, Antarctica  

Xingchi Wang, Yvonne Firing, Alberto Naveira Garabato, Bieito Fernández Castro, and Carl Spingys

The intrusion of Circumpolar Deep Water (CDW) onto the Amundsen Sea continental shelf is a primary driver of basal melting and thinning of the West Antarctic ice shelves. The interaction between CDW and the overlying, near-freezing Winter Water (WW) on the continental shelf is thought to limit the heat that ultimately reaches the ice shelves. However, such interaction, and the processes underpinning it, remain little understood. In this study, we analyze over one hundred microstructure and finestructure profiles across the Amundsen Sea continental shelf. Our analysis indicates a strong correlation between microstructure turbulent kinetic energy dissipation and the finescale horizontal kinetic energy (HKE) associated with internal waves, suggesting that wave breaking is key to turbulence production in the region. Exploiting this relationship, we construct a 2-year time series of finescale HKE and turbulent dissipation from a mooring dataset acquired at the Pine Island-Thwaites West (PITW) trough. The time series reveals a distinct seasonal signal, with a range spanning one order of magnitude and diverse drivers. By combining a regional numerical model with the mooring diagnostics, we then estimate the turbulent diapycnal diffusivity and associated vertical heat flux between CDW and WW at the PITW trough. This provides insight into the heat loss experienced by CDW on its pathway toward the ice shelves.

How to cite: Wang, X., Firing, Y., Naveira Garabato, A., Fernández Castro, B., and Spingys, C.: Turbulent heat exchange between Circumpolar Deep Water and Winter Water on the Amundsen Sea Continental Shelf, Antarctica , EGU General Assembly 2024, Vienna, Austria, 14–19 Apr 2024, EGU24-3579, https://doi.org/10.5194/egusphere-egu24-3579, 2024.

EGU24-4097 | ECS | Posters on site | OS1.6

A regime change within Amery Ice Shelf cavity by a reversed current in the twenty-first century 

Jing Jin, Antony Payne, and Christopher Bull

The Amery Ice Shelf (AmIS), the third largest ice shelf in Antarctica, has experienced a relatively low basal melting during the past decades. However, it is unclear how AmIS melting will respond to a future warming climate. Here, we use a regional ocean model forced by a low-emission scenario and a high-emission scenario to investigate AIS melting by 2100. The melt rate is projected to increase multiple times in 2100. An abrupt increase in melt rate happens in the 2060s in both scenarios. A mechanism that drives the jump of melting is investigated. A redistribution of local salinity (and then density) in front of AmIS forms a new geostrophic balance, leading to the reversal of local currents. This transforms AmIS from a cold cavity to a warm cavity, and results in a jump of ice shelf melting. This regime change draws our attention to the role of oceanic processes in the basal mass loss of Antarctic ice shelves in climate change.

How to cite: Jin, J., Payne, A., and Bull, C.: A regime change within Amery Ice Shelf cavity by a reversed current in the twenty-first century, EGU General Assembly 2024, Vienna, Austria, 14–19 Apr 2024, EGU24-4097, https://doi.org/10.5194/egusphere-egu24-4097, 2024.

EGU24-5201 | ECS | Posters on site | OS1.6

Evolution processes of Ross sea polyny aassociated with modified Circumpolar Deep Water intrusion 

Qing Qin, Zhaomin Wang, Liangjun Yan, Chengyan Liu, and Jan De Rydt

In the central Ross Sea continental shelf, the modified Circumpolar Deep Water could intrude the continental shelf between March and July, and reach about 76 °S. According to seal-CTD data, in March and April, the potential temperature of the modified Circumpolar Deep Water was up to - 0.55 °C, and was widely distributed within the depths of 100 - 300 m. In May and June, the potential temperature of the modified Circumpolar Deep Water was up to - 0.65 °C, and was found to the north of 76 °S above the depth of 350 m, but discontinuous above the depth of 200 m. In July, the modified Circumpolar Deep Water sharply cooled, with the maximum potential temperature being -1.45 °C.

By analysing the seal-CTD observations and the numerical model results, this study found strong mixing in the central part of the shelf, owing to topography-induced upwelling. The resulted mixed layer warming is also attributed to the intrusion of the modified Circumpolar Deep Water. This oceanic process, along with the katabatic wind forcing, contributed to forming unique sea ice distribution characteristics in the Ross Sea Polynya, featured by ‘’less ice, more ice, less ice” from the front of the Ross Ice Shelf to the upwelling zone. This kind of sea ice distribution characteristics can also promote the northward expansion of the Ross Sea Polynya.

How to cite: Qin, Q., Wang, Z., Yan, L., Liu, C., and De Rydt, J.: Evolution processes of Ross sea polyny aassociated with modified Circumpolar Deep Water intrusion, EGU General Assembly 2024, Vienna, Austria, 14–19 Apr 2024, EGU24-5201, https://doi.org/10.5194/egusphere-egu24-5201, 2024.

EGU24-5406 | ECS | Posters on site | OS1.6

Reconstructing historical ocean changes around the West Antarctic Ice Sheet over the past centuries 

Quentin Dalaiden, Paul Holland, Kaitlin Naughten, Pierre Mathiot, Noé Pirlet, Antoine Barthelemy, and Nicolas Jourdain

Over recent decades, the West Antarctic Ice Sheet (WAIS) has witnessed a large increase in ice shelf melting. This ice loss is recognized to be associated with a response to changes in the ocean state, in particular of the Circumpolar Deep Water (CDW) on the Amundsen Sea continental shelf. It has been shown that the variability of the CDW inflow is strongly related to wind changes. While instrumental-based atmospheric reanalysis products are available since 1979, given the strong natural variability of the West Antarctic climate, this period of a few decades might be too short to identify the mechanisms driving the long-term changes in ice shelf melting, and to distinguish the relative contribution of natural and forced variability to the total changes. Therefore, there is a need to provide long-term historical changes in oceanic conditions to put the recently observed ice shelf melting into a longer context and to ultimately better constrain the future contribution of the WAIS to the global sea-level rise. Over the past few years, atmospheric reanalysis based on paleoclimate records spanning the last centuries have been released. This offers us the opportunity to assess historical changes in oceanic conditions in response to changes in the atmosphere. In this study, we propose a framework to reconstruct past ocean conditions around the WAIS over the last few centuries by using an ocean–sea-ice model (NEMO-SI3) forced by a paleo-based atmospheric reanalysis. Specifically, we use a paleo-reanalysis based on data assimilation that aims at dynamically combining information from paleoclimate records from the Southern Hemisphere (especially ice-core records) and the physics of Earth System Models. This has the advantage of guaranteeing a dynamical consistency between the reconstructed variables. Along with the methodology, we present the first reconstructed oceanic conditions from the NEMO-SI3 simulations.

How to cite: Dalaiden, Q., Holland, P., Naughten, K., Mathiot, P., Pirlet, N., Barthelemy, A., and Jourdain, N.: Reconstructing historical ocean changes around the West Antarctic Ice Sheet over the past centuries, EGU General Assembly 2024, Vienna, Austria, 14–19 Apr 2024, EGU24-5406, https://doi.org/10.5194/egusphere-egu24-5406, 2024.

EGU24-6270 | ECS | Orals | OS1.6

Assessing the degree of impact from iceberg activities on penguin colonies of Clarence Island 

Hong Lin, Xiao Cheng, Teng Li, Qian Shi, Qi Liang, Xinyu Meng, Shaoyin Wang, and Lei Zheng

During August and September 2023, three giant icebergs, each bigger than Paris, successively grazed Clarence Island in the northeast of the Antarctic Peninsula, a home to a population of over 100,000 penguins. This incident may serve as a clarion call for the increasing iceberg calving due to global warming and its subsequent impact on the Antarctic ecosystem. Here we investigated this unexpected event using satellite imagery, employing wind speed, ocean currents, and seabed topography data to understand the behavior of the icebergs. During the study period, eastward winds and northward currents favored the drift of icebergs away from the island, and the deeper waters off the east coast reduced the probability of iceberg grounding. Nevertheless, iceberg D30A still left a significant amount of floating ice during its grazing passage. Moreover, we integrated historical records and probabilistic analyses of iceberg grounding to assess the degree of impact on penguin colonies of Clarence Island. Among the eleven colonies, only one in the northern region exhibits low impact, whereas two colonies in the southeastern region experience high impact. In a warming future, with an increase in iceberg calving events, penguin colonies located in iceberg drift hotspots are likely to experience greater impacts from iceberg activities. Therefore, we call upon the public to pay heed to climate warming and implement measures to mitigate anthropogenic greenhouse gas emissions, thereby alleviating the threat to penguin ecosystems.

How to cite: Lin, H., Cheng, X., Li, T., Shi, Q., Liang, Q., Meng, X., Wang, S., and Zheng, L.: Assessing the degree of impact from iceberg activities on penguin colonies of Clarence Island, EGU General Assembly 2024, Vienna, Austria, 14–19 Apr 2024, EGU24-6270, https://doi.org/10.5194/egusphere-egu24-6270, 2024.

EGU24-7961 | ECS | Orals | OS1.6

Exploring drivers of change in the Ross Sea with a regional ocean model 

Alethea S. Mountford, Christopher Y. S. Bull, Adrian Jenkins, Nicolas C. Jourdain, and Pierre Mathiot

The Ross Sea and Ross Ice Shelf have remained relatively unchanged over recent decades, despite increasing global anthropogenic influences, and ocean temperatures and ice shelf melt rates increasing nearby. Future atmospheric warming, for example, could lead to a transition of the sub-ice shelf cavity from its current cold state to a warm state, which could in turn result in a dramatic increase to the currently low basal melt rates in the Ross Ice Shelf. We present a regional ocean model configuration (NEMO) at 1/4° resolution, which encompasses the whole of the Ross Sea, Ross Gyre and Ross Ice Shelf, as well as eastwards to include the Amundsen Sea, with a series of perturbation experiments to near-surface air temperature (an increase of 10°C) and precipitation (an increase by a factor of two) and a combination of the two. The model includes static ice shelves, extending from Merz to Venable, and their thermodynamic interaction with the ocean. Perturbations to the air temperature and precipitation alone are not sufficient to significantly alter the circulation or oceanographic conditions within the Ross Sea or within the cavity of the Ross Ice Shelf. However, when both perturbations are applied simultaneously, waters within the Ross Ice Shelf cavity warm to over 1°C, inducing an increase in basal melt of around 1000 Gt/yr within the cavity over the course of the simulated period 2017-2100. We see an increase in the strength of the Ross Gyre, with an eastward extension of the gyre into the Amundsen Sea. Circulation within the cavity is also affected, with a visible reduction in the outflow of waters from the cavity. Oceanographic changes within the cavity and the Ross Sea could have an effect on deep water formation and wider reaching impacts on global circulation.

How to cite: Mountford, A. S., Bull, C. Y. S., Jenkins, A., Jourdain, N. C., and Mathiot, P.: Exploring drivers of change in the Ross Sea with a regional ocean model, EGU General Assembly 2024, Vienna, Austria, 14–19 Apr 2024, EGU24-7961, https://doi.org/10.5194/egusphere-egu24-7961, 2024.

EGU24-8239 | ECS | Orals | OS1.6

Mid-Holocene ecosystem reorganisation in the Weddell Sea: dynamic sea ice and climate inferred from novel Antarctic snow petrel deposits (Heimefrontfjella Range) 

Mark Stevenson, Dominic Hodgson, Michael Bentley, Darren Gröcke, and Erin McClymont

Sea ice in Antarctica is closely coupled to the climate system, influencing water mass upwelling, albedo and the exchange of heat and gas between the ocean and atmosphere. Sea ice also supports a diverse ecosystem which is sensitive to changes in climate and biogeochemistry. The Heimefrontfjella mountain range in East Antarctica features the nesting sites of the snow petrel (Pagodroma nivea) where finely laminated stomach-oil deposits (regurgitated dietary contents) are deposited. Such deposits can provide valuable information on Holocene dietary changes of the snow petrel that may relate to palaeoclimatic variations. Snow petrel feeding grounds in the Weddell Sea range from neritic (coastal) zones rich in fish, to the productive open ocean where Antarctic krill (Euphausia superba) become increasingly important. Distinct dietary signatures are recorded in the biomarkers of these deposits, providing new evidence of changing sea-ice and climate in the Weddell Sea.

Here we focus on stomach-oil deposits from Heimefrontfjella. A highly resolved radiocarbon-dated (14C-AMS) sequence spanning ~6,500 to 2,000 cal. yr BP has been investigated for organic biomarkers (fatty acids, sterols), stable isotopes of carbon and nitrogen (δ13C, δ15N) and inorganic composition by X-ray fluorescence (XRF).  From ~6,500 to 6,000 cal. yr BP fatty acid markers were generally high in concentration, with particularly high levels of C14:0 mirrored by high δ15N suggesting food sources rich in Antarctic krill and periods of enhanced feeding in the open ocean. Subsequently between 6,000 and 4,500 cal. yr BP there was a marked reduction in C14:0, C18:0 and δ15N, although phytol concentration remained high. This trophic shift suggests a transitional Weddell Sea still rich in productivity with snow petrels feeding in both the open ocean and close to the shore on a mixture of fish, krill and squid. This is consistent with regional mid-Holocene warmth, and also suggests dynamic variable meteorological and oceanographic conditions during this period. Subsequently, between ~4,500 and 2,000 cal. yr BP organic marker concentrations were markedly lower, suggesting a relatively low productivity period, which we anticipate required more coastal feeding by snow petrels. This change is consistent with evidence from regional reconstructions suggesting movement into neoglacial conditions.

Together these findings highlight that the Weddell Sea experienced relatively short-term decadal and centennial-scale changes in sea ice and climate during the Holocene. Our results support existing regional proxies (e.g. offshore sediment records, lake records, ice-core records and palaeo-glacial thinning history) and highlight the importance of snow petrel deposits in recording palaeo-dietary and ecosystem changes in Antarctic marine systems.

How to cite: Stevenson, M., Hodgson, D., Bentley, M., Gröcke, D., and McClymont, E.: Mid-Holocene ecosystem reorganisation in the Weddell Sea: dynamic sea ice and climate inferred from novel Antarctic snow petrel deposits (Heimefrontfjella Range), EGU General Assembly 2024, Vienna, Austria, 14–19 Apr 2024, EGU24-8239, https://doi.org/10.5194/egusphere-egu24-8239, 2024.

EGU24-8904 | ECS | Orals | OS1.6

Towards Parameterizing Eddy-Mediated Transport of Circumpolar Deep Water across Antarctic Continental Slopes 

Nicolas Dettling, Martin Losch, Friederike Pollmann, and Torsten Kanzow

The onshore transport of warm Circumpolar Deep Water (CDW) is associated with a heat flux onto the Antarctic continental shelves and strongly contributes to Antarctic ice shelf decline. On the continental shelf of the Weddell Sea, dense water forms through interactions with sea and shelf ice and subsequently propagates down the continental slope. The descent of dense water simultaneously produces an onshore transport of CDW. Here, mesoscale eddies drive a vertical momentum flux that is necessary to overcome the potential vorticity gradient imposed by the continental slope. The resolution of current climate models, however, is too coarse to resolve the Rossby Radius of deformation at high latitudes so that eddies need to be parameterized.

In an idealized model setup (MITgcm) representing the continental slope and shelf of the Weddell Sea, we show that eddy-driven shoreward CDW transport can be parameterized using the classical Gent-McWilliams and Redi (GM/Redi) parameterization for mesoscale eddies. In particular, the coarse resolution model with the GM/Redi parameterization simulates an onshore heat flux that is comparable to a high-resolution reference simulation. In contrast, no shoreward heat flux is observed without the eddy parameterization. When parameterizing eddies, the isopycnal slopes and the hydrographic mean fields also strongly improve compared to the runs without the parameterization. 

We further show that the parameterization works best when the GM transfer coefficient strongly decreases over the continental slope, representing the eddy-suppressive effect of steeply sloped topography. Motivated by this observation, we propose a simple modification to the GM/Redi scheme that reduces the coefficients in the presence of sloping topography. Only this „slope-aware“ version of the GM/Redi parameterization yields coefficients suitable for the continental shelf and slope and the open ocean and produces the best fit to the high-resolution model fields. We expect this addition to also be beneficial for modelling other parts of the ocean where eddy effects are moderated by topographic slopes. We therefore discuss the application of the modified parameterization to a regional model of the Cape Darnley region, East Antarctica, where dense water flows down realistic topography and drives an onshore flow of CDW at high resolution.

How to cite: Dettling, N., Losch, M., Pollmann, F., and Kanzow, T.: Towards Parameterizing Eddy-Mediated Transport of Circumpolar Deep Water across Antarctic Continental Slopes, EGU General Assembly 2024, Vienna, Austria, 14–19 Apr 2024, EGU24-8904, https://doi.org/10.5194/egusphere-egu24-8904, 2024.

EGU24-10184 | ECS | Orals | OS1.6 | Highlight | OS Division Outstanding ECS Award Lecture

The global influence of ice-ocean interactions in Antarctica 

Alessandro Silvano

In this seminar, I will explore the oceanic processes that drive melting of the Antarctic Ice Sheet, and consequent global sea level rise. Different processes lead certain areas of the Antarctic Ice Sheet to be more susceptible to rapid ocean-driven melting, while other areas to be more resilient. I will also show the emergence of a feedback between the ice sheet and Southern Ocean: increased melting leads to warming of the oceanic waters surrounding Antarctica, with consequences for future sea level rise. I will conclude by describing how increased melting of the Antarctic Ice Sheet as well as changes in sea ice affect the global ocean abyss and its ability to store anthropogenic heat and carbon.

How to cite: Silvano, A.: The global influence of ice-ocean interactions in Antarctica, EGU General Assembly 2024, Vienna, Austria, 14–19 Apr 2024, EGU24-10184, https://doi.org/10.5194/egusphere-egu24-10184, 2024.

EGU24-11152 | Posters on site | OS1.6

The effect of grid resolution on sub-ice shelf circulation in the Energy Exascale Earth System Model 

Irena Vaňková, Xylar Asay-Davis, Darin Comeau, Stephen Price, and Jonathan Wolfe

Global ocean models are typically too coarse to explicitly resolve physical processes, such as mesoscale eddies, that transport heat into ice-shelf cavities and contribute to melting. As a result, mesoscale processes around Antarctica in such models need to be parameterized. Here we investigate the performance of these parameterizations in the Energy Exascale Earth System Model (E3SM), specifically focusing on the heat transport into an ice shelf cavity, the strength and direction of sub ice shelf circulation, and the rate of basal melting. Taking advantage of E3SM’s variable-resolution capabilities we set up a sequence of configurations with nominal grid sizes of 12, 8, 4, 2, and 1 km in the southern Weddell Sea, such that with increasing resolution, less eddies are parameterized and more resolved explicitly. The analysis is focused on the Filchner-Ronne Ice Shelf, because it is oceanographically interesting, it is important for sea level projections, and there are relatively abundant datasets from this region available for model validation.

How to cite: Vaňková, I., Asay-Davis, X., Comeau, D., Price, S., and Wolfe, J.: The effect of grid resolution on sub-ice shelf circulation in the Energy Exascale Earth System Model, EGU General Assembly 2024, Vienna, Austria, 14–19 Apr 2024, EGU24-11152, https://doi.org/10.5194/egusphere-egu24-11152, 2024.

Laminated diatomaceous deposits have been documented in some regions of Antarctica, including the Antarctic Peninsula and the Ross Sea. In general, very high sedimentation rates can overwhelm limited bioturbation, thus favoring the varve preservation, for example, in certain glacio-marine environments. The laminated sediments collected in the Edisto Inlet, western Ross Sea, exhibited well-defined dark and light laminae on a mm- to cm-scale. Dark laminae contained relatively high concentrations of a biomarker for fast ice, IPSO25, while low IPSO25 concentrations characterized the light laminae, and the diatom Corethron pennatum became the dominant species. Based on these assumptions, the dynamics of fast ice was reconstructed over the last 2.6 ka for the western Ross Sea. However, the absence of direct observations leaves the paleoclimatic and paleoceanographic interpretation of these laminated sediments with a certain degree of uncertainty.

The project LASAGNE (Laminated Sediments in the Magnificent Edisto Inlet, Victoria Land: What processes control their deposition and preservation?), funded by the Italian Program of Antarctic Research (PNRA), proposes a multidisciplinary study that integrates the characteristics of fast ice, water column, and surface sediment, aiming to obtain information on the factors influencing both formation and preservation of laminated sediment in Edisto Inlet. The project integrates also biological data (phytoplankton, microzooplankton and foraminifera) collected in situ, and time series of satellite images of sea ice. The main goal is to provide new insights into the sub-seasonal formation of laminated sediments, offering a backbone for the interpretation of paleoclimatic sedimentary archives.

Here, we present the results obtained from a comprehensive dataset collected in Edisto Inlet during the XXXVIII Italian PNRA expedition conducted on board the I/B Laura Bassi in February 2023. Collected data include CTD (Conductivity-Temperature-Depth) profiles with additional parameters (Dissolved Oxygen, fluorescence, turbidity) spatially distributed within and at the entrance of the bay, which was still partially covered by seasonal sea ice at the time of the cruise. Additionally, vessel-mounted and lowered ADCPs (Acoustic Doppler Current Profilers) were collected along transects and at each CTD station, respectively.  The synoptic survey conducted during the austral Antarctic summer is used to describe the distribution of water masses and current dynamics in the bay, primarily driven by sea ice formation and melting, as well as atmospheric and tidal forcing. Time series obtained from a mooring deployed 1-year before the cruise (data covers the period February 2022 - February 2024) provide thermohaline variability of the water column even during the winter season, and fluxes and composition of organic debris sinking in the water column through time-series sediment trap samples. Sea ice cores, short sediment cores, and water samples are used to gain insight into the phytoplankton and microzooplankton living in platelet ice in spring and in open water in summer, respectively. Early diagenesis has also been taken into account to define how the original signal is preserved in the sedimentary record.

How to cite: Langone, L. and the LASAGNE team: Environmental factors influencing deposition and preservation of laminated sediments in Edisto Inlet, western Ross Sea (Antarctica), EGU General Assembly 2024, Vienna, Austria, 14–19 Apr 2024, EGU24-11258, https://doi.org/10.5194/egusphere-egu24-11258, 2024.

EGU24-11749 | ECS | Orals | OS1.6

Heat and meltwater fluxes across the front of Dotson ice shelf cavity, Amundsen Sea 

Yixi Zheng, Rob Hall, Karen Heywood, Bastien Queste, Peter Sheehan, and Gillian Damerell

Ice shelves terminating in the Amundsen Sea are losing mass rapidly, exporting an increasing amount of meltwater into the ocean. Investigation into the melt rates of ice shelves near in the Amundsen Sea is therefore crucial for predicting the impact of ice shelf processes on future climate. However, observations near ice shelves often lack continuity in either time or space, limiting our knowledge of their melt rates. During a research cruise in austral summer 2022, we undertook a high resolution (horizontal sampling interval: ~ 2 km) CTD/LADCP transect spanning the front of the Dotson ice shelf encompassing the inflow and outflow to the ice shelf cavity.  In addition, we deployed three ocean gliders yielding five fine-resolution (horizontal sampling interval: ~ 650 m) hydrographic transects along the front of the Dotson Ice Shelf over three weeks. With an average of just 4.5 days between occupations, these new observations allow us to comprehensively investigate short-term variability along the ice front. The glider transects revealed considerable temporal variability in the across-ice shelf current speed.

The CTD section reveals that the meltwater content is higher (around 20 g/kg) in the west (outflow) and lower (around 10 g/kg) in the east (inflow), with a meltwater-poor layer centred at about 350 m sandwiched between two meltwater-rich layers along the ice shelf transect (one above about 250 m and the second centred at about 450 m). We reference geostrophic shear to the LADCP velocity profiles and demonstrate that the net volume flux across the ice shelf front is close to zero. We then calculate the net ocean heat flux across the ice shelf front to be  2.9×10¹¹ W. Assuming that this net heat loss all results from basal melting, we estimate the glacial melt rate from this heat flux to be 28.1 Gt yr-1. The net transport of meltwater out of the cavity is 9.8×10⁵ kg s-1, which is equivalent to 31 Gt yr-1, remarkably similar to the heat-flux-derived value. The small difference between the meltwater-flux-derived and heat-flux-derived melt rates might be attributed to subglacial rivers or other uncertainties in the estimates. Finally, we discuss the heat and meltwater fluxes using the glider transects and determine their temporal variability.

How to cite: Zheng, Y., Hall, R., Heywood, K., Queste, B., Sheehan, P., and Damerell, G.: Heat and meltwater fluxes across the front of Dotson ice shelf cavity, Amundsen Sea, EGU General Assembly 2024, Vienna, Austria, 14–19 Apr 2024, EGU24-11749, https://doi.org/10.5194/egusphere-egu24-11749, 2024.

EGU24-12570 | Posters on site | OS1.6 | Highlight

Spatial distribution of Antarctic meltwater governs Southern Ocean deep convection and shelf warming feedback 

Torge Martin, Janika Rhein, Malin Ödalen, and Mathias Zeller

Increasing Antarctic ice sheet mass loss is anticipated to become a major player in Southern Ocean and global climate change. Since most climate models are lacking an interactive ice sheet, numerous freshwater-release scenarios have been conducted recently, in which the effect of melting of ice shelves and calving of icebergs on the ocean and climate system is studied by prescribing a freshwater flux to the high latitude Southern Ocean. The Southern Ocean Freshwater Input from Antarctica (SOFIA, https://sofiamip.github.io) initiative is designed to reconcile these studies and quantify model uncertainty.

In the framework of SOFIA we conduct experiments with the Flexible Ocean and Climate Infrastructure (FOCI) model, which consists of NEMO3.6-LIM 0.5˚ ocean-sea ice and ECHAM6.3-JSBACH 1.8˚ atmosphere-land components. We study the effect of freshwater input (0.1 Sv) along the Antarctic coast (antwater) versus a wide-spread, iceberg melt-like input field south of 60˚S (60Swater) under pre-industrial climate control conditions. A small ensemble of eight members each also serves to demonstrate a significant effect by centennial-scale internal variability on the magnitude of the Southern Ocean’s response to the freshwater.

Besides responses like surface cooling, sea ice expansion, deep ocean warming, weakening of the Antarctic Circumpolar Current, which are robust across models and experiments, we find two intriguing differences between antwater and 60Swater experiments: In three of the eight ensemble members of antwater, large-scale open ocean deep convection emerges in the central Weddell Gyre, which is absent from the reference run without freshwater perturbation and the eight ensemble runs of 60Swater. This can be linked to the spin-up of the Weddell Gyre in the experiments, increasing the doming of isotherms, but being counterbalanced by surface freshening in the gyre center in 60Swater. Further, the zonal mean warming of >1˚C at mid depth in the Weddell Sea sector present in all experiments spills onto the continental shelf in antwater whereas it resides below the shelf break in 60Swater. This gives rise to the assumption that the spatial distribution of the freshwater has the potential to drive or limit a positive melt feedback loop associated with warming on the shelf.

How to cite: Martin, T., Rhein, J., Ödalen, M., and Zeller, M.: Spatial distribution of Antarctic meltwater governs Southern Ocean deep convection and shelf warming feedback, EGU General Assembly 2024, Vienna, Austria, 14–19 Apr 2024, EGU24-12570, https://doi.org/10.5194/egusphere-egu24-12570, 2024.

EGU24-12592 | ECS | Orals | OS1.6 | Highlight

Sea ice and climate impacts from Antarctic ice-mass loss in the SOFIA multi-model ensemble 

Andrew Pauling, Neil Swart, Torge Martin, Rebecca Beadling, Jia-Jia Chen, Matthew England, Riccardo Farneti, Stephen Griffies, Tore Hattermann, F. Alexander Haumann, Qian Li, John Marshall, Morven Muilwijk, Ariaan Purich, Jeff Ridley, Inga Smith, and Max Thomas

We assess the response of Antarctic sea ice, the Southern Ocean, and global climate to mass loss from the Antarctic continent in a new multi-model ensemble. Antarctic ice-mass loss from ice sheets and ice shelves is increasing and is projected to increase further as the climate warms. The fresh water entering the Southern Ocean due to this ice-mass loss has been proposed as a mechanism responsible for the lack of decline in Antarctic sea ice area between 1979 and 2015, in contrast to the sea-ice loss seen in the Arctic. The fresh water impacts sea ice by increasing the density gradient between the near-surface waters and deeper waters around the Antarctic continent, which inhibits vertical transport of warmer, deeper water to the surface. This results in surface cooling and increased sea ice growth, as has been shown in previous studies. Though this increased Antarctic ice-mass loss is expected to impact climate it is absent from almost all models in the current Coupled Model Intercomparison Project (CMIP6), which typically enforce that the continent remain in perpetual mass balance, with no gain or loss of mass over time. Further, previous non-CMIP6 model experiments that include changing Antarctic ice-mass loss suggest that the climate response depends on the model used, and that the reasons for this model dependence are not clear.

We present results from the Southern Ocean Freshwater Input from Antarctica (SOFIA) Initiative, an international model intercomparison, in which freshwater is added to the ocean surrounding Antarctica to simulate the otherwise missing ice-sheet mass loss. This unique suite of models allows us compare the response to Antarctic mass loss across climate models, identify reasons for model discrepancies, and quantify the potential impact of the absence of increasing Antarctic ice-mass loss on Antarctic sea ice and climate. We will give an overview of the SOFIA initiative including the experiment design and participating models. We will present results from the “antwater” experiment outlined in the SOFIA protocol in which a constant freshwater input of 0.1 Sv is distributed evenly around the Antarctic continent at the ocean surface in an experiment with pre-industrial control forcing. We show that there is a spread of up to a factor of 3 across models in the Antarctic sea ice area response to identical freshwater forcing. There are also substantial differences in the spatial pattern of the sea ice response depending on the model used. We explore the dependence of the response on the mean state of Antarctic sea ice and the Southern Ocean in the pre-industrial control runs, as well as the response of the ocean stratification and oceanic deep convection in the models. We also explore the seasonality of the sea ice and oceanic response.

How to cite: Pauling, A., Swart, N., Martin, T., Beadling, R., Chen, J.-J., England, M., Farneti, R., Griffies, S., Hattermann, T., Haumann, F. A., Li, Q., Marshall, J., Muilwijk, M., Purich, A., Ridley, J., Smith, I., and Thomas, M.: Sea ice and climate impacts from Antarctic ice-mass loss in the SOFIA multi-model ensemble, EGU General Assembly 2024, Vienna, Austria, 14–19 Apr 2024, EGU24-12592, https://doi.org/10.5194/egusphere-egu24-12592, 2024.

Antarctica's solar-warmed surface waters subduct beneath the region's ice shelves as a result of Ekman forcing. In December 2022, an ocean glider collected unprecedented observations of such waters beneath the Ross Ice Shelf, during a serendipitous four-day foray into the sub-glacial cavity; the glider surveyed the cavity in high resolution between the ice base and a depth of 200 m. During most of this period, a 50 m-thick layer of water with a high chlorophyll concentration, which must have come from the Ross Sea polynya and which has the same properties as waters immediately beneath adjacent sea ice, was in contact with the ice base. Super-cooled water was also sometimes observed to be in contact with the ice base. When warm water was present, temperature in the uppermost 5 m decreased towards the ice base in near-perfect agreement with an exponential fit. When super-cooled water was present, no such decrease was observed. From these observations, we estimate the heat loss from the ocean to overlying ice sheet. From re-analysis output, we demonstrate that Ekman forcing drives a heat into the sub-glacial cavity sufficient to contribute significantly to near-front melting of the Ross Ice Sheet. We further show that there has been an increase in the Ekman heat flux into the cavity over the last four decades (i.e. since 1979); this is driven by an increase in the heat content of the seasonally ice-free waters of the Ross Sea polynya, immediately in front of the ice shelf. Interannual variability of the Ekman heat flux, however, is driven not by ocean heat content, or indeed by sea ice cover, but by interannual variability of the along-front zonal wind stress.

How to cite: Sheehan, P. and Heywood, K.: Observations and year-on-year increase of warm surface waters entering the Ross Ice Shelf cavity, EGU General Assembly 2024, Vienna, Austria, 14–19 Apr 2024, EGU24-12628, https://doi.org/10.5194/egusphere-egu24-12628, 2024.

EGU24-13601 | ECS | Posters virtual | OS1.6

Seasonal circulation and volume transport in the Gerlache Strait 

Laia Puyal-Astals, Borja Aguiar-González, Marta Veny, and Francisco Machín

We present the first observational-based assessment of the year-round circulation and volume transport in the Gerlache Strait, a key location for the water mass exchanges occurring along the west Antarctic Peninsula (wAP) between the relatively warm Bellingshausen Sea, flowing northeastward, and the colder Weddell Sea, flowing southwestward. These relatively warm/cold ocean water pathways have been documented to play a major role in the glacier retreat/stabilization of glaciers along the wAP (Cook et al., 2016). Bearing this in mind, we investigate a dataset of direct velocity measurements which were routinely collected along ship tracks from 379 cruises performed by R/V Nathaniel B. Palmer and R/V Laurence M. Gould between 1999 and 2018. A first set of analyses of an earlier version of this dataset was presented in Savidge & Amft (2009), who focused on the summer and winter views of the shelf circulation along the entire wAP. More recently, an updated version of such a dataset addressed the year-round circulation and volume transport of the Bransfield Current in the Bransfield Strait between 1999 and 2014 (Veny et al., 2022).

Preliminary results of this work focus on the ocean current variability displayed between 2008 and 2009, two years known in the literature as featuring remarkably opposite Weddell Sea influences along the central wAP (Wang et al., 2022); the former year with a weaker influence than the later one. Ongoing steps include the construction of a high-resolution (~5km) seasonal climatology of the ocean currents flowing through the Gerlache Strait, where the dataset of study ensures a multi-year spatial coverage of volume transport.

Key words: Gerlache Strait, Direct Velocity Measurements, Dynamic Structure, Volume Transport, Seasonal and Interannual Variability.

References: 

Cook, A. J., Holland, P. R., Meredith, M. P., Murray, T., Luckman, A., & Vaughan, D. G. (2016). Ocean forcing of glacier retreat in the western Antarctic Peninsula. Science, 353(6296), 283–286. https://doi.org/10.1126/science.aae0017

Savidge, D. K., & Amft, J. A. (2009). Circulation on the West Antarctic Peninsula derived from 6 years of shipboard ADCP transects. Deep Sea Research Part I: Oceanographic Research Papers, 56(10), 1633–1655. https://doi.org/10.1016/j.dsr.2009.05.011

Veny, M., Aguiar-González, B., Marrero-Díaz, Á., & Rodríguez-Santana, Á. (2022). Seasonal circulation and volume transport of the Bransfield Current. Progress in Oceanography, 204, 102795. https://doi.org/10.1016/j.pocean.2022.102795

Wang, X., Moffat, C., Dinniman, M. S., Klinck, J. M., Sutherland, D. A., & Aguiar‐González, B. (2022). Variability and Dynamics of Along‐Shore Exchange on the West Antarctic Peninsula (WAP) Continental Shelf. Journal of Geophysical Research: Oceans, 127(2). https://doi.org/10.1029/2021JC017645

How to cite: Puyal-Astals, L., Aguiar-González, B., Veny, M., and Machín, F.: Seasonal circulation and volume transport in the Gerlache Strait, EGU General Assembly 2024, Vienna, Austria, 14–19 Apr 2024, EGU24-13601, https://doi.org/10.5194/egusphere-egu24-13601, 2024.

EGU24-15178 | Orals | OS1.6

Water mass formation and export from the Filchner-Ronne Ice Shelf 

Markus Janout, Mathias van Caspel, Elin Darelius, Peter Davis, Tore Hattermann, Mario Hoppmann, Torsten Kanzow, Svein Østerhus, Jean-Baptiste Sallée, and Nadine Steiger

The Filchner-Ronne-Ice Shelf (FRIS) is the earth’s largest ice shelf by volume and its cavity a crucial part of the southern Weddell Sea ocean circulation. In mid-2017, the Filchner Ice Shelf (FIS) cavity experienced a shift towards a stronger circulation and increased outflow of Ice Shelf Water (ISW) into Filchner Trough. The increase was attributed to enhanced sea ice formation and the associated production of High Salinity Shelf Water (HSSW) in the source region north of Ronne Ice Shelf. The corresponding circulation pattern was termed “Ronne-mode”, which contrasts the “Berkner-mode”, characterized by a more locally-enhanced circulation at the northern FIS edge. Here we employ new time series from two drill hole mooring sites underneath FIS, as well as moorings from the Filchner Trough and Filchner Sill, to highlight the spatial and temporal extent of this recent ISW outflow event. Underneath FIS, the “Ronne-mode” overruled the normally-observed seasonality in currents and hydrography, and resulted in northward ISW transport for about two years. The export led to the subsequent filling of Filchner Trough with ISW from 2018 until mid-2020, which then overflowed across the Sill between late 2018 for nearly one year. Our observations provide new insights into the variability of the southern Weddell Sea shelf and FRIS cavity circulation, which is important for the abyssal water mass export and thus for global ocean circulation.

How to cite: Janout, M., van Caspel, M., Darelius, E., Davis, P., Hattermann, T., Hoppmann, M., Kanzow, T., Østerhus, S., Sallée, J.-B., and Steiger, N.: Water mass formation and export from the Filchner-Ronne Ice Shelf, EGU General Assembly 2024, Vienna, Austria, 14–19 Apr 2024, EGU24-15178, https://doi.org/10.5194/egusphere-egu24-15178, 2024.

EGU24-16331 | ECS | Orals | OS1.6

Deciphering the impact of future individual Antarctic freshwater sources on the Southern Ocean properties and ice shelf basal melting 

Christoph Kittel, Nicolas Jourdain, Pierre Mathiot, Violaine Coulon, Clara Burgard, Justine Caillet, Damien Maure, and Clara Lambin

The Antarctic ice sheet is losing mass. This mass loss is primarily due to ice shelf basal melting and the subsequent acceleration of glaciers. The substantial freshwater fluxes resulting from ice shelf and iceberg melting affect the Southern Ocean and beyond. As emphasized by some studies, they slow down the decline of Antarctic sea ice and hinder mixing between surface water and Circumpolar Deep Waters, further intensifying ice shelf basal melting. In this context, most studies so far have neglected the impact of surface meltwater runoff , but recent CMIP6 projections using the SSP5-8.5 scenario challenge this view, suggesting runoff values in 2100 similar to current basal melt rates. This prompts a reassessment of surface meltwater future impact on the ocean.  We use the ocean and sea-ice model NEMO-SI3 resolving the sub-shelf cavities of Antarctica and including an interactive iceberg module. We perform thorough sensitivity experiments to disentangle the effect of changes in the atmospheric forcing, increased ice shelf basal melting, surface freshwater runoff and iceberg calving flux by 2100 in a high-end scenario. Contrary to expectations, the atmosphere alone does not substantially warm ice shelf cavities compared to present temperatures. However, the introduction of additional freshwater sources amplifies warming, leading to escalated melt rates and establishing a positive feedback. The magnitude of this effect correlates with the quantity of released freshwater, with the most substantial impact originating from ice shelf basal melting. Moreover, larger surface freshwater runoff and iceberg calving flux contribute to further cavity warming, resulting in a noteworthy 10% increase in ice shelf basal melt rates. We also describe a potential tipping point for cold ice shelves, such as Filchner-Ronne, before the year 2100.

How to cite: Kittel, C., Jourdain, N., Mathiot, P., Coulon, V., Burgard, C., Caillet, J., Maure, D., and Lambin, C.: Deciphering the impact of future individual Antarctic freshwater sources on the Southern Ocean properties and ice shelf basal melting, EGU General Assembly 2024, Vienna, Austria, 14–19 Apr 2024, EGU24-16331, https://doi.org/10.5194/egusphere-egu24-16331, 2024.

EGU24-16511 | Orals | OS1.6

Cryospheric Change as a Driver of Antarctic Seep Emergence  

Sarah Seabrook, Andrew Thurber, Yoann Ladroit, Vonda Cummings, Leigh Tait, Alicia Maurice, and Cliff Law

While the climate sensitivity and significance of subsurface fluid and greenhouse gas reservoirs have received attention in the Arctic, the presence of these features in Antarctica and their contribution to global methane and the carbon cycle remains unknown. Here, we report the discovery of extensive and emergent seafloor seeps, some initiated within the last decade, that are releasing climate-reactive fluids and gases in the coastal Ross Sea. Emission of methane in these shallow waters would expedite transfer to the atmosphere, as reported at other shallow global seep systems. While the origin, driving mechanisms, and environmental consequence of these emerging Antarctic seep systems remains unknown, we postulate that the emergent seepage results from cryospheric cap degradation, which initiates new fluid flow pathways and liberates subsurface fluids and gases. This mechanism is inherently climate sensitive with potential for positive feedback, and may be widespread around the Antarctic Continent, yet the magnitude and scale is currently undetermined. 

How to cite: Seabrook, S., Thurber, A., Ladroit, Y., Cummings, V., Tait, L., Maurice, A., and Law, C.: Cryospheric Change as a Driver of Antarctic Seep Emergence , EGU General Assembly 2024, Vienna, Austria, 14–19 Apr 2024, EGU24-16511, https://doi.org/10.5194/egusphere-egu24-16511, 2024.

The Southern Ocean (SO) plays a key role in global carbon and nutrient cycles, as the SO overturning circulation feeds into both deep-water formation (lower branch) and Subantarctic intermediate and mode water formation (upper branch). While the air-sea CO2 balance is influenced mainly by deep-water formation, global export production is more sensitive to intermediate and mode water formation, giving rise to the concept of a SO biogeochemical divide [1]. Sea ice formation, transport and melting plays a prominent role in the transformation of buoyancy for both the upper and lower branches of the overturning circulation [2]. Hence, changes in sea ice parameterisation have potential for substantially altering carbon uptake and export production in global Earth System Models (ESMs).

Global ESMs seek to simulate physical, chemical and biological processes that are relevant for the evolution of global climate, including fluxes of greenhouse gasses and aerosols between the atmosphere and ocean. The air-sea gas exchange is determined by the difference in concentration across the air-sea interface, and a gas transfer velocity that is specific for the gas in question. However, the air-sea gas exchange is inhibited by the presence of sea ice. A modified formula proposed by Steiner et al. [3], accounting for cracks and leads in the sea ice, has recently been  implemented in the Norwegian Earth System Model NorESM2 [4]. In this study we investigate how the change in this sea ice parameterisation influences the carbon uptake and export production associated with the Southern Ocean overturning circulation.

REFERENCES

[1] I. Marinov, A. Gnanadesikan, J. R. Toggweiler and J. L. Sarmiento, "The Southern Ocean biogeochemical divide", Nature, Vol. 441, 964-967, 2006. DOI: 10.1038/nature04883

[2] R. P. Abernathey, I. Cerovecki, P. R. Holland, E. Newsom, M. Mazlo and L. D. Talley, "Water-mass transformation by sea ice in the upper branches of
the Southern Ocean overturning", Nature Geoscience, Vol. 9, 596-601, 2016. DOI: 10.1038/ngeo2749

[3] N. S. Steiner, W. G. Lee and J. R. Christian, "Enhanced gas uxes in small sea ice leads and cracks: Efects on CO2 exchange and ocean acidiccation", JGR Oceans, Vol. 118(3), 1195-1205, 2013. DOI: 10.1002/jgrc.20100

[4] Ø. Seland, M. Bentsen, D. Olivié, T. Toniazzo, A. Gjermundsen, L. S. Graff, J. B. Debernard, A. K. Gupta, Y.-C. He, A. Kirkevåg, J. Schwinger, J. Tjiputra, K. S. Aas, I. Bethke, Y. Fan, J. Griesfeller, A. Grini, C. Guo, M. Ilicak, I. H. H. Karset, O. Landgren, J. Liakka, K. O. Moseid, A. Nummelin, C. Spensberger, H. Tang, Z. Zhang, C. Heinze, T. Iversen and M. Schulz, "Overview of the Norwegian Earth System Model (NorESM2) and key climate response of CMIP6 DECK, historical, and scenario simulations", Geoscientifc Model Development, Vol. 13(12), 6165-6200, 2020. DOI: 10.5194/gmd-13-6165-2020

How to cite: Torsvik, T.: Influence of changing sea ice parameterisation on Southern Ocean  carbon uptake and export production, EGU General Assembly 2024, Vienna, Austria, 14–19 Apr 2024, EGU24-16957, https://doi.org/10.5194/egusphere-egu24-16957, 2024.

EGU24-17376 | ECS | Posters on site | OS1.6

Present-day ocean simulations of the circumpolar Antarctic 

Birgit Rogalla, Kaitlin Naughten, Paul Holland, Pierre Mathiot, Nicolas Jourdain, and Christoph Kittel

The West Antarctic Ice Sheet (WAIS) is rapidly losing mass due to ocean-driven melt of its ice shelves, contributing to sea level rise. This melt is associated with the intrusion of circumpolar deep water onto the continental shelf which is impacted by winds, the Amundsen undercurrent, thermodynamic processes, and buoyancy forcing. To study the sensitivity of melt to changes in these components, model configurations need to represent key processes while reducing computational cost to allow for large ensemble simulations. Regional ocean simulations have proven useful in this context, however, configurations that allow interactions between Antarctic regions would be beneficial. We will present results from present-day ocean simulations with a  ¼° circumpolar Antarctic NEMO configuration including sea ice, icebergs, and ice shelf cavities, and up-to-date forcing and bathymetry datasets. We will also discuss challenges associated with open boundary conditions and sensitivity to different forcing datasets. This configuration will provide a platform for attribution studies of ocean-driven melt of the WAIS, ocean projections, and form the starting point for coupled ocean-ice sheet simulations. 

How to cite: Rogalla, B., Naughten, K., Holland, P., Mathiot, P., Jourdain, N., and Kittel, C.: Present-day ocean simulations of the circumpolar Antarctic, EGU General Assembly 2024, Vienna, Austria, 14–19 Apr 2024, EGU24-17376, https://doi.org/10.5194/egusphere-egu24-17376, 2024.

EGU24-17676 | ECS | Orals | OS1.6

Benefits of the Brinkman Volume Penalisation Method for the Ice-Shelf Melt Rates Produced by Z-coordinate Ocean Models 

Antoine-Alexis Nasser, Nicolas C. Jourdain, Pierre Mathiot, and Gurvan Madec

Antarctic ice-shelf basal melting is a major source of uncertainty in sea level rise projections. A persistent challenge in simulating the ice-shelf-ocean interactions in z-coordinate ocean models is the introduction of artificial steps, leading to the generation of noise that impacts both melting and ocean currents. This study explores the potential of the Brinkman Volume Penalisation (BVP) method (Debreu et al. 2020, 2022) to address the recurrent issue of steps in ice-shelf-ocean models. While penalisation methods are typically applied to land topography, here, the method is generalised to ice-shelf interactions with oceans. This approach introduces porous cells that are half-ice, half-ocean, combined with a permeability parameter (friction within porous cells) to model the blocking effect of the ice draft. A unique aspect of this method is its ability to spread the penalisation region, thereby reducing model sensitivity to numerical level changes. We assess the potential benefits of the BVP approach within the idealised ice-shelf configuration ISOMIP+ as presented by Asay-Davis et al. (2016). First, a new calculation of the horizontal pressure gradient is formulated using the BVP approach, which eliminates residual biases in ocean currents down to zero machine precision. Second, the spreading of the penalised interface significantly reduces noise in the melt rates, enabling a smooth response of the ocean beneath the ice-shelf without the need for further mesh refinement. Other simulations are used to investigate the sensitivity of basal melting and freezing in the penalised configuration to changes in numerical parameters (e.g. spatial resolution). These results pave the way for a better numerical treatment of ice-shelves in earth system models.

How to cite: Nasser, A.-A., Jourdain, N. C., Mathiot, P., and Madec, G.: Benefits of the Brinkman Volume Penalisation Method for the Ice-Shelf Melt Rates Produced by Z-coordinate Ocean Models, EGU General Assembly 2024, Vienna, Austria, 14–19 Apr 2024, EGU24-17676, https://doi.org/10.5194/egusphere-egu24-17676, 2024.

EGU24-20002 | ECS | Orals | OS1.6

Weddell Sea subsurface warming revealed by an updated Southern Ocean climatology 

Shenjie Zhou, Pierre Dutrieux, and Andrew Meijers

A new monthly climatology of Southern Ocean hydrography is constructed with updated observational dataset. CTD casts from World Ocean Database, Pangaea Database, CLIVAR and Carbon Hydrographic Data Office, Southern Ocean Database and Korean Polar Data Centre were assembled. All ‘Delayed Mode’ Argo floats profiles and ‘Real-time Mode’ or ‘Real-time Adjusted Mode’ over the within 2000 m isobath near the continental shelves are included. All flagged-good Seal-tag profiles are included. The interpolation scheme employs an elliptical detecting area to select profiles to be averaged into gridded product. The ellipse is designed to align with the dynamic height contour to consider the effect of large-scale circulation. The detecting radius confined by ellipse size varies with the bathymetry and facilitate to resolve local gradient in temperature and salinity field over the continental shelves. A timeseries is constructed by removing the temperature and salinity climatology from the individual profiles in Weddell Sea, and a clear subsurface warming is revealed. An entrainment of warm and saline anomalies from subsurface into the surface layer is captured around 2016 corresponding to the recent sea ice extent decline. A further regional analysis on the temperature and salinity anomaly signal will shed light on the heat delivery pathway and the cause of the subsurface heat entrainment.

How to cite: Zhou, S., Dutrieux, P., and Meijers, A.: Weddell Sea subsurface warming revealed by an updated Southern Ocean climatology, EGU General Assembly 2024, Vienna, Austria, 14–19 Apr 2024, EGU24-20002, https://doi.org/10.5194/egusphere-egu24-20002, 2024.

EGU24-152 | ECS | Orals | OS1.7

Improving Estimates of Arctic Ocean CO2 Uptake 

Victoria Dutch, Dorothee Bakker, Peter Landschützer, Alizée Roobaert, and Jan Kaiser

The Arctic Ocean covers only 3 % of the Earth’s surface but contributes 5 - 14 % of the global ocean carbon sink. Sparse and unevenly distributed observations of the partial pressure of CO2 (pCO2) hinder our understanding of the magnitude and the controlling mechanisms of this carbon sink. In order to constrain the magnitude of this flux, we adapt the Self-Organising Map – Feed-Forward neural Network (SOM-FFN) method of Landschützer et al. (2016) to interpolate existing observations and construct a monthly 1 x 1 degree pCO2 product for the Arctic Ocean from 1991 - 2022. We first divide the Arctic Ocean (i.e., the region ≥ 55° N) into five biogeochemical provinces; four obtained from using the SOM method and a fifth for all grid cells with greater than 85 % ice cover. For each province, we then derive non-linear relationships between pCO₂ and predictor variables (i.e., biogeochemical drivers) using the FFN method. The monthly reconstructed Arctic pCO2 product is then evaluated against existing observations of surface ocean pCO2, chiefly from SOCATv2023 and from independent timeseries stations. Our study shows that biogeochemical properties previously selected as predictor variables at the global scale are not well suited to the Arctic Ocean. Limiting the spatial domain from which relationships are derived also improves performance, with less biased p(CO2) values predicted when excluding the Baltic Sea. 

How to cite: Dutch, V., Bakker, D., Landschützer, P., Roobaert, A., and Kaiser, J.: Improving Estimates of Arctic Ocean CO2 Uptake, EGU General Assembly 2024, Vienna, Austria, 14–19 Apr 2024, EGU24-152, https://doi.org/10.5194/egusphere-egu24-152, 2024.

EGU24-232 | Orals | OS1.7

Coral Reefs: Sinks of Atmospheric CO2 ? 

Hamish McGowan, Nadav Lensky, Shai Abair, and Mellissa Saunders

Quantification of air-sea CO2 exchange over coral reefs has relied primarily on measurements of the CO2 partial pressure (pCO2) gradient between the water overlying a reef and the lower atmosphere. A gas transfer velocity based on wind speed is then used to estimate the air-sea CO2 mass exchange. While this approach may be suitable over the oceans or where instrumented buoys have been deployed for long-term monitoring, the method overlooks many factors that influence turbulent transport and air-sea CO2 exchange. These include surfactants, bubble exchange, atmospheric turbulence, and wave breaking, which may be particularly important over near shore fringing coral reefs.


Using eddy covariance (EC) systems deployed at the shoreline adjacent to coral reefs and on pontoons we show through direct measurements these ecosystems may be net sinks of atmospheric CO2. Results show sequestration of atmospheric CO2 by healthy coral reefs and adjacent lagoons at time scales of several days to several months exceed published CO2 sequestration rates of mature pine plantations measured by EC by an order of magnitude. These findings highlight the importance of coral reefs in carbon budgets in addition to their widely known ecosystem services and societal benefits. Conserving coral reef ecosystems and ensuring they remain healthy and resilient to the threats of climate change, pollution, overfishing, tourism, and mining should be a priority. Future research will aim to track the CO2 influx through coral reef ecosystems.        

How to cite: McGowan, H., Lensky, N., Abair, S., and Saunders, M.: Coral Reefs: Sinks of Atmospheric CO2 ?, EGU General Assembly 2024, Vienna, Austria, 14–19 Apr 2024, EGU24-232, https://doi.org/10.5194/egusphere-egu24-232, 2024.

EGU24-290 | ECS | Orals | OS1.7

How the treatment of sea surface temperature affects the water cycle in EURO-CORDEX simulations 

Francis Da Silva Lopes and Michael Schindelegger

Regional climate models (RCMs) over Europe often exhibit wet precipitation biases, primarily attributed to excess oceanic evaporation across time scales. One likely source for such wet biases are therefore imperfections in the models’ lower boundary condition (LBC) over the ocean, as realized by time-evolving sea surface temperature (SST) fields. SST data from atmospheric reanalyses (e.g., ERA5) are commonly adopted in RCMs, but ambiguity exists about the exact SST variable in these products (e.g., foundation or skin temperature) and the manner with which they represent the diurnal cycle and spatial gradients. Here we explore these questions with a ~12-km setup of ICON-CLM (Icosahedral Nonhydrostatic Model in Limited-Area Mode) over the EURO-CORDEX domain, run repeatedly for 6 years with various SST datasets. We use ERA5-based daily SST and skin temperature and hourly upper-layer SST drawn from our own global ocean simulations with FESOM2 (Finite Element Sea-Ice Ocean Model) at ~10-km node spacing in the eastern North Atlantic. Specifically, prescribing the FESOM2 SST fields in ICON-CLM both with and without spatial smoothing allows us to examine the effects of oceanic eddies and fronts on precipitation characteristics onshore. Preliminary results from 7 months of integration with ICON-CLM suggest that the choice of the SST data appreciably impacts latent heat fluxes, moisture transport onto land, and cumulative continental precipitation, generally in areas of pronounced moisture recycling. “Mind your SST” is therefore the advice we can give to ongoing dynamical downscaling efforts aimed at modeling future precipitation changes over land.

How to cite: Da Silva Lopes, F. and Schindelegger, M.: How the treatment of sea surface temperature affects the water cycle in EURO-CORDEX simulations, EGU General Assembly 2024, Vienna, Austria, 14–19 Apr 2024, EGU24-290, https://doi.org/10.5194/egusphere-egu24-290, 2024.

EGU24-730 | ECS | Posters on site | OS1.7

Estimates of Arctic Ocean carbon uptake from atmospheric inverse analyses for the period 2000-2017 

Jayashree Ghosh, Parvadha Suntharalingam, Zhaohui Chen, Jan Kaiser, Dorothee Bakker, and Victoria Dutch

 The Arctic Ocean is responsible for around 5-10% of oceanic CO2 uptake, despite the region only accounting for approximately 4% of the world's oceans (Bates & Mathis, 2009). In this study, we investigate the exchange of CO2 between the atmosphere and the ocean in the Arctic Ocean for the period 2000-2017. Our estimates are obtained using the GEOSChem-LETKF inverse model system (Chen et al. 2021), in combination with data from the NOAA surface CO2 monitoring network (ObsPack, Cooperative Global Atmospheric Data Integration Project, 2018). We evaluate the impact of alternative representations of the prior flux distribution for air-sea CO2 fluxes. These include the following datasets: Landschutzer et al. (2016), Rodenbeck et al. (2014), and Watson et al. (2020). We present estimates of the long-term trend, year-to-year fluctuations, and regional and seasonal variability in air-sea CO2 exchange in the Arctic Ocean, with a focus on the region north of 58˚N. The sea ice extent of the regional seas of the Arctic Ocean has an influence on the magnitude and seasonality of the regional air-sea CO2 flux. We also investigate the potential links between changes in sea-ice extent and changes in air-sea CO2 fluxes.

How to cite: Ghosh, J., Suntharalingam, P., Chen, Z., Kaiser, J., Bakker, D., and Dutch, V.: Estimates of Arctic Ocean carbon uptake from atmospheric inverse analyses for the period 2000-2017, EGU General Assembly 2024, Vienna, Austria, 14–19 Apr 2024, EGU24-730, https://doi.org/10.5194/egusphere-egu24-730, 2024.

EGU24-732 | ECS | Posters on site | OS1.7

Cross-linking laboratory and field measurements to quantify the role of bubbles in air-sea CO2 exchange 

Yuanxu Dong, Bernd Jähne, and Christa Marandino

The global oceans are a major sink of anthropogenic carbon dioxide (CO2), playing a critical role in mitigating climate change. The ocean CO2 uptake estimate contains significant uncertainties due to a lack of mechanistic understanding of the role of bubbles in air-sea CO2 exchange. Bubbles resulting from wave breaking may mediate about 40% of the global air-sea CO2 flux.  However, bubble-mediated transfer is poorly quantified and under-represented in CO2 flux estimates. In this study, we will present a synthesis analysis of the bubble-mediated gas transfer measurements in the last decade. We show contrasting evidence regarding the importance of bubbles in the air-sea CO2 exchange, particularly in the comparison between laboratory and field measurements. This suggests a lack of mechanistic understanding of the air-sea gas exchange processes. Through innovative cross-linking of comprehensive field and laboratory observations using multiple techniques, we aim to make a step change in understanding the mechanisms of bubble-mediated transfer and reconcile field and laboratory measurements.  We also aim to provide novel parameterisations of gas transfer velocity with explicit representation of bubbles, thereby reducing uncertainty in air-sea CO2 flux estimates.

How to cite: Dong, Y., Jähne, B., and Marandino, C.: Cross-linking laboratory and field measurements to quantify the role of bubbles in air-sea CO2 exchange, EGU General Assembly 2024, Vienna, Austria, 14–19 Apr 2024, EGU24-732, https://doi.org/10.5194/egusphere-egu24-732, 2024.

EGU24-1139 | ECS | Orals | OS1.7

Sampling the SML for traces gases: a case study of sampling technique and resulting correction factors 

Lea Lange, Dennis Booge, Josefine Karnatz, Hermann Bange, and Christa Marandino

The sea surface microlayer (SML) is the uppermost thin oceanic surface layer in the range of 100µm with properties that are distinct from the water below. With an ocean coverage of up to 70% it is supposed to have a significant impact on air-sea gas exchange rates. In global studies, the SML is often supposed to be a missing source of trace gases, when oceanic production and the subsequent emissions alone cannot explain observed atmospheric mixing ratios. Despite the attention in the past 20 years, also in the SOLAS science plan, it remains difficult to sample volatile trace gases from the SML with existing sampling techniques. Consequently, an incomplete process understanding of trace gas cycling within the SML inhibits its effect on air-sea gas exchange.

In this study, we focus on existing and common SML sampling methods (glass plate, Garrett screen) in order to ensure that trace gas samples are comparable to other parameters sampled with the same method. A series of laboratory experiments was set up to determine a correction factor which quantifies the loss of trace gases due to the sampling method itself. Dimethyl sulfide, isoprene and carbon disulfide were sampled with a glass plate and with a Garrett screen under varying surfactant concentrations and environmental conditions (salinity, temperature). Based on physiochemical properties of the examined trace gases, we extended the correction factor to nitrous oxide and methane. Losses are high, but not as variable as expected. Around 90% are lost due to sampling with small variations between different gases. The presence of surfactants has a small effect on the losses.

The lab-based correction factors are applied to in-field SML samples from a mesocosm study in May/June 2023 conducted within the DFG research unit BASS. Those results clearly indicate that the composition of the SML highly influences the correction factor for each trace gas individually. Comparing corrected SML concentrations with underlying bulk water concentrations reveal the accumulation of specific traces gases in the SML which highly influence the magnitude of trace gas emissions to the atmosphere.

How to cite: Lange, L., Booge, D., Karnatz, J., Bange, H., and Marandino, C.: Sampling the SML for traces gases: a case study of sampling technique and resulting correction factors, EGU General Assembly 2024, Vienna, Austria, 14–19 Apr 2024, EGU24-1139, https://doi.org/10.5194/egusphere-egu24-1139, 2024.

EGU24-1372 | ECS | Orals | OS1.7

Carbonate System Changes Within an Evaporating Sea Spray Droplet 

Lucy Hendrickson, Penny Vlahos, and Leonel Romero

Modeling the air-sea flux of CO2 is a key factor in understanding climate change and predicting its effects. The contribution of sea spray to this flux is highly uncertain yet important for reducing error margins in global estimates. In this work, a modified CO2SYS routine is used to quantify the effect of evaporation on aqueous carbonate reactions in sea spray in order to assess this flux. Factors that affect these reactions are the increasing salinity and temperature changes of the droplet as it evaporates. The size of the droplet is also a determining factor as it affects the time aloft and thus the amount of evaporation and gas exchange that can occur. Using these factors and a number of simplifying assumptions, we model the change in DIC, TA, pCO2 and pH in an evaporating sea spray droplet.

How to cite: Hendrickson, L., Vlahos, P., and Romero, L.: Carbonate System Changes Within an Evaporating Sea Spray Droplet, EGU General Assembly 2024, Vienna, Austria, 14–19 Apr 2024, EGU24-1372, https://doi.org/10.5194/egusphere-egu24-1372, 2024.

EGU24-2187 | ECS | Orals | OS1.7 | Highlight

Impact of the ocean-atmosphere coupling on Mediterranean cyclones 

Marco Chericoni, Giorgia Fosser, and Alessandro Anav

The Mediterranean basin is well recognized as one of the main climate change hotspots; besides, this region is one of the most active cyclogenetic area of the Northern Hemisphere with a large number of intense cyclones occurring every year. Intense Mediterranean cyclones are often responsible for extreme precipitation and strong wind events leading to severe socio-economic and environmental impacts especially over densely populated coastal areas. Complex feedback between the Mediterranean Sea and the atmosphere on various temporal and spatial scales plays a major role in the variability in and extremes of the regional climate system.

This study aims to investigate the impact of the ocean-atmosphere coupling on the regional climate during intense Mediterranean cyclones. To this end, two simulations are performed using the ENEA-REG regional earth system model at 12 km atmospheric horizontal resolution over the Med-CORDEX domain, both driven by ERA5 reanalysis. The first experiment uses the mesoscale WRF model with prescribed ERA5 Sea Surface Temperature (SST), while the second is coupled to the MITgcm ocean model at horizontal resolution of 1/12°. Cyclones are tracked by applying a Lagrangian algorithm to the mean sea level pressure field. The 500 most intense cyclones mainly occur in winter over the Thyrrenian, Adriatic, Ionian and Aegean Sea. They are similarly reproduced between WRFs and ERA5 in terms of seasonal and spatial distribution, due to the same large-scale atmospheric conditions. The coupled simulation is compared with the standalone WRF in terms of sub-daily fields, such as evaporation, precipitation and wind speed, during the mature stage of the cyclones. The different SST distribution between the models appears to be the main controlling factor for the differences in the atmospheric properties affecting not only the surface, but also the entire atmospheric boundary layer (ABL) and its height, due to the mixing of the turbulent processes, enhanced during intense cyclones. A statistically significant higher specific humidity and wind speed are found in the coupled model from the surface to the top of the ABL, as well as higher precipitation over sea and coastal areas. These results are consequences of higher turbulent heat and moisture fluxes in the coupled model that destabilize the ABL and provide higher moisture content available for convection.

We conclude that the use of the coupled model is crucial for a more realistic representation of the energy redistribution in both the ocean mixed layer and the ABL during intense Mediterranean cyclones. This highlights the importance of the coupled model to study the influence of climate change on intense Mediterranean cyclones and associated impacts under different future scenarios.

How to cite: Chericoni, M., Fosser, G., and Anav, A.: Impact of the ocean-atmosphere coupling on Mediterranean cyclones, EGU General Assembly 2024, Vienna, Austria, 14–19 Apr 2024, EGU24-2187, https://doi.org/10.5194/egusphere-egu24-2187, 2024.

The climatological mean and trend of salinity change evidently due to the acceleration of hydrological cycle under global warming. However, no systematic research has been focused on the decadal and long-term changes of salinity and their contributions to ocean stratification during 1940-2019. In this study, the nonlinear trend of salinity is firstly exacted using the ensemble empirical mode decomposition method, and the corresponding long-term trends and their impacts on stratification in the tropical Pacific are analyzed emphatically. The results confirm that the sea surface water becomes fresher in the tropical western Pacific and southern Pacific convergence zone, while saltier in the southeastern Pacific under global warming. Moreover, the salinity changes are regional- and time-dependent, which the salinity trends in different regions of the tropical Pacific show differences at different periods responding to SST trend. As results, under the combined effects of temperature and salinity, the sea surface density reduces significantly in the tropical Pacific, with the largest reduction centered in the warm pool, while the subsurface density in the tropical western Pacific increases. These opposite changes enhance the contrast for the density between the surface and the subsurface water, leading to more stable ocean stratification. Then, the mixed layer becomes shallower near the equatorial dateline and deeper in the warm pool, mainly due to salinity variations. Salinity and temperature contribute differently to the variations of barrier layer thickness in different regions, where the changes of salinity (temperature) correspond to the thickening of barrier layer located at 160°E east (west). It is suggested that the salinity variations in the Pacific affect the ocean thermodynamic processes under global warming, which then modulate the climate variability.

How to cite: hai, Z.: Salinity Change and Its Implications for Ocean Stratification in the Tropical Pacific under Global Warming, EGU General Assembly 2024, Vienna, Austria, 14–19 Apr 2024, EGU24-2734, https://doi.org/10.5194/egusphere-egu24-2734, 2024.

The cool skin effect, known as the temperature difference (ΔT) across the skin layer of sea surface, is of vital importance for the accurate computation of the latent heat flux (LHF). The observed features of ΔT in the South China Sea are analyzed using in situ data from a buoy platform over an approximately six-week period. Only nighttime data are used to exclude the possible warm layer effect. The positive values of ΔT falling into the range of 0 to 1 K comprise 95% of the data, and the most frequently observed values occur in the range of 0.4 to 0.6 K (38%). The cool skin model in the COARE 3.0 algorithm is then validated against those observations. The cool skin model has an efficient but insufficient ability to reduce the overestimation of the LHF. The overestimation of the LHF is reduced to 9.5% from 18.0%, leaving nearly half of the biases in the LHF unresolved. The Saunders constant (λ) in the cool skin model is markedly underestimated, leading to a much weaker prediction of ΔT. A strong linear relationship exists between the mean values of λ and the LHF with a slope of -0.9 W m-2. With an approximately doubled λ, the biases in ΔT and in the LHF could be eliminated. Considering the possible uncertainties in sensors, the value of λ is estimated as 11.6±6.7 in the current study.

How to cite: Zhang, R.: Cool Skin Effect and its Impact on the Computation of the Latent Heat Flux in the South China Sea, EGU General Assembly 2024, Vienna, Austria, 14–19 Apr 2024, EGU24-3766, https://doi.org/10.5194/egusphere-egu24-3766, 2024.

EGU24-3811 | Posters on site | OS1.7

Impact of ocean vertical mixing parametrization on sea ice properties using NEMO-SI3 model in the Arctic Ocean 

Sofia Allende, Anne Marie Treguier, Camille Lique, Clément de Boyer Montégut, François Massonnet, and Thierry Fichefet

In recent decades, global climate change has strongly affected the Arctic region, leading to a rapid decline in sea ice extent. This decline affects the interactions between sea ice, the atmosphere, and the ocean, driven by complex thermodynamic and dynamical processes. The Arctic mixed layer (ML), located in the upper ocean, plays a key role in regulating the interactions between the deep ocean, sea ice, and the atmosphere. This region is strongly affected by exchanges of mass (such as freshwater and saltwater fluxes) and momentum driven by various forces like ocean currents, tides, waves, and winds. Here, we study the ad-hoc vertical turbulent kinetic energy (TKE) mixing scheme within the NEMO-SI3 model. Specifically, we focus on the influence of surface and internal wave breaking in sea ice-covered regions. The critical parameters are the fraction of surface TKE that penetrates below the ML, the nature of the exponential TKE penetration decrease beneath the ML, and the damping effect on Langmuir and surface wave breaking beneath the ice cover. We aim to assess how these parameters affect the ML and various sea ice properties.

Our findings reveal significant impacts on Arctic sea ice thickness under two scenarios: when ice cover does not affect wave dynamics and when the mixing process weakens. Stronger mixing leads to a deeper ML and reduced sea ice thickness by 30 to 40 centimeters, while weaker mixing results in a shallower ML and a moderate sea ice increase of 10 to 20 centimeters. Results also show that reduced sea ice models exhibit a larger volume of freshwater content in the ocean with consistent spatial patterns. Conversely, increased sea ice simulations reveal reduced freshwater content, although clear spatial patterns are not evident. Differences in upper ocean properties, particularly in ocean stratification, highlight the significant impact of strong sea ice attenuation in the mixing parametrization. These findings underscore the substantial influence of enhanced ocean mixing on the physical properties of ocean and sea ice.

How to cite: Allende, S., Treguier, A. M., Lique, C., de Boyer Montégut, C., Massonnet, F., and Fichefet, T.: Impact of ocean vertical mixing parametrization on sea ice properties using NEMO-SI3 model in the Arctic Ocean, EGU General Assembly 2024, Vienna, Austria, 14–19 Apr 2024, EGU24-3811, https://doi.org/10.5194/egusphere-egu24-3811, 2024.

EGU24-5785 | ECS | Posters on site | OS1.7 | Highlight

Daily to decadal changes: Insights from a high resolution 10-year record of atmospheric carbon dioxide, observed from coastal Antarctica. 

Freya Squires, Anna Jones, Tony Phillips, James France, Nellie Wullenweber, and Rolf Weller

The Southern Ocean is the dominant marine sink for anthropogenic carbon, absorbing around 40% of carbon emitted since industrialisation, but it is a remote and challenging region to measure. Sparsity of observational data is the main cause of uncertainty in air-sea carbon flux in the Southern Ocean. Year-round observations of CO2 mixing ratios can aid understanding of air-sea flux in this critical region and provide valuable insight into how the carbon sink is changing over time as well as its seasonal and interannual variability.

This work presents ten years of high frequency in situ carbon dioxide mixing ratios measured from two coastal Antarctic research stations; Halley, operated by the British Antarctic Survey, and the German research station, Neumayer. This data set provides a rare long-term measurement of CO2 in the Southern Ocean region, allowing annual growth rates, seasonal changes and interannual variability to be studied. The mean annual growth rate was calculated to be ~2.4 ppm year-1 between 2013 and 2022.

The coastal location of these stations mean they are ideally placed to explore air-sea CO2 exchange in the Southern Ocean. Both the Halley and Neumayer records show short-term fluctuations in CO2 mixing ratios during the summer, with up to ~0.5 ppm decreases in CO2 over the course of a day, about one fifth of the average annual growth rate. Air mass trajectory analysis carried out using Hysplit with ERA5 meteorological data, suggests that these decreases in CO2 correspond to periods where the air sampled has spent time over the Southern Ocean, suggesting CO2 uptake has occurred. This work explores the possible drivers for the short-term variability in CO2 mixing ratios, focusing on the role of ocean uptake in the summer.

How to cite: Squires, F., Jones, A., Phillips, T., France, J., Wullenweber, N., and Weller, R.: Daily to decadal changes: Insights from a high resolution 10-year record of atmospheric carbon dioxide, observed from coastal Antarctica., EGU General Assembly 2024, Vienna, Austria, 14–19 Apr 2024, EGU24-5785, https://doi.org/10.5194/egusphere-egu24-5785, 2024.

EGU24-5985 | ECS | Posters on site | OS1.7

Surface density fluxes and water mass transformation over global oceans from reanalysis and climate models 

Vladimir Kukushkin, Sergey Gulev, and Margarita Markina

We analyze interannual and seasonal variability of surface density fluxes and water mass transformation rates over the global oceans for 1979-2018 using data from CFSR reanalysis and historical simulations by climate models. By analyzing density fluxes we quantify the the effect of surface heat and mass fluxes onto the formation of surface waters in the World Ocean. First, by using net fluxes from CFSR reanalysis we derive global climatology of surface density flux and further integrate it for density classes and T,S-classes, providing global and regional view of surface water mass transformation and its variability in space and in time. We precisely looked onto the role of salinity and sea ice formation in the density flux during the winter period. On average, the contribution of salinity to sea ice formation results in the differences of 9% in the density flux with the maximum effect of 12% identified in 1989. Interdecadal variability in surface transformation of the subpolar modal water and Labrador Sea waters shows opposite tendencies for the last decades. Then we analyze historical experiments from CMIP6 model ensemble and compare characteristics of surface water mass transformation with those revealed from reanalysis. We conclude that surface density fluxes and transformation rates derived from INM, MPI and MIROC are stronger compared to those diagnosed by CFSR with the largest differences identified over the Gulf Stream and the North Atlantic Current. For the same models we derive projections of surface density fluxes and surface water mass transformation for 2100 under ssp126, ssp370 and ssp585 scenarios. For all SSP scenarios, computations show a decrease in the magnitude of surface water mass transformation by the end of the century.

How to cite: Kukushkin, V., Gulev, S., and Markina, M.: Surface density fluxes and water mass transformation over global oceans from reanalysis and climate models, EGU General Assembly 2024, Vienna, Austria, 14–19 Apr 2024, EGU24-5985, https://doi.org/10.5194/egusphere-egu24-5985, 2024.

EGU24-6195 | Orals | OS1.7

Amino acids, carbohydrates and lipids in the tropical oligotrophic Atlantic Ocean: Sea-to-air transfer and atmospheric in situ formation  

Manuela van Pinxteren, Sebastian Zeppenfeld, Khanneh Wadinga Fomba, Nadja Triesch, Sanja Frka, and Hartmut Herrmann

Carbohydrates, amino acids, and lipids are important contributors to organic carbon (OC) in the marine environment. To study their sea-to-air transfer, including their enrichment in the sea surface microlayer (SML), potential atmospheric in situ formation or degradation, and their oceanic contribution to the ambient marine aerosol particles, we provide measurements from the tropical Atlantic Ocean at the Cape Verde Atmospheric Observatory (CVAO) where the above compounds were investigated in both surface seawater and in ambient submicron aerosol particles.

In bulk seawater and the SML, similar distributions among species were found for the lipids and carbohydrates with moderate SML enrichments (enrichment factor EFSML = 1.3 ± 0.2 and 1.1 ± 0.5 respectively). In contrast, the amino acids exhibited a higher enrichment in the SML with an average EFSML of 2.3 ± 0.4 although they are less surface-active than lipids. The same compounds studied in the seawater were found on the ambient submicron aerosol particles whereas the lipids were more pronounced enriched (EFaer. = 1.6x10⁵) compared to the amino acids and carbohydrates (EFaer. = 1.5x10³ and 1.3x10³ respectively), likely due to their high surface activity and/or the lipophilic character. Detailed molecular analysis of the seawater and aerosol particles revealed changes in the relative abundance of the individual organic compounds. They were most pronounced for the amino acids and are likely related to an in situ atmospheric processing by biotic and/or abiotic reactions.

On average 49% of the OC on the aerosol particles (≙ 97 ng m-3) could be attributed to the specific components or component groups investigated in this study. The majority (43%) was composed of lipids. Amines, oxalic acid, and carbonyls, comprised an OC fraction of around 6%. Carbohydrates and amino acids made up less than 1% of the OC. This shows that carbohydrates, at least when resolved via molecular measurements of single sugars, do not comprise a very large fraction of OC on marine aerosol particles, in contrast to other studies. However, carbohydrate-like compounds are also present in the high lipid fraction (e.g., as glycolipids), but their chemical composition could not be revealed by the measurements performed here.

Since the identified compounds constituted about 50% of the OC and belong to the rather short-lived biogenic material probably originating from the surface ocean, a pronounced coupling between ocean and atmosphere was indicated for this oligotrophic region. The remaining, non-identified OC fraction might in part contain recalcitrant OC, however, this fraction does not constitute the vast majority of OC in the aerosol particles here investigated.

The study contributes to the international SOLAS program.


Ref: van Pinxteren, M., Zeppenfeld, S., Fomba, K. W., Triesch, N., Frka, S., and Herrmann, H.: Amino acids, carbohydrates, and lipids in the tropical oligotrophic Atlantic Ocean: sea-to-air transfer and atmospheric in situ formation, Atmos. Chem. Phys., 23, 6571–6590, https://doi.org/10.5194/acp-23-6571-2023, 2023.

How to cite: van Pinxteren, M., Zeppenfeld, S., Fomba, K. W., Triesch, N., Frka, S., and Herrmann, H.: Amino acids, carbohydrates and lipids in the tropical oligotrophic Atlantic Ocean: Sea-to-air transfer and atmospheric in situ formation , EGU General Assembly 2024, Vienna, Austria, 14–19 Apr 2024, EGU24-6195, https://doi.org/10.5194/egusphere-egu24-6195, 2024.

The increasing amount of data in earth-observing systems allows us to move from considering low-order moments (means and variances) of fluctuating observations to their PDFs (Probability Density Functions). For two years of HFR (High Frequency Radar) sea surface current increments in the Gulf of Trieste (Northern Adriatic Sea) we found the analytical fat-tailed PDF form (a combination of a gaussian and a convolution of two exponentials) using superstatistics and the maximum entropy principle twice: on a short and on a longer time scale. The data observed under different wind regimes (Bora, Sirocco and low wind, from the WRF model local forecasts) follow the same analytical PDF, pointing towards a universal behaviour.

We developed an idealised deterministic-stochastic model of the wind-driven sea surface currents in the Gulf of Trieste. The deterministic model consists of a time-dependent Ekman layer system, including the tidal signal, with a quadratic drag. It describes 57% of the variability, missing the fast fluctuations. The stochastic part accounts for the fast fluctuations, reproducing the superstatistical PDFs from the observations. The model, providing a huge amount of data, allows for studying the PDF of the mechanical power-input into the ocean and the associated extreme events.

How to cite: Flora, S., Ursella, L., and Wirth, A.: Superstatistical analysis of HF Radar sea surface currents in the Gulf of Trieste, their idealized wind-driven stochastic modeling and extreme power-input events, EGU General Assembly 2024, Vienna, Austria, 14–19 Apr 2024, EGU24-6484, https://doi.org/10.5194/egusphere-egu24-6484, 2024.

The Kuroshio Extension (KE) bimodality has important effects on the ocean environment, ecosystem and climate. Previous studies have revealed that the Kuroshio Extension (KE) bimodality is mainly determined by the westward-propagating Rossby wave triggered by the North Pacific decadal variability such as PDO or NPGO: the positive (negative) phase of NPGO corresponds to the stable (unstable) KE state. However, the KE state and the NPGO seem to be decoupled since 2017, during which the NPGO takes a negative phase but the KE is in a stable state. This study employs the Convergent Cross Mapping (CCM) method to investigate the causality between the KE bimodality and NPGO. Simultaneously, we divide the KE region into the upstream (west of 146°E) and downstream regions. It is found that the NPGO has a significant causal impact on the downstream KE state. But the effect on the upstream KE state significantly weakens around 2017. Further analysis indicates that the upstream KE state is mainly caused by eddy activity in the Kuroshio large meander region south of Japan. In particular, the changes in the eddy activity affect the downstream advection of eddies and induce changes in the Kuroshio position over the Izu ridge, which cause different states in the KE upstream region. Therefore, we should not only consider the NPGO change, but also the eddy activity change in the Kuroshio region south of Japan when understanding and predicting the KE low-frequency variability.

How to cite: Wang, Q.: Revisiting the relationship between the North Pacific decadal variability and the Kuroshio Extension bimodality, EGU General Assembly 2024, Vienna, Austria, 14–19 Apr 2024, EGU24-7259, https://doi.org/10.5194/egusphere-egu24-7259, 2024.

EGU24-7477 | ECS | Orals | OS1.7 | Highlight

The impact of rain on the global ocean carbon uptake 

Laetitia Parc, Hugo Bellenger, Laurent Bopp, Xavier Perrot, and David Ho

Precipitation alters sea surface physical and biogeochemical properties locally. However, due to its high temporal and spatial variations, it has largely been overlooked in studies assessing global ocean carbon uptake. Air-sea CO2 flux is mainly due to the interfacial exchange of CO2 molecules between the liquid and gaseous phases media. Rain may impact this interfacial air-sea CO2 flux by (i) enhancing the turbulence at the air-sea interface and (ii) diluting the CO2 concentration near the ocean surface. At the same time, rain directly injects into the ocean CO2 absorbed by the raindrops during their fall. This latter component, known as wet deposition, contributes to the CO2 flux into the ocean. This study provides the first comprehensive global estimate of these effects and their combined influence on the global ocean carbon uptake during the period 2008-2018. We use different representations of the ocean surface response to rain and different rain products with different rain rate distributions (ERA5 and IMERG) to quantify the uncertainty of the global impact of rain on CO2 sink. We show that rain increases the global ocean carbon sink by +0.14 to +0.19 PgC yr-1 over 2008-2018, representing an increase of 5 to 7% of the global carbon uptake (2.66 PgC yr-1). Both interfacial flux and wet deposition have comparable orders of magnitude. Rain mainly increases the CO2 sink in the tropics, where strong rain rates and weak winds induce noticeable dilution at the ocean surface, in the storm track regions, and in the Southern ocean.

How to cite: Parc, L., Bellenger, H., Bopp, L., Perrot, X., and Ho, D.: The impact of rain on the global ocean carbon uptake, EGU General Assembly 2024, Vienna, Austria, 14–19 Apr 2024, EGU24-7477, https://doi.org/10.5194/egusphere-egu24-7477, 2024.

EGU24-8197 | Orals | OS1.7

SEAS: a simulation system for forecasting the atmosphere-coupled ocean dynamics in the Southern EuropeAn Seas 

Francesco Maicu, Nadia Pinardi, Silvio Guadi, Emanuela Clementi, Francesco Trotta, and Giovanni Coppini

The prototype of a short-term forecasting system of the ocean dynamics of Southern European Seas (SEAS), was developed. It is based on a regional coupled ocean-atmosphere model, with NEMO and WRF codes implemented on the same computational grid, with 1/24° resolution, which encompasses Mediterranean Sea, Marmara Sea and Black Sea. The domain extends also westward and northward in the Atlantic Ocean to downscale properly the mid-latitudes atmospheric perturbations from the parent ECMWF HRES model.

The forecasting uncertainty of the atmospheric regimes in such a complex Euro-Mediterranean region must be considered along with the uncertainties of the parametrizations of the surface processes at the ocean-atmosphere interface. Therefore, the goal of coupling oceanic and atmospheric models is to reduce these uncertainties and exploit the second type predictability to increase the forecast skills of the ocean dynamics.

The uncoupled ocean model has been validated against Sea Surface Temperature (SST) satellite observed data, and the skills compared to those of the Copernicus Mediterranean Forecasting System (MedFS hereafter) both in the short-term forecast over two seasonal periods and in the simulation of the medicane Ianos.

Various physical schemes, domain extensions, boundary, and initial conditions were initially tested using the uncoupled atmospheric model to obtain the best representation of the medicane Ianos. Furthermore, these experiments were also useful to determine the coupling strategy more appropriate to reduce the heat fluxes imbalance between the two components.

The SST differences between coupled and uncoupled experiments are determined by the heat fluxes computation in the atmospheric component rather than using the MedFS bulk formulae implemented in the ocean model. These differences are largely dependent on the surface boundary layer scheme used in WRF, therefore, several coupled experiments were conducted.

In terms of SST, the coupled model replicates the skills of the MedFS in the winter period while in the summer period the skills are worsened due to the larger heat fluxes. Numerical experiments focused on the parametrizations of the atmospheric boundary layer are still ongoing work.

The skill of the coupled model in reproducing the observed SST during the medicane Ianos is comparable with the one of the uncoupled oceanic model in the Ionian Sea. In terms of heat fluxes, the coupling changes significantly the heat budget locally in the Ionian Sea, mainly through the latent heat flux and the shortwave radiation. The coupling is not that relevant for the intensification of the cyclone, whereas it enhances the representation of its path and the time of the landfall on the Ionian Islands.

How to cite: Maicu, F., Pinardi, N., Guadi, S., Clementi, E., Trotta, F., and Coppini, G.: SEAS: a simulation system for forecasting the atmosphere-coupled ocean dynamics in the Southern EuropeAn Seas, EGU General Assembly 2024, Vienna, Austria, 14–19 Apr 2024, EGU24-8197, https://doi.org/10.5194/egusphere-egu24-8197, 2024.

EGU24-8431 | ECS | Orals | OS1.7 | Highlight

The evolution of turbulence, stratification, and the surface jet in Diurnal Warm Layers 

Mariana Miracca Lage, Claire Ménesguen, Lucas Merckelbach, Julia Dräger-Dietel, Alexa Griesel, and Jeff Carpenter

The ocean's upper layer is inherently turbulent and constantly forced by momentum and buoyancy fluxes, and their interplay operates to mix and/or stratify the first meters of the water column. Incoming solar short-wave radiation acts to stabilize the upper layer, whereas the wind transfers momentum to the ocean and acts to vertically mix the water column. However, if the wind is not strong enough to trigger mixing, stratification in the near-surface is immediately formed in a layer of O(10) m thickness, called the diurnal warm layer (DWL). Above the bottom boundary of the DWL, shear production can be enhanced leading to large dissipation of turbulent kinetic energy (TKE) rates, i.e. high turbulence. Based on observational data from an ocean glider with a mounted microstructure package and drifters, we show the evolution of three DWLs sampled on the rim of a mesoscale eddy in the South Atlantic ocean (32oS, 4oE) with respect to temperature and buoyancy anomalies, potential energy and dissipation of TKE. In the near-surface, temperature and buoyancy anomalies increase with the evolution of the DWL, and the latter has the same magnitude as the time-integrated surface buoyancy flux. We also show the development of a diurnal jet with magnitude of O(10) cm/s that veers with the wind. Late in the afternoon, when the diurnal jet is fully developed, the bulk Richardson number (Rib) indicates that the stratified layer related to the DWL becomes marginally unstable (Rib ~ 0.25). During this period, the potential energy also decays, suggesting that the enhanced turbulence within the DWL acts to destroy stratification through turbulent mixing. We further assess whether a one-dimensional turbulence model is able to reproduce the observed DWL’s characteristics and the change in stability throughout the day.

How to cite: Miracca Lage, M., Ménesguen, C., Merckelbach, L., Dräger-Dietel, J., Griesel, A., and Carpenter, J.: The evolution of turbulence, stratification, and the surface jet in Diurnal Warm Layers, EGU General Assembly 2024, Vienna, Austria, 14–19 Apr 2024, EGU24-8431, https://doi.org/10.5194/egusphere-egu24-8431, 2024.

EGU24-10253 | ECS | Posters on site | OS1.7

Spatial variation of future trends in Atlantic upwelling cells from CMIP6 models 

Raquel Flügel, Steven Herbette, Anne Marie Treguier, Robin Waldman, and Malcolm Roberts

Eastern Boundary Upwelling Systems (EBUS) are characterised by wind-triggered upwelling of deep waters along the coast. They are hotspots of biological productivity and therefore have a high economic, ecological and social importance. Here we investigate the evolution of the two Atlantic EBUS during the historical period and in a future high-emission scenario in CMIP6 models from two modelling centres, with spatial resolutions ranging from 1° to 1/12° in the ocean. The decomposition of the upwelling systems into subregions reveals differences between the equatorward and poleward parts. Our analysis is focused on the modelled vertical transport, which is shown to be consistent with the wind-derived Ekman index. Integrating the vertical transport provides a synthetic view of the upwelling cells, their strength, depth and distance to the coast. The models show high interannual variability over the 21st century century, which explains why significant trends could only be found in few subregions of the Atlantic EBUS. The results suggest a poleward migration of upwelling systems with climate change and a change of the upwelling cells, rather than the uniform intensification which had been hypothesised by Bakun in 1990.

How to cite: Flügel, R., Herbette, S., Treguier, A. M., Waldman, R., and Roberts, M.: Spatial variation of future trends in Atlantic upwelling cells from CMIP6 models, EGU General Assembly 2024, Vienna, Austria, 14–19 Apr 2024, EGU24-10253, https://doi.org/10.5194/egusphere-egu24-10253, 2024.

EGU24-11098 | ECS | Posters on site | OS1.7

Feedbacks between turbulent air-sea fluxes and their role in the adjustment of the Earth Climate System 

Clément Dehondt, Pascale Braconnot, Sébastien Fromang, and Olivier Marti

In state of the art Earth System Models (ESM), the variables at the ocean-atmosphere interface (wind, air temperature, humidity, surface currents and SST) are linked to turbulent surface fluxes (momentum, sensible and latent heat) in a complex manner via bulk closures.

Understanding how turbulent fluxes interact between them and with the ocean-atmosphere interface variables is a major scientific challenge because it connects local interactions with large scale energy and water cycles.

These interactions between the different air-sea turbulent fluxes are difficult to diagnose from fully coupled ocean-atmosphere simulations due to the fact that in most modelling groups coupled and stand alone components do not necessarily use consistent forcing or representation of the air-sea fluxes. Also rigorous protocols between coupled and stand alone atmosphere and ocean simulations need to be implemented to be able to properly disentangle the role of different physical representation at the air-sea interface from global ocean-atmosphere-land adjustment feedbacks that may counteract the direct effects of air-sea fluxes modeling.

Here we use an ensemble of fully coupled and stand alone simulations using a version of the IPSL ESM [1] based on the new DYNAMICO atmospheric dynamical core [2] and the ocean engine NEMO [3]. We analyse an ensemble of experiments differing by the the bulk formulation of the air-sea turbulent fluxes (NCAR, COARE3.6, ECMWF and LMDZng). The analyses will focus on the adjustment of the system in the different cases, especially on the differences in the transport of heat and water, mixed layer depth adjustement, feedback on ocean surface properties, intertropical convergence zone (ITCZ) and mid-latitude storm tracks.


[1] Boucher O., Servonnat, J., Albright, A. L., Aumont, O., Balkanski, Y., Bastrikov, V., et al. (2020). Presentation and evaluation of the IPSL‐CM6A‐LR climate model. Journal of Advances in Modeling Earth Systems, 12, e2019MS002010. https://doi.org/10.1029/2019MS002010

[2] Dubos, T., Dubey, S., Tort, M., Mittal, R., Meurdesoif, Y., and Hourdin, F.: DYNAMICO-1.0, an icosahedral hydrostatic dynamical core designed for consistency and versatility, Geosci. Model Dev., 8, 3131–3150, https://doi.org/10.5194/gmd-8-3131-2015, 2015.
 
[3] “NEMO ocean engine”, Scientific Notes of Climate Modelling Center, 27 — ISSN 1288-1619, Institut PierreSimon Laplace (IPSL), doi:10.5281/zenodo.1464816

How to cite: Dehondt, C., Braconnot, P., Fromang, S., and Marti, O.: Feedbacks between turbulent air-sea fluxes and their role in the adjustment of the Earth Climate System, EGU General Assembly 2024, Vienna, Austria, 14–19 Apr 2024, EGU24-11098, https://doi.org/10.5194/egusphere-egu24-11098, 2024.

EGU24-11282 | ECS | Orals | OS1.7

Can sea spray aerosol be a source of gas-phase perfluoroalkyl substances (PFAS)? A study in the Eastern North Atlantic Ocean 

Sneha Aggarwal, Olga Garmash, Delaney Kilgour, Christopher Jernigan, Julika Zinke, Xianda Gong, Shengqian Zhou, Jiaoshi Zhang, Jian Wang, Timothy Bertram, Joel Thornton, Matt Salter, Paul Zieger, and Claudia Mohr

Sea spray aerosol (SSA) formed after wave breaking at the ocean surface influences our climate by scattering incoming solar radiation and acting as cloud condensation nuclei. Furthermore, they provide a microenvironment for aqueous phase chemistry, selective uptake of surfactants, and gas-to-particle partitioning of compounds by providing an acidic pH at the air-water interface (Angle et al., 2022). Despite these known effects, a crucial question remains unanswered: which volatile organic compounds (VOCs) are emitted from SSA, and how do they change over time via atmospheric aging?

To address this, we designed a novel experimental setup during the AGENA* Campaign 2022 at Graciosa Island, Portugal. For the first time, we connected a sea spray simulation chamber to a chemical ionization mass spectrometer (CIMS) to measure the freshly emitted gases from both seawater and SSA. Additionally, we aged the samples for an equivalent period of about 3-3.5 days in an oxidation flow reactor to investigate compositional changes after ageing.

Surprisingly, our findings reveal that nearly half of the mass-spectrometer signal from the fresh samples constituted fluorinated compounds, specifically short-chain perfluoroalkyl carboxylic acids - a class of perfluoroalkyl substances (PFAS). While, previous studies have shown that SSA can release and play a key role in the long-range transport of PFAS, these studies have primarily focused on particle-phase emissions (Johansson et al., 2019, Sha et al, et al., 2022). In contrast, our study provides new insights into oceanic PFAS emissions and transport to the atmosphere by examining gas-phase emissions.  

Furthermore, we observed that the gas-phase PFAS almost completely disappears after ageing. Our hypothesis is that these compounds partition into the particle phase. We plan to test this hypothesis by analyzing the particle filters collected during the campaign.

*Aerosol Growth in the Eastern North Atlantic (AGENA) https://www.arm.gov/research/campaigns/ena2022agena

Angle, K. J., Crocker, D. R., Simpson, R. M., Mayer, K. J., Garofalo, L. A., Moore, A. N., ... & Grassian, V. H. (2021). Acidity across the interface from the ocean surface to sea spray aerosol. Proceedings of the National Academy of Sciences118(2), e2018397118.

Johansson, J. H., Salter, M. E., Navarro, J. A., Leck, C., Nilsson, E. D., & Cousins, I. T. (2019). Global transport of perfluoroalkyl acids via sea spray aerosol. Environmental Science: Processes & Impacts21(4), 635-649.

Sha, B., Johansson, J. H., Tunved, P., Bohlin-Nizzetto, P., Cousins, I. T., & Salter, M. E. (2021). Sea spray aerosol (SSA) as a source of perfluoroalkyl acids (PFAAs) to the atmosphere: field evidence from long-term air monitoring. Environmental Science & Technology56(1), 228-238.

How to cite: Aggarwal, S., Garmash, O., Kilgour, D., Jernigan, C., Zinke, J., Gong, X., Zhou, S., Zhang, J., Wang, J., Bertram, T., Thornton, J., Salter, M., Zieger, P., and Mohr, C.: Can sea spray aerosol be a source of gas-phase perfluoroalkyl substances (PFAS)? A study in the Eastern North Atlantic Ocean, EGU General Assembly 2024, Vienna, Austria, 14–19 Apr 2024, EGU24-11282, https://doi.org/10.5194/egusphere-egu24-11282, 2024.

The Coupled Ocean-Atmosphere-Wave-Sediment Transport (COAWST) model has been employed to simulate the anomalous post-monsoon tropical cyclone (TC) Jawad that originated over the Bay of Bengal (BoB) in December 2021. The atmospheric initial and boundary conditions (IC and BC) have been obtained from the Global Forecasting System (GFS) Analyses and Forecasts and two contrasting ocean IC and BCs, viz., HYCOM (experiment name GFS-HYCOM) and INCOIS (experiment name GFS-INCOIS), are implemented in two separate coupled experiments to evaluate the influence of TC Jawad on the surface and sub-surface characteristics of BoB. The track of the TC, including its recurvature, was well captured by both experiments with significant accuracy. A proper contrast in temperature between the two sides of the TC track was noted in the surface and sub-surface temperatures observed by two buoys, i.e., (1) BD11 (west of the TC track) and (2) BD13 (east of the TC track), and the simulated temperatures were validated with these observations. Contrary to the usual scenario, the higher sub-surface warming on the eastern side of the TC track was captured by GFS-HYCOM, but with a significant overestimation. The lower temperature on the western side of the TC track can be attributed to the weak upwelling associated with the cyclonic circulation caused by the interaction of the TC with the southward coastal currents. An unusually higher downwelling on the eastern side of the TC track was observed in the vertical distribution of the temperature across the longitudes, which suggested the existence of a strong clockwise circulation near the location of BD13. GFS-HYCOM, which simulated a higher current magnitude in the sub-surface than GFS-INCOIS on the eastern side of the TC track, captured the circulation near BD13 more rigorously. From further analysis, it was inferred that the interaction of the cyclonic wind flow of TC Jawad (westerly) near the surface with the easterly flow caused the generation of the clockwise circulation over the ocean surface on the eastern side of the TC track, leading to intense downwelling and warming of the sub-surface temperature. This scenario was further corroborated by the simulated Ekman transport and higher convective activity in the eastern quadrants of the TC. The present study not only emphasizes the capability of the coupled ocean-atmosphere models to simulate TCs but also highlights the necessity of investigating the air-sea interaction processes and their responses to the passage of an anomalous TC like Jawad.

How to cite: Chakraborty, T., Pattnaik, S., and Joseph, S.: Modulation of surface and sub-surface circulation in the Bay of Bengal by the passage of tropical cyclone Jawad: coupled ocean-atmosphere feedback , EGU General Assembly 2024, Vienna, Austria, 14–19 Apr 2024, EGU24-11375, https://doi.org/10.5194/egusphere-egu24-11375, 2024.

EGU24-11879 | Posters on site | OS1.7

Estimates of Polar Ocean CO2 Uptake from Atmospheric Inverse Analyses  

Parvadha Suntharalingam, Zhaohui Chen, and Jayashree Ghosh

Estimates of global scale air-sea CO2 fluxes have traditionally been derived from ocean biogeochemistry models and ocean surface pCO2 data products (Friedlingstein et al. 2022). An alternative means of estimating ocean carbon uptake is provided by atmospheric inversions; these use optimization procedures and data assimilation methods to combine atmospheric CO2 measurements with numerical transport model simulations and prior knowledge of air-sea fluxes. 

Here we use the GEOSChem-LETKF (GCLETKF) inverse system (Chen et al. 2021) in conjunction with atmospheric observations from the NOAA-GML surface CO2 measurement network to derive grid-scale air-sea CO2 flux estimates for the period 2000-2017. We focus, in particular, on estimates of CO2 uptake by the polar oceans (Southern and Arctic oceans). These  regions have accounted for a significant component of global oceanic carbon uptake  in recent decades (e.g., more than 20% of global ocean uptake, in comparison to their ocean areal  extent of < 10%).

We present GCLETKF estimates of ocean CO2 uptake at global and regional scales, and assess the robustness of our results with a suite of metrics that include model concentration bias, CO2 flux error reduction, and comparison to independent atmospheric measurements. GCLETKF flux estimates for the 2000-2017 period indicate regional CO2  uptake of 0.1-0.2 PgC/year for the Arctic,  and  0.45-0.55 PgC/yr for the Southern Ocean. We also provide summary estimates of the  interannual variations and  decadal-scale trends of the polar ocean carbon fluxes, and compare the GCLETKF results  to estimates derived from global ocean biogeochemistry models and surface ocean pCO2 data products.  

How to cite: Suntharalingam, P., Chen, Z., and Ghosh, J.: Estimates of Polar Ocean CO2 Uptake from Atmospheric Inverse Analyses , EGU General Assembly 2024, Vienna, Austria, 14–19 Apr 2024, EGU24-11879, https://doi.org/10.5194/egusphere-egu24-11879, 2024.

EGU24-12623 | ECS | Posters on site | OS1.7

Evaluation of several meteorological models by comparison with qualified Air-Sea observations 

Saïd Benjeddou, Denis Bourras, and Christopher Luneau

Meteorological models are important simulation tools to improve our understanding of the climate behavior on seasonal, annual, decadal and centennial scales. Their complexity has increased considerably since 1990. The output fieds of several widely available meteorological such as GFS, ECMWF, WRF, ARPEGE and MERRA are evaluated, by comparing the output fields to in situ data performed during six campaigns with the wave-following platform OCARINA (Ocean Coupled with the Atmosphere, Research on the Interface on Annex Ship) developed at MIO. Following a recent comparison for wind and SST by Benjeddou et al. (2024), emphasis will now be laid on the comparison of heat fluxes and associated bulk variables, in open sea conditions, versus close to the shore line.

How to cite: Benjeddou, S., Bourras, D., and Luneau, C.: Evaluation of several meteorological models by comparison with qualified Air-Sea observations, EGU General Assembly 2024, Vienna, Austria, 14–19 Apr 2024, EGU24-12623, https://doi.org/10.5194/egusphere-egu24-12623, 2024.

Estimates of air-sea fluxes rely on the knowledge of the gas transfer velocity. Despite more than half a century of field measurements, starting with the GEOSECS program in the 70ies, there are still many open questions. At low wind speeds, no reliable measurements are available, because all available techniques (dual-tracer, eddy covariance and active thermography) are either not suitable for measurements under these conditions or deliver too uncertain results. At high wind speeds beyond 25 m/s, almost no measurements are available. In the intermediate wind range enough reliable data are available. But the data are partly contradictionary. The effect of the many other parameters influencing the transfer velocity besides the wind speed is still uncertain. This includes the effect of the sea state (wave age), bubbles, and surfactants.

In wind-wave tunnels, it is easy to perform systematic studies. But the conditions deviate significantly from those at the open ocean in traditional linear facilities because of the short interaction length between wind. Therefore, only young wind seas can be generated, far away from a wind sea in equilibrium with the wind (“fetch gap”).

In 2021, we started a laboratory program, funded by a Reinhart Koselleck Project of the German Science Foundation. It includes three innovative key elements, which together overcome most disadvantages of previous wind-wave tunnel experiments. Firstly, a large annular facility is used, the Heidelberg Aeolotron. Because of the infinite fetch, wind waves come into equilibrium with the wind as at the ocean. Secondly, two imaging techniques are used to measure transfer velocities locally and instantaneously. Active thermography is used to measure the heat transfer velocity across the aqueous viscous boundary layer and a novel fluorescence technique to image the concentration fields in the mass boundary layer and to estimate the gas transfer velocity. Thirdly, measurements are performed under non-stationary conditions. In this way the whole fetch range can be investigated, when the wind speed is turned on, and decaying wind seas, when the wind speed is lowered.

In this talk first results of these measurements will be shown:

At low wind speeds, a significant overshoot in the transfer velocity occurs at low-fetch wind-wave fields.

The change in the Schmidt number exponent of the transfer velocity from 2/3 to 1/2 is related to the increasing frequency of microscale wave breaking.

An insoluble monomolecular monolayer of hexadecanol has the same effect as the soluble surfactant TritonX-100 (5 ppm by volume): Wind waves are completely suppressed up to wind speeds of about 8 m/s and the spatial patterns of the concentration field in the boundary layer are the same. In contrast, lowering the surface tension to about 43 mN/m by adding 1-hexanol to the water (2.4 kg/m3) did not suppress wind waves and transfer velocities at all.

How to cite: Jähne, B.: On the Crucial Role of Wind-Wave-Tunnel Studiesto Reveal the Mechanisms of Air-Sea Gas Exchange, EGU General Assembly 2024, Vienna, Austria, 14–19 Apr 2024, EGU24-13372, https://doi.org/10.5194/egusphere-egu24-13372, 2024.

EGU24-13779 | ECS | Orals | OS1.7 | Highlight

Two extremes: Investigating the impact of the co-occurrence of medicanes and marine heatwaves in the Mediterranean Sea. 

Kenechukwu Uba, Manal Hamdeno, Alexander Barth, and Aida Alvera-Azcárate

The oceans are steadily warming, which affects global weather and climate and leads to an increase in extreme events such as storms, hurricanes and marine heatwaves (MHWs). Future warming scenarios predict an increase in the frequency and intensity of such events. In the Mediterranean region, both extratropical cyclones and occasional Mediterranean hurricanes (medicanes) occur, causing considerable damage to infrastructure and major socio-economic losses in coastal regions. Using ERA-5 atmospheric reanalysis data and satellite-derived sea surface temperatures (SST), this study looks at medicanes that occurred between 2011 and 2023 and examines their characteristics and impacts on the water column. The interaction with simultaneous MHWs in the Mediterranean is also investigated. A total of 15 medicanes occurred during the study period. Of these, 5 occurred in the western Mediterranean (WMed), mainly in November; 9 in the central Mediterranean and Ionian (CMed) between September and December, two of which terminated in the eastern basin; and 1 event was localised entirely in the eastern Mediterranean (EMed) in October. During the study period, 2014 recorded the highest number of medicanes with three events. One event, Ilona, occurred in January in the WMed, while the other two events, Qendresa and Xandra, occurred in November in the CMed and WMed respectively. Two events took place in both 2020 and 2021. In 2020, both Ianos in September and Elaina in December were in the CMed. In 2021, the CMed and WMed witnessed the passage of Apollo in October and Blas in November respectively. In the 15 medicanes, the mean sea level pressure (MSLP) was between 988 and 1005 hPa, while the wind speeds (Ws) were between 17 and 23 m/s. Among the events, Ilona in January 2014 had the lowest MSLP and highest Ws and the lowest associated MSLP anomaly. Of the 15 events, 11 (73%) were associated with anomalously high sea surface temperatures (SSTA) and five of these SSTAs were defined as MHW events. Moreover, the high SST anomalies were observed three or more days before the onset of these medicanes, which may have contributed to the intensification of the passing storms and amplified their impact through air-sea heat exchange. In turn, the medicanes were also observed to influence the MHWs, as the heat released from the ocean during the medicanes prevented the MHWs from deepening beyond the surface layer, demonstrating a dynamic interplay between these events. In summary, as the oceans warm, medicanes and MHWs in the Mediterranean increase, with complex interactions determining their behavior and impacts. Understanding these dynamics is crucial for predicting and mitigating the impacts of these events on marine ecosystems and coastal regions. 

How to cite: Uba, K., Hamdeno, M., Barth, A., and Alvera-Azcárate, A.: Two extremes: Investigating the impact of the co-occurrence of medicanes and marine heatwaves in the Mediterranean Sea., EGU General Assembly 2024, Vienna, Austria, 14–19 Apr 2024, EGU24-13779, https://doi.org/10.5194/egusphere-egu24-13779, 2024.

EGU24-15234 | ECS | Posters on site | OS1.7

A catalogue of wind events for assessing the connectivity among Marine Protected Areas in the German Bight (North Sea) 

Sara Rubinetti, Vera Sidorenko, Enrico Arnone, Alexey Androsov, Kingsly C. Beng, Kerstin Klemm, Anne F. Sell, Anna Akimova, Santiago E. A. Pineda-Metz, Bernadette Pogoda, Sarah Brand, Mathias Wegner, Lisa Shama, Silke Laakmann, Sabine Horn, and Karen H. Wiltshire

Marine protected area (MPA) networks are fundamental for restoring and conserving ecosystem functions like biodiversity and general ecosystem health. Ideally, the effects of local conservation measures are not limited to one particular MPA alone but influence and connect regions beyond, or even other MPAs, through the spreading, replenishment and potential recovery of populations and communities. Connectivity defines, in a probabilistic sense, the functional linkage exchange between individual MPAs or key regions, and it depends on the features of the selected tracers (including the specific biological traits of target organisms), but it is also to a large degree determined by the hydrodynamic circulation patterns in the area. For the German Bight (south-eastern North Sea), we are focusing in particular on potential spillover from a restoration site for the European flat oyster (Ostrea edulis) through the spread of planktonic life stages. 
The circulation regimes are determined mainly by tidal and wind forcings. The prevailing wind-driven surface circulation in the area is cyclonic, influenced by frequent south-westerly to westerly winds. However, winds from other directions, for instance from the North-West, have the potential to modify and even reverse this circulation pattern. Wind intensity and directions have a clear seasonal variability, with higher magnitudes in winter and lower in summer, but also exhibit a significant interannual variability driven by the strength and location of high and low mean sea level atmospheric pressure centres. Moreover, winds from the East are relatively rare compared to the other patterns but can be extremely persistent (up to hundreds of hours) and thus affect the hydrodynamics and, hence, the connectivity between the MPAs. In this study, we catalogued the wind events according to their typical duration and magnitude using 10m eastward and northwards components retrieved from ERA5 reanalysis data and characterized them according to their seasonality and interannual variability. The results can be used to define realistic atmospheric scenarios to numerically simulate the sea dynamics in the southern North Sea and, consequently, assess the connectivity among different sites, including established MPAs. These efforts are crucial for a proper planning of conservation and restoration measures in the German Bight, which is one of the most exploited marine regions in the world. 

How to cite: Rubinetti, S., Sidorenko, V., Arnone, E., Androsov, A., Beng, K. C., Klemm, K., Sell, A. F., Akimova, A., Pineda-Metz, S. E. A., Pogoda, B., Brand, S., Wegner, M., Shama, L., Laakmann, S., Horn, S., and Wiltshire, K. H.: A catalogue of wind events for assessing the connectivity among Marine Protected Areas in the German Bight (North Sea), EGU General Assembly 2024, Vienna, Austria, 14–19 Apr 2024, EGU24-15234, https://doi.org/10.5194/egusphere-egu24-15234, 2024.

EGU24-16489 | Orals | OS1.7 | Highlight

Vertical fluxes in subpolar eddies from a high-resolution, multiplatform experiment in the Labrador Sea 

Ahmad Fehmi Dilmahamod, Johannes Karstensen, Jochen Horstmann, and Gerd Krahmann

Mesoscale structures are key dynamical features of the ocean. They are associated with a variety of short lived and small-scale dynamics linked to physical, biological, and chemical processes at the submesoscale, such as cascading energy, impacting ocean stratification, and guiding ocean carbon and oxygen uptake. In the high latitudes, the spatial extent of the mesoscale is only tens of kilometres, making it challenging to observe the submesoscale processes. In August-September 2022, an extensive submesoscale-resolving multiplatform experiment was conducted across an Irminger Ring in the Labrador Sea. The experiment leveraged two underwater electric gliders equipped with nitrate, microstructure shear, chlorophyll fluorescence, oxygen, and turbidity sensors, operated in concert with a variety of ship operated instruments including underway-CTD’s, a moving vessel profiler, Thermosalinograph, ADCPs and a X-band radar system. Observations were acquired both, along the peripheries and within the core of the eddy, and offered insight into submesoscale dynamics of the ring. Making use of nearly concurrent turbulence and nutrients observations, we estimated the vertical flux pattern across the eddy’s frontal and interior regions. From the recorded and expected glider vehicle motion a vertical water velocity could be inferred and compared with the nutrient flux pattern. The stability of the ring was tracked with surface drifters, for weeks after the ship and glider survey ended, and a link between the disintegration of the ring and an atmospheric event was investigated

How to cite: Dilmahamod, A. F., Karstensen, J., Horstmann, J., and Krahmann, G.: Vertical fluxes in subpolar eddies from a high-resolution, multiplatform experiment in the Labrador Sea, EGU General Assembly 2024, Vienna, Austria, 14–19 Apr 2024, EGU24-16489, https://doi.org/10.5194/egusphere-egu24-16489, 2024.

EGU24-16669 | ECS | Posters on site | OS1.7 | Highlight

Buoyant gravity currents triggered by a collapsing mid-latitude submesoscale front 

Grete Boskamp, Peter Holtermann, and Lars Umlauf

Sharp fronts with temperature differences of approximately 0.5°C across a remarkably small lateral scale of order 10 m were observed in a subtropical region with strong mesoscale and submesoscale activity in the southeast Atlantic at 34°S, 6.5°E, far away from any coastal freshwater sources. These fronts were formed at the leading edge of a buoyant gravity current of 20-40 m thickness that propagated at a speed of order 0.1 m/s relative to the colder and thus denser surrounding waters. High-resolution turbulence microstructure observations revealed strongly enhanced turbulence inside the nose of the gravity current, while turbulence in the trailing bulk region was mainly wind- and convectively-driven and showed a strong diurnal modulation. Satellite and meteorological data suggest that the gravity current was triggered by the mesoscale strain-induced sharpening and final collapse of a larger-scale front at the edge of a mesoscale eddy during a period with decaying winds. In contrast to previous studies that have identified similar buoyant gravity currents in the equatorial ocean, our data suggest that they can also form at a mid-latitude location where rotational effects are strong. This suggests that even balanced fronts can decay into gravity currents under certain conditions, indicating a potentially important pathway for mesoscale energy dissipation and mixing.

How to cite: Boskamp, G., Holtermann, P., and Umlauf, L.: Buoyant gravity currents triggered by a collapsing mid-latitude submesoscale front, EGU General Assembly 2024, Vienna, Austria, 14–19 Apr 2024, EGU24-16669, https://doi.org/10.5194/egusphere-egu24-16669, 2024.

EGU24-16888 | Posters on site | OS1.7

North Atlantic SST variability during strong winter extratropical cyclones 

Margarida L. R. Liberato

Extreme weather and climate events, such as extratropical cyclones and droughts, represent a topic of paramount importance in the Iberian Peninsula and the North Atlantic Ocean plays an important role in shaping their frequency and intensity. Sea surface temperature (SST) variations, which are important indicators of ocean variability, can result in anomalous diabatic heating or cooling of the overlying atmosphere. In this study, the contributions of different physical processes to the development of North Atlantic explosive extratropical cyclones (EC) affecting the Iberian Peninsula are investigated using the ERA5 reanalysis from the European Centre for Medium-Range Weather Forecasts (ECMWF). Results suggest that the North Atlantic Ocean SST contributed to the formation and intensification of extratropical cyclones, and particularly to the formation and development of intense storms. Furthermore, the combined analysis of SST and net surface heat flux (QN) also shows the cooling of the ocean associated with the EC tracks caused by the heat exchanges between the ocean and the atmosphere.


Acknowledgements

This work is supported by national funds by FCT - Portuguese Foundation for Science and Technology, under the project UIDB/04033/2020 (https://doi.org/10.54499/UIDB/04033/2020).


How to cite: Liberato, M. L. R.: North Atlantic SST variability during strong winter extratropical cyclones, EGU General Assembly 2024, Vienna, Austria, 14–19 Apr 2024, EGU24-16888, https://doi.org/10.5194/egusphere-egu24-16888, 2024.

EGU24-18069 | ECS | Posters on site | OS1.7

Seasonal Variation of Mesoscale Horizontal Stirring in the North Pacific Ocean 

Gyuseok Yi, Wonsun Park, and June-Yi Lee

The mesoscale horizontal stirring (MHS) is closely linked to various mesoscale dynamical phenomena, encompassing not only eddies but also meanders, filaments, and fronts. A clear understanding of its seasonality holds the potential to enhance our understanding of horizontal mixing and material dispersion. Here, we analyze the seasonal variation of MHS in the North Pacific surface ocean using ocean reanalysis (GLORYS12) current velocity data with a horizontal resolution of 1/12° from 1993 to 2019. Based on the characteristic of stirring to separate adjacent fluid trajectories, MHS is quantified using the finite-size Lyapunov exponent (FSLE), one of the Lagrangian diagnostics. The FSLE in the North Pacific shows clear seasonality but the phases of its evolution differ regionally. We identify two major modes, which contribute to over 80% of the seasonality of FSLE in the North Pacific, through the application of empirical orthogonal function (EOF) analysis to the climatological monthly mean FSLE. The first mode (57%) exhibits a variation peaking in April within the Kuroshio Extension region and the Subtropical Countercurrent region, where baroclinic instability plays a significant role. The second mode (25%) peaks during the summer season over the Kuroshio area and coastal upwelling areas of western North America. It is found that the strong seasonality in the upwelling area is induced by the North Pacific High.

How to cite: Yi, G., Park, W., and Lee, J.-Y.: Seasonal Variation of Mesoscale Horizontal Stirring in the North Pacific Ocean, EGU General Assembly 2024, Vienna, Austria, 14–19 Apr 2024, EGU24-18069, https://doi.org/10.5194/egusphere-egu24-18069, 2024.

EGU24-19544 | Orals | OS1.7 | Highlight

Plastics Affect the Ocean's Uptake of Atmospheric CO₂ across the Marine Boundary Layer 

Luisa Galgani, Eleni Tzempelikou, Ioanna Kalantzi, Anastasia Tsiola, Manolis Tsapakis, Paraskevi Pitta, Chiara Esposito, Anastasia Tsotskou, Iordanis Magiopoulos, Roberto Benavides, Tobias Steinhoff, Amedeo Boldrini, Alessio Polvani, and Steven A. Loiselle

Microplastics can support biomass production by acting as substrates for microbial activity. This may imply potentially relevant effects for the sea-surface microlayer, the interface mediating air-sea gas exchange and where biological organic compounds can accumulate.

We tested this hypothesis by using six large scale mesocosms to simulate a future “high plastic ocean”. During the course of a 12-days experiment, we explored microbial organic matter dynamics in the sea-surface microlayer in the presence and absence of microplastics in the underlying water. We used as a reference a known number of polystyrene beads of 30 µm diameter and compared the three treatment mesocosms to an equal number of plastic-free control mesocosms.

The presence of microplastics represented a spur for microbial activity, and in the treated mesocosms biomass production was enhanced, leading to an increased concentration of organic compounds accumulating in the sea-surface microlayer. This initial boost in biological productivity led to a ∼3 % reduction of dissolved CO₂ in the underlying water, which we could imagine potentially reversed once the degradation phase took off. Based on our results and on other recent studies, we will discuss potential interference of plastic with the composition of the sea-surface microlayer, with direct and indirect impacts on the uptake of CO₂ and the marine carbon cycle. 

How to cite: Galgani, L., Tzempelikou, E., Kalantzi, I., Tsiola, A., Tsapakis, M., Pitta, P., Esposito, C., Tsotskou, A., Magiopoulos, I., Benavides, R., Steinhoff, T., Boldrini, A., Polvani, A., and Loiselle, S. A.: Plastics Affect the Ocean's Uptake of Atmospheric CO₂ across the Marine Boundary Layer, EGU General Assembly 2024, Vienna, Austria, 14–19 Apr 2024, EGU24-19544, https://doi.org/10.5194/egusphere-egu24-19544, 2024.

EGU24-20158 | ECS | Orals | OS1.7

On the influence of hydrodynamic and environmental conditions on wave breaking in the nearshore 

Susanne Støle-Hentschel, Patricio Catalán, Michael Streßer, Jochen Horstmann, and Frédéric Dias

An improved understanding of wave breaking is still a hot topic owing to its relevance in the coupling of ocean and atmosphere. Multiple communities are focusing on numerical simulations of the fully coupled two-phase flow, the validation of such models remains challenging. Herein, we demonstrate how coherent marine radars can help to shed light on how different wave and wind parameters influence the evolution of waves towards breaking in the nearshore. The interpretation of the results is undermined by SWASH simulations of shoaling waves for different wave spectra and two beaches and simulations of radvarimages of these waves. Data of three independent measurement campaigns shows that the shoaling characteristics are strongly influenced by the wave steepness, relative depth the Ursell number and the wind. The influence of individual parameters cannot be isolated, but must be understood in its entirety.

How to cite: Støle-Hentschel, S., Catalán, P., Streßer, M., Horstmann, J., and Dias, F.: On the influence of hydrodynamic and environmental conditions on wave breaking in the nearshore, EGU General Assembly 2024, Vienna, Austria, 14–19 Apr 2024, EGU24-20158, https://doi.org/10.5194/egusphere-egu24-20158, 2024.

EGU24-20277 | ECS | Posters on site | OS1.7

Impact of marine biogenic VOC emissions on the marine boundary layer of the Eastern Mediterranean 

Elissavet Bossioli, Dimitrios Kourakos, Dionysios E Raitsos, Antonia Kournopoulou, John Karagiorgos, Georgia Methymaki, Panagiotis Portalakis, Stavroula Karatasou, and Sarantis Sofianos

The production by biological and photochemical mechanisms of short-lived Volatile Organic Compounds (VOC) in the surface ocean is regulated by environmental parameters and nutrient abundance, and hence climate change. These gases then enter the atmosphere through the air–sea interface and contribute to photochemical pollution, affect the cloud properties, the radiative forcing and precipitation. Despite the improved understanding of the temporal and spatial distribution of marine trace gases of biogenic origin and their potential effects, further investigation is needed in different geographical regions and especially in polluted marine environments and populated coastal regions (Tinel et al., 2023). In this study we estimate the spatiotemporal distribution of seawater VOC concentrations in the climate sensitive geographical region of Eastern Mediterranean. State-of-the art empirical models linking remotely-sensed data of phytoplankton biomass (EU Copernicus Marine Environment Monitoring Service, CMEMS) and environmental parameters such as sea-surface temperature, and photosynthetically available radiation are used (Gali et al., 2018). Ocean-model data such as mixed layer depth, and euphotic zone are also exploited. The impact of the sea-to-air VOC emission fluxes on photochemistry, marine aerosols and cloud properties are assessed and quantified through advanced atmospheric simulations with the WRF-Chem atmospheric model coupled to chemistry and aerosols during typical conditions but also extreme events.


References

Gali M., Levasseur, M., Devred, E., Simo, R. and Babin, M., Sea-surface dimethylsulfide (DMS) concentration from satellite data at global and regional scales, Biogeosciences, 15, 2018, pp. 3497-3519, https://bg.copernicus.org/articles/15/3497/2018 , doi:10.5194/bg-15-3497-2018.

Tinel L., J. Abbatt, E. Saltzman, A. Engel, R. Fernandez, et al.. Impacts of ocean biogeochemistry on atmospheric chemistry. Elementa: Science of the Anthropocene, 2023, 11 (1), ff10.1525/elementa.2023.00032ff. ffhal-04221390f


How to cite: Bossioli, E., Kourakos, D., Raitsos, D. E., Kournopoulou, A., Karagiorgos, J., Methymaki, G., Portalakis, P., Karatasou, S., and Sofianos, S.: Impact of marine biogenic VOC emissions on the marine boundary layer of the Eastern Mediterranean, EGU General Assembly 2024, Vienna, Austria, 14–19 Apr 2024, EGU24-20277, https://doi.org/10.5194/egusphere-egu24-20277, 2024.

Current Feedback (CFB) and Thermal Feedback (TFB) strongly influence atmospheric and oceanic dynamics at the oceanic mesoscale (O(10-250) km). At smaller scales, oceanic submesoscale currents (O(0.1-10 km)) play a major role in the ocean's energy budget, variability, and ecosystems. However, air-sea interactions at the submesoscale are not well understood due to observational and modeling limitations related to their scales. 
 
This talk addresses this gap by using submesoscale coupled ocean-atmosphere models.  These models are implemented over diverse regions characterized by distinct physical properties. The findings provide compelling evidence that submesoscale modulation affects both the atmosphere and oceanic dynamics. Both TFB and CFB significantly modulate low-level wind curl and divergence as well as momentum and heat fluxes between the ocean and the atmosphere, with a direct impact on the oceanic submesoscale energy budget.

How to cite: Renault, L.: Submesoscale air-sea interactions: atmospheric response and impacts on the ocean dynamics, EGU General Assembly 2024, Vienna, Austria, 14–19 Apr 2024, EGU24-20391, https://doi.org/10.5194/egusphere-egu24-20391, 2024.

With the aim of studying the momentum flux in wind-wave modulation situations, a 7 month field experiment was set-up in 2023 from the Belle-Ile-en-Mer island off the West coast of France. The site was selected for its exposure to dominant wind and swell, the proximity of a wave buoy, and the rapidly increasing water depth to allow a focus on deep to intermediate wave dispersion regimes. A scanning wind LiDAR [1,2] installed on the coast of the island was used to measure the vertical profile of the horizontal wind speed and direction from 1 to 3 kilometers from the coast. The configuration allowed for measurements of the wind speed and direction profiles starting at some meter above the water surface and going up to some 150m. This original approach enables to obtain quasi-instantaneous vertical planes of the wind speed as well as 30-min mean profiles simultaneously with a wave parameter.

The wide range of wind and wave combinations observed during the deployment allows statistical analysis. Significant wave heights, wave peak periods, and U10 wind speeds were observed in the range 0-6.5 m, 2-20 s, and 0.5-18 m/s, respectively. From this rich database, the near-surface momentum flux estimated by the wind profile close to the water surface appears to match well with results from COARE 3.5 algorithm. The possibility of the scanning wind LiDAR to measure mean wind profiles allows an original point of view to analyze wind-wave interactions. It was observed that for young seas, the profile can be in equilibrium, following Monin-Obukov similarity theory from close to the water surface up to some 100m. In contrast, for fast-travelling waves, significant deviations of the wind profile are observed compared to the surface fluxes. These deviations are parametrized as function of height and analyzed as function of the wave age.

[1] Paskin, L., Conan, B., Perignon, Y., & Aubrun, S. (2022). Evidence of Ocean Waves Signature in the Space–Time Turbulent Spectra of the Lower Marine Atmosphere Measured by a Scanning LiDAR. Remote Sensing, 14(13), 3007.

[2] Conan, B., & Visich, A. (2023). Measurement and analysis of high altitude wind profiles over the sea in a coastal zone using a scanning wind LiDAR–application to wind energy. Wind Energy Science Discussions, 2023, 1-23.


How to cite: Conan, B. and Bruch, W.: Analysis of wind profiles above the water surface in wind-wave interaction thanks to a scanning wind LiDAR, EGU General Assembly 2024, Vienna, Austria, 14–19 Apr 2024, EGU24-21643, https://doi.org/10.5194/egusphere-egu24-21643, 2024.

EGU24-162 | ECS | Posters on site | OS1.8

Tropical Pacific Quasi-Decadal Variability Suppressed by Submesoscale Eddies  

Yushan Qu, Shengpeng Wang, Zhao Jing, Yu Zhang, Hong Wang, and Lixin Wu

Tropical Pacific quasi-decadal (TPQD) climate variability is characterized by quasi-decadal sea surface temperature variations in the central Pacific. This low-frequency climate variability is suggested to influence extreme regional weather and substantially impact global climate patterns and associated socio-economy through teleconnections. Previous studies mostly attributed the TPQD climate variability to basin-scale air-sea coupling processes. However, due to the coarse resolution of the majority of the observations and climate models, the role of sub-basin-scale processes in modulating the TPQD climate variability is still unclear. Using a long-term high-resolution global climate model, we find that energetic small-scale motions with horizontal scales from tens to hundreds of kilometers (loosely referred to as equatorial submesoscale eddies) act as an important damping effect to retard the TPQD variability. During the positive TPQD events, compound increasing precipitation and warming SST in the equatorial Pacific intensifies the upper ocean stratification and weakens the temperature fronts along the Pacific cold tongue. This suppresses the growth of submesoscale eddies as well as their associated upward vertical heat transport by inhibiting baroclinic instability and frontogenesis; Conversely, during the negative TPQD events, the opposite is true. Using a series of coupled global climate models that participated in the Coupled Model Intercomparison Project Phase 6 with different oceanic resolutions, we show that the amplitude of the TPQD variability becomes smaller as the oceanic resolution becomes finer, providing evidence for the impacts of submesoscale eddies on damping the TPQD variability. Our study suggests that explicitly simulating equatorial submesoscale eddies is necessary for gaining a more robust understanding of low-frequency tropical climate variability.

How to cite: Qu, Y., Wang, S., Jing, Z., Zhang, Y., Wang, H., and Wu, L.: Tropical Pacific Quasi-Decadal Variability Suppressed by Submesoscale Eddies , EGU General Assembly 2024, Vienna, Austria, 14–19 Apr 2024, EGU24-162, https://doi.org/10.5194/egusphere-egu24-162, 2024.

The sensitivity of the sea surface height anomaly (SSHA) forecasting on the accuracy of mesoscale eddies over the Kuroshio Extension region, which was
determined by the conditional non-linear optimal perturbation (CNOP) method using a two-layer quasigeostrophic model, is evaluated by adopting multiply realistic marine datasets through an advanced particle filter assimilation method. It is shown that, if additional observations are preferentially assimilated to the sensitive area of mesoscale eddies identified by the CNOP, where the eddies present a clear high- to low-velocity gradient along the eddy rotation, the forecasting skill of the SSHA can be more significantly improved. It is also demonstrated that the forecasts of the SSHA in the region where the large-scale mean flow possesses much stronger barotropic and/or baroclinic instability tend to exhibit stronger sensitivity to the accuracy of the initial field in the sensitive area of mesoscale eddies. Therefore, more attention should be preferentially paid to the assimilation of the additional observations of the mesoscale eddies for the SSHA forecast in the region with a strong velocity shear of ocean circulation. The present study verifies the sensitivity on mesoscale eddies of SSHA forecasts derived by the two-layer quasigeostrophic model using multiply sets of realistic oceanic data, especially including observation and reanalysis data, which further additionally demonstrates the importance of targeted observations of mesoscale eddies to the SSHA forecast in the regions of strong velocity shear of ocean circulation and provides a more credible scientific basis for the field campaign of the targeted observations for mesoscale eddies associated with the SSHA forecasting.

How to cite: Jiang, L., Duan, W., and Liu, H.: The Most Sensitive Initial Error of Sea Surface Height Anomaly Forecasts andIts Implication for Target Observations of Mesoscale Eddies, EGU General Assembly 2024, Vienna, Austria, 14–19 Apr 2024, EGU24-2229, https://doi.org/10.5194/egusphere-egu24-2229, 2024.

EGU24-6196 | ECS | Orals | OS1.8

A model perspective on the drivers of the shallow oxygen minimum zone off the northwestern African coast 

Cláudio Cardoso, Paulo Calil, Rui M. A. Caldeira, and Álvaro Peliz

The Oxygen Minimum Zone (OMZ) off the coast of Mauritania and Senegal is characterized by a shallow and a deep oxygen minimum, each with potentially different formation mechanisms. Although the shallow OMZ has been linked to the en-route degradation of organic matter within highly productive, coastal-generated eddies, less attention has been paid to hypoxic Dissolved Oxygen (DO) concentrations observed along the coastal region, where low-oxygen eddies are formed. This study aims to clarify the spatio-temporal dynamics and underlying mechanisms that lead to the formation of the shallow OMZ along the northwestern African coast.

To achieve this, a Eulerian-Lagrangian numerical framework was employed by combining a coupled physical-biogeochemical model with a Lagrangian particle-tracking simulation. The model domain covers the entire Tropical Atlantic with an horizontal resolution of 3 km, achieving a good representation of the horizontal and vertical structure of the North Atlantic OMZ. To assess the pathways and evolution of the water masses that form the shallow OMZ, lagrangian particles were released in grid cells with DO < 40 μmol.l-1 and traced backwards in time.

Our results reveal distinct seasonal and latitudinal variations of DO concentrations along the coast, with DO concentrations significantly decreasing in the transition from the upwelling to the relaxation season (from May to July). Associated with the transport of more oxygenated South Atlantic Central Waters (SACW), the influence of the Poleward Undercurrent (PUC) on the ventilation of the coastal region is evident, especially when the current loses intensity and becomes a surface-intensified feature in summer. When the PUC reaches its maximum intensity in autumn, its core deepens below the mixed layer and replaces the older, oxygen-poor waters with ventilated waters of southern origin.

The impact of eddies on coastal dynamics was also explored. A quasi-permanent Anticyclonic Modewater Eddy (ACME) formed during the upwelling season by the interaction of the PUC with the Cap-Vert headland is the main mechanism behind the import of offshore waters to the coastal region. Lagrangian particle trajectories suggest that this eddy prevents the direct northward transport of SACW by the PUC. Whilst some of the particles are trapped and subsequently transported offshore inside the eddy, other particles are stirred with an older, less oxygenated SACW variety in the offshore region and re-circulate to the coastal region. Similar particle re-circulation patterns are also observed further north, coinciding with cyclonic and ACME formation hotspots.

Our findings suggest that in addition to their role in the formation and advection of oxygen-depleted waters to offshore, coastal-generated eddies play a crucial role in modulating DO levels along the northwestern African coast.

How to cite: Cardoso, C., Calil, P., Caldeira, R. M. A., and Peliz, Á.: A model perspective on the drivers of the shallow oxygen minimum zone off the northwestern African coast, EGU General Assembly 2024, Vienna, Austria, 14–19 Apr 2024, EGU24-6196, https://doi.org/10.5194/egusphere-egu24-6196, 2024.

EGU24-6690 | Orals | OS1.8

Parameterizing mesoscale eddy buoyancy transport over sloping topography 

Aleksi Nummelin and Pål Erik Isachsen
Models that do not resolve the mesoscale eddies tend to parameterize their impacts such that the parameterized transport of buoyancy and tracers reduces the large-scale available potential energy and spreads tracers. However, the parameterizations used in the ocean components of current generation Earth System Models (ESMs) rely on an assumption of a flat ocean floor even though observations and high-resolution modelling show that eddy transport is sensitive to the potential vorticity gradients associated with a sloping seafloor. Using a hierarchy of model complexities, we show that (i) the buoyancy transport coefficient diagnosed from idealized eddy-resolving simulations is indeed reduced over bottom slopes (ii) such reduction can be skillfully captured by a mixing length parameterization by introducing the topographic Rhines scale as a length scale (iii) implementing such a modified `GM' parameterization in non-eddying simulations enhances the strength of thermal wind currents over the bottom slopes. 
 
Testing the new parameterization in realistic global coarse-resolution simulations shows that the impact of topography is most pronounced at high latitudes, enhancing the mean flow strength and reducing temperature and salinity biases. Reducing the buoyancy transport coefficient further with a mean-flow dependent eddy efficiency factor, has notable effects also at lower latitudes and leads to reduction of global mean tracer biases. We find that most of the tracer bias reduction follows from changing the buoyancy transport coefficient (GM), but we also discuss the impact of applying similar changes to the tracer mixing coefficient (Redi).

How to cite: Nummelin, A. and Isachsen, P. E.: Parameterizing mesoscale eddy buoyancy transport over sloping topography, EGU General Assembly 2024, Vienna, Austria, 14–19 Apr 2024, EGU24-6690, https://doi.org/10.5194/egusphere-egu24-6690, 2024.

The ocean surface mixed layer represents a critical interface linking the ocean and atmosphere. The physical processes determining the surface mixed layer properties and mediate atmosphere-ocean exchange. Submesoscale processes play a key role in cross-scale oceanic energy transformation and the determination of surface mixed-layer properties, including the enhancement of vertical nutrient transport, leading to increased primary productivity. Herein, we presented observations of the spiral chlorophyll-a filament and its influence on turbulence within an anticyclonic eddy in the western South China Sea during August 2021. The filament had a negative Ertel potential vorticity associated with strong upwelled/downward currents (approximately 20-40 m/day). Across-filament sections of the in-situ profiles showed turbulent dissipation rates enhanced in the filament. We suggested this enhancement values can be attributed to submesoscale processes, which accounted for 25% of the total parameterized turbulent dissipation rates. The present parametrized submesoscale turbulent scheme overestimated the in-situ values. The filament transferred kinetic energy upward to anticyclonic eddy via barotropic instability and gained energy from the anticyclonic eddy via baroclinic instability. After kinetic energy budget diagnostic, we suggested besides symmetric instability, centrifugal instability and mixed layer baroclinic instability should also be included in the turbulence scheme to overcome the overestimation. The observed dual energy transfers between the anticyclonic eddy and filament, and the observed high turbulent energy dissipation within the filament, emphasized the need for these processes to be accurately parameterized regional and climate models. 

How to cite: Qiu, C. and Wang, D.: Observational energy transfers of a spiral cold filament within an anticyclonic eddy, EGU General Assembly 2024, Vienna, Austria, 14–19 Apr 2024, EGU24-6911, https://doi.org/10.5194/egusphere-egu24-6911, 2024.

EGU24-7540 | Posters on site | OS1.8

Spatial variations of eddy vertical structure and energy in the southeastern Indian Ocean 

Yinghui He, Qingyou He, Tongya Liu, and Shuqun Cai

Satellite observations demonstrate that mesoscale eddies are active and show significant spatial variability of surface features in the southeastern Indian Ocean (SEIO). Combining the satellite observation and Argo floats data, this study reveals the spatial variation of eddy vertical structure and volume-integrated energy in the SEIO. The sources of surface-intensified and subsurface-intensified eddies correspond well to the mean current systems. The surface-intensified cyclonic eddies (CEs) mainly originate from the South Indian Countercurrent system, whose density core is at a depth of ≈70 m, and subsurface-intensified CEs mainly originate from the Leeuwin Current system (LCS, ≈10° longitude off the eastern boundary of south Indian Ocean) and the SEIO interior south of 30°S, whose density core and maximum velocity are at depths of ≈750 m and ≈290 m, respectively. The surface-intensified anti-cyclonic eddies (AEs) widely originate from the entire region of SEIO, whose density core is at a depth of ≈110 m, while the sources of subsurface-intensified AEs only scatter in a few regions. The eddy lifespan in the SEIO is significantly correlated with the eddy volume-integrated energy. The most important factor affecting the spatial variability of eddy energy in the SEIO is eddy vertical structure, followed by the eddy amplitude. Finally, by investigating the performance of two reanalysis data in eddy statistical properties, we find that the biases of eddy lifespan and movement distance in the LCS is caused by the bias of eddy vertical structure. This further confirms the impact of the eddy vertical structure on the eddy evolution.

How to cite: He, Y., He, Q., Liu, T., and Cai, S.: Spatial variations of eddy vertical structure and energy in the southeastern Indian Ocean, EGU General Assembly 2024, Vienna, Austria, 14–19 Apr 2024, EGU24-7540, https://doi.org/10.5194/egusphere-egu24-7540, 2024.

EGU24-9815 | ECS | Posters on site | OS1.8

Characterization, distribution, and evolution of surface fronts in the Amazon Plume region 

Dante Napolitano, Jonathan Gula, Solange Coadou-Chaventon, Xavier Carton, and Sabrina Speich

The Amazon River runoff reigns absolute as the most prominent river discharge to the ocean, with about 0.2 Sv of freshwater entering the Northwest Atlantic. The Amazon River outflow together with the North Brazil Current (NBC), dominates the low sea surface salinity spread into the open ocean. At the edge of the river plume, stirring by the NBC and its eddies generates sharp gradients at scales from Ο(0.1-100) km. These (equatorial to tropical) submesoscale fronts are important, for example, in modulating air-sea interactions and the energy cascade. In the EUREC4A-OA project, we use state-of-the-art Saildrone observations and numerical simulation to assess surface gradients in the northwestern tropical Atlantic. Our objective is to provide a comprehensive picture of surface gradients and associated fronts in the Amazon Plume region. From observations, we find that the plume influences density gradients from scales l < 30 km; sharp gradients skyrocket within the plume at l < 10 km, a scale that has recently been shown to mark a shift from an inverse to a forward energy cascade. Using a Δx ≅1 km CROCO simulation, we assess the spatial distribution of surface fronts and their spatio-temporal variability. Salinity dominates surface gradients even outside the plume due to an almost permanent barrier layer formed by mixing of low salinity water from previous seasons. Near the shelf, the Amazon runoff controls the formation and evolution of fronts. As we move poleward, the NBC dictates the distribution of the surface fronts. The influence of the NBC gradually decreases until the distribution of fronts closely follows the mixed layer dynamics.

How to cite: Napolitano, D., Gula, J., Coadou-Chaventon, S., Carton, X., and Speich, S.: Characterization, distribution, and evolution of surface fronts in the Amazon Plume region, EGU General Assembly 2024, Vienna, Austria, 14–19 Apr 2024, EGU24-9815, https://doi.org/10.5194/egusphere-egu24-9815, 2024.

EGU24-10572 | ECS | Posters on site | OS1.8

On the Mechanisms Driving Latent Heat Flux Variations in the Northwest Tropical Atlantic 

Pablo Fernández, Sabrina Speich, Hugo Bellenger, Diego Lange Vega, Johannes Karstensen, Dongxiao Zhang, and Cesar Barbedo Rocha

The Northwest Tropical Atlantic (NWTA) is a region with complex surface ocean circulation. The most prominent feature is the North Brazil Current (NBC) and its retroflection at 8ºN that leads to the formation of numerous mesoscale eddies known as NBC rings. The NWTA also receives the outflow of the Amazon River, generating freshwater plumes that can extend up to 100,000 km2. These two processes affect the spatial variability of the region's surface latent heat flux (LHF). First, the presence of surface freshwater modifies the vertical stratification of the ocean limiting the amount of heat that can be released to the atmosphere. Second, they create a highly heterogeneous mesoscale sea-surface temperature (SST) field that directly influences near-surface atmospheric circulation. These effects are illustrated by observations from the ElUcidating the RolE of Cloud-Circulation Coupling in ClimAte - Ocean Atmosphere (EUREC4A-OA) and Atlantic Tradewind Ocean-Atmosphere Interaction Campaign (ATOMIC) experiments, satellite and reanalysis data. We decompose the LHF budget into several terms controlled by different atmospheric and oceanic processes to identify the mechanisms leading to LHF changes. We find LHF variations of up to 160 W·m2, of which 100 W·m2 are associated with wind speed changes and 40 W·m2 with SST variations. Surface currents or stratification-change associated heat release remain as second-order contributions with LHF variations of less than 10 W·m2 each. The results highlight the importance of considering these three components to properly characterize LHF variability at different spatial scales.

How to cite: Fernández, P., Speich, S., Bellenger, H., Lange Vega, D., Karstensen, J., Zhang, D., and Barbedo Rocha, C.: On the Mechanisms Driving Latent Heat Flux Variations in the Northwest Tropical Atlantic, EGU General Assembly 2024, Vienna, Austria, 14–19 Apr 2024, EGU24-10572, https://doi.org/10.5194/egusphere-egu24-10572, 2024.

EGU24-11486 | ECS | Posters on site | OS1.8

Unraveling the Eddy-driven Heat Transport in the Agulhas Leakage Region 

Lansu Wei and Chunzai Wang

The Agulhas leakage, which transports warm and salty Indian Ocean water into the Atlantic Ocean, plays a crucial role in global ocean circulation and climate. The mesoscale eddies from the leakage supply the primary source of heat and salt for the Atlantic meridional overturning circulation. This study combines eddy data with Argo profiles from 1993 to 2018 to investigate the three-dimensional structures of eddies, advancing our understanding of eddy-induced transport. Our analysis revealed that both the trapping and stirring processes of eddies influence eddy-induced transport. Anticyclonic eddies are found to transport heat in the meridional direction mainly through propagation (~60%). On the other hand, cyclonic eddies transport heat meridionally to the Atlantic Ocean primarily through the stirring of isotherms in the background field (~25%). These results further confirm that the stirring effect of cyclonic eddies is crucial for evaluating the impact of the Agulhas leakage on the Atlantic Ocean.

How to cite: Wei, L. and Wang, C.: Unraveling the Eddy-driven Heat Transport in the Agulhas Leakage Region, EGU General Assembly 2024, Vienna, Austria, 14–19 Apr 2024, EGU24-11486, https://doi.org/10.5194/egusphere-egu24-11486, 2024.

EGU24-12815 | Orals | OS1.8

Central structure of a Mozambique Channel mesoscale eddy-ring dipole 

Pierrick Penven, Jean Francois Ternon, Margaux Noyon, and Steven Herbette

Located in the southwest Indian Ocean, between Madagascar and the African continent, the Mozambique Channel is a western boundary current system characterized by an intense eddy activity (Halo et al. 2014). Large anticyclonic rings, reaching up to 300 to 350 km in diameter and 2000 m of vertical extension, are structuring the marine ecosystems from phytoplankton to top predators (de Ruijter et al., 2002; Ternon et al., 2014, Weimerskirch et al., 2004). They impact the environmental conditions on the Mozambican shelves by promoting the upwelling of nutrient rich deeper waters (Lamont et al., 2010; Malauene et al, 2014). Coastal waters, generally rich in plankton and nutrients, can be also be transported offshore along the edges of the rings. The occurrence of an eddy dipole with the anticyclonic ring in the northern side of the cyclonic eddy can enhance the processes (Roberts et al., 2014). Mesoscale eddy flux is supposed to be the dominant source of nutrients for the central Mozambique Channel (José et al., 2016). The first leg of the RESILIENCE (fRonts, EddieS and marIne LIfe in the wEstern iNdian oCEan) multidisciplinary oceanographic cruise on board R/V Marion Dufresne II in April-May 2022 was focusing on the central structure of a dipole composed by a Mozambique Channel Ring and a cyclonic spiral eddy. The goals were here to observe at high resolution the mesoscale and submesoscale structures in the core of the dipole, their origins and evolution, and their potential implications for biogeochemical and ecological processes in the Mozambique Channel. To do so we crossed several times the eastern side of the dipole, towing a moving vessel profiler in addition to SADCP continuous observations and multidisciplinary stations and trawls at regular intervals. The dipole event commenced on 24 April 2022 and endured for 24 days. Existence of strong currents, reaching speeds of 150 cm/s, leads to the prevalence of horizontal stirring as the dominant process. This results in an efficient and fast transport of material from the shelf to the central Mozambique Channel. The Omega equation was used to show the dominance of a smaller scale meander for the vertical velocities. Layering is evident in the frontal structure. This first documentation of the in-situ central structure of a dipole, formed by the convergence of a Mozambique Channel Ring and a spiral eddy, lays the foundation for subsequent ecological investigations.

How to cite: Penven, P., Ternon, J. F., Noyon, M., and Herbette, S.: Central structure of a Mozambique Channel mesoscale eddy-ring dipole, EGU General Assembly 2024, Vienna, Austria, 14–19 Apr 2024, EGU24-12815, https://doi.org/10.5194/egusphere-egu24-12815, 2024.

EGU24-12927 | ECS | Orals | OS1.8

Surface circulation and marine debris: exploring the impact of northwestern African upwelling on offshore transport 

Luuk Rader, Borja Aguiar-González, Timothy Price, Eugenio Fraile-Nuez, Daura Vega-Moreno, and Francisco Machín

Amidst the global challenge of plastic pollution, the marine environment surrounding the Canary Islands is not immune to this pressing issue. Besides, the northwestern African upwelling system is an ideal environment for fisheries, which eventually become potential contributors to marine floating debris. Entanglement in large marine floating debris of fisheries origin represents a prevalent cause of stranding incidents for sea turtles. However, connecting the fisheries activity with the offshore flow of this debris towards the open ocean and the Canary Islands proves challenging due to the high mesoscale variability in the region, which hampers a straightforward visualization of clear patterns of distribution.

This study aims to investigate the offshore transport of marine floating debris originating from the upwelling zone and elucidate the underlying driving mechanisms. Additionally, the study also aims to uncover the upwelling-related origins of marine debris observed in proximity to the Canary Islands.

To analyse the oceanward transport of marine debris, OceanParcels is used, a Lagrangian tool to estimate the trajectories of virtual particles released into the ocean. These particles are released along the African coast, and their trajectories are computed following two different approaches. Firstly, seasonally averaged surface velocities are used to account for the mean seasonal fields leading to the marine debris distribution. Secondly, daily-varying surface velocities are used to simulate real ocean conditions as closely as possible. Jointly, these views provide insights into the key features responsible for transporting particles offshore. Lastly, Stokes drift is incorporated to account for its impact on particle trajectories.

The results using seasonally-averaged surface velocities reveal the formation of offshore-orientated corridors through which particles, representing marine debris, are advected oceanward. This is confirmed following the daily-varying simulations. These corridors are hypothesized to be formed by the recurrent detachment of the coastal jet stream at certain key locations of the African coastline, then leading the transport of marine debris offshore. Furthermore, virtual particles are observed that are advected offshore via upwelling filaments, i.e. cold-water tongues that extend oceanward from the inner continental shelf. Importantly, Stokes drift appears to counterwork the offshore transport of marine debris likely due to a prevailing strong southward and coastward surface advection. However, it is noted that accounting for the Stokes drift is an ongoing field of research and its effect may be overestimated as currently implemented.

On the one hand, the upwelling zone north of Cape Ghir seems to be responsible for the largest amount of upwelling-related marine debris of a northern origin, reaching the Canary Islands through a northeast-to-southwest orientated corridor. On the other hand, the upwelling zone between Cape Ghir and Cape Bojador appears to be mostly responsible for the marine debris reaching the Canary Islands with a southern origin.

How to cite: Rader, L., Aguiar-González, B., Price, T., Fraile-Nuez, E., Vega-Moreno, D., and Machín, F.: Surface circulation and marine debris: exploring the impact of northwestern African upwelling on offshore transport, EGU General Assembly 2024, Vienna, Austria, 14–19 Apr 2024, EGU24-12927, https://doi.org/10.5194/egusphere-egu24-12927, 2024.

EGU24-14170 | Posters on site | OS1.8

Eddy covariance measurements of air-sea heat and momentum fluxes under tropical cyclones and hurricanes in the northwest Tropical Atlantic 

Dongxiao Zhang, Gregory Foltz, Chidong Zhang, Chris Fairall, Jun Zhang, Hyun-Sook Kim, Avichal Mehra, Andrew Chiodi, Meghan Cronin, Elizabeth Thompson, Jim Thomson, Lev Looney, Nan-Hsun Chi, Hauke Schulz, Ajda Savarin, and Edoardo Mazza

Tropical cyclones (TCs) and hurricanes are among the strongest Mesoscale Convection Systems originating from the tropical oceans and can cause significant loss of lives and properties when landing. Prediction of TCs, especially their rapid intensification, remains challenging for numerical forecasts. Theoretical and modeling studies have shown that the surface turbulence heat flux fuels hurricane intensification, while the momentum flux or wind stress transfers the kinetic energy from the storm to the ocean to regulate the ocean mixing and stratification which in turn affect the Sea Surface Temperature and heat flux. The balance between the surface enthalpy flux (sum of sensible and latent heat flux) and drag plays a critical role in the TC and hurricane intensification. Due to the lack of direct observations inside the TCs and hurricanes, studies largely based on numerical models, lab experiments, air-deployed dropsondes, and indirectly from momentum budget analysis, have suggested a large deviation of wind stress and drag coefficients at high wind speed of > 20 m/s in TC and hurricane conditions. During the 2021-2023 hurricane seasons, a fleet of 5-12 Saildrone Uncrewed Surface Vehicles (USVs) have been deployed each year to intercept the TCs and hurricanes to make direct observations of the extreme air-sea interaction process. They provided real-time 1-minute averages of near-surface meteorology and ocean variables (5-minute for ocean currents) to hurricane forecast centers. This study utilizes the high-resolution 20-Hz data made available once the Saildrone USVs returned from their cruises after the hurricane season to investigate direct eddy covariance (EC) measurements of wind stress for a better understanding of the drag coefficients under TC and hurricanes. The directly observed drag coefficient, as well as the EC heat transfer coefficient (for sensible heat flux), will be compared to those used in the bulk flux algorithm (COARE) and in forecast models. Particular attention will be paid to the variations in different wind and wave conditions within the mesoscale system.

How to cite: Zhang, D., Foltz, G., Zhang, C., Fairall, C., Zhang, J., Kim, H.-S., Mehra, A., Chiodi, A., Cronin, M., Thompson, E., Thomson, J., Looney, L., Chi, N.-H., Schulz, H., Savarin, A., and Mazza, E.: Eddy covariance measurements of air-sea heat and momentum fluxes under tropical cyclones and hurricanes in the northwest Tropical Atlantic, EGU General Assembly 2024, Vienna, Austria, 14–19 Apr 2024, EGU24-14170, https://doi.org/10.5194/egusphere-egu24-14170, 2024.

Mesoscale SST perturbations induced wind stress field perturbations have feedback effect on the ocean through influencing air-sea heat and momentum fluxes. Unlike the thermal feedback mechanism that is well understood, momentum feedback still needs to be studied, especially about the respective roles of divergent and rotational wind components. In this study, momentum feedback was examined using an ocean model and an empirical equation, which solved wind stress field perturbations from their divergence and curl that were estimated from time-evolving downwind and crosswind SST gradients. Through several numerical experiments, it was found that the divergent wind can induce positive and negative SST changes at varying regions and depths. On the contrary, the rotational wind can cool the upper ocean and reduce SST by 0.1°C on average.

How to cite: Wei, Y.: Cooling effect of mesoscale SST perturbations induced rotational wind in the Kuroshio Extension, EGU General Assembly 2024, Vienna, Austria, 14–19 Apr 2024, EGU24-14267, https://doi.org/10.5194/egusphere-egu24-14267, 2024.

EGU24-16202 | ECS | Orals | OS1.8

What happens when an inertially unstable jet approaches a lateral boundary? 

Matheus Ferreira Azevedo, Francis Poulin, and Kevin Lamb

Much of our understanding of inertial instability in geophysical flows comes from atmospheric physics, and these studies have neglected the impact of lateral boundaries. To address this shortcoming, we performed a series of high-resolution 3D numerical simulations in Oceananigans in the context of the nonhydrostatic Boussinesq equations assuming a rigid-lid approximation. An inertially unstable baroclinic jet was investigated both far away and adjacent to a vertical boundary. The jet was chosen to be in thermal-wind balance and the buoyancy field was perturbed to instigate the instability.

We found that when the unstable jet is sufficiently close to the vertical boundary, the wavenumber of the fastest-growing unstable mode nearly doubled when compared to the jet far away from the boundary. We have not observed this shift to smaller scales in the context of a barotropic jet. The growth rates of the instability, measured by taking the l2 norm of the velocity components, showed an initial linear growth phase in the first few days with no significant differences regarding the positioning of the jet. After this period, non-linear saturation stabilized the jet to inertial instability, and a secondary baroclinic instability developed. These findings suggest a previously unaccounted factor that can influence the bio-physicochemical properties of the ocean in proximity to coastal boundaries, contributing to the current understanding of the importance of submesoscale phenomena.

How to cite: Ferreira Azevedo, M., Poulin, F., and Lamb, K.: What happens when an inertially unstable jet approaches a lateral boundary?, EGU General Assembly 2024, Vienna, Austria, 14–19 Apr 2024, EGU24-16202, https://doi.org/10.5194/egusphere-egu24-16202, 2024.

EGU24-19188 | Orals | OS1.8

Multi-platform high resolution in situ observations for understanding mesoscale and sub-mesoscale processes and their role in the air-sea exchanges: Experiences and prospects from the EUREC4A-OA/ATOMIC field experiment 

Sabrina Speich, Johannes Karstensen, Xavier Carton, César Barbedo Rocha, Hugo Bellenger, Claudia Pasquero, Antonio Parodi, Jonathan Gula, Denis Bourras, Richard Davy, Lionel renault, Anna del Moral-Méndez, Dongxiao Zhang, Chris Fairall, David Farrell, Jin-Song von Storch, Hervé Giordani, Gilles Reverdin, Jochen Horstmann, and Noel Keenlyside and the EUREC4A-OA/ATOMIC Ocean-atmosphere processes

In January-February 2020, the EUREC4A-OA/ATOMIC experiment took place in the Northwest Tropical Atlantic with the overall goal of understanding the role of fine-scale processes in internal ocean dynamics and air-sea interaction. Four oceanographic ships, the French Atalante, the German Maria S. Merian and Meteor, and the US Ron Brown, were closely coordinated with airborne observations and autonomous ocean platforms (gliders, ©Saildrones, Argo floats, and drifters) to simultaneously measure the ocean and atmosphere from east of Barbados to the northern border of French Guyana. The multiple observations of the ocean, atmosphere, and their interface have revealed more complex ocean dynamics than expected, in particular a strong interaction between the Amazon River outflow (despite its reduced winter discharge), the North Brazil Current (NBC), and several mesoscale eddies (including the highly energetic NBC rings). This leads to even richer submesoscale dynamics that shape an important fraction of the air-sea exchange of heat, momentum, and CO2, and efficiently isolates the NBC northward flow waters from intense and continuous interactions with the atmosphere. Owing to the many complementary observations from ships and autonomous platforms, we have been able to quantify some of these processes, including the diurnal cycle and the 3D dynamics of different mesoscale eddies, as well as to map and quantify different terms of the air-sea fluxes and their impacts on the marine atmospheric boundary-layer water budget. The results have been widely used not only to validate numerical simulations of the region, but also to guide their analyses and to improve various numerical parameterizations.

The collection of these observations was the result of an important international coordination between many different groups of ocean and atmospheric scientists. In addition, the special strategy for targeted data collection of meso- and submesoscale processes relied on daily planning of the field experiment and on detailed analysis of the near-real-time satellite data and the observations already obtained during the experiment, which was essential for providing the right snapshots of the ocean and atmosphere for the quantification of many processes. The lessons learned from this experiment will be implemented and extended in the upcoming major high-resolution oceanographic endeavor, the WHIRLS experiment, which will take place in June-July 2025, southwest of Africa.

How to cite: Speich, S., Karstensen, J., Carton, X., Barbedo Rocha, C., Bellenger, H., Pasquero, C., Parodi, A., Gula, J., Bourras, D., Davy, R., renault, L., del Moral-Méndez, A., Zhang, D., Fairall, C., Farrell, D., von Storch, J.-S., Giordani, H., Reverdin, G., Horstmann, J., and Keenlyside, N. and the EUREC4A-OA/ATOMIC Ocean-atmosphere processes: Multi-platform high resolution in situ observations for understanding mesoscale and sub-mesoscale processes and their role in the air-sea exchanges: Experiences and prospects from the EUREC4A-OA/ATOMIC field experiment, EGU General Assembly 2024, Vienna, Austria, 14–19 Apr 2024, EGU24-19188, https://doi.org/10.5194/egusphere-egu24-19188, 2024.

EGU24-19696 | ECS | Orals | OS1.8

Coupled climate effects of eddy rich model resolution in and south of the Agulhas 

Malin Ödalen, Abhishek Savita, Joakim Kjellsson, Sebastian Wahl, David Ferreira, Holly Ayres, Fabien Roquet, and Wonsun Park

In this study, we compare global coupled climate simulations (1950’s and abrupt 4xCO2) with different ocean resolution in the Atlantic sector of the Southern Ocean (ASO), including the Agulhas, with parameterised and explicitly simulated eddies respectively. We find that the eddy-rich 1950’s simulation has a reduced South Atlantic warm bias, because of a more defined Agulhas retroflection, and coupled climate effects are observed outside the region with increased ocean resolution where e.g. equatorial precipitation changes markedly.

The Agulhas leakage plays a key role in connecting the Indian and the Atlantic oceans, with mesoscale eddies carrying heat and salt into the South Atlantic. In most state-of-the-art coupled climate models, the ocean resolution is insufficient to explicitly simulate those eddies, and they are instead represented through a parameterisation of the eddy induced flow. We use the coupled climate model FOCI, which combines a NEMO3.6 ocean with an ECHAM6 atmosphere, LIM2 sea ice, and a JSBACH land module, via an OASIS coupler. Through AGRIF nesting, we increase the ocean resolution from 1/2° to 1/10° in the Atlantic sector of the Southern Ocean.

The eddy-rich 1950’s simulation exhibits a reduced warm bias in the South Atlantic compared to the simulation without it. The bias reduction is a result of a more defined Agulhas retroflection which reduces ocean heat transport into the South Atlantic while increasing heat transport poleward. This change in ocean temperature distribution is anticipated from previous studies with ocean-only models. However, we also see coupled climate effects extending to the equatorial region, well outside the region with increased ocean resolution. We observe changes in precipitation and surface wind fields over both the tropical Atlantic and tropical/South Pacific. The changes over the tropical Atlantic are likely linked to a direct response to changes in sea surface temperature that extend across the South Atlantic. The eddy-rich 1950’s simulation also shows significant reduction of surface air temperature (SAT) biases, mostly in the Northern Hemisphere, and winds in the Southern Hemisphere, w.r.t. observationally based reanalysis products. In the strong warming scenario (abrupt 4xCO2), the eddy-rich simulation shows less SAT increase over the Atlantic and a larger seasonality in the response of the westerly wind fields over the Southern Ocean. In conclusion, increased resolution of the ASO, allowing for explicit simulation of mesoscale eddies e.g. in the Agulhas, leads to reduction of model biases and coupled climate effects.

How to cite: Ödalen, M., Savita, A., Kjellsson, J., Wahl, S., Ferreira, D., Ayres, H., Roquet, F., and Park, W.: Coupled climate effects of eddy rich model resolution in and south of the Agulhas, EGU General Assembly 2024, Vienna, Austria, 14–19 Apr 2024, EGU24-19696, https://doi.org/10.5194/egusphere-egu24-19696, 2024.

EGU24-19719 | ECS | Orals | OS1.8

An Offline Biogeochemical Model within the Regional Ocean Modelling System (ROMS): application to the Northwestern Mediterranean Sea 

Júlia Crespin Esteve, Jordi Solé Ollé, and Miquel Canals Artigas

Modelling the distribution of biogeochemical components in the ocean is essential for further understanding climate change impacts and assessing the functioning of marine ecosystems. This requires robust and efficient physical-biological simulations of coupled ocean-ecosystem models, which are often hindered by limited data availability and computational resources. The option of running biological tracer fields offline, independently from the physical ocean simulation, is appealing due to increased computational efficiency. Here, we present an assessment and implementation of an offline biogeochemical model — the Offline Fennel model — within the Regional Ocean Modeling System (ROMS). Our methodology employs ROMS hydrodynamic outputs to run the biogeochemical model offline. This work also includes the first evaluation exercise of the referred offline biogeochemical model. We used a variety of skill metrics to compare the simulated surface chlorophyll to an ocean colour dataset (CMEMS-Mediterranean Ocean Colour) and BGC-ARGO floats for the 2015-2020 period. The model is able to reproduce the temporal and spatial structures of the main chlorophyll fluctuation patterns in the study area, the Northwestern Mediterranean Sea, as well as the vertical distribution of chlorophyll and nitrate. This area is of particular interest as it is one of the most productive regions in the entire Mediterranean Basin, with open-ocean upwellings and deep winter convection events occurring seasonally. The typical behaviour of the region is likewise effectively represented in the implementation, including offshore primary production, nutrient supplies from the Rhone and Ebro rivers, and mesoscale hydrographic structures. This study provides a baseline for ROMS users in need of executing more biogeochemical simulations independently from more computationally demanding physical simulations.

How to cite: Crespin Esteve, J., Solé Ollé, J., and Canals Artigas, M.: An Offline Biogeochemical Model within the Regional Ocean Modelling System (ROMS): application to the Northwestern Mediterranean Sea, EGU General Assembly 2024, Vienna, Austria, 14–19 Apr 2024, EGU24-19719, https://doi.org/10.5194/egusphere-egu24-19719, 2024.

EGU24-1830 | ECS | Posters on site | OS1.9

A Detailed Analysis of the Diahaline Overturning Circulation in a Marginal Sea 

Erika Henell, Hans Burchard, Ulf Gräwe, and Knut Klingbeil

We apply a local water mass transformation framework to quantify and decompose the exchange flow associated with diahaline mixing. As a realistic example we analyze two years of numerical model results for the Baltic Sea, which serves as a natural laboratory for processes relevant on the global scale. Despite this regional focus, the diagnostic methods of this study are applicable to diverse regions, as well as for other tracers than salinity, e.g. temperature. We verify relations between local diahaline volume and diffusive salt fluxes, and local diahaline mixing, and present them as maps on chosen isohaline surfaces. In this way, hot spots for mixing and the diahaline circulation are visualized. Two dominant types of diahaline exchange flow are analyzed. First of all there is a large scale overturning circulation with inflow at places where the isohaline surface is close to the bottom and with outflow at places where the isohaline is surfacing. Secondly, there is the well-known small-scale overturning circulation localized inside the bottom boundary layer over sloping bathymetry, driven by boundary mixing. One major result is that about 50% of the simulated diahaline exchange flow is generated by numerical mixing caused by the truncation error of the advection scheme, despite the fact that an anti-diffusive advection scheme and vertically-adaptive coordinates are used. We also demonstrate how model ensembles can be used to study short-term episodic and local events.

How to cite: Henell, E., Burchard, H., Gräwe, U., and Klingbeil, K.: A Detailed Analysis of the Diahaline Overturning Circulation in a Marginal Sea, EGU General Assembly 2024, Vienna, Austria, 14–19 Apr 2024, EGU24-1830, https://doi.org/10.5194/egusphere-egu24-1830, 2024.

The atmospheric circulation response to global warming is an important problem that is theoretically still not well understood. This is a particular issue since climate model simulations provide uncertain, and at times contradic- tory, projections of future climate. In particular, it is still unclear how a warmer and moister atmosphere will affect midlati- tude eddies and their associated poleward transport of heat and moisture. Here we perform a trend analysis of three main components of the global circulation}the zonal-mean state, eddies, and the net energy input into the atmosphere}and examine how they relate in terms of a moist static energy budget for the JRA-55 reanalysis data. A particular emphasis is made on understanding the contribution of moisture to circulation trends. The observed trends are very different between the hemispheres. In the Southern Hemisphere there is an overall strengthening and during boreal summer, also a poleward shifting, of the jet stream, the eddies, and the meridional diabatic heating gradients. Correspondingly, we find an overall strengthening of the meridional gradients of the net atmospheric energy input. In the Northern Hemisphere, the trend pat- terns are more complex, with the dominant signal being a clear boreal winter Arctic amplification of positive trends in lower-tropospheric temperature and moisture, as well as a significant weakening of both bandpass and low-pass eddy heat and moisture fluxes. Consistently, surface latent and sensible heat fluxes, upward and downward longwave radiation, and longwave cloud radiative fluxes at high latitudes show significant trends. However, radiative fluxes and eddy fluxes are in- consistent, suggesting data assimilation procedures need to be improved.

How to cite: Franzke, C. and Harnik, N.: Long-Term Trends of the Atmospheric Circulation and Moist Static Energy Budget in the JRA-55 Reanalysis , EGU General Assembly 2024, Vienna, Austria, 14–19 Apr 2024, EGU24-3002, https://doi.org/10.5194/egusphere-egu24-3002, 2024.

It has previously been shown that trends in sensible heat from climate models have had a substantial contribution to global precipitation changes. We illustrate that this is the case also in the most recent Coupled Model Intercomparison Project Phase 6 (CMIP6). However, we find that over the period since 1980 reanalysis do not support the reduction in sensible heat from the CMIP6 models and rather estimate a global increase in sensible heat which would contribute to a precipitation reduction. Satellite data over a period of 2 decades over global ocean similarly to reanalysis show an opposite sign of the sensible heat trend to the CMIP6 models.

How to cite: Myhre, G. and Jouan, C.: Strong contribution from sensible heat to global precipitation increase by climate models is not supported by observational based data. , EGU General Assembly 2024, Vienna, Austria, 14–19 Apr 2024, EGU24-3902, https://doi.org/10.5194/egusphere-egu24-3902, 2024.

EGU24-4138 | ECS | Posters on site | OS1.9

Robust predictions of changes in evenness of global precipitation under global warming 

Hsin Hsu and Stephan Fueglistaler

Global mean precipitation is anticipated to increase by 2-4% per degree Kelvin, with intense events scaling at 7%, driven by boundary layer humidity. The understanding of the change in daily-to-annual precipitation probability density function remains rather incomplete. To address this knowledge gap, we employ Gini index to evaluate spatial unevenness and temporal inequality of precipitation under global warming in CMIP6 models. We observe heightened spatial unevenness of daily precipitation in tropics and extratropics over land and ocean. While the tropics maintain this unevenness over time, indicating large-scale convection aggregation, extratropical precipitation evens out with increasing timescales. This disparity suggests distinct processes governing daily and annual mean precipitation, underscoring the intensification of stronger storms over weaker events.


Globally, temporal inequality is on the rise, with more pronounced intensification in regions where projected precipitation deviates significantly from Clausius–Clapeyron scaling. Our hypothesis posits that the shift in precipitation distribution under warming projections stems from an increase in no-rain days coupled with rainfall events scaled by a constant. To assess this proposition, we construct a toy model predicting projected temporal inequality based on local hydroclimate conditions pre-warming, the projected mean precipitation, and a theorem-derived stretching parameter. The toy model demonstrates robust performance overall, except in regions notably influenced by the Hadley cell. Additionally, the model suggests that local precipitation events are scaled by a constant of approximately 1.07. Our analysis establishes meaningful connections among changes in mean precipitation, precipitation distribution, and dry-day number, offering comprehensive insights into hydroclimate transformations under global warming.

How to cite: Hsu, H. and Fueglistaler, S.: Robust predictions of changes in evenness of global precipitation under global warming, EGU General Assembly 2024, Vienna, Austria, 14–19 Apr 2024, EGU24-4138, https://doi.org/10.5194/egusphere-egu24-4138, 2024.

EGU24-6543 | Orals | OS1.9

Relative role of land and ocean in shaping tropical hydroclimate after large volcanic eruptions 

Claudia Timmreck, Roberta D'Agostino, Shih-Wei Fang, Andrew Ballinger, Gabriele Hegerl, Sarah Kang, Dirk Olonscheck, and Andrew Schurer

Volcanic eruptions substantially impact tropical precipitation over the historical period but they differ in their emission strength, geographical latitude and season of the eruption, which makes it difficult to draw general conclusions. Sufficient large ensembles simulations with the same model and radiative forcing scenario but varying initial conditions have become a great tool in recent years to disentangle forced and internal variability).  Here we use a suite of 100-member ensembles of the MPI-ESM-LR for idealized equatorial and extratropical eruptions of different eruption strengths and an additional 100-member ensemble without forcing. We find that precipitation reduction is primarily energetically constrained by less atmospheric net energy input (NEI).  NEI decreases rapidly in the first months after the eruption due to reduced incoming solar radiation and then the circulation weaken as a consequence of less moist static energy (MSE) exported away from the intertropical convergence zone. Only afterwards, when the overturning has already weakened, the MSE, and then the gross moist stability (GMS) contribute stronger to the precipitation reduction. Tropical precipitation over land reacts immediately to forcing changes, while the precipitation response over the ocean and the temperature response have much longer response times. Altered dry-wet pattern (“wet gets drier”) and the decreased monsoon precipitation are strongly tied to the weakening of the regional tropical overturning. Differences related to the geographical locations of the volcanic eruptions will be highlighted.

How to cite: Timmreck, C., D'Agostino, R., Fang, S.-W., Ballinger, A., Hegerl, G., Kang, S., Olonscheck, D., and Schurer, A.: Relative role of land and ocean in shaping tropical hydroclimate after large volcanic eruptions, EGU General Assembly 2024, Vienna, Austria, 14–19 Apr 2024, EGU24-6543, https://doi.org/10.5194/egusphere-egu24-6543, 2024.

The ocean temperature response to tropical cyclones (TCs) is important for TC development, local air–sea interactions, and the global air–sea heat budget and transport. As TCs and ocean temperature structures are changing in the recent decades, it is worthy to study their contribution on ocean heat uptake. The modulation of the upper ocean temperature structure after TCs were studied at the observation stations in the northern South China Sea. The upper ocean temperature and heat response to the TCs mainly depend on the combined effect of mixing and vertical advection. Mixing cooled the sea surface and warmed the subsurface, while upwelling (downwelling) reduced (increased) the subsurface warm anomaly and cooled (warmed) the deeper ocean. An ideal parameterization that depends on only the nondimensional mixing depth (HE), non-dimensional transition layer thickness (HT), and nondimensional upwelling depth (HU) was able to roughly reproduce sea surface temperature (SST) and upper ocean heat change. After TCs, the subsurface heat anomalies moved into the deeper ocean. The air–sea surface heat flux contributed little to the upper ocean temperature anomaly during the TC forcing stage and did not recover the surface ocean back to pre-TC conditions more than one and a half months after the TC. This work shows how upper ocean temperature and heat content varies by a TC, indicating that TC-induced mixing modulates the warm surface water into the subsurface, and TC-induced advection further modulates the warm water into the deeper ocean and influences the local and global ocean heat budget.

How to cite: Zhang, H.: Modulation of Ocean Temperature Structure and Heat Content by Tropical Cyclones, EGU General Assembly 2024, Vienna, Austria, 14–19 Apr 2024, EGU24-6938, https://doi.org/10.5194/egusphere-egu24-6938, 2024.

EGU24-7000 | ECS | Orals | OS1.9

Ocean heat uptake and interbasin redistribution driven by anthropogenic aerosols and greenhouse gases 

Shouwei Li, Wei Liu, Robert J. Allen, Jia-Rui Shi, and Laifang Li

Anthropogenic aerosols and greenhouse gases have played important roles in modulating the storage and distribution of heat in oceans since the industrial age. Here we isolate and quantify the effects of both using coupled climate model simulations. We show that, relative to the pre-industrial ocean, the Southern Ocean imports heat from the Indo-Pacific Ocean but exports heat into the Atlantic Ocean in response to anthropogenic aerosols. Ocean heat uptake diminishes in the subpolar Atlantic. Alterations in ocean circulation and temperature have a weak compensation in contributing to interbasin heat exchange. Consequently, interbasin heat exchange contributes comparably to ocean heat uptake changes to modifying the stored heat in the Atlantic and Indo-Pacific. The greenhouse-gas-associated changes are the opposite of the aerosol-associated changes. Anthropogenic greenhouse gases promote the ocean heat uptake in the subpolar Atlantic and allow the Southern Ocean to import heat from the Atlantic but export heat to the Indo-Pacific. The cause of this ocean heat redistribution is distinct from the aerosol-forcing scenario, seeing that ocean circulation effects are strongly offset by temperature shifts. Accordingly, interbasin heat exchange is much less important than ocean heat uptake changes for greenhouse-gas-associated ocean heat storage. Our results suggest that the aerosol-driven changes in ocean circulations and associated interbasin heat transports are more effective in altering oceanic heat distribution than those driven by globally increasing greenhouse gases.

How to cite: Li, S., Liu, W., Allen, R. J., Shi, J.-R., and Li, L.: Ocean heat uptake and interbasin redistribution driven by anthropogenic aerosols and greenhouse gases, EGU General Assembly 2024, Vienna, Austria, 14–19 Apr 2024, EGU24-7000, https://doi.org/10.5194/egusphere-egu24-7000, 2024.

EGU24-7842 | Orals | OS1.9

Tracking sea salt instead of saline water 

Kristofer Döös, Inga Koszalka, and Lars Axell

Lagrangian (parcel following) approach is a powerful method to diagnose the modelled flow and associated property changes in atmosphere and ocean and is used to investigate causal links between the property changes between the different regions. The salt in the saline sea water has traditionally been tracked as tracer property or a marker of sea water despite the seawater is constituted of both water and salt molecules. In the present study, we propose an new approach relying on tracking  separately the mass of fresh water and salt in the ocean. As a study region we have chosen the Baltic Sea, a semi-enclosed sea characterised by a distinct estuarine circulation due to river runoff and deep salt water inflow from the North Sea. The salt was tracked by summing over both the advective and diffusive salt fluxes simulated by the circulation model NEMO. Salt and water trajectories were computed with the mass conserving TRACMASS model, where each trajectory tube is in units of m3/s of water flux or kg/s of salt flux. 
The preliminary results show a clear difference between salt and water trajectories, where e.g. the salt trajectories (red in the attached Figure) do not reach as far into the Baltic Sea as the (blue) water trajectories. Many diagnostics such as the residence time and age also differ, which opens up a completely new vision of the ocean circulation

.

Figure: Water mass (blue) and salt mass (red) trajectories entering the Baltic Sea through the Danish straits.

How to cite: Döös, K., Koszalka, I., and Axell, L.: Tracking sea salt instead of saline water, EGU General Assembly 2024, Vienna, Austria, 14–19 Apr 2024, EGU24-7842, https://doi.org/10.5194/egusphere-egu24-7842, 2024.

EGU24-7960 | Orals | OS1.9

Zonal Wave Three: Trends and links to extreme events 

James Arthur Renwick

In the Southern Hemisphere atmospheric circulation, one of the most prominent wave patterns is zonal wave three (ZW3), which exhibits three positive and three negative anomalies in the zonal eddy field around the Southern Hemisphere, with maximum amplitude over the Southern Oceans. Using ERA5 data, this presentation will describe the form of ZW3 and trends in its behaviour. Over the past 60 years, the amplitude of ZW3 exhibits significant upward trends throughout the year but most prominently in summer (Dec-Feb). Such trends are related to increasing meridional temperature gradients and to trends in eddy activity in general and to trends in poleward energy fluxes. Implications for surface climate temperature and precipitation extremes will be outlined.

How to cite: Renwick, J. A.: Zonal Wave Three: Trends and links to extreme events, EGU General Assembly 2024, Vienna, Austria, 14–19 Apr 2024, EGU24-7960, https://doi.org/10.5194/egusphere-egu24-7960, 2024.

EGU24-8252 | ECS | Orals | OS1.9

Surface forcing controls on the volume and heat content of subtropical and subpolar mode waters over the global ocean 

Ciara Pimm, Richard Williams, Dani Jones, and Andrew Meijers

Mode waters provide an important role within the climate system, sequestering large amounts of heat and anthropogenic carbon and play a key role in the transport of these properties around the globe. Our aim is to assess the roles of local versus remote surface forcing in controlling the properties of mode waters over the northern Atlantic and Pacific basins and the Southern Ocean. A set of adjoint sensitivity experiments are conducted using the ECCOv4r4 state estimate to assess the impacts of surface heat flux, freshwater flux, and wind stresses on the volume and heat content of mode waters in density space. Mode waters are identified using areas of deep winter mixed layers and their characteristic temperature, stratification, and neutral density properties. The adjoint modelling approach calculates time-evolving sensitivity maps that identify where and when specific surface forcing impacts properties in the mode water formation sites. The sensitivity analysis reveals the dominance of local forcing from surface heat fluxes with surface cooling initially increasing volume. On longer time scales, the sensitivities have differing responses to surface forcing including surface heat loss leading to a delayed restratification due to a haline contribution after a thermal contribution is effectively damped. The responses of the mode waters to surface forcing are then compared across their formation sites, in the northern basins involving western boundary currents and gyre interiors and in the Southern Ocean involving the Antarctic Circumpolar Current.

How to cite: Pimm, C., Williams, R., Jones, D., and Meijers, A.: Surface forcing controls on the volume and heat content of subtropical and subpolar mode waters over the global ocean, EGU General Assembly 2024, Vienna, Austria, 14–19 Apr 2024, EGU24-8252, https://doi.org/10.5194/egusphere-egu24-8252, 2024.

EGU24-8399 | ECS | Posters on site | OS1.9

Future AMOC recovery modulated by atmospheric water vapor shortwave absorption 

Doseok Lee, Hanjun Kim, and Sarah Kang

The amount of shortwave radiation absorbed by atmospheric water vapor is highly model dependent. This study examines how differences in the atmospheric water vapor shortwave radiation absorption affect the CO2-induced climate response pattern. We control the atmospheric water vapor shortwave radiation absorption in Community Earth System Model 1.2.2 (CESM1-CAM4-POP2) by altering the water vapor shortwave absorptivity parameter k by 60% to 120% of the default value. The pre-industrial control simulations with different k values are integrated for 150 years and additional 150 years are integrated after abruptly quadrupling CO2 concentrations. Regardless of the k value, the Atlantic meridional overturning circulation (AMOC) weakens in response to the quadrupling of CO2. However, the simulation with a higher k value exhibits a faster AMOC recovery approximately 30 years after the quadrupled CO2, with the lowest k simulation exhibiting a persistent AMOC weakening with no sign of recovery for the entire 300-year integration period. The faster AMOC restoration with a larger k value is attributed to the climatologically colder and saltier subpolar North Atlantic sea surface condition arising from the larger Arctic sea ice fraction due to colder temperature associated with stronger atmospheric shortwave absorption. The colder and more saline subpolar North Atlantic sea surface facilitates a more rapid destratification of surface density, establishing a favorable condition for the AMOC restoration. The faster restoration of the AMOC with the higher k value leads to a larger inter-hemispheric energy asymmetry followed by a more northward ITCZ shift as well as a stronger equilibrium climate sensitivity. This study demonstrates the complex interaction among different elements within the Earth system, encompassing radiation, sea ice, AMOC, and large-scale atmospheric circulation, suggesting a way to reduce uncertainties in future climate projections by improving the parameterization of shortwave radiation absorption by atmospheric water vapor.

How to cite: Lee, D., Kim, H., and Kang, S.: Future AMOC recovery modulated by atmospheric water vapor shortwave absorption, EGU General Assembly 2024, Vienna, Austria, 14–19 Apr 2024, EGU24-8399, https://doi.org/10.5194/egusphere-egu24-8399, 2024.

EGU24-10237 | ECS | Posters on site | OS1.9

New insights into seasonal to interannual salinity variability on the Northeast U.S. continental shelf and slope 

Svenja Ryan, Caroline C. Ummenhofer, and Glen G. Gawarkiewicz

The Northeast U.S. continental shelf is a highly productive and economically important region that has experienced robust changes in upper-ocean properties in recent decades. Warming rates exceed the global and North Atlantic average and in particular several episodes of anomalously warm temperatures, so called marine heatwaves, have had devastating impacts on regional fisheries over the past decade. There are also indicators of a salinification of the region, which might be linked to large-scale changes in the North Atlantic circulation as well as changes in regional processes, such as the number of Warm Core Rings shedding of the Gulf Stream, driving an increased salinity flux into the continental slope and shelf region. With now more than a decade of remote-sensing sea surface salinity data, we revisit seasonal to interannual salinity variability and assess the role of salinity for modulating stratification on the continental shelf. We provide important regional context for the interpretation of data from the OOI Coastal Pioneer array, a local shelf-break observatory. We find that the local seasonal cycle is an interplay of seasonal freshwater input via local river discharge, driving decreasing salinities in spring and summer not just on the shelf but also in the Slope Sea. An observed salinification in the fall is likely linked to offshore forcing over the slope associated with the presence of Warm Core Rings. A coherent low-frequency salinity variability is found over the slope and shelf region in the Mid-Atlantic Bight (MAB) and Gulf of Maine, highlighting that shelf conditions in particular in the MAB are not solely dominated by upstream shelf conditions but are significantly impacted by local offshore variability. Furthermore, we synthesise hydrographic data from the NOAA ECOsystem MONitoring (ECOMON) program to construct mean cross-shelf sections along the MAB to investigate the relative contributions of thermal and haline components to the seasonal stratification. Overall, salinity serves as a valuable tracer, in addition to temperature, of these multi-variate processes and with now more than a decade of satellite surface salinity can shed new light on the spatio-temporal variability on the Northeast U.S. continental shelf. 

How to cite: Ryan, S., Ummenhofer, C. C., and Gawarkiewicz, G. G.: New insights into seasonal to interannual salinity variability on the Northeast U.S. continental shelf and slope, EGU General Assembly 2024, Vienna, Austria, 14–19 Apr 2024, EGU24-10237, https://doi.org/10.5194/egusphere-egu24-10237, 2024.

EGU24-10440 | ECS | Posters on site | OS1.9

Linking midlatitude transient eddy moist static energy transport and extratropical cyclones 

Jan Zibell, Sebastian Schemm, and Alejandro Hermoso Verger

Earth's equator-to-pole net radiation gradient is counteracted by poleward atmospheric energy transport. In the extratropics, the largest contribution to this poleward flux can be attributed to variability on the timescale of weather systems. Even though the radiative imbalance has been argued not to strongly differ in a warmer climate, the partitioning of heat flux into moist and dry components is expected to change due to a moister atmosphere. On the synoptic scale, an increase in moisture and associated latent heat release enhances the intensification of cyclones, prolongs cyclone lifetimes, and also strengthens downstream anticyclones. Conversely, latent heating locally alters static stability and thereby affects projected trends in baroclinicity, which in turn vary across height due to different trends in temperature. Given that these drivers of cyclones and thereby storm tracks are subject to change and the resulting interplay is complex, isolating the influence of changes in latent heating on cyclone number and storm track intensity is not straight-forward. By combining the global moist static energy (MSE) budget perspective with cyclone numbers and other feature-based characteristics such as intensity and intensification, we aim to better understand the role of latent heat transport and release on midlatitude storm tracks. In particular, we ask: How are changes in zonal and time mean poleward transient eddy MSE flux and its divergence related to changes in cyclone number and intensities?

We start investigating the linkage between MSE fluxes and surface cyclones in reanalysis data by calculating cyclone composites. These analyses reveal that in general, poleward flux in the vicinity of low-pressure systems reaches its maximum during the intensification phase and drops after cyclones reaching mature stage. Furthermore, MSE flux peaks slightly equatorward and downstream of the cyclone center. In the mean picture, this signal can be related to warm-sector flux along the cold front, also indicating that the footprint of cold-sector flux is not as dominant. Further separating dry and moist flux components is expected to reveal additional insight into how heat transport is distributed across cyclones. These diagnostics can readily be applied to climate model data and idealized aquaplanet simulations, which we make use of to reduce the complexity and single out the effect of individual drivers of storm track changes.

How to cite: Zibell, J., Schemm, S., and Hermoso Verger, A.: Linking midlatitude transient eddy moist static energy transport and extratropical cyclones, EGU General Assembly 2024, Vienna, Austria, 14–19 Apr 2024, EGU24-10440, https://doi.org/10.5194/egusphere-egu24-10440, 2024.

The Atlantic Multidecadal variability (AMV) is a multivariate climate phenomenon with wide societal impacts in the North Atlantic region and beyond. In order to gain insight into the circulation dynamics controlling the AMV, we calculate Atlantic upper ocean heat and salt budgets at the basin and sub basin scale, focussing on multi-year to multidecadal timescales, for the upper ocean using output from a subset of CMIP6 models which have the same ocean component (the NEMO model) at nominal horizontal resolutions of 1 degree, ¼ degree and 1/12 degree and corresponding atmosphere-forced ocean-only models. We decompose the advection term into geostrophic and ageostrophic components and further use a Reynolds type decomposition to understand contributions from time-mean versus transient components of the flow. We use a novel decomposition of the large-area heat budget which highlights contributions due to spatial covariance between the large scale circulation and temperature/salinity gradients. Finally we relate the spatial pattern of the heat and salt advection to the meridional overturning (zonal) and horizontal gyre (azonal) components of the flow.

How to cite: Sinha, B.: Simulation of historical ocean heat and salt content changes in the Atlantic basin in CMIP6 models, EGU General Assembly 2024, Vienna, Austria, 14–19 Apr 2024, EGU24-10628, https://doi.org/10.5194/egusphere-egu24-10628, 2024.

EGU24-11362 | ECS | Posters on site | OS1.9

Deep ocean hydrographic heterogeneity inferred from offshore geodetic experiments 

Anna Jegen, Dietrich Lange, Johannes Karstensen, Oscar Pizarro, and Heidrun Kopp

Observational evidence, supported by high resolution numerical model simulations, indicate that meso- and submesoscale dynamics exists in the deep ocean (>2000m). However, over most parts, observing the deep ocean is restricted to address either spatial but not temporal (ship surveys) or temporal but not spatial (moored sensors) scales of variability. The advent of a growing number of offshore geodesy experiments, conducted with networks of distributed sensor arrays, aiming to evaluate tectonic deformation through strain measurements can potentially provide new ways to observe deep sea hydrographic variability. Despite the different observing objectives of offshore geodetic and oceanographic experiments, a great overlap in the measured parameter space exists, which has motivated analyses exploring possible cross-benefits. Here we present the evaluation of temperature, pressure, and sound speed observations from a 2.5-year offshore geodesy experiment centered along the northern Chilean subduction zone (~21.5°S and ~71.5°W to ~70.5°W). Our analysis confirms multi-year warming trends that previous studies have reported for the deep ocean but shows an additional regionalization of warming trends. Superimposed onto the multi-year warming trend are temperature fluctuations that show multi-hourly to multi-weekly periods and amplitudes that show both spatial and depth/regional dependencies. Aside from a general decrease in energy levels of the fluctuations with depth, we see evidence of ocean-topography interactions through barotropic topography waves. Taken together, the observations reveal de-coupled dynamical regimes seaward and landward of the deep-sea trench that mark the extent of the abyssal part of the eastern boundary current off Chile and demonstrate the potential of time series from offshore geodetic surveys for hydrographic analyses.

How to cite: Jegen, A., Lange, D., Karstensen, J., Pizarro, O., and Kopp, H.: Deep ocean hydrographic heterogeneity inferred from offshore geodetic experiments, EGU General Assembly 2024, Vienna, Austria, 14–19 Apr 2024, EGU24-11362, https://doi.org/10.5194/egusphere-egu24-11362, 2024.

EGU24-11856 | ECS | Posters on site | OS1.9

Seasonal Salinification of the US Northeast Continental Shelf Driven by an Imbalance Between Along-Shelf Advection and Cross-Shelf Eddy-Covariance Fluxes 

Lukas Taenzer, Ke Chen, Albert Plueddemann, and Glen Gawarkiewicz

The US Northeast continental shelf “cold pool” defines the body of winter-cooled Shelf Water that decouples from the surface layer during the stratified season. The cold pool canonically preserves fresh Shelf Water properties throughout the summer, which fulfills vital needs for the regional benthic ecosystem in the economically most productive fisheries region across the United States. However, recent warming trends significantly above the global average have put the ecosystem under environmental stress. While the cold pool’s heat content has been studied in detail, data limitations and large interannual variability in salinity have hampered an assessment of the cold pool’s salt budget. Here, we provide first evidence that the cold pool’s salt content increases significantly during the stratified season and investigate dynamical drivers of this trend, using a combination of multi-year mooring and glider observations and high-resolution regional model output. Cold pool salinification rates of 6 mPSU/day remain steady throughout the stratified season, leading to salinity differences of 1 PSU between April and October. The annual cold pool salinification is caused by an imbalance between eddy-covariance salt fluxes across the US Northeast shelfbreak front and advection of freshwater from upstream. While eddy-fluxes deposit salt onto the continental shelf at all times of year, the US Northeast shelfbreak jet is weakest during the summer, which reduces along-shelf advection. A seasonal reduction in the along-shelf salinity gradient is likely caused by processes in the Gulf of Maine/on Georges Bank. The observed interannual variability of the salinification signal is shaped by the intermittency of strong cross-shelfbreak eddy-covariance fluxes that are concentrated within 3-4 episodic events per year. Capturing the hydrographic trends in coastal water mass budgets and identifying their underlying dynamical mechanisms will lead to a better understanding of ecosystem responses and support sustainable fisheries management in a rapidly changing coastal ocean region. 

How to cite: Taenzer, L., Chen, K., Plueddemann, A., and Gawarkiewicz, G.: Seasonal Salinification of the US Northeast Continental Shelf Driven by an Imbalance Between Along-Shelf Advection and Cross-Shelf Eddy-Covariance Fluxes, EGU General Assembly 2024, Vienna, Austria, 14–19 Apr 2024, EGU24-11856, https://doi.org/10.5194/egusphere-egu24-11856, 2024.

EGU24-11925 | Posters virtual | OS1.9

Spontaneous equatorial flow reversals at the equator in  moist shallow water turbulence 

Nili Harnik, Josef Schröttle, Dl Suhas, and Jai Sukhatme

Equatorial superrotation is a striking feature in planetary circulations, also found in atmospheric circulation models. Geological evidence shows that Earth was in a state of super-rotation during the Eocene and Pliocene. On Earth, such a time period of super-rotation is sometimes referred to as permanent El Niño. While it is well established that a tropical wave source is needed for superrotation, the mechanism that provides this wave source, and what conditions allow it to be maintained are still not understood, and vary between different models. Specifically, in shallow water models with Earth like parameters, superrotation has only been found when relatively strong thermal damping was added. In this study we examine the spontaneous evolution of super-rotation in fully developed isotropically forced two-dimensional moist shallow-water turbulence, and examine the role of moisture by varying the strength of moisture coupling, and performing large ensembles of simulations. 

We find that while the dry runs exhibit both superrotation and sub-rotation, with spontaneous transitions between the two states, moisture results in all runs eventually reaching a stable superrotating state. We further find that a stable superrotation develops in the dry runs when we strengthen the thermal damping. We find that a meridional mass flux from the equator to the subtropics, develops in the runs with stable superrotation, and examine the role of this mass flux, which is enabled by the latent heating and the thermal damping, for the maintenance of the stable superrotation. 

How to cite: Harnik, N., Schröttle, J., Suhas, D., and Sukhatme, J.: Spontaneous equatorial flow reversals at the equator in  moist shallow water turbulence, EGU General Assembly 2024, Vienna, Austria, 14–19 Apr 2024, EGU24-11925, https://doi.org/10.5194/egusphere-egu24-11925, 2024.

EGU24-13947 | ECS | Posters on site | OS1.9

An Argo Float Study of Temperature and Salinity in the Subpolar region of the Cambpell Plateau 

Ana Amaral Wasielesky, Milena Menna, Angelo Rubino, Riccardo Martellucci, Yuri Cotroneo, Giuseppe Aulicino, Antonino Ian Ferola, and Elena Mauri

The Subantarctic region of New Zealand is marked by a unique and complex bathymetry that includes an ocean ridge and a substantial submarine plateau known as the Campbell Plateau. This plateau is located near the Pacific sector of the Southern Ocean, and plays a vital role in the export of heat, salt, and nutrients into the lower thermocline, primarily through the formation of mode waters. In the present study, Argo floats data from 2003 to 2023 are used to identify the main water masses along the eastern margin of the Campbell Plateau. This region, located at the boundary between subtropical and subantarctic fronts, is characterized by the formation of Sub-Antarctic Mode Water (SAMW) and Antarctic Intermediate Water (AAIW), which make an important contribution to the broader oceanic circulation patterns. First results reveal the presence of eight distinct water masses in the study region and emphasize their peculiar seasonal variability. A decadal analysis describes colder waters in the period 2003-2013 compared to 2014-2023, while significant changes in salinity are observed in 2017-2018. Water mass identification, depicted through Temperature-Salinity plots, is consistent with existing literature, but can also provide new insights on the interaction between subantarctic and subtropical waters. This research contributes to describe the ocean dynamic of Subantarctic New Zealand. The use of Argo float data provides an unprecedented level of detail in examining the spatial and temporal resolution of an area located between two different current systems, whose changes potentially influence the global and Southern Ocean circulation patterns, with consequent implication on the climate.

How to cite: Amaral Wasielesky, A., Menna, M., Rubino, A., Martellucci, R., Cotroneo, Y., Aulicino, G., Ferola, A. I., and Mauri, E.: An Argo Float Study of Temperature and Salinity in the Subpolar region of the Cambpell Plateau, EGU General Assembly 2024, Vienna, Austria, 14–19 Apr 2024, EGU24-13947, https://doi.org/10.5194/egusphere-egu24-13947, 2024.

EGU24-14534 | Posters on site | OS1.9

A new spice/heave decomposition of thermohaline variability 

Remi Tailleux

The temporal variability of temperature and salinity in the oceans is strongly impacted by the ocean stratification, which tends to constrain lateral advection and mixing to preferentially take place along approximately neutral surfaces. As a result, it is natural to seek a decomposition of thermohaline variability into heave and spice components, which splits temperature and salinity into a component contributing to density and one that is density-compensated. In this talk, I will outline the theoretical foundations for such an approach, based on a recent redefinition of spiciness, and illustrate its usefulness for understanding the variability of the ocean heat and salt contents in the EN4 dataset over the past century.

How to cite: Tailleux, R.: A new spice/heave decomposition of thermohaline variability, EGU General Assembly 2024, Vienna, Austria, 14–19 Apr 2024, EGU24-14534, https://doi.org/10.5194/egusphere-egu24-14534, 2024.

EGU24-14622 | ECS | Posters on site | OS1.9

Multidecadal meridional dipole mode in the Indian Ocean subsurface ocean heat content 

Anand Babu Amere, Mihir Kumar Dash, and Balaji Senapati

Multidecadal changes in the background state of the Indian Ocean, such as variations in ocean circulation patterns, sea level and heat storage, can act as a carrier wave for the climate change and other variabilities. The long-term (~60 years since 1958) analysis of subsurface ocean heat content (sub-OHC) in the Indian Ocean exhibits the presence of a dominant multidecadal meridional dipole mode in the region. The analysis shows that until the late 1980s, a basin-wide meridional dipole mode is present, followed by the mode embedded in uniform basin-wide patterns. The trends of thermocline depth and sea surface height also exhibit the similar patterns. It is found that two distinct mechanisms are account for the observed patters in the Indian Ocean. Firstly, Local wind forcing is responsible for the meridional dipole patterns. In the off-equatorial southern Indian Ocean region, wind stress and Ekman pumping velocity trends favor downwelling (upwelling), resulting in thermocline depth deepening (shallowing) during 1958-1975 and 1976-1987, respectively. Secondly, the observed basin-wide warming and cooling trends during 1988-2000 and 2001-2014 are explained by the combined effect of local wind forcing and heat transport from the western Pacific through the Indonesian throughflow.

How to cite: Amere, A. B., Dash, M. K., and Senapati, B.: Multidecadal meridional dipole mode in the Indian Ocean subsurface ocean heat content, EGU General Assembly 2024, Vienna, Austria, 14–19 Apr 2024, EGU24-14622, https://doi.org/10.5194/egusphere-egu24-14622, 2024.

EGU24-15419 | ECS | Posters on site | OS1.9

Multi-centennial evolution of the climate response and deep ocean heat uptake in a set of abrupt stabilization scenarios 

Federico Fabiano, Paolo Davini, Virna L. Meccia, Giuseppe Zappa, Alessio Bellucci, Valerio Lembo, Katinka Bellomo, and Susanna Corti

A set of 1000-year long abrupt stabilization simulations have been performed with the EC-Earth3 climate model. Each simulation follows a sudden stabilization of the external forcing, starting at different years of the CMIP6 historical and SSP5-8.5 scenario. The final global mean temperature increases range between 1.4 and 9.6 K with respect to the pre-industrial baseline.

We first explore here the evolution of the climate response at multi-centennial timescales and its dependence on the level of forcing, with regards to the climate feedback parameter and to patterns of surface warming. We then focus on the rate of heat storage in the global ocean, which is the main driver of the climate response at multi-centennial timescales. We find that the rate of warming of the deep ocean is almost independent from the amplitude of the forcing, so that most of the additional heat remains in the upper layers at high forcing. We hypothesize that this is due - at least partly - to a decreased ventilation of the deep ocean, caused by a general reorganization of the Meridional Overturning Circulation (MOC).


How to cite: Fabiano, F., Davini, P., Meccia, V. L., Zappa, G., Bellucci, A., Lembo, V., Bellomo, K., and Corti, S.: Multi-centennial evolution of the climate response and deep ocean heat uptake in a set of abrupt stabilization scenarios, EGU General Assembly 2024, Vienna, Austria, 14–19 Apr 2024, EGU24-15419, https://doi.org/10.5194/egusphere-egu24-15419, 2024.

EGU24-16423 | ECS | Posters on site | OS1.9

Estimating Atlantic meridional heat transport through Bayesian modelling of altimetry, Argo and GRACE data 

Parvathi Vallivattathillam and Francisco M Calafat

The Atlantic Meridional Overturning Circulation (AMOC) plays a pivotal role in the meridional transport of heat, freshwater and major dissolved gases such as carbon, and oxygen, making it a crucial component of earth’s climate system and the biosphere. On millennial timescales, the AMOC is believed to act as a conveyor belt of ocean currents wherein the flow varies coherently across latitudes. Past studies have drawn on this conveyor-belt idea to establish links between the AMOC and the Earth's climate tipping points. However, recent research and observations suggest that, on shorter timescales (days to decades), the AMOC may not operate as coherent flow of water. Understanding AMOC variability and coherence on such timescales and how these might respond to anthropogenic influences is crucial to predicting the climate of the next decades. This is, however, challenging due to the sparseness of the observational data in both time and space. Here, we present a Bayesian Hierarchical modelling framework that combines observations from altimetry, gravimetry, and Argo floats to estimate meridional heat transport across the Atlantic. Our approach considers error structures jointly and accounts for spatiotemporal dependencies between processes (thermosteric, halosteric and ocean mass), providing a coherent way to propagate uncertainty and overcoming the limitations of hydrography-only based analyses. Our estimate of heat transport is in very good agreement (correlation of ~0.8 for 3-month means) with that from RAPID observations at 26°N. A meticulous comparison of mean and variance further underscores the precision of our estimates compared to those derived from heat budgets. Our method can be extended to gain further insights into the dynamics and meridional coherence of AMOC at shorter timescales.

How to cite: Vallivattathillam, P. and Calafat, F. M.: Estimating Atlantic meridional heat transport through Bayesian modelling of altimetry, Argo and GRACE data, EGU General Assembly 2024, Vienna, Austria, 14–19 Apr 2024, EGU24-16423, https://doi.org/10.5194/egusphere-egu24-16423, 2024.

EGU24-16722 | ECS | Posters on site | OS1.9

On critical dependence of atmospheric circulation response to regional SST biases on background SST 

Yuan-Bing Zhao, Nedjeljka Zagar, and Frank Lunkeit

This study examines how the geographic location of sea surface temperature (SST) biases influences global atmospheric responses. Utilizing an intermediate-complexity atmospheric model, 106 century-long simulations with idealized SST perturbations—emulating biases in coupled climate models—were performed. The intensity of the global atmospheric response to SST biases is evaluated by quantifying changes in global wave energy and interannual variance. The findings underscore the response's dependency on local background SST. Notably, with an imposed SST bias of +1.5 K, a significant global response is triggered once background SST surpasses approximately 25°C. This geographic dependency is related to the critical SST threshold for intense convection. Consequently, these results highlight the need for heightened focus on tropical oceans, especially the Indo-West Pacific, where SST biases can significantly impact the accuracy of global climate simulations.

How to cite: Zhao, Y.-B., Zagar, N., and Lunkeit, F.: On critical dependence of atmospheric circulation response to regional SST biases on background SST, EGU General Assembly 2024, Vienna, Austria, 14–19 Apr 2024, EGU24-16722, https://doi.org/10.5194/egusphere-egu24-16722, 2024.

EGU24-17118 | Posters on site | OS1.9

Heating rate and energy gradient from the tropics to the North Pole 

Luca Ferrero, Niccolò Losi, Martin Rigler, Asta Gregorič, Griša Močnik, Piotr Markuszewski, Przemysław Makuch, Tymon Zielinski, Paulina Pakszys, Matteo Rinaldi, Marco Paglione, Angelo Lupi, and Ezio Bolzacchini

Absorbing aerosol species, such as Black (BC) and Brown (BrC) Carbon, are able to warm the atmosphere. The role of aerosols is one of the least clear aspects in the so called “Arctic Amplification” (AA) and up to now this was mostly modelled [1,2]. For this reason, we took part in four scientific cruises (AREX, Arctic-Expedition, summer 2018, 2019, 2021 and EUREC4A, 2020) in the North Atlantic, eastward and south-eastward of Barbados, aiming at the determination of the aerosol chemical composition and properties from the Tropics to the North Pole.

The Heating Rate (HR) was experimentally determined at 1 minute time-resolution along different latitudes by means of an innovative methodology [3], obtained by cumulatively taking into account the aerosol optical properties, i.e. the absorption coefficients (measured by AE33 Aethalometer) and incident radiation (direct, diffuse and reflected) across the entire solar spectrum. The HR computed along AREX and in Milan (in the same period) were used to determine the energy gradient, due to the LAA induced heat storage at mid-latitudes, which contributes to AA through the atmospheric heat transport northward.

Moreover, aerosol chemical composition was achieved by means of sampling via high volume sampler (ECHO-PUF Tecora) and analysis via ion chromatography, TCA08 for Total Carbon content, Aethalometer AE33 (for BC), ICP-OES for elements.

A clear latitudinal behaviour in Black Carbon concentrations, with the highest values at low latitudes (e.g. average BC concentration in Gdansk up to 1507±75 ng/m3) and a progressive decrease moving northwards and away from the big Arctic settlements (Black Carbon concentrations within the 81st parallel: 5±1 ng/m3).

According to the latitudinal behaviour of BC concentrations and solar radiation (decreases towards the north while the diffuse component increases), HR decreases noticeably towards the Arctic: e.g. higher in the harbor of Gdansk (0.290±0.010 K/day) followed by the Baltic Sea (0.04±0.01 K/day), the Norvegian Sea (0.010±0.010 K/day) and finally with the lowest values in the pure Arctic Ocean (0.003±0.001 K/day). Accordingly, the energy density added to the system by the aerosol, a positive forcing that differs by 2 orders of magnitude between mid-latitudes and North Pole was found: 347.3 ± 11.8 J/m3 (Milan), 244.8 ± 12.2 J/m3 (Gdansk) and 2.6 ± 0.2 J/m3 (80°N). These results highlight the presence of a great energy gradient between mid-latitudes and Arctic that can trigger a heat transport towards the Arctic. Moreover this was strengthen by the HR value for EUREC4A in Barbados that was 0.175±0.003 K/day. Finally, preliminary results from Antarctica collected onboard the Italian RV Laura Bassi cruising the Southern Ocean and the Ross Sea will be shown.


Acknoledgements: GEMMA Center, Project TECLA MIUR – Dipartimenti di Eccellenza 2023–2027. JPI EUREC4A-OA project. CAIAC (oCean Atmosphere Interactions in the Antarctic regions and Convergence latitude) PNRA project


References

[1] Navarro, J. C. A. et al. (2016) Nat. Geosci. 9, 277–281.

[2] Shindell, D. and Faluvegi, G. (2009) Nat. Geosci. 2, 294–300.

[3] Ferrero, L. et al. (2018) Environ. Sci. Technol. 52, 3546 3555.

How to cite: Ferrero, L., Losi, N., Rigler, M., Gregorič, A., Močnik, G., Markuszewski, P., Makuch, P., Zielinski, T., Pakszys, P., Rinaldi, M., Paglione, M., Lupi, A., and Bolzacchini, E.: Heating rate and energy gradient from the tropics to the North Pole, EGU General Assembly 2024, Vienna, Austria, 14–19 Apr 2024, EGU24-17118, https://doi.org/10.5194/egusphere-egu24-17118, 2024.

After many decades of relative stability, the heat content of the oceans has been increasing at a relatively steady rate since the late 70’s, as confirmed by the analysis of many observational datasets. How global warming affects the available potential energy (APE) of the oceans, however, has received comparatively much less attention, yet is important to assess changes in the strength of wind-driven gyres and Antarctic Circumpolar Current for instance. In this talk, I will contrast the temporal changes over the past century of the APE and background potential energy (BPE) of the oceans based on the analysis of the EN4 dataset, by making use of the most recent local theory of APE. Results show that temporal changes in the BPE mimic that of the ocean heat content estimated in terms of potential temperature or Conservative Temperature. In contrast to the ocean heat content, the total APE of the oceans does not exhibit any marked trend. In this talk, I will discuss how regional APE estimates differ from the global APE estimate, to identify whether global warming has any detectable impact the large-scale ocean circulation features.

How to cite: Tailleux, R.: A complete energy analysis of ocean background and available potential energy over the past century, EGU General Assembly 2024, Vienna, Austria, 14–19 Apr 2024, EGU24-17583, https://doi.org/10.5194/egusphere-egu24-17583, 2024.

EGU24-19893 | Posters on site | OS1.9

Analysis of water mass transformations and the spurious thermohaline overturning circulation in numerical ocean models 

Knut Klingbeil, Erika Henell, Tridib Banerjee, Hans Burchard, and Sergey Danilov

Numerical models have become an important tool for investigating the oceans heat and salt contents. The large-scale thermohaline overturning circulation in the world ocean is directly linked to the transformation of water masses caused by small-scale diapycnal mixing, which is parameterized in models. However, in addition to this physically justified "physical mixing", numerical transport schemes rely on additional "numerical mixing" for stability reasons. Thus, the simulated overturning circulation in ocean models is strongly affected by this spurious mixing.
Diagnostics of spurious mixing in terms of local tracer variance decay offer a detailed analysis of water mass transformations (WMT). Vice versa, analysis methods for WMT can be used to deduce information about the effects of mixing. In contrast to direct mixing diagnostics based on discrete variance decay (DVD) in geographical space, the WMT analysis framework is based on a mapping to tracer space, where diatracer fluxes that quantify the WMT can directly be diagnosed. Recently, a new local framework was derived, which combines the classical WMT framework with the local DVD analysis (Klingbeil & Henell, 2023). The derived analytical relations between dia-surface fluxes and mixing were demonstrated in an isohaline framework by Henell et al. (2023) [see corresponding submission to this session].
We will present how this methodology can be transferred to the world ocean in order to diagnose local diapycnal mixing and to quantify the spurious contribution to the simulated thermohaline overturning circulation in ocean models. In particular, the extension to density space requires the consistent quantification of density DVD, which is challenging in numerical models with prognostic equations for salinity and temperature and a non-linear equation of state.


Henell, E., H. Burchard, U. Gräwe, K. Klingbeil (2023) Spatial composition of the diahaline overturning circulation in a fjord-type, non-tidal estuarine system. Journal of Geophysical Research (Oceans). https://dx.doi.org/10.1029/2023JC019862.

Klingbeil, K. and E. Henell (2023) A Rigorous Derivation of the Water Mass Transformation Framework, the Relation between Mixing and Diasurface Exchange Flow, and Links to Recent Theories in Estuarine Research. Journal of Physical Oceanography. https://doi.org/10.1175/JPO-D-23-0130.1.

How to cite: Klingbeil, K., Henell, E., Banerjee, T., Burchard, H., and Danilov, S.: Analysis of water mass transformations and the spurious thermohaline overturning circulation in numerical ocean models, EGU General Assembly 2024, Vienna, Austria, 14–19 Apr 2024, EGU24-19893, https://doi.org/10.5194/egusphere-egu24-19893, 2024.

EGU24-20262 | ECS | Posters on site | OS1.9

Multi-scale temperature variability in the Arctic Mediterranean between 1958 to 2023 – from surface to abyss  

Birgit Rinde, Shengping He, and Camille Li

The temperature of the Arctic Ocean and adjacent areas has increased over recent decades and is expected to continue to increase through this century. Discrepancies between previous studies based on different periods, domains, and datasets suggest that the warming of the Arctic Ocean is nonlinear and characterized by large temporal and spatial variability. The behavior of this warming signal has numerous local effects on aspects from sea ice cover and surface fluxes to ecosystems, all of which react differently to linear warming compared to episodic warming events. The spatiotemporal warming pattern will also play a role in defining the product of dense-water formation in the region, which feeds into the lower limb of the Atlantic Meridional Overturning Circulation. Utilizing the ORAS5 reanalysis, the Arctic Subpolar gyre sTate Estimates, as well as in-situ observations, we present an overview of the warming of the Arctic Ocean and the Nordic Seas between 1958 and 2023. We shed light on the variability of trends and seasonal signals across the Arctic Ocean, from surface to abyss. This analysis provides a solid baseline for detecting regional changes in the mean state and variability of the Arctic Ocean with global warming and exploring the physical mechanisms causing the warming trend. As such, it will be key for grounding investigations of future changes in heat budgets for the Arctic Ocean and the Nordic Seas. 

How to cite: Rinde, B., He, S., and Li, C.: Multi-scale temperature variability in the Arctic Mediterranean between 1958 to 2023 – from surface to abyss , EGU General Assembly 2024, Vienna, Austria, 14–19 Apr 2024, EGU24-20262, https://doi.org/10.5194/egusphere-egu24-20262, 2024.

EGU24-508 | ECS | Posters on site | OS1.10

Interactions Between a Marine Heatwave and Tropical Cyclone Amphan in the Bay of Bengal in 2020 

Saurabh Rathore, Rishav Goyal, Babita Jangir, Caroline Ummenhofer, Ming Feng, and Mayank Mishra

Interactions are diagnosed between a marine heatwave (MHW) event and tropical super cyclone Amphan in the Bay of Bengal. In May 2020, an MHW developed in the Bay of Bengal driven by coupled ocean-atmosphere processes which included shoaling of the mixed layer depth due to reduced wind speed, increased net surface shortwave radiation flux into the ocean, increased upper ocean stratification, and increased sub-surface warming. Ocean temperature, rather than salinity, dominated the stratification that contributed to the MHW development and the subsurface ocean warming that also increased tropical cyclone heat potential. The presence of this strong MHW with sea surface temperature anomalies >2.5°C in the western Bay of Bengal coincided with the cyclone track and facilitated the rapid intensification of tropical cyclone Amphan to a super cyclone in just 24 h. This rapid intensification of a short-lived tropical cyclone, with a lifespan of 5 days over the ocean, is unprecedented in the Bay of Bengal during the pre-monsoon period (March-May). As the cyclone approached landfall in northern India, the wind-induced mixing deepened the mixed layer, cooled the ocean's surface, and reduced sub-surface warming in the bay, resulting in the demise of the MHW. This study provides new perspectives on the interactions between MHWs and tropical cyclones that could aid in improving the current understanding of compound extreme events that have severe socio-economic consequences in affected countries.

How to cite: Rathore, S., Goyal, R., Jangir, B., Ummenhofer, C., Feng, M., and Mishra, M.: Interactions Between a Marine Heatwave and Tropical Cyclone Amphan in the Bay of Bengal in 2020, EGU General Assembly 2024, Vienna, Austria, 14–19 Apr 2024, EGU24-508, https://doi.org/10.5194/egusphere-egu24-508, 2024.

EGU24-1252 | ECS | Posters on site | OS1.10

Future Projections of Marine Heatwaves in the Indian Ocean under Different Socioeconomic Pathways 

Dushantha Sandaruwan Jayarathna Wijendra Naidhelage, Wen Zhou, Matthew Collins, Oluwafemi E. Adeyeri, Xuan Wang, Erandani Lakshani Widana Arachchige, and Ni Zekai

Marine heatwaves (MHWs) are extended periods of abnormal warm sea surface temperature (SST) events that can have considerable impact on the marine ecosystems and associated services. Despite recent developments in studying MHWs in the Indian Ocean, our understanding of their future occurrence remains limited. Hence, this study is crucial to expanding our understanding of future MHWs in the region. We use observational data from the Optimal Interpolated Sea Surface Temperature analysis (OISSTv2) and daily SST data from 14 models obtained from Coupled Model Intercomparison Project Phase 6 (CMIP6) to investigate the spatial and temporal characteristics of MHWs in the historical period (1982-2014) and future (2015-2100) under three shared socioeconomic pathways (SSPs, e.g., SSP126, SSP245, SSP585). During the historical period, more intense MHWs concentrated near the northern Arabian and Bay of Bengal region, with total MHW days of 20 ~ 25 days per year and mean intensity of 2 ~ 3 oC per year. The CMIP6 models overestimate the duration of MHWs while underestimating their intensity. Nevertheless, we employ the quantile delta mapping bias correction method to minimize these uncertainties in the CMIP6 multi model ensemble mean for a robust and reliable depiction of the future MHWs characteristics. We note accelerated positive trend in MHW metrics, including total days, and cumulative intensity, in the future compared to the historical period, resulting from global warming. Moreover, different emission scenarios exhibit different future MHWs characteristics. Specifically, the duration and mean intensity of MHWs are distinctly higher under SSP585 compare to other two scenarios, except for MHW frequency. Considering that we focused on a fixed baseline for MHW detection, we attribute the increase in MHWs duration to anthropogenic greenhouse gas emissions. Therefore, we emphasize the need for proactive measures to mitigate the impacts on future MHWs on marine ecosystems and associated services in the face of climate change.


How to cite: Wijendra Naidhelage, D. S. J., Zhou, W., Collins, M., E. Adeyeri, O., Wang, X., Widana Arachchige, E. L., and Zekai, N.: Future Projections of Marine Heatwaves in the Indian Ocean under Different Socioeconomic Pathways, EGU General Assembly 2024, Vienna, Austria, 14–19 Apr 2024, EGU24-1252, https://doi.org/10.5194/egusphere-egu24-1252, 2024.

Heading into a potential El Niño in 2023/24, concern was high amongst Australian marine stakeholders regarding potential marine heatwave impacts on marine industries and systems in the coming summer. Targeted climate outlook briefings for the Great Barrier Reef and Western Australian coral reefs have been provided prior to and throughout the summer months by the Australian Bureau of Meteorology for the past 10-15 years, however in 2023 these were requested much earlier than usual. Also in 2023, national level seafood-focused briefings were requested by the fisheries sector for the first time, with various state and regional level meetings and information requests also occurring.

Subseasonal to seasonal forecast information played a critical role in these briefings, providing both the big picture in terms of climate drivers impacting Australian waters as well as regional information regarding sea surface temperatures around Australia. These forecast products are operationally produced by the Australian Bureau of Meteorology using the seasonal prediction system ACCESS-S. Clear communication of forecast probabilities and model skill was essential. New prototype marine heatwave forecasts were also presented to marine stakeholders, indicating where there was a high likelihood of marine heatwaves occurring in the upcoming season, together with likely severity. Demand for this new information on temperatures extremes was high and provided impetus for setting up coordinated briefings and response plans across sectors.

Forecasts can provide a 'preparation window' for marine stakeholders to implement proactive management strategies prior to high-risk conditions, noting however that not all industries have the same level of agility to respond. Subseasonal to seasonal forecast tools, that are useful, usable and used, provide valuable information to assist marine stakeholders in managing climate risk and vulnerability in a warming climate.

How to cite: Spillman, C., Hobday, A., Smith, G., and Hartog, J.: Building industry resilience through seasonal forecast briefings to Australian marine stakeholders heading into the 2023/24 summer, EGU General Assembly 2024, Vienna, Austria, 14–19 Apr 2024, EGU24-1558, https://doi.org/10.5194/egusphere-egu24-1558, 2024.

EGU24-1779 | ECS | Posters on site | OS1.10

Assessing Marine Heatwave Variability in the Luzon Strait 

Rose Angeli Macagga and Po-Chun Hsu

The Luzon Strait, a 350-km wide channel located between Taiwan and the Philippines, connects the West Philippine Sea and the north Pacific Ocean. Multiple factors affect the circulation in the Luzon Strait, such as the Kuroshio Current, monsoon, and the West Philippine Sea circulation. Discrete periods of extreme ocean warming events, also known as marine heatwaves (MHWs), have been occurring longer and more frequently across the globe. Anomalous temperature events can cause drastic changes in the biogeochemical processes and trigger adverse effects on marine ecology in the surrounding areas. This study aims to understand the variation in MHWs in the study area (16-24°N, 115-126°E), focusing on the Luzon Strait, using a daily global 5-km sea surface temperature (SST) product from 1985 to 2022. Four points of known coral reef areas were also chosen to further assess the MHWs and their possible effects on marine ecology.  Six MHW indices were utilized to describe the frequency, duration, and intensity of MHW events. The highest frequency of 17 MHWs in a year occurred in 1998, while the longest duration per event of 144 days and the total duration in a year of 308 days were recorded in 2020 and 2021, respectively. The highest values for all three intensity parameters were recorded in 2021, with mean, maximum, and cumulative intensities reaching 2.62°C, 3.86°C, and 227.42°C-days, respectively. The spatial distribution of monthly SST and ocean current profile showed thermal areas and helped identify high-risk areas. Climate variations, such as El Niño Southern Oscillation (ENSO) and Pacific Decadal Oscillation (PDO), were also explored as physical drivers of MHW in the study area. It has been observed that most of the years featuring MHW events at the four coral reef points occurred during the La Niña phase of ENSO, in conjunction with the negative phase of PDO, including 1998, 2010, and from 2020 onwards. Additionally, from 2016 to 2019, MHWs were observed at the same points during the positive phase of PDO, in conjunction with El Niño, La Niña, or Neutral phases of ENSO.

How to cite: Macagga, R. A. and Hsu, P.-C.: Assessing Marine Heatwave Variability in the Luzon Strait, EGU General Assembly 2024, Vienna, Austria, 14–19 Apr 2024, EGU24-1779, https://doi.org/10.5194/egusphere-egu24-1779, 2024.

EGU24-1883 | ECS | Orals | OS1.10

Extreme and compound ocean events are key drivers of projected low pelagic fish biomass  

Natacha Le Grix, William Cheung, Gabriel Reygondeau, Jakob Zscheischler, and Thomas Frölicher Frölicher

Ocean extreme events, such as marine heatwaves, can have harmful impacts on marine ecosystems. Understanding the risks posed by such extreme events is key to develop strategies to predict and mitigate their effects. However, the underlying ocean conditions driving severe impacts on marine ecosystems are complex and often unknown as risks to marine ecosystems arise not only from hazards but also from the interactions between hazards, exposure and vulnerability. Marine ecosystems may not be impacted by extreme events in single drivers but rather by the compounding effects of moderate ocean anomalies. Here, we employ an ensemble climate-impact modeling approach that combines a global marine fish model with output from a large ensemble simulation of an Earth system model, to identify the key ocean ecosystem drivers associated with the most severe impacts on the total biomass of 326 pelagic fish species. We show that low net primary productivity is the most influential driver of extremely low fish biomass over 68% of the ocean area considered by the model, especially in the subtropics and the mid-latitudes, followed by high temperature and low oxygen in the eastern equatorial Pacific and the high latitudes. Severe biomass loss is generally driven by extreme anomalies in at least one ocean ecosystem driver, except in the tropics, where a combination of moderate ocean anomalies is sufficient to drive extreme impacts. Single moderate anomalies never drive extremely low fish biomass. Compound events with either moderate or extreme ocean conditions are a necessary condition for extremely low fish biomass over 78% of the global ocean, and compound events with at least one extreme variable are a necessary condition over 61% of the global ocean. Overall, our model results highlight the crucial role of ex-treme and compound events in driving severe impacts on pelagic marine ecosystems.

How to cite: Le Grix, N., Cheung, W., Reygondeau, G., Zscheischler, J., and Frölicher, T. F.: Extreme and compound ocean events are key drivers of projected low pelagic fish biomass , EGU General Assembly 2024, Vienna, Austria, 14–19 Apr 2024, EGU24-1883, https://doi.org/10.5194/egusphere-egu24-1883, 2024.

EGU24-1925 * | ECS | Posters on site | OS1.10 | Highlight

Drivers of Global Marine Heatwaves in a Warming World 

Ce Bian, Zhao Jing, and Lixin Wu

Global warming has exacerbated occurrence of extreme events, threatening the environment of human living. Marine heatwaves (MHWs) are prolonged extreme warm water events in the ocean, exerting devastating impacts on marine ecosystems. Comprehensive knowledge of physical processes controlling MHW life cycles is pivotal to improving MHW forecast capacity, yet it is still lacking. Here, we use a historical simulation from a global eddy-resolving climate model with an improved representation of MHWs, and innovatively show that heat flux convergence by oceanic mesoscale eddies acts as a dominant driver of MHW life cycles over most parts of the global ocean. In particular, the mesoscale eddies make an important contribution to growth and decay of MHWs, whose characteristic spatial scale is comparable or even larger than that of mesoscale eddies. Moreover, our results proved that features of global MHWs are scale-dependent. The primary drivers of MHWs shift from oceanic advection to atmospheric forcing as their spatial scale becomes larger. There is evident geographic heterogeneity in the transition scale between these oceanic and atmospheric-process dominated regimes. Our study reveals the crucial role of mesoscale eddies in controlling the global MHW life cycles and highlights that using eddy-resolving ocean models is essential for accurate MHW forecasts. Another contribution is we clarified the transition scale of global MHWs, which is essential for parameterization of MHWs forecasting in a warmer future. 

How to cite: Bian, C., Jing, Z., and Wu, L.: Drivers of Global Marine Heatwaves in a Warming World, EGU General Assembly 2024, Vienna, Austria, 14–19 Apr 2024, EGU24-1925, https://doi.org/10.5194/egusphere-egu24-1925, 2024.

Under global warming, the frequency and intensity of marine heatwaves are increasing. However, the inhibition of atmospheric forcing marine heatwaves (AMHW) on upwelling and its impact on marine ecosystems remain poorly understood. To address this issue, the satellite sea surface temperature and reanalysis data during 1998-2021 were analyzed in three distinct upwelling systems, northwestern South China Sea. The results showed that the coastal tide-induced upwelling in the west (W) of Hainan Island is primarily suppressed by enhanced stratification during the AMHW events, since the coastal tide-induced upwelling is insensitive to wind weakening. Contrarily, the wind-driven upwelling in the east (E) and northeast (NE) of Hainan Island are jointly regulated by wind and stratification during the AMHW. Specifically, the AMHW events have a stronger inhibitory effect in the upwelling and phytoplankton growth in the NE than that in the E. The causes could be the followings: (1) the background upwelling in the NE region is stronger than in the E, thus the NE region has a higher susceptibility to the wind weakening; (2) the wind-driven upwelling begins to be suppressed by AMHW when the high-pressure system is aligned with the coastline of the upwelling. In the NE region, the location of the high-pressure center during the occurrence of AMHW is positioned in closer proximity to the upwelling area. Moreover, the inhibitory effect of wind weakening and stratification enhancing on upwelling changes with the development of the AMHW. Before and during the mature phase of AMHW, stratification and wind jointly inhibit upwelling and phytoplankton growth, while it shifts to stratification dominated (>85%) during the decline phase. This study suggests that MHW has a great impact on the upwelling ecosystem, especially the wind-driven upwelling, which should be given high attention under global warming (with increasing MHW events in the future).

How to cite: Liu, S., Lao, Q., and Chen, F.: Impacts of Marine Heatwave Events on Three Distinct Upwelling Systems and its Implication for Marine Ecosystems in the Northern South China Sea, EGU General Assembly 2024, Vienna, Austria, 14–19 Apr 2024, EGU24-1942, https://doi.org/10.5194/egusphere-egu24-1942, 2024.

EGU24-1948 | ECS | Posters on site | OS1.10

Frequent marine heatwaves hidden below the surface of the global ocean 

Di Sun, Furong Li, Zhao Jing, Shijian Hu, and Bohai Zhang

Marine heatwaves are extreme warm water events that can cause devastating impacts on ecosystems and have complex socio-economic ramifcations. Surface signals and drivers of marine heatwaves have been extensively investigated based on satellite observations, whereas their vertical structure in the global ocean remains unclear. In this study, we identify marine heatwave events in the epipelagic zone (0–200 m) using a four-dimensional spatio-temporal framework based on three ocean reanalysis datasets. We find that only about half of the marine heatwave events have continuous surface signals during their life cycles and around one-third always reside in the subsurface ocean without any imprint on sea surface temperature. The annual number of these subsurface marine heatwave events shows a signifcant increase in response to subsurface mean-state warming during the past three decades. Our findings reveal the limitation of identifying marine heatwaves solely based on the sea surface temperature and underscore the necessity of subsurface observations for monitoring marine heatwaves.

How to cite: Sun, D., Li, F., Jing, Z., Hu, S., and Zhang, B.: Frequent marine heatwaves hidden below the surface of the global ocean, EGU General Assembly 2024, Vienna, Austria, 14–19 Apr 2024, EGU24-1948, https://doi.org/10.5194/egusphere-egu24-1948, 2024.

EGU24-2617 | ECS | Orals | OS1.10

Underestimated Arctic warming and potential ecosystem impact due to unresolved marine heatwaves 

Ruijian Gou, Yaocheng Deng, Klara Wolf, Yingzhe Cui, Clara Hoppe, Lixin Wu, Qi Shu, and Gerrit Lohmann

The Arctic is warming faster than any other regions, a phenomenon known as Arctic amplification, which has far-reaching effects for global climate. Modelled historical simulations show a significant underestimation of the amplification and the future projection exhibits non-negligible model spread. Here we show that in a future warming scenario, the warming in the Arctic is generally larger when comparing high-resolution climate models with low-resolution versions. We attribute the different extent of Arctic warming to Arctic marine heatwaves (MHWs), known as episodes of extreme ocean surface warming. The resolution of the MHWs, which are stronger and more realistic in the high-resolution model versions, increases the melting of sea ice and thus the absorption of solar radiation by the ocean in the short term, thereby reinforcing the long-term trend of Arctic warming. We point out that the amplification of Arctic warming is underestimated by the current generation of climate models, which generally have low resolution, thereby underestimating Arctic marine heat waves. In addition, Arctic heatwaves cause extreme temperature fluctuations associated with increased stratification. This poses major challenges to Arctic ecosystems and has a negative impact through direct physiological temperature effects and indirectly through nutrient supply and taxonomic shifts. We conclude that the eddy- and storm-resolving models provide a new perspective on how the Earth system responds to past and future climate and environmental extremes.

How to cite: Gou, R., Deng, Y., Wolf, K., Cui, Y., Hoppe, C., Wu, L., Shu, Q., and Lohmann, G.: Underestimated Arctic warming and potential ecosystem impact due to unresolved marine heatwaves, EGU General Assembly 2024, Vienna, Austria, 14–19 Apr 2024, EGU24-2617, https://doi.org/10.5194/egusphere-egu24-2617, 2024.

EGU24-2720 | ECS | Orals | OS1.10

Significant reduction of potential exposure to extreme marine heatwaves by achieving carbon neutrality 

Seok-Geun Oh, Seok-Woo Son, Sujong Jeong, and Yang-Ki Cho

Marine heatwave (MHW), a prolonged period of anomalously warm seawater, has a catastrophic repercussion on marine ecosystems. With global warming, MHWs have become increasingly frequent, intense, and prolonged. To avoid irreversible damages from such extreme events, net-zero human-caused carbon emissions by 2050s, called carbon neutrality, were proposed. Here, we evaluate the impact of carbon neutrality on MHWs in the late 21st century using multi-model projections from the Coupled Model Intercomparison Project Phase 6 (CMIP6) Shared Socioeconomic Pathway (SSP)1-1.9 and SSP3-7.0 scenarios. It is found that if the current “regional rivalry” over carbon emissions policy continues into this century (i.e., SSP3-7.0), the MHWs in the late 21st century will become stronger over 1°C and longer lasting over 365 days than historical ones, especially in the western boundary current and equatorial current regions. Approximately 68% of the global ocean will be exposed to permanent MHWs, regionally 93% in the Indian Ocean, 76% in the Pacific Ocean, 68% in the Atlantic Ocean, 65% in the Coastal Ocean, and 48% in the Southern Ocean. Such extreme MHWs can be significantly reduced by achieving carbon neutrality (i.e., SSP1-1.9). In particular, the proportion of exposure to permanent MHWs can be reduced to as low as 0.02 to 0.07%, depending on the region. This result underscores the critical importance of ongoing efforts to achieve net-zero carbon emissions to reduce the potential ecological risks induced by extreme MHW exposure.

How to cite: Oh, S.-G., Son, S.-W., Jeong, S., and Cho, Y.-K.: Significant reduction of potential exposure to extreme marine heatwaves by achieving carbon neutrality, EGU General Assembly 2024, Vienna, Austria, 14–19 Apr 2024, EGU24-2720, https://doi.org/10.5194/egusphere-egu24-2720, 2024.

Extreme and persistent marine heatwaves (MHWs) occur frequently in the Northeast Pacific, with huge impacts on climate, ecosystem and socio-economic. This study investigates the atmospheric circulations associated with the 33 MHWs since 1951 in observations. The composite results reveal that the MHWs in the Northeast Pacific can be triggered by a couple of anticyclonic and cyclonic anomalies, i.e., the anticyclonic anomaly to the northeast of the MHW region and cyclonic anomaly to the southwest.  This atmospheric circulation pattern can be detected as the dominant mode through EOF analysis on 500-hPa geopotential height anomalies over the Northeast Pacific-North America region, following the Pacific–North American teleconnection. These observational results are verified by using the outputs of 34 models in the historical simulation from phase 6 of the Coupled Model Intercomparison Project (CMIP6). Further diagnosis of the heat budget is performed, in attempt to illustrate the processes of MHW formation and maintenance.

How to cite: Tang, C. and Lu, R.: The atmospheric circulation anomalies associated with the formation of marine heatwaves in the Northeast Pacific, EGU General Assembly 2024, Vienna, Austria, 14–19 Apr 2024, EGU24-3459, https://doi.org/10.5194/egusphere-egu24-3459, 2024.

EGU24-4034 | ECS | Orals | OS1.10

Projected amplification of summer marine heatwaves in a warming Northeast Pacific Ocean 

Marylou Athanase, Antonio Sánchez-Benítez, Helge Goessling, Felix Pithan, and Thomas Jung

Marine heatwaves are expected to become more frequent, intense, and longer-lasting in a warming world. However, it remains unclear whether feedback processes could amplify or dampen extreme ocean temperatures. Here we impose the observed atmospheric flow in coupled climate simulations to determine how the record-breaking 2019 Northeast Pacific marine heatwave would have unfolded in preindustrial times, and how it could unravel in a +4°C warmer world compared to present-day conditions. We find that air-sea interactions, involving reductions in clouds and ocean mixed-layer depth and air advection from fast-warming subpolar regions, modulate warming rates within the marine heatwave. In a +4°C warmer climate, global oceans are +1.9°C warmer than present levels, and regional mean warming in the Northeast Pacific can reach +2.3–2.7 ± 0.25°C. Our identified feedback processes are projected to further amplify the intensity and spatial extent of analogous Northeast Pacific summer marine heatwaves beyond those thresholds, with a warming reaching +2.9 ± 0.15°C above present levels. Such an event-specific amplification would place even greater stress on marine ecosystems and fisheries.

How to cite: Athanase, M., Sánchez-Benítez, A., Goessling, H., Pithan, F., and Jung, T.: Projected amplification of summer marine heatwaves in a warming Northeast Pacific Ocean, EGU General Assembly 2024, Vienna, Austria, 14–19 Apr 2024, EGU24-4034, https://doi.org/10.5194/egusphere-egu24-4034, 2024.

EGU24-4862 | ECS | Posters on site | OS1.10

Depth-dependent coastal Marine Heatwaves: a case study in Shark Bay, Western Australia 

Yuwei Hu and Chunzai Wang

Marine Heatwaves (MHWs) are commonly defined as extreme warm weather or climate events and typically have large impacts on the local ecosystems and economy. Coastal seas that connect the open ocean and land are highly impacted by local terrestrial weather and climate systems. Distinct geographical features (e.g. water depth and bottom topography) of each coastal sea may locally contribute to the spatiotemporal pattern and associated drivers of coastal MHWs. To unravel this undetermined contribution, we choose the Shark Bay (Western Australia) as a case study domain. It is a semi-enclosed bay adjacent to the warm Leeuwin Current with in-bay water depth varying around 0 to 25m and out-bay depth from 25m down to 200m in the selected study area. Thus, the contribution of air-sea heat flux, advection, and other oceanic processes can be quantitatively evaluated by applying the mixed layer heat budget analysis based on a 0.1-degree model reanalysis dataset, Bluelink ReANalysis (BRAN) 2020. Additionally, three high-resolution satellite sea surface temperature (SST) products are used to identify, visualize, and analyze the spatiotemporal patterns of MHWs in Shark Bay. The spatial maps of MHW mean duration, mean cumulative intensity and event frequency exhibit a highly consistent pattern with large differences between metrics in shallow and deep areas. Mixed layer heat budget analysis within a month before each corresponding peak day of three selected major events, to some extent, confirms that this distinct spatial pattern is partially due to the constrained contribution of the entrainment processes below the mixed layer in shallow areas. The entrainment processes that are closely related to the mixed layer depth change may warm the surface layer during mixed layer shoaling by excluding less warm water below the mixed layer. This is not the case in very shallow regions. Interestingly, slightly different from what was previously assumed, the in-bay areas, instead of being warmed by the horizontal advection when the out-bay areas are warmed by the anomalous warming Leeuwin current, are slightly cooled by a constrained net cooling effect. We found that coastal MHW events in shallow areas are typically frequent but less intense if they occur independently under the typical net cooling effects of horizontal advection. Whereas coastal MHWs in deep areas are less frequent, but more intense and prolonged when concurrent with anomalous warm water advection. The shallowest in-bay areas that are not included in the heat budget analysis are outside the influence area of the net cooling effects. Thus, these areas may be intrinsically embedded with frequently fast warming effects of the net heat flux. By using the 90th percentile definition, these frequent warming are defined as MHWs, but the regularity of historical events may not lead to catastrophic impacts regarding the shorter duration and smaller cumulative intensity of an individual event. We then suggest that a global assessment of the net cooling effects of horizontal advection is necessary, to identify qualified coastal areas associated with higher resistance to sudden and prolonged ocean warming. 

How to cite: Hu, Y. and Wang, C.: Depth-dependent coastal Marine Heatwaves: a case study in Shark Bay, Western Australia, EGU General Assembly 2024, Vienna, Austria, 14–19 Apr 2024, EGU24-4862, https://doi.org/10.5194/egusphere-egu24-4862, 2024.

EGU24-5083 | ECS | Orals | OS1.10

Long-term warming and interannual variability contributions’ to marine heatwaves in the Mediterranean 

Amelie Simon, Carlos Pires, Thomas L. Frölicher, and Ana Russo

In the past 40 years, marine heatwaves (MHWs) have experienced a worldwide increase in duration, intensity, frequency and spatial extent. This trend has been particularly evident in the Mediterranean, where exceptional events were observed during the summers of 2022, 2018 and 2003. This study proposes a twofold analysis of MHWs in the Mediterranean, focusing on their statistical characteristics and physical causes. A satellite dataset is utilized to analyze MHWs via an index, called activity, which aggregates the occurrence, duration, intensity and spatial extent of events. Our results show that the trend toward more active summers for MHWs is strongest in the western Mediterranean basin and long-term warming is the main driver in the whole Mediterranean basin. We also show that in the western and Adriatic Mediterranean region, the increase of SST variability contributes about a third to the MHW activity long-term trend whereas in the central, eastern and Aegean basins, the variability of SST mostly acts to diminish this trend. Through principal component analysis (PCA) of MHW activity, we found that the three most severe summer MHW events in the Mediterranean occur at the same location where the overall trend is highest. Interannual variability increased MHW activity in 2022 around the Balearic Sea, in 2018 in the eastern basins and in 2003 in the central basins. A joint PCA revealed that the long-term trend in MHW activity co-varies with a positive geopotential height anomaly over the Mediterranean, which is consistent with the generation of atmospheric-driven MHWs and which, at the North Atlantic scale, resembles the positive phase of the summer East Atlantic. The additional interannual variability contribution to these three severe summers was associated with western warming and projected onto the positive phase of the summer North Atlantic Oscillation. The increase in MHW over the last 40 years is also associated in the western, central and Adriatic regions with increased downward short-wave radiation and in the eastern Mediterranean with decreased upward long-wave radiation. Increased upward latent heat flux partly compensated for the MHW long-term increase over the whole Mediterranean basin. The interannual variability of MHW activity is related in the western, central and Adriatic basins to increased downward sensible and decreased upward latent heat flux possibly due to warm and humid air intrusion.


A.S., A.R. and C.P. thank Fundação para a Ciência e a Tecnologia (FCT) I.P./MCTES http://doi.org/10.54499/JPIOCEANS/0001/2019 (ROADMAP), T.L.F. thank the Swiss National Science Foundation (Grant P00P2_198897), A.R and C.P thanks the national funds (PIDDAC) – UIDB/50019/2020 (https://doi.org/10.54499/UIDP/50019/2020) and LA/P/0068/2020 (https://doi.org/10.54499/LA/P/0068/2020). A.S. was supported by ANR and France 2030 through the project CLIMArcTIC (grant ANR-22-POCE-0005). A.R. was supported by FCT through https://doi.org/10.54499/2022.01167.CEECIND/CP1722/CT0006.

How to cite: Simon, A., Pires, C., Frölicher, T. L., and Russo, A.: Long-term warming and interannual variability contributions’ to marine heatwaves in the Mediterranean, EGU General Assembly 2024, Vienna, Austria, 14–19 Apr 2024, EGU24-5083, https://doi.org/10.5194/egusphere-egu24-5083, 2024.

EGU24-5286 | ECS | Posters virtual | OS1.10

Marine Heat Waves long-term trend assessment in the Northeast Atlantic region.  

Lluís Castrillo-Acuña, Silvia Martínez-Martínez, and Álvaro de Pascual-Collar

Marine heat waves (MHWs) may be understood as prolonged periods of anomalously high sea surface temperatures (SST). These events are associated to impacts on marine ecosystems such as coral bleaching, mass mortality of marine invertebrates due to heat stress, rapid species’ migrations, fishery closures or quota changes, among others.

The Iberia-Biscay-Ireland (IBI) region, covering from the Canary basin to the Celtic Sea, demonstrated for the year 2022 peak anomaly values of 15 MHWs events, 128 days of mean durations, and 261 total days of MHW according to a reference period from 1982 to 2022 (Castrillo-Acuña et al. 2024). The result of almost 300 days of MHW in some areas for the 2022 suggest that the current methodology may not be complete, as MHW are expected to be an extreme phenomenon. Global assessments such us Oliver et al. (2018) and Schlegel et al. (2019) had demonstrated the correlation between long term mean SST trends and some MHWs properties, but may this influence be strong enough to invalidate the results?

In this study we present a sensitive experiment of the affection of long term mean trends of SST and MHW detection by using different detrending methods. Also considering different refence periods.  It is performed in the IBI domain which covers upwellings, straits, bays, continental shelfs, open waters, etc. The study aims to investigate how the presence of medium to long-term trends may condition the MHW properties in different key oceanographic areas. In this way, we can differentiate regions where the variability of MHW is not conditioned by SST trends from those where it is and its magnitude.


Castrillo-Acuña, L., Alonso-Valle, A., de Pascual-Collar, A.: Characterization of Marine Heat Waves in the IBI Region in 2022. Manuscript submitted to the 8th edition of the Copernicus Ocean State Report (OSR8), Copernicus Publications, State Planet, 2024.


Oliver, E. C. J., Donat, M. G., Burrows, M. T., Moore, P. J., Smale, D. A., Alexander, L. V., Benthuysen, A., Feng, M., Sen Gupta, A., Hobday, A. J., Holbrook, N. J., Perkins-Kirkpatrick, S. E., Scannell, H. A., Straub, S. C., and Wernberg, T.: Longer and more frequent marine heatwaves over the past century. Nature Communications, 9(1), Article 1. https://doi.org/10.1038/s41467-018-03732-9, 2018.


Schlegel, R. W., Oliver, E. C. J., Hobday, A. J., & Smit, A. J. : Detecting Marine Heatwaves With Sub Optimal Data. Frontiers in Marine Science, 6.    https://www.frontiersin.org/articles/10.3389/fmars.2019.00737, 2019.

How to cite: Castrillo-Acuña, L., Martínez-Martínez, S., and de Pascual-Collar, Á.: Marine Heat Waves long-term trend assessment in the Northeast Atlantic region. , EGU General Assembly 2024, Vienna, Austria, 14–19 Apr 2024, EGU24-5286, https://doi.org/10.5194/egusphere-egu24-5286, 2024.

EGU24-5667 | Orals | OS1.10

Marine heatwaves: Can we predict them in the Barents Sea? 

Helene R. Langehaug, Anne Britt Sandø, Robinson Hordoir, Francois Counillon, Ping-Gin Chiu, and Roshin Raj

Marine heatwaves (MHW) can have large negative impacts on life in the ocean, such as kelp forest and corals. These environments are vital for protecting a range of different species in the ocean. With global warming, the occurrence and intensity of MHW are expected to increase, also in the polar regions. The Barents Sea has experienced large climate changes, becoming less influenced by sea ice during the last decades. Being able to predict the likelihood of MHW to occur in the Barents Sea could be highly beneficial to fisheries, aquaculture, and other relevant stakeholders. Such information could be useful in long-term risk assessment. In this study, we assess for the first time the skill of the Norwegian Climate Prediction Model (NorCPM) in predicting the likelihood of MHW. For this analysis, we focus on intense MHW in July 2016 taking place in the Barents Sea, and previously documented by satellite data. We find promising results in the seasonal predictions from NorCPM, where the predictions show increased probability for MHW to occur in July 2016 compared to July 2015 (when the MHW activity was lower than in 2016). The increased probability was already seen six months prior to the event. Furthermore, we downscale the results from the global NorCPM to a more refined grid with a horizontal resolution of 10km. This test case shows that downscaling can provide valuable information on the subsurface signature of MHW. We found the event in July 2016 to be shallow (down to about 50m) compared to another MHW event in July 2013, where warm anomalies occupied the whole water column. These results suggest that the event in July 2016 was atmospheric-driven, consistent with a previous study, whereas the event in 2013 is more likely to be ocean-driven. The results from this case study are promising for future seasonal prediction of MHW using NorCPM, and more in-depth studies are needed to quantify the predictive skill for different cases and different regions.

How to cite: Langehaug, H. R., Sandø, A. B., Hordoir, R., Counillon, F., Chiu, P.-G., and Raj, R.: Marine heatwaves: Can we predict them in the Barents Sea?, EGU General Assembly 2024, Vienna, Austria, 14–19 Apr 2024, EGU24-5667, https://doi.org/10.5194/egusphere-egu24-5667, 2024.

EGU24-5681 | Posters on site | OS1.10

Global surface ocean temperature anomalies in 2023 and their climate context 

Matthew Menary and Leon Hermanson

Around 3 billion people rely on the ocean for their livelihoods, with around 10% of the world’s population directly relying on fishing. As human-driven climate change causes the world to warm, the ocean and the ecosystems within are increasingly susceptible to heatwave events that can have severe consequences. Such marine heatwaves (MHWs) can last from several days to a year and result in the destruction of ocean habitats and the diminution or relocation of fish species, with knock-on effects for coastal communities. The frequency of MHWs has doubled since 1982 and they are likely to continue to increase in frequency, intensity, and duration. However, the link between MHWs and modes of climate variability remains uncertain. Here, we investigate to what extent maps of temperature anomalies in 2023 can be attributed to large-scale climate modes with centres of action in the Atlantic, North Pacific, and tropical Pacific. Specifically, we regress global sea surface temperatures on to indices of Atlantic Multidecadal Variability (AMV), the 2nd EOF of North Pacific variability (commonly linked to MHWs), and El Nino/Southern Oscillation (ENSO, which strongly correlates with the 1st EOF of North Pacific variability). We find that around 30% of the variance in global, annual sea surface temperature anomalies can be explained by a linear combination of these indices. Since 2012, the combination of these indices has been unprecedented, associated with anomalous warming (on top of the global trend) throughout the northern hemisphere. As such, climate variability (which may include a forced component) is currently providing an unusually high baseline for further MHW events. Further work will aim to use decadal prediction models to investigate the predicted evolution of these indices over the coming years.

How to cite: Menary, M. and Hermanson, L.: Global surface ocean temperature anomalies in 2023 and their climate context, EGU General Assembly 2024, Vienna, Austria, 14–19 Apr 2024, EGU24-5681, https://doi.org/10.5194/egusphere-egu24-5681, 2024.

EGU24-6542 | Orals | OS1.10

Large-scale drivers of Northeast Pacific MHWs in a changing climate 

Antonietta Capotondi, Matthew Newman, Tongtong Xu, and Emanuele Di Lorenzo

The Northeast Pacific Ocean has experienced episodes of intense and persistent warm conditions, also known as marine heatwaves, with devastating ecological impacts. Being able to predict these extreme events a few seasons in advance is therefore very important, but has proven elusive in many cases. While the intensity of Northeast Pacific marine heatwaves has been related to local stochastic atmospheric forcing with limited predictability, their evolution and persistence may be controlled by large-scale climate influences. Here we use a multi-variate statistical approach to identify these large-scale drivers, as well as the initial states that optimally develop into a marine heatwave at a later time in this region. Results indicate that a decadal mode of variability related to the Pacific Decadal Oscillation plays a key role in creating conditions favorable to the development of Northeast Pacific marine heatwaves. This mode is also implicated in the development of Central Pacific El Niño events, which may contribute to the persistence of the Northeast Pacific warm anomalies. In addition, this mode of variability appears to be responsible for the increased Northeast Pacific sea surface temperature variance in recent decades, suggesting that changes in internal climate variability may be responsible for the enhanced MHW activity in this region during this recent period.

How to cite: Capotondi, A., Newman, M., Xu, T., and Di Lorenzo, E.: Large-scale drivers of Northeast Pacific MHWs in a changing climate, EGU General Assembly 2024, Vienna, Austria, 14–19 Apr 2024, EGU24-6542, https://doi.org/10.5194/egusphere-egu24-6542, 2024.

EGU24-6880 | Posters on site | OS1.10

Just another Tasman Sea marine heatwave? 

Neil Holbrook

Through late November and early December 2023, a severe category marine heatwave (MHW) was detected moving southwards off the east coast of Tasmania, Australia. The MHW was characterised by offshore sea surface temperature anomalies ~4oC above climatological values embedded within and around large anticyclonic eddies with warm anomalies to >1000m depth. Given the deleterious impacts from previous MHWs on marine ecosystems, fisheries, and aquaculture in the region, serious concerns were raised. To advise and prepare stakeholders, a series of online briefings was given by physical, biogeochemical, fisheries, and social scientists on the current and likely evolving environmental conditions associated with the MHW. So, how unusual was this event? Was it successfully forecast? Was it expected from our knowledge of large-scale modes of climate variability and their teleconnections? This presentation will discuss the characteristics, evolution – both forecast and projected – and emerging impacts of the November-December 2023 Tasman Sea MHW. It will be argued that the characteristics of this event mirror expectations from anthropogenic climate change, and that initialised seasonal SST forecasts were little different from expectations under climate change projections and trend persistence.

How to cite: Holbrook, N.: Just another Tasman Sea marine heatwave?, EGU General Assembly 2024, Vienna, Austria, 14–19 Apr 2024, EGU24-6880, https://doi.org/10.5194/egusphere-egu24-6880, 2024.

EGU24-7402 | ECS | Orals | OS1.10 | Highlight

Future Intensification of Marine Heatwaves in Marine Protected Areas 

Eun Byeol Cho, Eun Young Kwon, and Axel Timmermann

Marine Protected Areas (MPAs) are designated areas aimed at preserving marine ecosystems. However, they encounter the persistent obstacle of increasing ocean temperature. The occurrence of extreme warming events, known as Marine Heatwaves (MHWs), poses a significant threat to the delicate balance of marine ecosystems within MPAs. To understand the future changes in marine heatwaves (MHWs) in these regions, it is crucial to utilize advanced climate modeling capable of accurately capturing regional bathymetric features in MPAs, like coastlines, continental shelves, or islands. In this study, we utilized the SSP585 greenhouse warming simulations conducted with the OpenIFS-FESOM2 coupled model (AWI-CM3, 31 km atmosphere resolution, 4-15 km ocean resolution) to explore future changes in MHWs in the epipelagic to the upper mesopelagic zones (0-500m depth) of the global MPAs. In the current climate, MHWs in the MPAs exhibit greater maximum intensity and higher frequency than the global averages. However, MHWs in MPAs have shorter durations, leading to a lower cumulative intensity. The average warming rate within the MPAs is similar to or slightly lower than the average warming rate of the global ocean. Nevertheless, the MPAs are expected to see a 20% greater increase in the cumulative intensities of MHWs compared to the global ocean, from the past to the future. The findings suggest that marine protected areas (MPAs) are more susceptible to extreme temperature events compared to open ocean zones. Our findings underscore the significance of addressing anthropogenic warming to safeguard MPAs, emphasizing the need for prompt measures to mitigate these impacts and protect these vital marine ecosystems. 

How to cite: Cho, E. B., Kwon, E. Y., and Timmermann, A.: Future Intensification of Marine Heatwaves in Marine Protected Areas, EGU General Assembly 2024, Vienna, Austria, 14–19 Apr 2024, EGU24-7402, https://doi.org/10.5194/egusphere-egu24-7402, 2024.

EGU24-7671 | ECS | Orals | OS1.10

The 2023 marine heatwave in the North Atlantic and the Mediterranean Sea: ocean response to atmospheric circulation 

Lorine Behr, Elena Xoplaki, Niklas Luther, Elina Tragou, Jürg Luterbacher, and Vassilis Zervakis

The year 2023 was characterized by record-breaking global surface air and sea surface temperatures (SSTs), the latter reaching a record 21° C in April (excluding the polar regions; Copernicus 2023). As June to October were the warmest on record globally (WMO 2023), extreme and long-lasting marine heatwave (MHW) events were observed, especially in the North Atlantic and the Mediterranean Sea. In general, the occurrence of MHWs in the subtropics and western boundary current regions is predominantly driven by atmospherically induced processes such as the net ocean heat uptake from the atmosphere, associated with a reduction in latent heat loss and increased shortwave radiation (Schlegel et al. 2021; Vogt et al. 2022). The atmospheric circulation with persistent high‑pressure systems and anomalously weak wind speeds associated with increased insolation is the dominant driver of the above processes. We focus on the state of the atmosphere at the surface and in the mid-troposphere during 2023 and identify specific atmospheric patterns and SST anomaly structures. To detect MHWs and calculate their characteristics we use the daily gridded NOAA OI SST version 2.1 dataset (Huang et al. 2021, updated), derived from the AVHRR satellite, in-situ ship and buoy SST data. For the atmospheric component, we used the mean sea level pressure (SLP), the horizontal wind at 10 m, the geopotential height at 500 hPa (zg500) and the 2 m maximum temperature (Tmax) from the ECMWF ERA5 reanalysis (Hersbach et al. 2020, updated). Atmospheric and ocean datasets are provided globally with a high resolution (0.25°). We use daily anomalies with 1983 to 2012 as the reference period (as recommended by Hobday et al. 2018). The evaluation of MHW metrics such as frequency, duration, mean and cumulative intensity in different subregions of the North Atlantic and Mediterranean revealed that the most frequent MHWs were observed in the western Mediterranean (WMED), the longest MHWs in the central northeast Atlantic and the cumulatively most intense MHWs in the northwest Atlantic and central northeast Atlantic. The most intense MHWs are found in the WMED and off Newfoundland. During summer we detect asynchronous, above normal SLP, zg500 and Tmax over the northwest Atlantic, the WMED and the Black Sea, representing a type of blocking condition. A weakened Azores High, associated with reduced wind speed, mixing and upwelling, allows SSTs to rise substantially in the central northeast Atlantic during summer (Copernicus 2023). The first Empirical Orthogonal Function shows an antiphase dipole of SST and zg500 anomalies (explained variances of 43.9 % and 34.3 %, respectively) between the Mediterranean and West of the British Isles as well as monopol SST and zg500 anomalies (explained variances of 57.7 % and 41.9 %, respectively) over the northwestern Atlantic and the Labrador Sea.

How to cite: Behr, L., Xoplaki, E., Luther, N., Tragou, E., Luterbacher, J., and Zervakis, V.: The 2023 marine heatwave in the North Atlantic and the Mediterranean Sea: ocean response to atmospheric circulation, EGU General Assembly 2024, Vienna, Austria, 14–19 Apr 2024, EGU24-7671, https://doi.org/10.5194/egusphere-egu24-7671, 2024.

EGU24-8423 | ECS | Orals | OS1.10

Mechanism and Forecast Potential of North Pacific Marine Heatwaves inferred from Adjoint Sensitivities 

Xiaoxue Wang, Armin Köhl, and Detlef Stammer

The increasing frequency and intensity of heatwave events have led to a significant rise in heat-related threads on land and in the ocean during recent years. A classic example of a marine heat wave (MHW) is the 2014 – 2016 warm event that spread across the northeastern Pacific (NEP) Ocean—an event that researchers coined “the blob”. Here we use an adjoint sensitivity approach to shed new light on potential causes for reoccurring NEP marine heatwaves events in the region of the NEP. The study is based on the Massachusetts Institute of Technology general circulation model (MITgcm) and its adjoint, for which the mean sea surface temperature (SST) of different target regions (region 1: 145°~ 160°W, 48°~ 56°N; region 2: 130°~ 145°W, 40°~ 48°N) and different target years (e.g. year 2014) was set as objective function. The adjoint sensitivities show that during the year of emergence, air-sea turbulent surface heat flux is the dominant atmospheric driver. The horizontal temperature advection, i.e., the impact of the basin-wide ocean circulation, is found to be less important, but might act as a preconditioning of MHW through climate oscillations (e.g. NPGO). Because atmospheric forcing anomalies occurring within the 18 months prior to the MHW event play a particularly critical role in driving the overall response locally through air-sea interactions, the leading 18 month atmospheric conditions in the central North Pacific can be considered as predictive signals for later marine heatwave events. Based on our preliminary findings, it can be concluded that 2024 may not be a heatwave year for NEP region. 

How to cite: Wang, X., Köhl, A., and Stammer, D.: Mechanism and Forecast Potential of North Pacific Marine Heatwaves inferred from Adjoint Sensitivities, EGU General Assembly 2024, Vienna, Austria, 14–19 Apr 2024, EGU24-8423, https://doi.org/10.5194/egusphere-egu24-8423, 2024.

EGU24-10707 | ECS | Orals | OS1.10

Investigating the role of air-sea heat flux for marine heatwaves in the Mediterranean Sea 

Dimitra Denaxa, Gerasimos Korres, Giulia Bonino, Simona Masina, and Maria Hatzaki

The Mediterranean Sea (MS) has been experiencing progressively intensified Marine heatwave (MHW) conditions over the past decades, associated with severe environmental and socioeconomic impacts. Building upon prior research on physical mechanisms underlying the occurrence of MHWs, here we assess the relative role of air-sea heat exchange in driving the onset and decline phases of surface MHWs in the basin, utilizing remote sensing and reanalysis data for the period 1993-2022. Although contributing positively to the SST evolution during most MHWs, surface heat flux is identified as the primary driver in less than half of the onset/decline MHW phases. This finding suggests that oceanic processes play a crucial role in driving SST anomalies during MHWs in the basin. The role of surface heat flux becomes more pronounced during onset periods and warmer seasons, with the latent heat being the most significant heat flux component in modulating SST anomalies during both MHW phases and across all seasons. Heat flux emerges as the major driver of most onset phases in the Adriatic and the Aegean Seas. Onset/decline phases shorter than 5 days exhibit a weaker heat flux contribution compared to longer phases. Moreover, an inverse relationship between event severity and heat flux contribution is observed. At the subsurface, mixed layer shoaling is observed over the entire duration of most events, particularly for those of shorter duration. Therefore, the surface cooling right after the peak intensity day is likely not associated with vertical mixing in such cases. After the MHW end day, a significant mixed layer deepening in most cases suggests that further dissipation of heat is commonly driven by vertical mixing. This study emphasizes the need for considering subsurface information for MHW studies and accounting for limitations associated with the definitions employed for MHW phases. Clearly articulating such choices, tailored to the specific contexts of individual studies, is vital for precise interpretation and meaningful comparisons across different studies on MHW drivers.

How to cite: Denaxa, D., Korres, G., Bonino, G., Masina, S., and Hatzaki, M.: Investigating the role of air-sea heat flux for marine heatwaves in the Mediterranean Sea, EGU General Assembly 2024, Vienna, Austria, 14–19 Apr 2024, EGU24-10707, https://doi.org/10.5194/egusphere-egu24-10707, 2024.

EGU24-12034 | ECS | Orals | OS1.10 | Highlight

The increased likelihood of plankton community changes following marine heatwaves 

Ryan Deeley, Tobias Grafke, and Ulrike Feudel

When modelling any climatic system, it is important to carefully consider the relation between the many timescales that govern its evolution, since a certain change in their interplay can drastically affect the likelihood of observing critical transitions to distinct environmental regimes. In this study, we present how the onset of marine heatwaves - that are responsible for inducing prolonged periods of positive temperature fluctuations - can weaken state-based resilience leading to noise-induced shifts between species’ concentration levels in plankton communities. This is shown in a modified Truscott-Brindley model, a stochastically forced fast-slow system that encapsulates the interaction between phytoplankton and zooplankton species during red tide events in marine environments. Deterministically, the system can be bistable, possessing stable states with high and low phytoplankton biomass, or in an excitable monostable regime, where phytoplankton blooms form following perturbations. Environmental perturbations to the (temperature-dependent) species’ growth rates are modelled using multiplicative noise terms, namely Ornstein-Uhlenbeck processes with a correlation time parameter τ. During marine heatwaves, the correlation time τ of the external perturbations will increase. With ensemble Monte Carlo simulations of phytoplankton collapses, we demonstrate how mean first-exit times from the domain of attraction scale as the noise intensity weakens, across different prescribed values for the correlation time τ. These results yield numerical approximations for the systems’ quasipotential barrier heights - a concept from Freidlin and Wentzell’s theory of large deviations that quantifies resistance to noise-induced escape from a given domain - which elucidates a non-monotonic relation between the system vulnerability to critical transitions and the correlation time τ of the external perturbations. Indeed, initially there is a notable drop in system resilience as the correlation time τ grows from zero, although as τ increases further beyond a critical value, the system resilience begins to then increase. This non-monotonic relation is also reflected in the action values of most probable transition paths for escaping the domain of attraction, found using an augmented Lagrangian method to overcome the degenerate noise present in the system. These findings are compared and contrasted with results from other studies exploring how climate tipping points, or stochastic escapes from a domain of attraction, depend on the correlation time of the external perturbations. Finally, we consider candidate time-series for correlation times constructed from temperature records for the North Sea across periods including anomalously high values, and discuss whether - subject to these - varying system vulnerability to critical transitions is more sensitive to the rate of emergence or duration of the marine heatwaves.

How to cite: Deeley, R., Grafke, T., and Feudel, U.: The increased likelihood of plankton community changes following marine heatwaves, EGU General Assembly 2024, Vienna, Austria, 14–19 Apr 2024, EGU24-12034, https://doi.org/10.5194/egusphere-egu24-12034, 2024.

EGU24-13423 | Posters on site | OS1.10

Marine heatwaves in the Red Sea: a study of their spatial characteristics, trends and relationships to climate modes 

Manal Hamdeno, Aida Alvera-Azcárate, George Krokos, and Ibrahim Hoteit

Episodes of very warm sea surface temperatures (SST), known as marine heatwaves (MHWs), can potentially alter ocean ecosystems with far-reaching ecological and socio-economic consequences. In this work, we focused on the Red Sea (RS), a region of outstanding socio-economic importance, and investigated its spatio-temporal MHW variability between 1982 and 2021. In addition, the relationship between MHWs and different climate teleconnection patterns was investigated. Our results show that during the study period (1982-2021), the highest frequencies of MHWs were in the southern Red Sea (SRS), while the prolonged and more intense ones were in the northern Red Sea (NRS). By analyzing satellite-derived sea surface temperatures (SST), we identified a warming trend in the RS that began from the mid-1990s, and has intensified since 2016. This temperature increase was accompanied by an increase in the MHW frequency and total days. 78 MHW events with a total of 1016 heat days occurred in the RS between 1982 and 2021, of which 36 events (46%) and 590 days (58%) were recorded in the last decade. In the NRS, the annual MHW frequency was highest in 2010, 2018, 2019 and 2021, while in the SRS it was highest in 1998 and from 2017 to 2021. In cold years, characterized by a negative average SST anomaly, MHWs were mainly found in the NRS. In contrast, in warm years characterized by a positive average SST anomaly, MHWs mainly affected the SRS. However, an exception was observed in 2010, which is considered one of the warmest years in the last four decades. In this year, MHWs were predominantly localized in the NRS, deviating from the typical pattern observed in warm years. The MHW frequency showed a strong positive correlation (> 0.7) with the Atlantic Multidecadal Oscillation (AMO) over the entire RS and a positive correlation (> 0.4) with the Indian Ocean Dipole Index (IOD), which was more pronounced in the SRS, whereas it had a negative correlation (< -0.5) with the East Atlantic/Western Russia (EATL/WRUS) pattern, particularly in the NRS. It was noted that 2010 was also an exceptional year for the climate modes as the AMO and IOD were in strong positive phases, and  the EATL/WRUS was in its highest negative phase, both of which may have contributed to the increased MHWs in that year. This study highlights the link between climate patterns and the occurrence of marine heatwaves in the Red Sea and provides valuable insights into this important aspect of climate change.

How to cite: Hamdeno, M., Alvera-Azcárate, A., Krokos, G., and Hoteit, I.: Marine heatwaves in the Red Sea: a study of their spatial characteristics, trends and relationships to climate modes, EGU General Assembly 2024, Vienna, Austria, 14–19 Apr 2024, EGU24-13423, https://doi.org/10.5194/egusphere-egu24-13423, 2024.

EGU24-14495 | Posters on site | OS1.10

Unraveling the Indian Monsoon's Role in Fueling the Unprecedented 2022 Marine Heatwave in the Western North Pacific 

Qianghua Song, Chunzai Wang, Yulong Yao, and Hanjie Fan

An unprecedented marine heatwave (MHW) event occurred in the middle-high latitude of the western North Pacific in the summer of 2022. We demonstrate that enhanced precipitation thousands of kilometers away fueled this extreme MHW event in July 2022. In the upper atmosphere of the MHW region, a persistent atmospheric blocking system is formed, which reduces convection and cloud cover and increases shortwave radiation at the ocean surface, leading to higher sea surface temperatures. Atmospheric perturbations induced by latent heat release from the extreme precipitation in the Indian summer monsoon region enhance this atmospheric blocking through the propagation of quasi-stationary Rossby waves. Our hypothesis is verified by using a numerical model that is forced with the observed atmospheric anomalous diabatic heating. This study sheds light on how a subtropical extreme event can fuel another middle-high latitude extreme event through an atmospheric bridge.

How to cite: Song, Q., Wang, C., Yao, Y., and Fan, H.: Unraveling the Indian Monsoon's Role in Fueling the Unprecedented 2022 Marine Heatwave in the Western North Pacific, EGU General Assembly 2024, Vienna, Austria, 14–19 Apr 2024, EGU24-14495, https://doi.org/10.5194/egusphere-egu24-14495, 2024.

EGU24-15499 * | ECS | Orals | OS1.10 | Highlight

Modelling marine heatwaves impact on shallow and upper mesophotic tropical coral reefs  

Nicolas Colombi, Chahan M. Kropf, Friedrich A. Burger, David N. Bresch, and Thomas L. Frölicher

Coral reefs ecosystems, often compared to rain forests for their high biodiversity, are threatened by coral bleaching. Coral bleaching occurs when the symbiotic relationship between dinoflagellates and corals breaks under environmental stresses, notably high ocean temperatures. Thermal stress on coral reefs predominantly occurs during marine heatwaves, which can take place synchronously at the surface and subsurface, or asynchronously in either one of the two levels. Subsurface marine heatwaves tend to last longer with potentially higher cumulative intensities compared to their surface counterpart. However, to the best of our knowledge, no global coral bleaching model takes into account the variability between the thermal stress measured at the surface and the one experienced by coral reefs at their specific depth. Here we show that developing a marine heatwave impact model for shallow and upper mesophotic coral reefs, increased coral bleaching modelling accuracy by 4.7 ± 1.3% compared to a model using surface marine heatwaves. To define marine heatwaves at coral reef depth, we used trilinear interpolation using the GLORYS12 reanalysis temperature product. Our model provides coral bleaching values at times and locations where no record was taken, providing a global reconstructed dataset of coral bleaching with daily resolution from January 1st 1993 to December 31st 2020 in 9944 locations. Furthermore, our model indicates that since 1993 over 40% of coral reefs bleached. We anticipate this study to be a starting point for more accurate coral bleaching modelling. Observing that upper mesophotic coral reefs (30-50m) might be more threatened than shallow coral reefs, provides additional evidence to reshape our perception of upper mesophotic coral reefs as potential refugees from climate change.

How to cite: Colombi, N., Kropf, C. M., Burger, F. A., Bresch, D. N., and Frölicher, T. L.: Modelling marine heatwaves impact on shallow and upper mesophotic tropical coral reefs , EGU General Assembly 2024, Vienna, Austria, 14–19 Apr 2024, EGU24-15499, https://doi.org/10.5194/egusphere-egu24-15499, 2024.

EGU24-16606 | ECS | Orals | OS1.10 | Highlight

Vertical structures of global marine heatwaves 

Ying Zhang, Yan Du, Ming Feng, and Alistair J. Hobday

A marine heatwave (MHW) is typically defined as an anomalous warm event in the surface ocean, with wide-ranging impacts on marine and socio-economic systems. The surface warming associated with MHWs can penetrate into the deep ocean; however, the vertical structure of MHWs is poorly known in the global ocean. Here, we identify four main types of MHWs with different vertical structures using Argo profiles: shallow, subsurface-reversed, subsurface-intensified, and deep MHWs. These MHW types are characterized by different spatial distributions with hotspots of subsurface-reversed and subsurface-intensified MHWs at low latitudes and shallow and deep MHWs at middle-high latitudes. These vertical structures are influenced by ocean dynamical processes, including oceanic planetary waves, boundary currents, eddies, and mixing. The area and depth of all types of MHWs exhibit significant increasing trends over the past two decades. These results contribute to a better understanding of the physical drivers and ecological impacts of MHWs in a warming climate. 

How to cite: Zhang, Y., Du, Y., Feng, M., and Hobday, A. J.: Vertical structures of global marine heatwaves, EGU General Assembly 2024, Vienna, Austria, 14–19 Apr 2024, EGU24-16606, https://doi.org/10.5194/egusphere-egu24-16606, 2024.

An extreme event, Marine heatwave, has become a pressing concern in recent years. It is defined as a discrete event where the sea surface temperature remains above a specific threshold value of climatology for several consecutive days, and the intervals between two consecutive abnormal high-temperature events are less than two days. Due to climate change, there is an increasing trend in both the intensity and duration of marine heat waves. Marine heatwaves may not directly affect human society; however, they can pose significant threats to marine ecosystems, coastal communities, and the ocean carbon sink, thereby impacting human well-being. The ocean carbon sink is the most significant carbon sink among the world's three major carbon sinks. It absorbs around 25% of anthropogenic carbon dioxide emissions annually. Dissolved inorganic carbon within the ocean carbon sink relies on the carbon sequestration of biological pumps such as coral, seagrasses, and kelps to store it in the deep water. Influenced by the El Niño-Southern Oscillation and currents, the northeastern Pacific Ocean is a hotspot for marine heatwaves, typically beginning from the North Pacific offshore regions in the spring and impacting the U.S. West Coast in the fall. Consequently, the coastal area of California is selected as the study area and divided into three regions.

Previous studies have shown that the escalating severity of marine heatwaves may result in these biological pumps losing their functions or habitats. However, regarding ocean carbon sequestration, whether the incapacities of these biological pumps due to marine heatwaves will have a short-term impact on the carbon sequestration capacity in the ocean remains to be verified. This study aims to analyze the time series of marine heatwaves and ocean carbon sink capacity with the time series analysis and determine the impacts on ocean carbon sink. We categorize marine heatwave extreme events in California into three indicators and the ocean carbon sequestration capacity into physical and biological indicators. Improved Complete Ensemble Empirical Mode Decomposition with Adaptive Noise (ICEEMDAN) is employed to extract the trends and interannual variations. Meanwhile, to identify the correlations between the marine heatwave and the ocean carbon sink at different time points and different time scales, we apply Time-Dependent Intrinsic Correlation (TDIC). Due to the longer temporal scales in changes in the ocean, the impact of marine heatwaves on the ocean carbon sink may have a potential delay. Therefore, we employ Time-Dependent Intrinsic Cross-Correlation (TDICC), a method based on TDIC that could be utilized to analyze the time-lag effects in the interaction between marine heatwaves and the ocean carbon sink.

How to cite: Fu, C.-H. and Tsai, C. W.: Impact of Marine Heatwaves on Ocean Carbon Sink: A Case Study of Coastal Areas in California, USA, EGU General Assembly 2024, Vienna, Austria, 14–19 Apr 2024, EGU24-16628, https://doi.org/10.5194/egusphere-egu24-16628, 2024.

The oceanographic and climate communities are putting significant effort into reaching a consensus on a common definition for Marine Heatwaves (MHW). The absence of such a unified definition poses a substantial obstacle when it comes to making retrospective comparisons between various MHW studies. This hindrance is critical for achieving a mechanistic understanding of the role of MHWs in marine ecosystems.

However, why is it so challenging to characterize and define MHWs? The answer is straightforward: there isn't a single, distinct dynamical mechanism responsible for the persistence of heat anomalies in the ocean, which we refer to as MHWs. Unlike variability associated with phenomena such as large oceanic eddies, oceanic fronts, upwelling systems, tropical cyclones, or climate modes, prolonged heat anomalies do not exhibit characteristic time or spatial scales. As a result, common MHW definitions group together prolonged temperature anomalies lasting from days to years and spanning from a few kilometers to thousands of kilometers in scale.

Analyzing sea surface temperature anomalies through power spectra reveals a "red" power spectrum with no discernible time scales. A similar analysis in spatial dimensions similarly shows a lack of any specific scale. Given this absence of emergent scales, we suggest adopting a process-based definition for MHWs. Such an approach would classify all events into a smaller number of categories, each linked to a specific driver or dynamical process operating on certain spatiotemporal scales. This shift could significantly reduce the subjectivity involved in selecting the temporal and spatial scales required for current MHW definitions, ultimately advancing our understanding of these events.

How to cite: Liguori, G.: The need to adopt process-based or impact-based definitions for marine heatwaves, EGU General Assembly 2024, Vienna, Austria, 14–19 Apr 2024, EGU24-17696, https://doi.org/10.5194/egusphere-egu24-17696, 2024.

EGU24-18946 | Orals | OS1.10

Towards monitoring subsurface marine heatwaves based on sea surface properties in the Eastern Pacific 

Eike E. Köhn, Matthias Münnich, Meike Vogt, and Nicolas Gruber

As marine heatwaves (MHWs) become a growing concern for marine ecosystems, an effective ecosystem management necessitates precise monitoring of such periods with exceptionally high water temperatures. As satellite-based temperature measurements do not reach beyond the sea surface, identifying subsurface MHWs has so far relied on lower-resolution data obtained from (autonomous) in-situ measurements. In this study, we assess to which extent subsurface MHWs, defined statically by a seasonally varying 90th percentile, can be deduced from surface properties that can be remotely-sensed at a high spatio-temporal resolution. To this end, we build a Random Forest (RF) classification model with daily data from a high-resolution numerical hindcast simulation focused on the Eastern Pacific (1979-2019). The RF is trained to distinguish between extreme and non-extreme temperatures at the depth of the climatologically maximum mixed layer depth (MLD), i.e. a depth that is decoupled from the sea surface throughout most parts of the year. We train the RF on the first 80% of the hindcast simulation data (i.e., 1979-2011) and use a range of predictor variables, such as anomalies of sea surface temperature (SST), height (SSH) and salinity (SSS) as well as derivatives of these physical variables. Testing the model on the last 20% of the hindcast simulation (2012-2019), the RF correctly identifies more than two thirds of all subsurface extreme states, leaving only about 30% of subsurface extremes unidentified. Yet, of all RF-based subsurface extreme classifications, about 40% of subsurface temperatures are false positives. Nevertheless, the RF model outperforms a simple SST based extrapolation of extreme states into the ocean interior. The RF-based classification is mostly guided by SSH and SST anomalies (together reduce impurity by about 50%), followed by climate indices like the Oceanic Niño Index (ONI) and the Pacific Decadal Oscillation (combined impurity reduction by 20%). This simulation-based study emphasizes the potential of exploring remote sensing data, particularly SST and SSH, to extend the monitoring of MHWs beneath the sea surface. Integrating this high-resolution statistical estimate with lower-resolution in-situ hydrographic information has the potential to make subsurface MHW monitoring a feasible and valuable tool for marine ecosystem management.

How to cite: Köhn, E. E., Münnich, M., Vogt, M., and Gruber, N.: Towards monitoring subsurface marine heatwaves based on sea surface properties in the Eastern Pacific, EGU General Assembly 2024, Vienna, Austria, 14–19 Apr 2024, EGU24-18946, https://doi.org/10.5194/egusphere-egu24-18946, 2024.

EGU24-20695 | Orals | OS1.10

Marine Heatwaves in the Chesapeake Bay: Characteristics, Subsurface Structure and Impact on Hypoxia 

Piero Mazzini, Nathan Shunk, Cassia Pianca, and Ryan Walter

Marine Heatwaves (MHWs) are prolonged events of anomalously warm sea water temperature, and have major detrimental effects to marine ecosystems and the world's economy. Thanks to satellite remote sensing of sea surface temperature, significant advances have been made regarding the characterization and impact of MHWs on global scales, however, these data are typically inadequate to resolve most estuarine environments with complex shorelines and reduced spatial scales. In our work we analyzed a novel data set with over three decades of in situ surface and subsurface temperature records to investigate MHWs in the largest estuary in the US: the Chesapeake Bay. Our major findings will be presented in detail, including MHW characteristics in the Bay, their trends, subsurface structure and impact on Bay hypoxia. Projections of trends found in our work suggest that by the end of the century the Chesapeake Bay will reach a semi-permanent MHW state, when extreme temperatures will be present over half of the year, and thus could have devastating impacts to the bay ecosystem and regional economy. Improving our basic understanding of MHWs, their trends and impact on hypoxia in the Chesapeake Bay is necessary to guide management decisions in this valuable environment.

How to cite: Mazzini, P., Shunk, N., Pianca, C., and Walter, R.: Marine Heatwaves in the Chesapeake Bay: Characteristics, Subsurface Structure and Impact on Hypoxia, EGU General Assembly 2024, Vienna, Austria, 14–19 Apr 2024, EGU24-20695, https://doi.org/10.5194/egusphere-egu24-20695, 2024.

EGU24-446 | ECS | Posters on site | OS1.11

Untangling the Multi-model Spread in 21st Century AMOC Projections 

Harry Ashton-Key, Jennifer Mecking, and Sybren Drijfhout

The Atlantic Meridional Overturning Circulation (AMOC) plays an important role in the global climate by transporting heat northward. According to the latest IPCC report (AR6) the strength of the AMOC is very likely to weaken by 2100 (Fox-Kemperer et al. 2021). A weaker AMOC would significantly impact local and global climate. However, there is large model spread in the magnitude of the projected reduction in AMOC strength (Weijer et al. 2020) so it is unclear to what extent the AMOC will weaken by the end of the 21st century.

This study investigates the spread in AMOC response among CMIP6 models. As an initial step we investigated the model correlations of AMOC weakening across different ScenarioMIP experiments. Preliminary results show that the decline for similarly forced scenarios, such as ssp370 and ssp585, have stronger correlations than for scenarios with significantly different forcing, such as ssp126 and ssp585.

Further analyses into the relationship between the projected weakening and model biases in ocean temperature,  salinity and meridional density gradients are performed. In addition, we investigate how the weakening correlates with possible drivers. A better understanding of how model biases influence AMOC changes will allow for more accurate projections of future AMOC changes and their impacts, as well as improved understanding of what the driving processes of the weakening are in various models.

How to cite: Ashton-Key, H., Mecking, J., and Drijfhout, S.: Untangling the Multi-model Spread in 21st Century AMOC Projections, EGU General Assembly 2024, Vienna, Austria, 14–19 Apr 2024, EGU24-446, https://doi.org/10.5194/egusphere-egu24-446, 2024.

EGU24-1969 | ECS | Orals | OS1.11

Crucial role of ocean dynamics for the CMIP models equatorial Pacific warming pattern diversity 

Vincent Danielli, Matthieu Lengaigne, Sadhvi Kwatra, Gopika Suresh, and Jérome Vialard

Coupled Model Intercomparison Project (CMIP) projections indicate a distinct future warming pattern in the tropical Pacific, with enhanced warming in the equatorial Pacific (resembling El Niño warming) and subdued warming in the southeast tropical Pacific. There is currently no consensus on the mechanisms shaping this pattern and its inter-model diversity.

Here, we employ the Sea Surface Temperature (SST) heat budget proposed by Zhang and Li (2014, ZL14), adapted to Relative SST (SST minus its tropical average), a proxy for atmospheric stability and circulation changes. This approach helps uncover the mechanisms that shape the tropical Pacific Multi-Model Mean (MMM) warming pattern and its diversity across historical and unmitigated scenario (RCP85 and SSP585) simulations from 53 CMIP5 and CMIP6 models.

We find that the MMM southeast Pacific relative cooling arises from locally intensified winds, leading to increased latent heat flux cooling. This process also explains the inter-model diversity in this region, alongside the diversity of cloud feedbacks.

Consistent with ZL14 conclusions, our results underscore that the MMM equatorial Pacific relative warming results from a less efficient evaporative cooling feedback over the climatologically cooler central and eastern Pacific. However, our study highlights a pivotal role of ocean dynamics in driving the equatorial Pacific relative warming inter-model diversity. In the eastern Pacific, this diversity is related to the cold tongue bias, with a stronger cold tongue bias leading to a more efficient thermostat mechanism that dampens the MMM relative warming. In the western Pacific, diversity is related to the intensity of the equatorial trade winds relaxation, with stronger westerly anomalies leading to enhanced warming, suggesting a strong role of the Bjerknes feedback.

These results advocate for more comprehensive studies using dynamical approaches to better understand the respective roles of the Bjerknes feedback and cold tongue bias in the equatorial Pacific warming pattern and, ultimately, in the Walker Circulation changes.

How to cite: Danielli, V., Lengaigne, M., Kwatra, S., Suresh, G., and Vialard, J.: Crucial role of ocean dynamics for the CMIP models equatorial Pacific warming pattern diversity, EGU General Assembly 2024, Vienna, Austria, 14–19 Apr 2024, EGU24-1969, https://doi.org/10.5194/egusphere-egu24-1969, 2024.

Examining the wave climate under climate change scenarios requires a concurrent analysis of both historical and predicted future wave data. This involves using historical wave data to understand seasonal fluctuations and long-term trends, while also utilizing future wave data to predict waves under diverse climate change scenarios. This information is pivotal for evaluating forthcoming risks and formulating strategies for climate change adaptation. This study employs historical wind field data, including ERA5 reanalysis data and CWB/WRF analysis field data, as well as wind field data from the CMIP6 dataset under the SSP5-8.5 extremely high emission scenario. These data are used to drive the WAVEWATCH III wave model for simulating waves. This study initially compared the simulated wave data from the WAVEWATCH III wave model with one year of observed wave data from met-ocean buoys. The results confirmed the high credibility of the simulated waves. Subsequently, extensive data simulations are conducted, encompassing historical wave data (1975-2022) and projected wave data for the future (2025-2100).

This study delves into the long-term temporal variations in wave height in Taiwanese waters and the differential regional trends in spatial changes. Regarding temporal changes, the wave heights are averaged year by year, and then linear regression is performed in units of years. The slope of the regression equation indicates the long-term linear trend of wave height in Taiwanese waters over the years, revealing an increasing trend from the past to the future. Regarding spatial changes, the average wave height at each grid point is calculated, and linear regression is applied to determine the long-term trends in wave height at each grid point from the past to the future. The findings unveil a positive growth trend in Taiwanese waters. Furthermore, Taiwanese watersexperience distinct weather patterns in each season, such as the influence of the northeasterly monsoon in winter and typhoons or southwestern winds in summer. This study further explores the differences and variations of wave during spring (March to May), summer (June to August), autumn (September to November), and winter (December to February of the following year). The analysis results indicate negative growth trends in spring and summer, and positive growth trends are observed in autumn and winter, indicating a noticeable increase in wave height in Taiwanese waters during autumn and winter under the influence of climate change.

How to cite: Fan, Y.-M.: Temporal and spatial varieties of future wave climate under the scenario of climate change, EGU General Assembly 2024, Vienna, Austria, 14–19 Apr 2024, EGU24-3018, https://doi.org/10.5194/egusphere-egu24-3018, 2024.

EGU24-3137 | Posters on site | OS1.11

Contrasting future changes in the North Atlantic and Nordic Seas overturning circulations 

Marius Årthun, Helene Asbjørnsen, Leon Chafik, Helen L. Johnson, and Kjetil Våge

The Atlantic meridional overturning circulation (AMOC) carries warm and saline waters northwards near the surface and cold, dense waters southwards at depth. The northward branch of the AMOC terminates north of the Greenland-Scotland Ridge that separates the North Atlantic Ocean from the Nordic Seas and Arctic Ocean. Here, we use large ensemble simulations and CMIP6 models to show that future circulation changes in the subtropical North Atlantic (26.5°N) and in the Nordic Seas show contrasting behavior.

In a high emission scenario (SSP585), CMIP6 models show a gradual weakening of the subtropical AMOC. This weakening can be deconstructed by quantifying changes in the Gulf Stream, Deep Western Boundary Current (DWBC), and gyre recirculation (Asbjørnsen & Årthun 2023). By the end of the century, the Gulf Stream weakens by 29% and the DWBC weakens by 47%. The gyre recirculation component shows a weakening of 12%, indicative of a weakened subtropical gyre. 33% of the Gulf Stream weakening is due to changes in winds.

In contrast to the North Atlantic, the overturning circulation in the Nordic Seas increases throughout most of the 21st century as a result of changes in water mass transformation and horizontal circulation (Årthun et al. 2023). The increased Nordic Seas overturning is furthermore manifested in the overturning circulation in the eastern subpolar North Atlantic (OSNAP-East). A strengthened Nordic Seas overturning circulation could therefore be a stabilizing factor in the future AMOC.


Årthun, M., Asbjørnsen, H., Chafik, L.Johnson, H. L., Våge, K. Future strengthening of the Nordic Seas overturning circulation. Nature Communications, 14, 2065 (2023). https://doi.org/10.1038/s41467-023-37846-6

Asbjørnsen, H., & Årthun, M. (2023). Deconstructing future AMOC decline at 26.5°N. Geophysical Research Letters, 50, e2023GL103515. https://doi.org/10.1029/2023GL103515

How to cite: Årthun, M., Asbjørnsen, H., Chafik, L., Johnson, H. L., and Våge, K.: Contrasting future changes in the North Atlantic and Nordic Seas overturning circulations, EGU General Assembly 2024, Vienna, Austria, 14–19 Apr 2024, EGU24-3137, https://doi.org/10.5194/egusphere-egu24-3137, 2024.

EGU24-3144 | ECS | Orals | OS1.11

Overturning Pathways Control AMOC Weakening in CMIP6 Models 

Jonathan Baker, Michael Bell, Laura Jackson, Richard Renshaw, Geoffrey Vallis, Andrew Watson, and Richard Wood

Future projections indicate the Atlantic Meridional Overturning Circulation (AMOC) will weaken and shoal in response to global warming, but models disagree widely over the amount of weakening. We analyse projected AMOC weakening in 34 CMIP6 climate models, in terms of changes in three return pathways of the AMOC. The branch of the AMOC that returns through diffusive upwelling in the Indo-Pacific, but does not later upwell in the Southern Ocean (SO), is particularly sensitive to warming, in part, because shallowing of the deep flow of the AMOC prevents it from entering the Indo-Pacific via the SO. In most models, this Indo-Pacific pathway declines to zero by 2100. Thus, the present-day strength of this pathway provides a strong constraint on the projected AMOC weakening. However, estimates of this pathway using four observationally based methods imply a wide range of AMOC weakening under the SSP5-8.5 scenario of 29%–61% by 2100. Our results suggest that improved observational constraints on this pathway would substantially reduce uncertainty in 21st century AMOC decline. We also present new findings that compare the AMOC response in realistic warming scenarios with those found under more extreme climate forcings, including quadrupled CO2 concentrations and large North Atlantic freshwater forcing.

How to cite: Baker, J., Bell, M., Jackson, L., Renshaw, R., Vallis, G., Watson, A., and Wood, R.: Overturning Pathways Control AMOC Weakening in CMIP6 Models, EGU General Assembly 2024, Vienna, Austria, 14–19 Apr 2024, EGU24-3144, https://doi.org/10.5194/egusphere-egu24-3144, 2024.

EGU24-3561 | Orals | OS1.11

AMOC thresholds in CMIP6 models: NAHosMIP 

Laura Jackson, Alastrue de Asenjo Eduardo, Bellomo Katinka, Danabasoglu Gokhan, Haak Helmuth, Hu Aixue, Jungclaus Johann, Lee Warren, Meccia Virna, Saenko Oleg, Shao Andrew, and Swingedouw Didier

The Atlantic meridional overturning circulation (AMOC) is an important part of our climate system, which keeps the North Atlantic relatively warm. It is predicted to weaken under climate change. The AMOC may have a threshold beyond which recovery is difficult, hence showing quasi-irreversibility (hysteresis). Although hysteresis has been seen in simple models, it has been difficult to demonstrate in comprehensive global climate models.

We present results from the North Atlantic hosing model intercomparison project, where we applied an idealised forcing of a freshwater flux over the North Atlantic in 8 CMIP6 models to explore this threshold. The AMOC weakens in all models from the freshening, but once the freshening ceases, the AMOC recovers in some models, and in others it stays in a weakened state. We will discuss mechanisms behind the different behaviour in the different models. 


How to cite: Jackson, L., Eduardo, A. D. A., Katinka, B., Gokhan, D., Helmuth, H., Aixue, H., Johann, J., Warren, L., Virna, M., Oleg, S., Andrew, S., and Didier, S.: AMOC thresholds in CMIP6 models: NAHosMIP, EGU General Assembly 2024, Vienna, Austria, 14–19 Apr 2024, EGU24-3561, https://doi.org/10.5194/egusphere-egu24-3561, 2024.

EGU24-4017 | ECS | Orals | OS1.11

The weakening AMOC under extreme climate change 

Gaurav Madan, Ada Gjermunsen, Silje C. Iversen, and Joseph H. LaCasce

Changes in the Atlantic Meridional Overturning Circulation (AMOC) in the quadrupled CO2 experiments conducted underthe sixth Coupled Model Intercomparison Project (CMIP6) are examined. Increased CO2 triggers extensive Arctic warming,causing widespread melting of sea ice. The resulting freshwater spreads southward, first from the Labrador Sea and then theNordic Seas, and proceeds along the eastern coast of North America. The freshwater enters the subpolar gyre north of theseparated Gulf Stream, the North Atlantic Current. This decreases the density gradient across the current and the currentweakens in response, reducing the inflow to the deepwater production regions. The AMOC cell weakens in tandem, firstnear the North Atlantic Current and then spreading to higher and lower latitudes. This contrasts with the common perceptionthat freshwater caps the convection regions, stifling deepwater production; rather, it is the inflow to the subpolar gyre thatis suppressed. Changes in surface temperature have a much weaker effect, and there are no consistent changes in local orremote wind forcing among the models. Thus an increase in freshwater discharge, primarily from the Labrador Sea, is theprecursor to AMOC weakening in these simulations.

How to cite: Madan, G., Gjermunsen, A., Iversen, S. C., and LaCasce, J. H.: The weakening AMOC under extreme climate change, EGU General Assembly 2024, Vienna, Austria, 14–19 Apr 2024, EGU24-4017, https://doi.org/10.5194/egusphere-egu24-4017, 2024.

EGU24-4310 | ECS | Orals | OS1.11

New Arctic quality metrics based on oceanic transports for CMIP6 

Susanna Winkelbauer, Michael Mayer, and Leopold Haimberger

Oceanic transports of heat, volume and salinity are an integral part of the Earth's energy and mass budgets and play a key role in regulating the Earth's climate. Changes in the ocean’s transport patterns may affect regional as well as global climates. Accurate monitoring is critical and there are several regional measuring lines like the RAPID 26N and OSNAP (Overturning in the Subpolar North Atlantic Program) array, as well as measuring lines across Arctic water straits, which are equipped with moorings and other advanced measuring systems. It is desirable to compare the transports calculated by these instruments with ocean reanalyses and climate models. However, this is challenging because the moorings are not aligned with the model grids, and the ocean model grids get complicated especially towards more northern latitudes.

To address this challenge, we introduce StraitFlux (https://pypi.org/project/straitflux/), a versatile tool enabling precise and mass-consistent calculation of volume, heat, and salinity transports across any oceanic section. We have used StraitFlux to calculate transports from reanalyses and climate models (CMIP6) in the Arctic region and to compare them to available observations. While we find some biases, especially in straits that are narrow and bathymetrically complicated, the results generally show that reanalyses capture the main current patterns quite well. Climate models on the other hand exhibit larger and often systematic deviations from the mooring and reanalysis output. The spread among climate models is 3-5 times larger than the spread between observation-based transports and reanalyses or among reanalyses, and it cannot be explained by natural variability. The large spread in flux quantities is related to mean-state biases in relevant state quantities. It helps to quantify and understand the strong connections between lateral OHT and the mean state as well as changes in the Arctic Ocean and sea ice.

Expanding on our methodology, we develop physically based metrics tailored to the Arctic, to detect outliers from the CMIP6 model ensemble and constrain model projections using a weighting approach incorporating the models’ performance and independence. This effectively reduces the spread of future projections of Arctic change. Further, using StraitFlux, we investigate constrained changes in Arctic volume, heat, and salinity transports for the main SSP scenarios. We examine cross-sections of the main Arctic gateways to assess future changes in the structures and strengths of the main currents and their effects on the Arctic system.

How to cite: Winkelbauer, S., Mayer, M., and Haimberger, L.: New Arctic quality metrics based on oceanic transports for CMIP6, EGU General Assembly 2024, Vienna, Austria, 14–19 Apr 2024, EGU24-4310, https://doi.org/10.5194/egusphere-egu24-4310, 2024.

The ability of a coarse-resolution ocean model to simulate the response of the Southern Ocean Meridional Overturning Circulation (MOC) to enhanced westerlies is evaluated as a function of the eddy transfer coefficient (κ), which is commonly used to parameterize the bolus velocities induced by unresolved eddies. The strongest eddy-induced MOC response, accounting for 82% of the reference eddy-resolving simulation, is achieved using a stratification-dependent κ with spatiotemporal variability. By decomposing the eddy-induced velocity into its vertical variation (VV) and spatial structure (SS) components, we find that the intensified eddy compensation response is primarily driven by the enhanced SS term, while the introduced VV term weakens the response. Additionally, the temporal variation of the stratification-dependent κ plays a key role in strengthening the eddy compensation response to intensified westerlies. The stronger eddy compensation response in the experiment with stratification-dependent κ than the constant κ can be attributed to the structure of κ and the vertical variation of the density slope. These findings highlight the significance of accurately representing κ for capturing the response of the Southern Ocean MOC and emphasize the role of the isopycnal slope in modulating the eddy compensation mechanism.

How to cite: Li, Y., Liu, H., Lin, P., Chassignet, E., Yu, Z., and Wu, F.: Quantifying the role of the eddy transfer coefficient in simulating the response of the Southern Ocean Meridional Overturning Circulation to enhanced westerlies in a coarse-resolution model, EGU General Assembly 2024, Vienna, Austria, 14–19 Apr 2024, EGU24-4971, https://doi.org/10.5194/egusphere-egu24-4971, 2024.

EGU24-5263 | ECS | Posters on site | OS1.11 | Highlight

AMOC tipping under Climate Change in the Community Earth System Model 

René van Westen and Henk Dijkstra

Recent quasi-equilibrium simulations with the Community Earth System Model (CESM) have shown that the Atlantic Meridional Overturning Circulation (AMOC) in a pre-industrial climate is a multi-stable system (van Westen & Dijkstra, 2023). By slowly increasing the surface freshwater forcing strength over the North Atlantic Ocean, the AMOC tips from a northward overturning state (strength of 17 Sv) to a fully  collapsed state (strength of 0 Sv). When reversing the freshwater forcing, the AMOC recovers at  smaller values of this forcing compared to the collapse, giving rise to hysteresis behaviour. Here we analyse AMOC tipping under climate change using the same CESM version. From the hysteresis experiment, we branch off simulations under fixed freshwater forcing values to find the statistical steady states. We follow these states under climate change up to 2100 (historical forcing followed by SSP5-8.5) and then run the simulation into equilibrium under constant year 2100 conditions. We find an AMOC tipping event during the 21st century and we compare this event to the one from the pre-industrial quasi-equilibrium simulation. The rate of AMOC changes and the AMOC-related impacts are comparable to the quasi-equilibrium simulation. However, the initial AMOC weakening and the collapsed AMOC state are very different under climate change. Temperature changes primarily drive the initial AMOC weakening and the collapsed state has a very weak (strength of 1 Sv) and shallow (< 1000 m) northward overturning circulation in the Atlantic Ocean. The results indicate that the strong northward overturning statistical steady states disappear under climate change and that only the collapsed AMOC state exists under a high-end emission scenario.

How to cite: van Westen, R. and Dijkstra, H.: AMOC tipping under Climate Change in the Community Earth System Model, EGU General Assembly 2024, Vienna, Austria, 14–19 Apr 2024, EGU24-5263, https://doi.org/10.5194/egusphere-egu24-5263, 2024.

EGU24-6654 | ECS | Orals | OS1.11

Understanding CMIP6 Inter-model Spread of Projected Change in Tropical Sea Surface Salinity 

Shanshan Pang, Jérôme Vialard, Matthieu Lengaigne, and Xidong Wang

Here, we analyze projected tropical sea surface salinity (SSS) changes in 32 Coupled Model Intercomparison Projects phase 6 (CMIP6) global climate models historical simulations and representative concentration pathway 8.5 (SSP5-8.5) scenario. A robust “fresh gets fresher” pattern emerges by the end of the twenty-first century, with fresher tropical Indian and Pacific Oceans and saltier tropical Atlantic Ocean. We examine the inter-model diversity in this pattern using Empirical Orthogonal Function (EOF) analysis. The first two EOFs explain 45% of the total variance. EOF2 (22%) is a modulation of the multi-model mean SSS change, associated with the tropical-average warming intensity (r=0.61). Higher climate sensitivity leads to a more pronounced El Niño-like (positive IOD-like) warming pattern and stronger rainfall in the equatorial and north subtropical Pacific (west Indian) Ocean, leading to local freshening. In the equatorial Atlantic, an enhanced warming leads to more evaporation through the Clausius–Clapeyron relation, and a stronger SSS saltening. The “fresh gets fresher” SSS pattern inter-model diversity is thus more a response to the SST pattern diversity through the “warmer gets wetter” mechanism than an evidence of the “wet gets wetter” intensification of the hydrological cycle. EOF1 (25%) is characterized by saltening in the Indian Ocean and freshening in the Pacific Ocean, associated with changes in the inter-hemispheric relative SST gradient (r=0.55). Enhanced warming in the south hemisphere shifts the precipitation south, reducing total rainfall and saltening the Indian Ocean, while increasing rainfall and freshening the south Pacific Ocean. Overall, we find a strong influence of SST changes on the rainfall distribution, which influences SSS with some effects related to transport by the oceanic circulation.

How to cite: Pang, S., Vialard, J., Lengaigne, M., and Wang, X.: Understanding CMIP6 Inter-model Spread of Projected Change in Tropical Sea Surface Salinity, EGU General Assembly 2024, Vienna, Austria, 14–19 Apr 2024, EGU24-6654, https://doi.org/10.5194/egusphere-egu24-6654, 2024.

EGU24-11017 | Orals | OS1.11

Constraining CMIP6 model ensemble spread to reduce uncertainty in the representation of the Atlantic water layer temperature in the Arctic Ocean 

Marion Devilliers, Steffen M. Olsen, Shuting Yang, Helene R. Langehaug, Tian Tian, Chuncheng Guo, and Rashed Mahmood

We aim at reducing the uncertainties in the climate predictions of the Arctic region which is going under rapid changes with global repercussions. We analyse the spread in the Atlantic water core temperature across multi member CMIP6 historical simulations, focusing on different regions of the Arctic Ocean. While the redistribution of heat plays a critical role in the dynamics of the Arctic Ocean basins, it is usually not well represented in climate models, leading to divergent projections of future changes in the Arctic. To address this limitation, we compare CMIP6 model outputs with available reanalysis and observational products, in order to identify the biases within the model simulations and develop new metrics to constrain the model ensemble spread. Such metrics can be used to select the multi model ensemble members and construct a subsample with improved representation of the core temperature evolution over the historical period resulting in a reduced uncertainty in near-term future projections of the Arctic climate.

How to cite: Devilliers, M., Olsen, S. M., Yang, S., Langehaug, H. R., Tian, T., Guo, C., and Mahmood, R.: Constraining CMIP6 model ensemble spread to reduce uncertainty in the representation of the Atlantic water layer temperature in the Arctic Ocean, EGU General Assembly 2024, Vienna, Austria, 14–19 Apr 2024, EGU24-11017, https://doi.org/10.5194/egusphere-egu24-11017, 2024.

EGU24-11172 | ECS | Posters on site | OS1.11

The thermohaline stream function in a changing climate 

Verena Jung and Kristofer Döös

The thermohaline stream function is a powerful tool to analyse water mass transformation (WMT). Traditionally, the meridional overturning circulation is visualised in geographical coordinates with stream functions as a function of latitude whereby the meridional velocity is zonally integrated. Conversely, in the thermohaline framework the entire global ocean is represented in oceanographic well-established coordinates namely absolute salinity and potential temperature. This allows to analyse WMT between cold and warm as well as saline and fresh waters in one single graph. It is generally constituted of a tropical cell, a conveyor belt and a polar cell. Here, we present stream functions from various CMIP6 climate scenarios computed by the EC-Earth model and compare pre-industrial, present-day and climate scenario simulations to study changes in WMT. We further provide background information on how the thermohaline stream function (left panel of the attached Figure) is motivated physically and computed mathematically using Helmholtz decomposition. This allows us to identify sources and sinks of mass in the corresponding thermohaline tendency potential, as shown in the right panel of the attached Figure. The position in the temperature and salinity space of the overturning cells reveal significant differences in the climate scenarios, as well as  differences in the mass sources and sinks revealed by the tendency potentials. These sources are due to the fresh water fluxes through the sea surface  and for the data assimilation data sets, they are also due to mass, heat and salt sources and sinks withing the ocean subsurface domain.


Fig: The thermohaline stream function (left panel) and tendency potential (right panel) computed using data from the ocean component of an EC-Earth model (present-day simulation coloured in red and blue, SSP585-simulation in grey contour lines). They capture the entire ocean circulation in two figures describing the water mass transformation in temperature and salinity.

How to cite: Jung, V. and Döös, K.: The thermohaline stream function in a changing climate, EGU General Assembly 2024, Vienna, Austria, 14–19 Apr 2024, EGU24-11172, https://doi.org/10.5194/egusphere-egu24-11172, 2024.

EGU24-11529 | ECS | Orals | OS1.11

The impact of Greenland ice sheet melt on the future North Atlantic ocean circulation 

Oliver Mehling, Katinka Bellomo, Federico Fabiano, Marion Devilliers, Jost von Hardenberg, and Susanna Corti

Changes in surface freshwater fluxes are a main factor governing the response of the ocean circulation to future climate change. However, they are not well-represented in the most recent generation of Earth System Models (CMIP6), as most CMIP6 models do not include an interactive ice sheet component. Instead, most of them use a very idealized representation of ice sheets. While this approach may yield the correct order of magnitude for present-day meltwater runoff, it might not accurately extrapolate the increasing ice melt under future global warming.

Here, we address this deficiency by prescribing physically plausible meltwater fluxes from the Greenland ice sheet in a CMIP6 model, EC-Earth3, under a strong global warming scenario (SSP5-8.5) until the 23rd century. The meltwater fields were obtained from a CESM2-CISM simulation in which the Greenland ice sheet was fully coupled. The corresponding meltwater flux reaches about 0.4 Sv by the year 2300, comparable to what is often used in water hosing experiments. Using two EC-Earth ensembles of four members each (with and without Greenland meltwater flux), we compare the impact of this previously underestimated runoff on long-term projections of deep-water formation in the North Atlantic and on the evolution of the Atlantic Meridional Overturning Circulation. Our results allow us to quantify the importance of Greenland meltwater on AMOC weakening under strong global warming.

How to cite: Mehling, O., Bellomo, K., Fabiano, F., Devilliers, M., von Hardenberg, J., and Corti, S.: The impact of Greenland ice sheet melt on the future North Atlantic ocean circulation, EGU General Assembly 2024, Vienna, Austria, 14–19 Apr 2024, EGU24-11529, https://doi.org/10.5194/egusphere-egu24-11529, 2024.

EGU24-789 | ECS | Orals | CR2.3

Spatio-temporal variable drag for the sub-ice-shelf melt parameterisation in NEMO, ocean model 

Dorothée Vallot, Nicolas Jourdain, and Pierre Mathiot
Ice-shelf basal melting in NEMO, as in most ocean models, is parameterised based on a friction velocity calculated from a drag coefficient that is constant in space and time, usually tuned to approach observed melt. But the drag between the ice and the ocean should depend on the roughness at different scale. This means that roughness evolution in space and time is not taken into account in today's model. In recent decades, some ice shelves, particularly in the Amundsen Sea Embayement (ASE), have experienced an increase of their damage, associated with more surface and basal crevasses so their sub-shelf environment is rougher. There is good chances that this phenomenon is to happen more in the future and in an extended number of ice shelves. Here we present a study using a spatially variable coefficient of drag, which depends on the topography and is applied on the first wet cell height. We use the ice shelf parameterisation of NEMO4.2 on a configuration of ASE at 12th of a degree.

How to cite: Vallot, D., Jourdain, N., and Mathiot, P.: Spatio-temporal variable drag for the sub-ice-shelf melt parameterisation in NEMO, ocean model, EGU General Assembly 2024, Vienna, Austria, 14–19 Apr 2024, EGU24-789, https://doi.org/10.5194/egusphere-egu24-789, 2024.

EGU24-797 | ECS | Orals | CR2.3

Annual Terminus Prediction Errors for Greenland Glaciers from Calving Laws and Melt Parameterizations 

Benjamin Reynolds, Sophie Nowicki, Kristin Poinar, and Sophie Goliber

Many calving laws have been proposed leading to a need to characterize the ability of these laws to predict terminus movement across years. The influence of terminus change on glacier discharge makes this an important source of uncertainty for multi-decadal sea level rise prediction from ice sheet models. Here, we develop a workflow to tune calving laws and then calculate error in predicted terminus positions based on Greenland Ice Sheet Mapping Project (GrIMP) surface velocity data sets compiled from Sentinel, Landsat, TerraSAR-X, TanDEM-X, and COSMO-SkyMed satellites as well as digital elevation models (DEMs) from ASTER mission and ArcticDEM data.  Greenland glaciers with available data are used to test the height above flotation, fraction above flotation, crevasse depth criterion, von Mises criterion, and surface stress maximum calving laws over a multi-year period. Several versions of the crevasse depth law based on stress input are tested providing insight into the law’s dependence on stress calculation. This dependence is important as the crevasse depth law has been recommended by calving law comparison but has been implemented with various stress calculations to work with three-dimensional stress fields. The terminus melt parameterization used in the Ice Sheet Model Intercomparison Project for CMIP6 standard experiments is included as reference to show the degree to which calving laws are needed to accurately model retreat for future model intercomparison efforts. While testing calving laws independent of an ice sheet model will not provide insight into all the challenges of calving implementation for ice-sheet-wide studies, this remote-sensing based workflow can rapidly test calving laws’ terminus prediction errors. With the availability of monthly-averaged velocity data sets and frequent instantaneous DEMs, this method will allow for analysis of calving law success on many regimes of multi-year glacier movement.  

How to cite: Reynolds, B., Nowicki, S., Poinar, K., and Goliber, S.: Annual Terminus Prediction Errors for Greenland Glaciers from Calving Laws and Melt Parameterizations, EGU General Assembly 2024, Vienna, Austria, 14–19 Apr 2024, EGU24-797, https://doi.org/10.5194/egusphere-egu24-797, 2024.

EGU24-1569 | ECS | Posters on site | CR2.3

A framework for observing and modelling ice-ocean interactions building on a community workshop organised by the Joint Commission on Ice-Ocean Interactions 

Isabel Nias, Felicity McCormack, Sue Cook, Susheel Adusumilli, Lu An, Daniel Goldberg, Tore Hattermann, Yoshihiro Nakayama, Hélène Seroussi, and Donald Slater

Mass loss from the Antarctic and Greenland Ice Sheets could lead to a rise in global mean sea level of 0.25 m by 2100 and several metres by 2300 if greenhouse gas emissions remain unmitigated. Uncertainties in these estimates are strongly related to ocean-driven ice melt, which can lead to grounding line retreat, thinning and acceleration of the fast-flowing regions of both Antarctica and Greenland. The processes of ocean-driven ice melt on large spatial and temporal scales are imperfectly known, and measurements are sparse, impacting the accuracy of ice sheet and ocean model projection studies. The Joint Commission on Ice-Ocean Interactions (JCIOI) hosted the first community workshop in October 2022 with the aims to: (1) identify critical knowledge gaps surrounding processes that govern ocean-driven melt of ice sheets across a range of spatio-temporal scales; and (2) identify options to address the knowledge gaps through observing, parameterising, and modelling ice-ocean interactions, and their impacts on ice mass loss and ocean dynamics. Community discussions from the workshop highlighted the need for concurrent and sustained measurements of ice, ocean and atmosphere properties at the ice sheet-ocean interface, and making best use of existing observations to improve models, capture observed changes, better understand physical mechanisms and improve future projections. Building on the workshop outputs, we propose to develop a framework for ice-ocean observations that details the essential measurements that need to be collected, and the temporal and spatial scales on which to measure. This framework will require widespread community engagement on key scientific questions, agreement and coordination, including protocols for data collection, processing, and sharing.

How to cite: Nias, I., McCormack, F., Cook, S., Adusumilli, S., An, L., Goldberg, D., Hattermann, T., Nakayama, Y., Seroussi, H., and Slater, D.: A framework for observing and modelling ice-ocean interactions building on a community workshop organised by the Joint Commission on Ice-Ocean Interactions, EGU General Assembly 2024, Vienna, Austria, 14–19 Apr 2024, EGU24-1569, https://doi.org/10.5194/egusphere-egu24-1569, 2024.

EGU24-3027 | Orals | CR2.3

Strong ice-ocean interaction drives and enhances calving of Antarctic ice shelves 

Yan Liu, Xiao Cheng, Jiping Liu, John Moore, Xichen Li, and Sue Cook

Since 2015, there has been a significant increase in iceberg calving rates from Antarctic ice shelves. It is crucial to comprehend the climate-related reasons for this enhanced iceberg calving to improve coupled simulations with the ice sheet and predict their future effects on sea-level rise. Based on continuous observations of iceberg calving around Antarctica over 15 years, we demonstrate that sea ice extent is the primary control on iceberg calving rates in Antarctica, regardless of ice shelf size, location, or ocean regime. The recent increase in calving rates coincides precisely with a significant reduction in sea ice area in most sectors around the continent. We propose a calving model, where iceberg calving is dominated by ocean-wave induced flexure and basal shear and enhanced by ice-shelf basal melt. We also find links between iceberg calving rate and El Niño/Southern Oscillation (ENSO), which are particularly strong in East Antarctica. Given that further decreases in sea ice extent and increases in extreme ENSO events are predicted in future, we raise concern that previously stable East Antarctic ice shelves may soon begin to retreat, with potential to trigger significant mass loss from this massive ice sheet.

How to cite: Liu, Y., Cheng, X., Liu, J., Moore, J., Li, X., and Cook, S.: Strong ice-ocean interaction drives and enhances calving of Antarctic ice shelves, EGU General Assembly 2024, Vienna, Austria, 14–19 Apr 2024, EGU24-3027, https://doi.org/10.5194/egusphere-egu24-3027, 2024.

EGU24-3138 | ECS | Posters on site | CR2.3

Variability of calving and ice flow during a two-week period using terrestrial radar interferometry 

Armin Dachauer, Andrea Kneib-Walter, and Andreas Vieli

Frontal ablation at tidewater outlet glaciers is responsible for a major part of mass loss of the Greenland Ice Sheet. This underscores the need to understand the underlying processes, such as calving and ice flow, with regard to global sea level rise. In this study we explore the temporal and spatial variability of calving activity and ice flow at the major tidewater outlet glacier Eqalorutsit Kangilliit Sermiat (also referred to as Qajuuttap Sermia) in South Greenland and thereby try to get insights into the forcing and relationships between these two processes. This requires high-resolution data which we achieve by using a terrestrial radar interferometer. The instrument provides a temporal resolution of 1 minute and a spatial resolution of a few meters and was running continuously for a two-week field period in August 2023. The data shows considerable spatial and temporal variability of both calving activity and ice flow. Parts of the flow variability can be attributed to a diurnal cycle that is forced by surface melt, whereas enhanced calving activity seems to be tightly linked to locations of major subglacial discharge plumes.

How to cite: Dachauer, A., Kneib-Walter, A., and Vieli, A.: Variability of calving and ice flow during a two-week period using terrestrial radar interferometry, EGU General Assembly 2024, Vienna, Austria, 14–19 Apr 2024, EGU24-3138, https://doi.org/10.5194/egusphere-egu24-3138, 2024.

EGU24-3442 | Orals | CR2.3

Tidewater Glaciers and Ice Shelves as Self-Organising Systems 

Douglas Benn, Jan Åström, Iain Wheel, Adrian Luckman, and Faezeh Nick

Marine-terminating glaciers and ice shelves are notoriously complex, with a wide range of ice-dynamic and calving processes occuring in response to oceanographic, atmospheric and glaciological influences. Within this complexity, however, we can recognise order on at least two scales. First, marine ice fronts typically form vertical cliffs, reflecting competition between oversteepening (ice flow and melt-undercutting) and failure. Calving magnitude-frequency distributions have power-law form with an exponent of -1.2, characteristic of self-organising criticality (SOC). Such systems have a critical point as an attractor, such that the system converges on the failure threshold.

The second scale is that of the whole ice tongue. Tidewater glaciers and ice shelves typically oscillate around stable positions for multiple years, punctuated by transitions to new quasi-stable positions. Stability is encouraged by pinning points which function as attractors at thresholds between stable and metastable states. Ice tongues may exist in metastable states for variable amounts of time, from days to decades. Factors encouraging rapid relaxation to the threshold include large stress gradients and rapid basal melt, and factors encouraging long relaxation times include low stress gradients, low melt rates, and buttressing from mélange or sea ice. Calving magnitude-frequency distributions have exponential form, reflecting the stochastic nature of calving in the metastable zone.

Both scales of self-organisation emerge spontaneously from physically-based calving models such as the Helsinki Discrete Element Model (HiDEM) and the crevasse-depth (CD) calving law implemented in Elmer/Ice. Purely deterministic models, however, are not optimal for long-term simulations, especially in Antarctic contexts. We present results of preliminary simulations using a stochastic CD calving law, which opens up the possibility of a universal calving model applicable to both the Greenland and Antarctic ice sheets.

How to cite: Benn, D., Åström, J., Wheel, I., Luckman, A., and Nick, F.: Tidewater Glaciers and Ice Shelves as Self-Organising Systems, EGU General Assembly 2024, Vienna, Austria, 14–19 Apr 2024, EGU24-3442, https://doi.org/10.5194/egusphere-egu24-3442, 2024.

EGU24-3542 | ECS | Orals | CR2.3

Ice base slope effects on the turbulent ice shelf-ocean boundary current 

Josephine Anselin, Paul Holland, John Taylor, and Adrian Jenkins

The majority of Antarctica’s contribution to sea level rise can be attributed to changes in ocean-driven melting at the base of ice shelves. Turbulent ocean currents and melting are strongest where the ice base is steeply sloped, but few studies have systematically examined this effect. Here we use 3-D, turbulence-permitting large-eddy simulations (LES) of an idealised ice shelf-ocean boundary current to examine how variations in ice base slope influence ocean mixing and ice melting. The range of simulated slope angles is appropriate to the grounding zone of small Antarctic ice shelves and to the flanks of relatively wide ice base channels, with far-field ocean conditions representative of warm-water ice shelf cavities. Within this parameter space, we derive formulations for the friction velocity, thermal forcing, and melt rate in terms of total melt-induced buoyancy input and ice base slope. This theory predicts that melt rate varies like the square root of slope, which is consistent with the LES results and differs from a previously proposed linear trend. With the caveat that further simulations with an expanded range of basal slope angles and ocean conditions would be necessary to evaluate the validity of our conclusions across the full Antarctic ice base slope parameter space, the derived scalings provide a potential framework for incorporating slope-dependence into parameterisations of mixing and melting at the base of ice shelves.

How to cite: Anselin, J., Holland, P., Taylor, J., and Jenkins, A.: Ice base slope effects on the turbulent ice shelf-ocean boundary current, EGU General Assembly 2024, Vienna, Austria, 14–19 Apr 2024, EGU24-3542, https://doi.org/10.5194/egusphere-egu24-3542, 2024.

EGU24-5087 | ECS | Orals | CR2.3

The integrated ice sheet response to stochastic iceberg calving 

Aminat Ambelorun and Alexander Robel

Iceberg calving is one of the dominant sources of ice loss from the Antarctic and Greenland Ice sheets. Iceberg calving is still one of the most poorly understood aspects of ice sheet dynamics due to its variability at a wide range of spatial and temporal scales. Despite this variability, current large-scale ice sheet models assume that calving can be represented as a deterministic flux. Failure to parameterize calving accurately in predictive models could lead to large errors in warming-induced sea-level rise. In this study, we introduce stochastic calving within a one-dimensional depth-integrated tidewater glacier and ice shelf models to determine how changes in the calving style and size distribution of calving events cause changes in glacier state. We apply stochastic variability in the calving rate by drawing the calving rate from two different probability distributions.e also quantify the time scale on which individual calving events need to be resolved within a stochastic calving model to accurately simulate the probabilistic distribution of glacier state. We find that incorporating stochastic calving with a glacier model with or without buttressing ice shelves changes the simulated mean glacier state, due to nonlinearities in glacier terminus dynamics. This has important implications for the intrinsic biases in current ice sheet models, none of which include stochastic processes. Additionally, changes in calving frequency, without changes in total calving flux, lead to substantial changes in the distribution of glacier state. This new approach to modeling calving provides a framework for ongoing work to implement stochastic calving capabilities in large-scale ice sheet models, which should improve our capability to make well-constrained predictions of future ice sheet change.

How to cite: Ambelorun, A. and Robel, A.: The integrated ice sheet response to stochastic iceberg calving, EGU General Assembly 2024, Vienna, Austria, 14–19 Apr 2024, EGU24-5087, https://doi.org/10.5194/egusphere-egu24-5087, 2024.

EGU24-5666 | ECS | Orals | CR2.3

Circulation, mixing and heat transport in a Greenland fjord 

Anneke Vries, Lorenz Meire, John Mortensen, Kirstin Schulz, Willem Jan van de Berg, and Michiel van den Broeke

Greenland's glacial fjords transport heat and freshwater between the shelf and the outlet glaciers of the Greenland Ice Sheet. Therefore they are crucial to understand ice-ocean interaction in the Norhern Hemisphere. Despite increasing attention from the research community, much of the seasonal variability of fjord circulation remains unknown, especially in the non-summer months. This study presents current velocity and water mass data for a full year in Nuup Kangerlua. We provide insights into the dynamics of this South West Greenland fjord, focusing on winter and the upper layer currents. We show that in winter fjord circulation remains active, including a large cross fjord component that has not been observed before. There is a disconnect between the mouth and the inner part of the fjord, causing heat to be stored in the inner fjord. The stored heat could potentially act as reservoir of melt energy for glaciers in winter.

How to cite: Vries, A., Meire, L., Mortensen, J., Schulz, K., van de Berg, W. J., and van den Broeke, M.: Circulation, mixing and heat transport in a Greenland fjord, EGU General Assembly 2024, Vienna, Austria, 14–19 Apr 2024, EGU24-5666, https://doi.org/10.5194/egusphere-egu24-5666, 2024.

EGU24-5804 | ECS | Orals | CR2.3

Sub-shelf melt patterns… does detail matter? 

Franka Jesse, Erwin Lambert, and Roderik van de Wal

Observations show that some of the ice shelves surrounding Antarctica are thinning, driven by warming of the underlying ocean. These ice shelves play an important role in moderating the rate of mass loss from the ice sheet by buttressing the ice flow from the grounded parts of the ice sheet. The increased ocean-induced sub-shelf melt is therefore an important process for the stability of the ice sheet and representing it in ice sheet models is essential to study the evolution of the Antarctic Ice Sheet. Here, we present a coupled ice-ocean setup, applied to an idealised ice shelf.

The sub-shelf melting occurs in highly heterogeneous patterns, typically exhibiting higher melt rates near the grounding line. Currently, most ice sheet models rely on parameterisations which derive sub-shelf melt rates from far-field ocean hydrography. Despite their computational advantage and ease in handling grounding line migration, these parameterisations fall short of accurately representing the right details in the melt patterns. To capture more physically consistent melt patterns, we implemented an online coupling between the ice sheet model IMAU-ICE and the sub-shelf melt model LADDIE. The latter resolves the necessary physics governing the melt, including the Coriolis deflection and topographic steering of meltwater, and provides sub-shelf melt fields at sub-kilometre spatial resolution.

We will show the impact of detailed sub-shelf melt fields in an idealised set-up. We compare IMAU-ICE simulations using existing sub-shelf melt parameterisations with simulations in the coupled set-up with IMAU-ICE and LADDIE. Three parameterisations are considered for this comparison: the quadratic scaling with temperature, the box model PICO, and the plume model. All simulations are performed in the idealised MISMIP+ domain. We consider a range of oceanic temperature forcings similar to present-day temperatures in warmer and colder basins surrounding Antarctica. We present and discuss the results, primarily focusing on the evolution of three key indicators for ice sheet stability: grounding line position, ice shelf extent, and grounding zone shape. These results demonstrate the importance of accounting for realistic melt patterns in ice sheet models.

How to cite: Jesse, F., Lambert, E., and van de Wal, R.: Sub-shelf melt patterns… does detail matter?, EGU General Assembly 2024, Vienna, Austria, 14–19 Apr 2024, EGU24-5804, https://doi.org/10.5194/egusphere-egu24-5804, 2024.

EGU24-6423 | ECS | Orals | CR2.3

Re-evaluating Rapid Glacier Retreats: Hektoria Glacier’s Unprecedented Tidewater Collapse 

Naomi E. Ochwat, Ted A. Scambos, Robert S. Anderson, Catherine C. Walker, and Bailey L. Fluegel

Hektoria Glacier on the Eastern Antarctic Peninsula underwent a heretofore unseen rate of tidewater-style glacier retreat from 2022 to 2023 after the loss of decade-old fast ice in the Larsen B embayment. The glacier has retreated 25 km between February 2022 and January 2024, of which at least 8-13 km was grounded ice. Remote sensing data in the months following the fast ice break-out reveals an ice flow speed increase of up to 4-fold, and rapid elevation loss up to 20-30 m, representing an 8-fold increase in the glacier thinning rate. Hektoria and Green Glaciers underwent three phases of retreat displaying differing calving styles. During the first two months after the loss of the fast ice in January 2022 the Hektoria-Green ice tongue calved large tabular bergs. In March 2022, an abrupt change in Hektoria’s calving style was observed, changing from large tabular icebergs to buoyantly rotated smaller bergs. Following this transition, Hektoria underwent several short periods of rapid retreat. In December 2022, 2.5 km of grounded ice were lost over 2.5 days. These retreat rates for grounded tidewater ice are greater than any reported in the modern glaciological record. Here we examine the evidence for locating the pre-fast ice break-out grounding zone as well as the drivers that could cause such a rapid retreat. We link these observations to known causes of glacier instability, such as Marine Ice Sheet Instability and Marine Ice Cliff Instability, as well as the classical tidewater glacier retreat cycle.

How to cite: Ochwat, N. E., Scambos, T. A., Anderson, R. S., Walker, C. C., and Fluegel, B. L.: Re-evaluating Rapid Glacier Retreats: Hektoria Glacier’s Unprecedented Tidewater Collapse, EGU General Assembly 2024, Vienna, Austria, 14–19 Apr 2024, EGU24-6423, https://doi.org/10.5194/egusphere-egu24-6423, 2024.

EGU24-6639 | ECS | Orals | CR2.3

Multi-decadal evolution of Crary Ice Rise region, West Antarctica, amidst modern ice stream deceleration 

Hannah Verboncoeur, Matthew Siegfried, J. Paul Winberry, Nicholas Holschuh, Duncan Byrne, Wilson Sauthoff, Tyler Sutterley, and Brooke Medley

The ongoing deceleration of Whillans Ice Stream, West Antarctica, provides an opportunity to investigate the role of grounded ice flux in downstream pinning point evolution on decadal time scales. Here, we construct and analyze a 20-year, multi-mission satellite altimetry record of dynamic ice surface-elevation change (dh/dt) in the grounded region between lower Whillans Ice Stream and Crary Ice Rise, a major Ross Ice Shelf pinning point. We developed a new method for generating multi-mission time series that reduces spatial bias and implemented this method with altimetry data from the Ice, Cloud, and land Elevation Satellite (ICESat; 2003–09), CryoSat-2 (2010–present), and ICESat-2 (2018–present) altimetry missions. We then used the 20-year dh/dt time series to identify persistent patterns of surface elevation change and to evaluate regional mass balance. Our results suggest that changes in ice flux associated with Whillans Ice Stream stagnation drive non-linear mass change responses isolated to the Crary Ice Rise region, producing persistent, spatially heterogeneous thickness changes. The resulting mass redistribution modifies the grounding zone and mass balance of the Crary Ice Rise region, in turn adjusting the buttressing regime of the southern Ross Ice Shelf embayment.

How to cite: Verboncoeur, H., Siegfried, M., Winberry, J. P., Holschuh, N., Byrne, D., Sauthoff, W., Sutterley, T., and Medley, B.: Multi-decadal evolution of Crary Ice Rise region, West Antarctica, amidst modern ice stream deceleration, EGU General Assembly 2024, Vienna, Austria, 14–19 Apr 2024, EGU24-6639, https://doi.org/10.5194/egusphere-egu24-6639, 2024.

EGU24-6749 | ECS | Orals | CR2.3

Two Decades of Satellite Observations: Sensible-Heat Polynya Variability at Pine Island Glacier, West Antarctica 

Elena Savidge, Tasha Snow, and Matthew R. Siegfried

Thermodynamically maintained open ocean areas surrounded by sea ice, or sensible-heat polynyas, are linked to key ice-sheet processes, such as ice-shelf basal melt and ice-shelf fracture, when they occur near ice-shelf fronts. However, the lack of detailed multi-year records of polynya variability pose a barrier to assessing the potential interconnectivity between polynya and frontal dynamics. Here, we present the first multi-decadal record (2000–2022) of polynya area at Pine Island Glacier (PIG) from thermal and optical satellite imagery. We found that although polynya area was highly variable, there were consistencies in the timing of polynya maximal extent, and opening and closing. Furthermore, we found that the largest polynya (269 km2) in our record occurred at PIG’s western margin just 68 days before iceberg B-27 calved, suggesting that polynya size and position may influence rifting dynamics. We suspect that large sensible-heat polynyas have the potential to reduce both ice-shelf buttressing (via reduced landfast ice) and shear margin dynamics (via reduced contact with slower marginal ice), which may lead to structural instability and eventually contribute to calving. Our new dataset provides a pathway to assess coevolving polynya and frontal dynamics, demonstrating the importance of building long-term records of polynya variability across the continent.

How to cite: Savidge, E., Snow, T., and Siegfried, M. R.: Two Decades of Satellite Observations: Sensible-Heat Polynya Variability at Pine Island Glacier, West Antarctica, EGU General Assembly 2024, Vienna, Austria, 14–19 Apr 2024, EGU24-6749, https://doi.org/10.5194/egusphere-egu24-6749, 2024.

EGU24-7829 | ECS | Orals | CR2.3

High fidelity modelling of iceberg capsize 

Nicolas De Pinho Dias, Alban Leroyer, Anne Mangeney, Olivier Castelnau, and Jean-Baptiste Thiebot

One of the major questions in climate science is to improve the accuracy of sea-level rise prediction, for which mass loss of the polar ice caps has a significant contribution. In this work, the focus is on buoyancy-dominated capsize of large icebergs. The capsizes generate specific seismic signals, which in turn can be analysed and used as a unique tool to study the long term evolution of such large icebergs capsize and the glacier response.

To better quantify ice mass loss due to iceberg calving at marine terminating glaciers, coupling iceberg calving simulation and inversion of the seismic waves generated by these events and recorded at teleseismic distances is necessary. To achieve our task, a complex fluid/structure model of the iceberg capsize is required to obtain accurate forces history acting on the glacier terminus. The simulated forces can then be compared to the force inverted from the seismic signal. Therefore, based on our recent work, we implement a Computation Fluid Dynamics (CFD) approach to reach a high fidelity modelling of the iceberg capsize. First work using the experimental data of an iceberg capsize showed the need and ability of CFD computations to precisely reproduce the iceberg kinematics for different cases. We will present more advanced CFD configurations, including the contact between the capsizing iceberg and a rigid glacier front. Computation results are compared and validated against lab scale experiments, where we outline that some 3D effects cannot be neglected. We will also present full scale capsize simulations, in which the mixing of ocean layers occurs. In particular, we will quantify the transport of particles within the ocean to illustrate the potential change of nutriments distribution or of pressure experienced by local fauna due to iceberg calving.

How to cite: De Pinho Dias, N., Leroyer, A., Mangeney, A., Castelnau, O., and Thiebot, J.-B.: High fidelity modelling of iceberg capsize, EGU General Assembly 2024, Vienna, Austria, 14–19 Apr 2024, EGU24-7829, https://doi.org/10.5194/egusphere-egu24-7829, 2024.

EGU24-8352 | ECS | Orals | CR2.3

A reassessment of the role of atmospheric and oceanic forcing on ice dynamics at Jakobshavn Isbræ, Ilulissat Icefjord 

Hannah Picton, Peter Nienow, Donald Slater, and Thomas Chudley

Jakobshavn Isbræ (Sermeq Kujalleq) has been the largest single contributor to mass loss from the Greenland Ice Sheet over recent decades. Previous work has emphasised the dominant role of oceanic forcing on ice dynamics, with the short-lived (2016-2018) advance, deceleration and thickening of Jakobshavn attributed to decreased ocean temperatures within Disko Bay. Here, we use satellite imagery to extend observations of ice dynamics at Jakobshavn Isbræ between 2018 and 2023. We then employ hydrographic measurements, weather station data, and modelled estimates of surface runoff, to explore the role of climatic forcing on ice dynamics over this most recent five-year period. 

Between 2018 and 2022, Jakobshavn Isbræ accelerated significantly, with peak summer terminus velocity increasing by 79%, from 9.4 to 16.8 km/yr. Despite sustained surface lowering, peak solid ice discharge also increased, rising from 39.4 Gt/yr in 2018 to 54.7 Gt/yr in 2021. Whilst the initial onset of re-acceleration occurred in 2019, a dramatic speedup occurred between May and August 2020, with ice velocity increasing from 7.6 to 13.8 km/yr. In contrast to previous years, ice velocity remained high throughout the subsequent winter, thereby facilitating a peak velocity of 16.8 km/yr in July 2021.

Jakobshavn Isbræ exhibited a typical seasonal calving cycle of winter advance and summer retreat throughout 2018 and 2019. However, a clear switch in dynamics was observed in 2020, with the terminus undergoing minimal readvance over the winter months. This shift coincided with a clear reduction in the extent of rigid mélange within Ilulissat Icefjord, in contrast to preceding years. Although sparse, hydrographic measurements indicate that the mean water temperature within Disko Bay was ~ 0.75⁰C higher in 2020, relative to 2019.

We argue that the initial onset of reacceleration and thinning at Jakobshavn Isbræ was driven primarily by atmospheric forcing, with annual runoff in 2019 approximately double that observed in the other years. Furthermore, we emphasise that at glaciers close to floatation, such as Jakobshavn, surface thinning can significantly impact buoyant flexure, and hence rates of calving. However, we also provide evidence of oceanic forcing, postulating that increased water temperatures reduced the formation of rigid mélange in 2020, thereby facilitating sustained calving and elevated ice velocities throughout the winter months. Our study therefore highlights the critical importance of considering both atmospheric and oceanic forcing when investigating and predicting the future behaviour of ice dynamics at marine-terminating outlet glaciers.

How to cite: Picton, H., Nienow, P., Slater, D., and Chudley, T.: A reassessment of the role of atmospheric and oceanic forcing on ice dynamics at Jakobshavn Isbræ, Ilulissat Icefjord, EGU General Assembly 2024, Vienna, Austria, 14–19 Apr 2024, EGU24-8352, https://doi.org/10.5194/egusphere-egu24-8352, 2024.

EGU24-8616 | ECS | Orals | CR2.3

Calving dynamics and mélange buttressing conditions at the Thwaites Glacier calving face 

Anna Crawford, Jan Åström, Doug Benn, Adrian Luckman, Rupert Gladstone, Thomas Zwinger, Fredrik Robertsén, and Suzanne Bevan

Thwaites Glacier, a large outlet glacier of the West Antarctic Ice Sheet, holds over a half meter of sea level rise equivalent. The large potential contribution to sea level is concerning given that the glacier may be vulnerable to self-sustaining processes of rapid retreat due to the retrograde bed slope that characterises much of the glacier’s bed. Such a reverse-sloping bed exists behind the relatively high ridge on which the western calving front (WCF) of the Thwaites Glacier terminus currently rests. Our study focuses on the factors that control the calving dynamics of the WCF and the ability of mélange to influence these dynamics. Employing the 3D Helsinki Discrete Element Model (HiDEM), we find that calving at this location currently occurs as rifts form and widen due to longitudinal tensile stresses associated with ice flow across the grounding line. Calving is restricted in HiDEM simulations that include a constricted mélange field that is confined within the bounds of the model domain. A thicker, constricted mélange field fully suppresses calving. These simulations show the development of robust force chains that transmit resistive forces to the Thwaites WCF. In the future, the ability for mélange to influence the calving dynamics at the WCF will depend on the degree to which it is constrained in the wide Amundsen Sea Embayment, either through binding in land-fast sea ice or jamming behind large, grounded icebergs. As such, sea-ice conditions and iceberg characteristics will need to be considered along with the presence of mélange in investigations of the future retreat of the prominently recognised Thwaites Glacier.

How to cite: Crawford, A., Åström, J., Benn, D., Luckman, A., Gladstone, R., Zwinger, T., Robertsén, F., and Bevan, S.: Calving dynamics and mélange buttressing conditions at the Thwaites Glacier calving face, EGU General Assembly 2024, Vienna, Austria, 14–19 Apr 2024, EGU24-8616, https://doi.org/10.5194/egusphere-egu24-8616, 2024.

EGU24-9102 | ECS | Posters on site | CR2.3

Calving of floating ice shelves and icebergs in Antarctica triggered by internal ocean waves driven by marine ice-cliff 

Zhenfu Guan, Yan Liu, Teng Li, and Xiao Cheng

Ice calving around Antarctica has a significant impact on glacier dynamics, sea ice, and marine productivity, which in turn affect global sea level and climate.  However, there is limited documented knowledge of the causes of ice calving triggered by internal ocean processes throughout Antarctica, especially during the austral winter.  A total of 3708 iceberg calving events were observed along the circum-Antarctic coastline over a three-month winter period.  These events included the calving of ice cliffs, ice shelves, and icebergs, spanning seven orders of magnitude in spatial scale.  The results suggest that ice cliff calving is primarily driven by internal glacier stresses and is widespread along the Antarctic coast.  The frequency of calving is primarily controlled by glacier ice velocity.  About 70% of the calving in Antarctica occurs on the Antarctic Peninsula.  Internal waves generated by ice cliff calving cascade to small enough scales to induce shear that leads to near-field (~40 km) calving of floating ice shelves and icebergs in regions of high topographic relief.  This study presents a newly discovered mechanism for ice shelf and iceberg calving driven by oceanic forces.  The mechanism has broad applicability and can serve as a catalyst for calving modeling and the study of oceanic internal waves.

How to cite: Guan, Z., Liu, Y., Li, T., and Cheng, X.: Calving of floating ice shelves and icebergs in Antarctica triggered by internal ocean waves driven by marine ice-cliff, EGU General Assembly 2024, Vienna, Austria, 14–19 Apr 2024, EGU24-9102, https://doi.org/10.5194/egusphere-egu24-9102, 2024.

EGU24-9429 | Posters on site | CR2.3

Distributed and time-series estimates of basal melt from Kamb Ice Stream’s grounding zone ocean cavity 

Huw Horgan, Natalie Robinson, Craig Stevens, Craig Stewart, Christina Hulbe, Justin Lawrence, Britney Schmidt, and Peter Washam

Melt beneath Antarctica’s large cold-cavity ice shelves remains a major source of uncertainty in ice sheet projections. Beneath these ice shelves melt is typically greatest both at the ice shelf front and at the grounding zone where ice first goes afloat. Grounding zone melt is thought to have a significant influence on ice flow across the grounding line, but can be difficult to estimate using remote sensing methods due to flexure of the overriding ice shelf. Added complexity in the grounding zone is caused by the thin water column, abundant basal crevassing, and the possible addition of subglacial fresh water draining from beneath the ice sheets. Here we present two independent estimates of basal melt from the ocean cavity of Kamb Ice Stream’s grounding zone, Ross Ice Shelf, West Antarctica. The first method uses repeat phase-sensitive radar observations to estimate melt in profiles from approximately 5 km seaward of the grounding line to approximately 3 km upstream of the grounding line. The second method uses an approximately 10-month long time series of oceanographic observations from a site 3.5 km seaward of the grounding line. Both methods are complemented by the high resolution observations provided by the Remotely Operated Vehicle (ROV) Icefin. The spatially distributed estimates show a more than tripling of melt rate within 5 km of the grounding line. The mooring derived melt rates demonstrate a melt-rate dependence on diurnal and spring-neap tidal currents. The average mooring melt rate more closely matches the radar-based estimates when a drag coefficient previously estimated using Icefin observations is used. Lastly we demonstrate an interesting correlation between mooring derived melt rates and ice shelf surface velocities obtained from Global Navigation Satellite System (GNSS) observations.

How to cite: Horgan, H., Robinson, N., Stevens, C., Stewart, C., Hulbe, C., Lawrence, J., Schmidt, B., and Washam, P.: Distributed and time-series estimates of basal melt from Kamb Ice Stream’s grounding zone ocean cavity, EGU General Assembly 2024, Vienna, Austria, 14–19 Apr 2024, EGU24-9429, https://doi.org/10.5194/egusphere-egu24-9429, 2024.

EGU24-9500 | Posters on site | CR2.3

A viscoelastic phase-field model for iceberg calving 

Robert Arthern, Jakub Stocek, and Oliver Marsh

Iceberg calving accounts for around half of the ice lost annually from Antarctica, but realistic representation of fracture and calving in large-scale ice sheet models remains a major unsolved problem in glaciology. We present a new phase-field viscoelastic model for fracture that simulates the slow deformation of ice and the distribution and evolution of cracks. Cracks nucleate and propagate in response to the evolving stress field, and are influenced by water pressure below sea level. The model incorporates nonlinear-viscous rheology, linear-elastic rheology, and a phase-field variational formulation, which allows simulation of complex fracture phenomena. We show that this approach is capable of simulating the physical process of calving. Numerical experiments supported by a simplified model suggest that calving rate will scale with the fourth power of ice thickness for a floating ice front that has no variation across flow. The equations make no assumptions about the style of calving, so they would also simulate numerous more realistic settings in Antarctica for which material parameters and three-dimensional effects can be expected to influence the calving rate.

How to cite: Arthern, R., Stocek, J., and Marsh, O.: A viscoelastic phase-field model for iceberg calving, EGU General Assembly 2024, Vienna, Austria, 14–19 Apr 2024, EGU24-9500, https://doi.org/10.5194/egusphere-egu24-9500, 2024.

EGU24-9876 | ECS | Posters on site | CR2.3

Is climate change responsible for recent retreat of the Pine Island Glacier in West Antarctica? 

Alex Bradley, David Bett, Paul Holland, C. Rosie Williams, and Robert Arthern

Pine Island Glacier is a fast flowing ice stream in West Antarctica. At present, it is rapidly thinning and retreating, and has been since at least the 1970s, when satellite records began. Sediment records indicate that this retreat was initiated in the 1940s, but the influence of climate change on key forcing components only became significant in the 1960s, i.e. the trigger for retreat occurred naturally. However, current ice loss remains responsive to fluctuations in forcing, indicating that Pine Island Glacier is not undergoing a purely unstable retreat after this trigger. This begs the question: to what extent is climate change responsible for the recent retreat of the Pine Island Glacier?

Adopting a recently published framework, we assess this question. One major challenge is the computational expense associated with the large ensemble of simulations required to account for significant uncertainties in ice sheet model parameters; to overcome this, we use a two stage Ensemble Kalman Inversion and Model Emulation approach. Ultimately, this procedure yields posterior distributions of parameters, including the trend in forcing resulting from climate change; essentially, this allows us to address the question: given the observed Pine Island Glacier retreat, how large does the trend in forcing have to have been?

How to cite: Bradley, A., Bett, D., Holland, P., Williams, C. R., and Arthern, R.: Is climate change responsible for recent retreat of the Pine Island Glacier in West Antarctica?, EGU General Assembly 2024, Vienna, Austria, 14–19 Apr 2024, EGU24-9876, https://doi.org/10.5194/egusphere-egu24-9876, 2024.

EGU24-10186 | ECS | Orals | CR2.3

Exposing Underestimated Channelized Basal Melt Rates in Antarctic Ice Shelves 

Ann-Sofie Priergaard Zinck, Stef Lhermitte, and Bert Wouters

Ice shelves play a pivotal role in stabilizing the Antarctic ice sheet by providing crucial buttressing support. However, their vulnerability to basal melting poses significant concerns for ice sheet and shelf stability. Our study focuses on assessing basal melt rates at a 50 m posting of 12 ice shelves where earlier studies have identified high melt rates. We make use of the Reference Elevation Model of Antarctica (REMA) strips to generate surface elevation- and melt rates using the Basal melt rates Using Rema and Google Earth Engine (BURGEE) methodology.

BURGEE reveals higher melt rates in areas with thinner ice than existing remote sensing basal melt products. This is for instance the case for basal channels on both Dotson, Totten and Pine Island ice shelves. Modelling studies have already shown that remote sensing inferred basal melt rates are underestimated at the thinnest part of basal channels, and that this underestimation scales with resolution coarsening. Since the thinner parts of an ice shelf also represent its weakest part, it is crucial that we capture its melting well to fully grasp the vulnerability of the ice shelf.

Our work, therefore, represents a crucial step in uncovering the vulnerability of Antarctic ice shelves. By exposing detailed melting patterns, particularly in areas like basal channels, we highlight not just extensive melting but also potential weak points, significantly contributing to our understanding of ice shelf stability. These findings bear substantial importance in comprehending the broader implications of ongoing climate changes on Antarctica's ice sheet integrity and, consequently, global sea levels.

How to cite: Zinck, A.-S. P., Lhermitte, S., and Wouters, B.: Exposing Underestimated Channelized Basal Melt Rates in Antarctic Ice Shelves, EGU General Assembly 2024, Vienna, Austria, 14–19 Apr 2024, EGU24-10186, https://doi.org/10.5194/egusphere-egu24-10186, 2024.

EGU24-10287 | ECS | Posters on site | CR2.3

Ocean-induced glacier retreat drives mass loss in Svalbard  

Tian Li, Konrad Heidler, Adam Igneczi, Stefan Hofer, Xiao Xiang Zhu, and Jonathan Bamber

Arctic Amplification is making Svalbard one of the most climatically sensitive regions in the world and it has been undergoing accelerated mass loss over the past several decades. A major uncertainty in predicting the future sea-level rise contribution from marine-terminating glaciers is ice dynamics, which can be driven by non-linear calving processes. However, the relationship between calving and ice dynamics is not well understood in Svalbard, in part due to the lack of high-resolution calving front observations. To improve our understanding of the glacier calving dynamics and its relation to dynamic mass loss, here we use a novel fully automated deep learning framework to produce a new calving front dataset of 149 marine-terminating glaciers in Svalbard. This dataset, which includes 124919 glacier calving front positions from 1985 to 2023, has high spatial and temporal resolutions and is derived from multiple optical and SAR satellite images. We then use this new calving front dataset to systematically quantify the calving front change variabilities at different temporal scales, and identify the key climate drivers controlling the calving dynamics. We show that ocean forcing plays a central role in controlling the glacier calving front changes and mass imbalance. Our study highlights the importance of including ice-ocean interaction in projecting future glacier mass loss from Svalbard.  

How to cite: Li, T., Heidler, K., Igneczi, A., Hofer, S., Zhu, X. X., and Bamber, J.: Ocean-induced glacier retreat drives mass loss in Svalbard , EGU General Assembly 2024, Vienna, Austria, 14–19 Apr 2024, EGU24-10287, https://doi.org/10.5194/egusphere-egu24-10287, 2024.

EGU24-10402 | ECS | Posters on site | CR2.3

Idealized, High Resolution, 3D Modelling of Ice-Sheet Ocean interactions in long and narrow fjords 

Jonathan Wiskandt, Inga Monika Koszalka, and Johan Nilsson

Ocean forcing of basal melt at the Greenland and Antarctic ice sheets remains a major source of uncertainty in climate ice sheet modelling. Previous efforts to represent these effects focused mainly on the properties of the ocean waters reaching the marine terminating glaciers as well as the near-ice boundary layer flows and processes at the ice-ocean interface. We use high resolution, three dimensional modelling to show the influence that rotational effects have on the fjords circulation and the melt rate distribution and compare the total melt to earlier estimates from two dimensional simulations. Furthermore we investigate the influence that the along and across fjord bathymetry of Greenlandic glacial fjords has on the exchange flow of the warm ocean waters towards the ice sheets and the glacially modified water toward the open ocean. We find that the circulation pattern produced by rotational effects has a profound effect on the distribution of the melt rate at the ice base, producing a concentrated outflow and a melt maximum at the eastern side of a fjord that opens to the open ocean in the north even in narrow fjords (width of the order of the local Rossby Radius). The bathymetry in the fjord has a restricting effect on the inflow of warm Atlantic water and hence on the temperature forcing at the ice base. We compare the inflow strengths for different fjord bathymetries to theoretical estimateion using hydraulic theory (Whitehead, 1998).

How to cite: Wiskandt, J., Koszalka, I. M., and Nilsson, J.: Idealized, High Resolution, 3D Modelling of Ice-Sheet Ocean interactions in long and narrow fjords, EGU General Assembly 2024, Vienna, Austria, 14–19 Apr 2024, EGU24-10402, https://doi.org/10.5194/egusphere-egu24-10402, 2024.

EGU24-10590 | ECS | Orals | CR2.3

Weathering crust and cryoconite holes on the Hells Gate and Nansen Ice Shelves (East Antarctica) 

Giacomo Traversa and Biagio Di Mauro

The penetration of shortwave radiation at the surface of an ice shelf has the potential to induce internal melting, resulting in the formation of a porous layer close to the surface commonly known as the weathering crust. This dynamic hydrological system is known to host light-absorbing impurities and microbes, forming a highly porous layer at the ice sheet's surface. The presence of the weathering crust significantly impacts the overall volume of generated meltwater by modulating the extent to which shortwave radiation is absorbed or reflected by the ice. Beyond external meteorological forcing, local conditions leading to weathering crust formation can be influenced by biological impurities on ice surfaces. This interplay between surface ice structures, cryoconite holes (CHs) and weathering crust contributes to the spatial and temporal variability of albedo and surface melt. In this study, we analysed uncrewed aerial vehicle (UAV) data and ground-based field spectroscopy data collected during the 2022/23 austral summer in Antarctica. The aim is to map CHs spatial distribution and to evaluate their radiative impact on blue ice fields at the Hells Gate Ice Shelf in Northern Victoria Land (East Antarctica). Furthermore, we documented the formation of the weathering crust and supraglacial ponds at Hells Gate and Nansen Ice Shelves across the summer solstice. By analysing Sentinel-2 satellite data, we were able to determine the spatial variability in surface albedo before and after the formation of the weathering crust. In detail, at the Hells Gate Ice Shelf, we estimated < 1% of area covered by CHs. Over frozen ponds and ice bands the area covered in CHs reached almost 10%. The corresponding spatially integrated-radiative forcing resulted to be about 1 Wm-2 in average, but locally it reached values of over 200 Wm-2, thus sustaining liquid water inside the CHs. As for the weathering crust, the delta albedo (Δα) was found to be about +0.10 and +0.40 respectively where weathering crust covered blue and marine ice. On the other hand, the supraglacial pond and stream formation provided an opposite Δα of about -0.30 over blue ice and -0.50 over areas previously characterised by snow cover. However, the fractional area interested by positive Δα resulted to be significantly higher than positive Δα areas over the two ice shelves.

How to cite: Traversa, G. and Di Mauro, B.: Weathering crust and cryoconite holes on the Hells Gate and Nansen Ice Shelves (East Antarctica), EGU General Assembly 2024, Vienna, Austria, 14–19 Apr 2024, EGU24-10590, https://doi.org/10.5194/egusphere-egu24-10590, 2024.

EGU24-10983 | ECS | Posters on site | CR2.3

Ice-ocean coupled modelling for Nioghalvfjerdsbræ (79NG), Greenland 

Joanna Zanker and Jan De Rydt

The Northeast Greenland Ice Stream (NEGIS) drains approximately 12 % of the Greenland Ice Sheet’s surface area, containing an ice volume of 1.1 m sea-level equivalent. Nioghalvfjerdsbræ (79NG) is one of two main outlet glaciers of NEGIS, extending into a large floating ice tongue, one of few remaining in Greenland. It is currently not well understood how 79NG will respond to the changing atmosphere and warming oceans, with possible implications for the catchment’s surface mass balance (SMB) and ocean-induced ablation. This research aims to assess the importance of feedbacks between ice-sheet geometry, SMB and ocean-driven melt by having a mutually evolving dynamical ice sheet with evolving SMB parameterization and a 3D ocean circulation model utilising the ice-ocean coupled model Úa-MITgcm. The potential feedbacks between changes in ice-sheet surface geometry, ice-tongue cavity geometry and the atmosphere/ocean mass balance are as-of-yet poorly understood, especially in the context of Greenland. Of particular interest for NEGIS is the potential for geometry induced changes in melting of the ice tongue, as found for some Antarctic ice shelves. Development of the Úa ice-flow model will begin with a Greenland-wide setup and experiments based on the ISMIP6 protocol, before focussing on a regional setup of the NEGIS catchment and coupling to a regional configuration of the MITgcm ocean model of the adjacent fjord and continental shelf. The coupled approach of this project aims to improve the representation of the feedbacks between different climate components at a regional scale and draw conclusions about the fidelity of projections of ice sheet-wide mass loss and sea-level rise from ISMIP. 

How to cite: Zanker, J. and De Rydt, J.: Ice-ocean coupled modelling for Nioghalvfjerdsbræ (79NG), Greenland, EGU General Assembly 2024, Vienna, Austria, 14–19 Apr 2024, EGU24-10983, https://doi.org/10.5194/egusphere-egu24-10983, 2024.

EGU24-11023 | ECS | Posters on site | CR2.3

Spatiotemporal evolution of subaerial ice cliff heights at marine-terminating outlet glaciers in Northwestern Greenland 

Emma Carr, Rachel Carr, Chris Stokes, Emily Hill, Hilmar Gudmundsson, and Neil Ross

Many tidewater glaciers in Greenland terminate in near-vertical ice cliffs from which icebergs calve. Marine Ice Cliff Instability (MICI) is the hypothesis that above a subaerial ice cliff height limit, the tensile or shear stresses at the glacier terminus surpass the ice yield strength, causing catastrophic cliff failure and self-sustaining ice frontal retreat as sequentially taller subaerial cliffs are exposed. Previous modelling studies have proposed this threshold subaerial cliff height is at least 100 m, with estimated thresholds including 100 m and 110 m for damaged ice, and up to 540 m when ice is treated as undamaged. However, modern-day observations to test MICI are limited because few marine-terminating outlet glaciers without a buttressing ice shelf are known to terminate in subaerial ice cliffs greater than 100 m high. Here, we expand the observations of subaerial ice cliff heights at ten marine-terminating outlet glaciers in northwest Greenland using 2 m spatial resolution Arctic DEM strips. Our results identify three marine-terminating outlet glaciers that currently terminate in exposed subaerial ice cliffs approaching or exceeding the stability thresholds estimated for MICI. During at least two years between 2016 and 2021, subaerial ice cliffs at Nuussuup Sermia (NuS), Nunnatakassaap Sermia (NkS) and Sermeq North (SqN) exceeded heights of 100 m and 110 m. Despite being above these postulated thresholds thought conducive for cliff failure, SqN underwent relatively limited net retreat (0.25 km), and NuS and NkS exhibited distinct seasonal cycles of terminus advance (up to 0.92 km) from March to June/July each year prior to the disintegration and removal of proglacial ice mélange. Consequently, none of the glaciers identified as potentially susceptible to MICI underwent rapid, unforced retreat. We hypothesise that MICI processes were mitigated by dynamic thinning lowering the ice surface elevation immediately up-glacier of the ice cliff so that progressively taller subaerial cliffs were not exposed after retreat. Further research is required to monitor and model the evolution of subaerial ice cliffs to better understand the potential for unstable retreat in West Antarctica due to MICI.

How to cite: Carr, E., Carr, R., Stokes, C., Hill, E., Gudmundsson, H., and Ross, N.: Spatiotemporal evolution of subaerial ice cliff heights at marine-terminating outlet glaciers in Northwestern Greenland, EGU General Assembly 2024, Vienna, Austria, 14–19 Apr 2024, EGU24-11023, https://doi.org/10.5194/egusphere-egu24-11023, 2024.

EGU24-11297 | Posters on site | CR2.3

Temporal evolution of basal terraces at Ekström Ice Shelf, East Antarctica  

Reinhard Drews, Falk Oraschewski, M. Reza Ershadi, Jonathan Hawkins, Christian Wild, Rebecca Schlegel, Inka Koch, Ole Zeising, and Olaf Eisen

Ekström Ice Shelf is a representative ice shelf for the ice-shelf belt of the Dronning Maud Land Coast in East Antarctica. It has cold ocean-cavity with moderate basal melt rates averaging a few meters per year across the ice shelf. In spite of the comparatively small average basal melt rates, we find basal terraces in a ground-penetrating radar dataset revealing near-vertical walls of more than 30 meters height. Such features have also been observed  elsewhere and linked to large localized basal melt rates which is in parts oriented in the horizontal direction. Here we use a ground-penetrating radar dataset with a profile spacing of <100 m which was revisited in an Eulerian sense in two consecutive field seasons 2021 and 2022. This dataset images the 3D extent of basal terracing and shows that these are remarkably stable and can be clearly identified in both seasons. They are  laterally offset  by along-flow advection and possibly also horizontal basal melting oriented perpendicular to the vertical walls. There is very little vertical difference between both datasets which is consistent with the small sub-daily melt rates derived from a continuously measuring ApRES located above a horizontal plateau linking two basal terraces at the ice base. These two 3D time slices are a unique dataset to better understand how such basal terraces initially form, how they are maintained over time and whether or not ocean-induced melting in the horizontal direction (which is typically not picked up by the ApRES data) is relevant on larger spatial scales.

How to cite: Drews, R., Oraschewski, F., Ershadi, M. R., Hawkins, J., Wild, C., Schlegel, R., Koch, I., Zeising, O., and Eisen, O.: Temporal evolution of basal terraces at Ekström Ice Shelf, East Antarctica , EGU General Assembly 2024, Vienna, Austria, 14–19 Apr 2024, EGU24-11297, https://doi.org/10.5194/egusphere-egu24-11297, 2024.

EGU24-11490 | ECS | Orals | CR2.3

The buttressing capacity of Antarctic ice shelves 

Tom Mitcham, G. Hilmar Gudmundsson, and Jonathan L. Bamber

Ice shelves can control the flux of ice across the grounding line of the Antarctic Ice Sheet (AIS), and hence the rate of mass loss, through the process of ice-shelf buttressing. Recent, increased mass loss from the AIS, particularly in the Amundsen Sea Embayment and the Antarctic Peninsula, has been attributed to a reduction in buttressing due to ice-shelf thinning, calving or ice-shelf collapse events. To determine how further changes in ice-shelf geometry might affect the contribution of the AIS to global sea levels, it is therefore important to quantify the total amount of buttressing that the ice shelves currently provide and to determine where within the ice shelves that buttressing is generated.

Previous work has sought to characterise the buttressing of Antarctic ice shelves by, for example, calculating the sensitivity of grounding line flux (GLF) to small perturbations in ice-shelf thickness, or defining regions of passive shelf ice. In this work, we calculate the total buttressing capacity of all Antarctic ice shelves for the first time and then explore the spatial distribution of that total buttressing capacity within each ice shelf.

We use the ice-flow model Úa to conduct a series of diagnostic, idealised calving experiments on a present-day, Antarctic-wide model domain, with high spatial resolution over ice shelves and grounding lines. We calculate the total buttressing capacity of each ice shelf as the relative change in GLF in response to the complete removal of the shelf and find that the total buttressing capacity varies by over two orders of magnitude around the ice sheet.

We then conduct a series of idealised calving perturbations, using a range of procedures for generating new calving front locations, and explore the spatial distribution of the total buttressing capacity within each ice shelf. We find that the vast majority of the buttressing is typically generated in ice shelf regions within a few kilometres of the grounding line. Thus, we suggest that a greater area of Antarctica’s ice shelves could be considered passive than previously proposed.


How to cite: Mitcham, T., Gudmundsson, G. H., and Bamber, J. L.: The buttressing capacity of Antarctic ice shelves, EGU General Assembly 2024, Vienna, Austria, 14–19 Apr 2024, EGU24-11490, https://doi.org/10.5194/egusphere-egu24-11490, 2024.

EGU24-11541 | ECS | Posters on site | CR2.3

Regime-shifts in ice-shelf melt could trigger irreversible ice loss from the Antarctic Ice Sheet 

Emily Hill, G. Hilmar Gudmundsson, and David Chandler

Changes in ocean conditions surrounding the Antarctic ice sheet, and the impact on melt rates beneath buttressing ice shelves, is one of the largest sources of uncertainty in future ice loss projections. If conditions were to suddenly undergo a regime-shift from cold to warm, melt rates could increase drastically and trigger large and potentially irreversible changes in the interior of the ice sheet. Here, we take an ensemble of ocean-circulation model melt rates as input to an ice-sheet model, to quantify ice loss and the potential for irreversible retreat under such warm conditions. We find that the currently cold-cavity basins of the Filchner-Ronne and Ross ice shelves, in contrast to present-day, could become large contributors to future sea level relevant ice loss. In major basins in West Antarctica, we find high-melt rates can trigger instances of irreversible grounding line retreat, which could only be recovered if arguably unattainable melt rate conditions prevailed over timescales of 100s of years.

How to cite: Hill, E., Gudmundsson, G. H., and Chandler, D.: Regime-shifts in ice-shelf melt could trigger irreversible ice loss from the Antarctic Ice Sheet, EGU General Assembly 2024, Vienna, Austria, 14–19 Apr 2024, EGU24-11541, https://doi.org/10.5194/egusphere-egu24-11541, 2024.

EGU24-12071 | ECS | Orals | CR2.3

Monitoring Shear-Zone Weakening in East Antarctic Outlet Glaciers through Differential InSAR Measurements 

Christian Wild, Reinhard Drews, Niklas Neckel, Joohan Lee, Kim Sihyung, Hyangsun Han, Won Sang Lee, Veit Helm, Oliver Marsh, and Wolfgang Rack

The stability of polar ice sheets is governed by the seaward movement of ice streams which is decelerated by resistance originating from lateral shear zones. We explore the impact of crystal-scale anisotropy on effective ice stiffness, with regional-scale consequences on ice dynamics. Using the flexural response of Priestley Glacier to tidal forcing as an experimental framework, we constrain isotropic and anisotropic elastic models of vertical tidal ice-shelf flexure. We find that a five-fold reduction of local ice stiffness within narrow lateral shear-zone best fits DInSAR measurements from Sentinel-1. Our modeling not only reproduces 31 double-differential interferograms but also resolves them into 56 individual maps of vertical displacement during SAR image acquisition. Validated with GPS measurements, the inclusion of effective shear-zone weakening significantly reduces the root-mean-square-error of predicted and observed vertical displacement by 84%, from 0.182 m to 0.03 m. These results highlight the untapped potential of DInSAR imagery for mapping ice anisotropy along the feature-rich Antarctic grounding zone, an essential parameter for advancing current ice-sheet flow models.

How to cite: Wild, C., Drews, R., Neckel, N., Lee, J., Sihyung, K., Han, H., Lee, W. S., Helm, V., Marsh, O., and Rack, W.: Monitoring Shear-Zone Weakening in East Antarctic Outlet Glaciers through Differential InSAR Measurements, EGU General Assembly 2024, Vienna, Austria, 14–19 Apr 2024, EGU24-12071, https://doi.org/10.5194/egusphere-egu24-12071, 2024.

EGU24-12332 | Posters on site | CR2.3

Summer speedup at Zachariæ Isstrøm, northeast Greenland 

Shfaqat Abbas Khan, Mathieu Morlighem, Youngmin Choi, Shivani Ehrenfeucht, Eric Rignot, Angelika Humbert, and Javed Hassan

The dynamics of The North East Greenland Ice Stream (NEGIS) are influenced by various factors such as ice thickness, topography, basal conditions, and surface meltwater inputs. The presence of basal lubrication significantly affects NEGIS ice flow by reducing friction at the ice-bed interface. Consequently, alterations in subglacial hydrology and the prevalence of meltwater can result in significant variations in ice stream velocity and mass discharge. In this study, we utilize GPS data from six stations along the main trunk to identify the inland propagation of summer speed-ups, peaking between June and August. Complementing the GPS data, we incorporate ice speed information from mosaics based on ESA Sentinel-1 SAR offset tracking, covering the entire NEGIS. These velocity maps, derived from intensity-tracking of ESA Sentinel-1 data with a 12-day repeat and utilizing the operational interferometric post-processing chain IPP for analysis, reveal substantial acceleration in surface speed from June onwards, followed by a deceleration in August. To simulate the observed summer speed-up, we employ the Ice-sheet and Sea-level System Model (ISSM). Our model results indicate that hydrology is the primary driver of the summer speed-up, leading to changes in speed that extend deep into the interior, reaching over 150 km inland. Understanding the dynamics of NEGIS is essential for predicting its future behavior and potential contributions to sea level rise in a warmer climate with increased meltwater.

How to cite: Khan, S. A., Morlighem, M., Choi, Y., Ehrenfeucht, S., Rignot, E., Humbert, A., and Hassan, J.: Summer speedup at Zachariæ Isstrøm, northeast Greenland, EGU General Assembly 2024, Vienna, Austria, 14–19 Apr 2024, EGU24-12332, https://doi.org/10.5194/egusphere-egu24-12332, 2024.

EGU24-12334 | Orals | CR2.3

Observed and modelled meltwater-induced flexure and fracture at a doline on north George VI Ice Shelf, Antarctica 

Alison Banwell, Ian Willis, Laura Stevens, Rebecca Dell, and Douglas MacAyeal

Hundreds of surface lakes are known to form each summer on north George VI Ice Shelf, Antarctic Peninsula. To investigate surface-meltwater induced ice-shelf flexure and fracture, we obtained Global Navigation Satellite System (GNSS) observations and ground-based timelapse photography over north George VI for three melt seasons from November 2019 to November 2022.

In particular, we used these field observations to characterize the flexure and fracture behaviour of a mature doline (i.e. drained lake basin formed in a prior melt season) on north George VI Ice Shelf. The GNSS displacement timeseries shows a downward vertical displacement of the doline centre with respect to the doline rim of ~60 cm in response to loading from the development of a central meltwater lake. Viscous flexure modelling indicates that this vertical displacement generates flexure tensile surface stresses of ~>75 kPa. The GNSS data also show a tens-of-days episode of rapid-onset, exponentially decaying horizontal displacement, where the horizontal distance from the rim of the doline with respect to its centre increases by ~70 cm. We interpret this event as the initiation and/or widening of a single fracture, possibly aided by stress perturbations associated with meltwater loading in the doline basin. This observation, together with our observations of circular fractures around the doline basin in timelapse imagery, suggests the first such documentation of “ring fracture” formation on an ice shelf, equivalent to the type of fracture proposed to be part of the chain reaction lake drainage process involved in the 2002 breakup of Larsen B Ice Shelf.

How to cite: Banwell, A., Willis, I., Stevens, L., Dell, R., and MacAyeal, D.: Observed and modelled meltwater-induced flexure and fracture at a doline on north George VI Ice Shelf, Antarctica, EGU General Assembly 2024, Vienna, Austria, 14–19 Apr 2024, EGU24-12334, https://doi.org/10.5194/egusphere-egu24-12334, 2024.

EGU24-12347 | ECS | Posters on site | CR2.3

The effects of including Antarctic subglacial meltwater flux to the ocean in the Energy Exascale Earth System Model 

Carolyn Branecky Begeman, Irena Vaňková, Xylar Asay-Davis, Darin Comeau, Alex Hager, Matthew Hoffman, Matthew Maltrud, Courtney Shafer, and Jonathan Wolfe

Subglacial runoff beneath ice shelves is a source of freshwater, and therefore buoyancy, at the grounding line. Being released at depth, it accelerates an ascending plume along the ice-shelf base, enhancing entrainment of ambient waters, and increasing melt rates. By now it is understood that subglacial runoff is a key control on melt rate variability at the majority of Greenland's glaciers. However, its importance in present-day and future Antarctic melt rates is less clear.

To address this point, we use the Energy Exascale Earth System Model (E3SM) and investigate the effects of Antarctic freshwater volume flux addition in both idealized setups and realistic, global, sea-ice ocean coupled configurations. For realistic Antarctic configurations, we use the subglacial hydrology model from the MALI ice-sheet model with both distributed and channelized drainage run at 4-20 km resolution to calculate steady state subglacial discharge across the grounding line under historical ice-sheet conditions.  This meltwater discharge is implemented as a freshwater flux in MPAS-Ocean, the ocean component of E3SM.

How to cite: Branecky Begeman, C., Vaňková, I., Asay-Davis, X., Comeau, D., Hager, A., Hoffman, M., Maltrud, M., Shafer, C., and Wolfe, J.: The effects of including Antarctic subglacial meltwater flux to the ocean in the Energy Exascale Earth System Model, EGU General Assembly 2024, Vienna, Austria, 14–19 Apr 2024, EGU24-12347, https://doi.org/10.5194/egusphere-egu24-12347, 2024.

EGU24-12499 | ECS | Posters on site | CR2.3

Role of buttressing in the dynamic response to Western Antarctic Peninsula ice shelf collapse 

Luisa Wagner, Martin Rückamp, and Johannes Fürst

Ice shelves on the western Antarctic Peninsula have partially or completely disappeared due to widespread thinning and retreat. The loss of floating ice results in a reduction of the buttressing on the upstream grounded ice body. As a consequence, tributary glaciers are accelerating and retreating further, leading to increased ice discharge and, in turn, an increased contribution to sea-level rise. Improving projections of the rate of sea-level rise from the area demands an in-depth understanding of the current mechanisms at play.

In order to gain this, we aim to quantify and characterise the buttressing effect of the ice shelves. To achieve this, we model hypothetical upper-end scenarios by either an immediate complete collapse of all floating ice or a sustained extreme melting. The main focus here is on the stability of the tributary glaciers and the ability of the ice shelf to rebuild itself.

To run the scenarios, we operate ISSM based on surface and basal topography from BedMachine and MEaSURE velocities. A Shallow-Shelf-Approximation with Budd and Weertman sliding laws, Beckmann and Goosse basal forcing parameterisation and von Mises calving is used. To initialise the retreat scenarios, we determine the basal friction coefficient of the grounded area and the ice shelf rheology using a joint inversion technique with regularisation.

How to cite: Wagner, L., Rückamp, M., and Fürst, J.: Role of buttressing in the dynamic response to Western Antarctic Peninsula ice shelf collapse, EGU General Assembly 2024, Vienna, Austria, 14–19 Apr 2024, EGU24-12499, https://doi.org/10.5194/egusphere-egu24-12499, 2024.

EGU24-12886 | Posters on site | CR2.3

The Crevasse Depth Calving Law Applied to Ice Shelves: Insights from a 1D Flowline Model  

Faezeh M. Nick and Doug Benn
The crevasse depth (CD) calving law predicts the position of glacier termini from the penetration of surface and basal crevasses computed from stresses in the ice. When applied to Greenland tidewater glaciers, it has high skill when implemented in a full-Stokes 3D model, although its performance in 2D and 1D models is still subject to debate, especially its ability to induce ice shelf calving without the addition of unrealistic amounts of  water in surface crevasses.  This study re-evaluates the CD law within a 1D flowline model of an ice shelf.
 
We show that the model predicts deep crevasse penetration at locations where drag at the shelf boundaries diminishes,such as the grounding line or embayment mouths. Crevasse depth depends on the rate at which these resistance sources decrease along-flow, influencing the longitudinal stress gradient. While full-depth penetration may occur in thinned shelves (due to extensive basal melt), full-depth calving is generally not predicted for unconfined ice shelves. Observations of Antarctic ice shelves and floating ice tongues well beyond embayments or basal pinning points suggest that additional triggers, like slow rift growth, basal melting, or oceanographic stresses, are essential for calving.
 
The addition of water to surface crevasses can greatly facilitate calving. In some cases, reflecting real-world conditions, such as the hydrofracturing-induced collapse of vulnerable ice shelves. However, the need for water-depth tuning in other situations has raised concerns about the physical fidelity of the model. We propose a modified stochastic CD calving criterion in which the probability of calving ramps from zero for a threshold crevasse depth to one for full-depth penetration. This non-deterministic approach captures the statistical structure of calving events, and allows a range of observed behaviours to emerge, such as long Antarctic ice shelf calving cycles (ice-tongue advance punctuated by rare calving events), and short-term fluctuations of tidewater glaciers (frequent calving retreat back to pinning points). We argue that a probabilistic approach represents an important step towards a universal calving law.  

How to cite: M. Nick, F. and Benn, D.: The Crevasse Depth Calving Law Applied to Ice Shelves: Insights from a 1D Flowline Model , EGU General Assembly 2024, Vienna, Austria, 14–19 Apr 2024, EGU24-12886, https://doi.org/10.5194/egusphere-egu24-12886, 2024.

EGU24-13188 | ECS | Orals | CR2.3

Circum-Antarctic seasonality in grounded ice flow 

Karla Boxall, Ian Willis, Jan Wuite, Thomas Nagler, Stefan Scheiblauer, and Frazer Christie

Recent advances in high-temporal-resolution satellite imaging has revealed the occurrence of seasonal ice-flow variability in the Antarctic Peninsula for the first time. This newly documented phenomenon provides motivation for identifying the as-yet-unknown ice, ocean and climate interactions responsible for driving the seasonal signals observed across the Antarctic Peninsula, and raises important questions about the possible presence and drivers of seasonality elsewhere in Antarctica. Knowledge of such mechanisms and the extent of seasonality around Antarctica will be important for refining discharge-based ice-sheet mass balance estimations, and for improving predictions of Antarctica’s future response to climate change.

Here, we identify the likely drivers of the recently observed ice-flow seasonality in the western Antarctic Peninsula by carrying out statistical time series analysis using our published Sentinel-1-derived velocity observations (Boxall et al., 2022; doi:10.5194/tc-16-3907-2022) and an array of environmental variables. Our results reveal that both surface and oceanic forcing are statistically significant controls upon ice-flow seasonality in the western Antarctic Peninsula, although each mechanism elicits a unique lag between forcing and the ice-velocity response.

By upscaling our Sentinel-1-derived velocity observations, we also report upon the nature of ice-flow seasonality along Antarctica’s entire coastal margin for the first time and, through additional time series analysis, assess the glacier- to regional-scale importance of surface and ocean forcing upon circum-Antarctic rates of flow.

How to cite: Boxall, K., Willis, I., Wuite, J., Nagler, T., Scheiblauer, S., and Christie, F.: Circum-Antarctic seasonality in grounded ice flow, EGU General Assembly 2024, Vienna, Austria, 14–19 Apr 2024, EGU24-13188, https://doi.org/10.5194/egusphere-egu24-13188, 2024.

EGU24-14126 | ECS | Orals | CR2.3

Improved Parameterizations of Ice-Ocean Boundary Layers 

Ken Zhao, Tomas Chor, Eric Skyllingstad, and Jonathan Nash

Glacial melt rates at ice-ocean interfaces are critical to understanding ice-ocean interactions in polar regions and are commonly parameterized as a turbulent shear boundary with a time-invariant drag coefficient. This assumes the exchange of heat and freshwater across the mm-scale diffusive thermal and salinity boundary layers varies proportionally with the strength of external momentum. However, this is only appropriate when melt/buoyancy-driven turbulence and the suppression of turbulence by stratification is weak.

Guided by GPU-accelerated Direct Numerical Simulations (10 micron resolution) of the ice-ocean boundary layer for varying geometric and ocean forcing parameters, I will present an updated understanding of the basic principles of ice-ocean boundary layers as a complex interplay between diffusive freshwater/thermal and viscous shear layers nested within different types of turbulent boundary layers. I will present numerical simulation results that seek to merge the different turbulent ice-ocean boundary layer regimes: (1) meltwater-driven buoyancy, (2) meltwater-driven shear, and (3) externally-driven shear from both horizontal and vertical sources of momentum.

This updated understanding allows us to develop more accurate predictions for the turbulently-constrained momentum, thermal, and freshwater boundary layer thicknesses, which is required to predict the ocean-driven melt rate of ice in polar regions.

How to cite: Zhao, K., Chor, T., Skyllingstad, E., and Nash, J.: Improved Parameterizations of Ice-Ocean Boundary Layers, EGU General Assembly 2024, Vienna, Austria, 14–19 Apr 2024, EGU24-14126, https://doi.org/10.5194/egusphere-egu24-14126, 2024.

EGU24-14713 | Posters on site | CR2.3

Multi-sensor approach of monitoring ice-ocean interaction at high resolution at a major ocean-terminating glacier in South Greenland 

Andreas Vieli, Armin Dachauer, Dominik Gräff, Andrea Walter, Brad Lipovsky, Fabian Walter, and Ethan Welty

About half of the current rapid mass loss of the Greenland ice sheet (GIS) is through dynamic processes driven by calving and frontal ablation. However, related insitu observations in such dynamic environments are challenging and our process understanding is therefore still limited. Within the wider context of the GreenFjord-project on Greenland Fjord ecosystem we introduce here a multi-sensor approach for observing process interactions at high spatial and temporal resolution at the ice-ocean boundary of the major ocean-terminating outlet glacier Eqalorutsit Kangillit Sermiat (EKaS) in South Greenland.

Besides multiple all year-round time lapse cameras, broadband seismometers and tidegauges distributed around the glacier terminus and running since summer 2022, we deployed for the first time in summer 2023 a fibre optic cable at the fjord-bed along the calving front and performed continuous distributed acoustic and temperature sensing measurements (DAS and DTS) during more than two weeks. In parallel, we run a terrestrial radar interferometer (TRI) at 1min repeat intervals that recorded high resolution flow-fields as well as calving events (time, size and location). Our comprehensive observational approach is further complemented by local meteo-station data and more than 20 CTD profiles in the fjord near the calving front. In addition, two ocean bottom seismometers together with a simple CTD mooring have been deployed in summer 2023 and are planned to be recovered in the coming summer.

Besides our observational approach, we present here a broad overview and preliminary analysis of this unique observational dataset. We are not only able to record and cross-validate the same processes or events (e. g. calving and ice flow) from multiple sensors, but also clearly extend our observational ability (e. g. detection sensitivity, calving type and size, fjord circulation, spatial and temporal resolution).  We further get more insights into related subglacial and submarine processes such as fjord temperature variations, plume discharge and internal waves in the fjord. Our results thereby contribute to improve our understanding of ice-ocean interaction at a calving front and helps to develop sustainable observational systems of related processes.

How to cite: Vieli, A., Dachauer, A., Gräff, D., Walter, A., Lipovsky, B., Walter, F., and Welty, E.: Multi-sensor approach of monitoring ice-ocean interaction at high resolution at a major ocean-terminating glacier in South Greenland, EGU General Assembly 2024, Vienna, Austria, 14–19 Apr 2024, EGU24-14713, https://doi.org/10.5194/egusphere-egu24-14713, 2024.

EGU24-15935 | ECS | Posters on site | CR2.3

Modelling Ryder Glacier in Northern Greenland until 2100 under various emissions scenarios; Under which circumstances is the ice tongue lost? 

Felicity Holmes, Jamie Barnett, Henning Åkesson, Johan Nilsson, Nina Kirchner, and Martin Jakobsson

The Greenland Ice Sheet is currently the largest single contributor to global sea level rise, with recent decades having been characterised by an acceleration of mass loss. The Northern sector of the Greenland Ice Sheet has been relatively understudied, but is also the sector containing several of the last remaining ice tongues in Greenland. If these floating ice tongues are lost, the associated reduction in buttressing has the potential to lead to large increases in velocities and mass loss. One such glacier is Ryder glacier which, in contrast to the nearby Petermann glacier, has been reasonably stable in recent decades. As such, this glacier was targeted during the Ryder 2019 expedition with Swedish Icebreaker Oden, leading to a wealth of data on its present-day setting and Holocene history. In conjunction with this observational data, the numerical Ice Sheet and Sea Level System Model (ISSM) is used to investigate both the controls on glacier behaviour since 1900 and the likely trajectory of Ryder glacier towards 2100 under different emissions scenarios. The key focus is on understanding under which circumstances Ryder glacier may lose its ice tongue and what the impacts of this are likely to be in terms of glacier dynamics and sea level rise contribution.

How to cite: Holmes, F., Barnett, J., Åkesson, H., Nilsson, J., Kirchner, N., and Jakobsson, M.: Modelling Ryder Glacier in Northern Greenland until 2100 under various emissions scenarios; Under which circumstances is the ice tongue lost?, EGU General Assembly 2024, Vienna, Austria, 14–19 Apr 2024, EGU24-15935, https://doi.org/10.5194/egusphere-egu24-15935, 2024.

EGU24-15939 | ECS | Posters on site | CR2.3

Modelling the evolution of Ryder Glacier, Greenland, through the Holocene to investigate its responses to marine and atmospheric forcings. 

Jamie Barnett, Felicity Holmes, Henning Åkesson, Johan Nilsson, Nina Kirchner, and Martin Jakobsson

Coupling paleo numerical simulations of the Greenland Ice Sheet with physical geological evidence of past ice sheet extent can greatly improve our understanding of the factors driving ice loss. Geological observations can be used to reconstruct the state of the Greenland Ice Sheet at snap shots in time, thus acting as constraints to test the fidelity of ice sheet models that can tell a continuous story of retreat over the same geologic timescales. Swedish Ice Breaker Oden’s visit to Sherard Osborn Fjord and Ryder Glacier in 2019 collected a plethora of marine-geological data that describes the glacier’s behaviour and retreat during the Holocene. Here we use a 3D thermo-coupled Higher-Order ice flow module incorporated in the Ice-sheet and Sea-level System Model (ISSM) to simulate the dynamics of Ryder Glacier from 12500 ka to present day. By focusing on a specific individual glacier, we can run the model at resolutions <1km near the grounding line to shed light on the marine (calving and submarine melt) and atmospheric factors that potentially drove Ryder’s retreat from its Younger Dryas position. Of particular interest is understanding whether the glacier withdrew from its marine setting during the Holocene Thermal Maximum and what conditions were required for Ryder to regrow its modern-day ice tongue during the neoglacial cooling at the end of the Holocene.

How to cite: Barnett, J., Holmes, F., Åkesson, H., Nilsson, J., Kirchner, N., and Jakobsson, M.: Modelling the evolution of Ryder Glacier, Greenland, through the Holocene to investigate its responses to marine and atmospheric forcings., EGU General Assembly 2024, Vienna, Austria, 14–19 Apr 2024, EGU24-15939, https://doi.org/10.5194/egusphere-egu24-15939, 2024.

EGU24-16868 | ECS | Posters on site | CR2.3

Large-scale and High-resolution Frontal Ablation Estimates in the Arctic through a Machine Learning Approach 

Dakota Pyles, Nora Gourmelon, Vincent Christlein, and Thorsten Seehaus

Frontal ablation is an important component of tidewater glacier mass loss, however, high temporal resolution estimates have remained elusive due to difficulty in reliably capturing terminus position changes with satellite imagery. Recent developments in machine learning-based radar image segmentation to automatically delineate glacier fronts has opened an opportunity to calculate frontal ablation over fine timescales. Through segmentation of Sentinel-1 synthetic aperture radar image sequences, we aim to quantify seasonal and annual frontal ablation across several Arctic regions, using a deep learning-based terminus segmentation algorithm. Svalbard, an Arctic region characterized by variable and complex glacier and fjord geometries, will serve as a methodological test site before expanding the scope to the Canadian Arctic, Greenland periphery, and Russian Arctic, or ~1400-1500 marine-terminating glaciers in the Northern Hemisphere. The derived frontal ablation information is valuable to climate and glacier models, which could benefit from high-resolution reference data, resulting in improved calibrations and parameterizations. Future project efforts will include quantifying total mass budget for all glaciers in the study by integrating frontal changes, ice discharge calculations from ice thickness and surface velocity products, and climatic mass balance data. To identify and evaluate external drivers of glacier change, the frontal ablation and mass balance products will be combined with modeled and observational atmospheric, oceanic, and sea ice data. Through multivariate statistical analyses between these Earth system datasets and mass balance components, we look to provide an improved understanding of dynamic tidewater glacier processes, their spatio-temporal variability, and the influence of glacier geometry on observed changes throughout the Arctic.

How to cite: Pyles, D., Gourmelon, N., Christlein, V., and Seehaus, T.: Large-scale and High-resolution Frontal Ablation Estimates in the Arctic through a Machine Learning Approach, EGU General Assembly 2024, Vienna, Austria, 14–19 Apr 2024, EGU24-16868, https://doi.org/10.5194/egusphere-egu24-16868, 2024.

EGU24-17109 | ECS | Posters on site | CR2.3

Ice- Ocean- Atmosphere Interactions in the Arctic: Glaciers and Ice Caps 

Morag Fotheringham, Noel Gourmelen, Michel Tsamados, and Donald Slater

Arctic glaciers and ice caps are currently major contributors to global sea level rise, with future projections showing a sustained input. The monitoring of these smaller land-ice masses is challenging due to the high temporal and spatial resolution required.

These glaciers and ice caps are losing mass in response to climate forcings, both atmospheric and oceanic. The relative significance of these forcings is currently unknown with most recent catagorisation focusing on separating loss caused by internal dynamics vs surface mass balance changes.

This leaves the specific roles of the atmosphere and the ocean unconstrained; this understanding is key to improving the accuracy of future loss of ice from these smaller land-ice masses and future sea level rise projections.

This study uses CryoSAT-2 swath interferometric radar altimetry to provide high spatial and temporal observations to produce elevation timeseries in order to evaluate the trends of mass loss. It also utilises an ocean thermal model, previously used to study Greenland's outlet glaciers, to gain a better understanding of the relative contributions of atmospheric and ocean forcings to this mass loss.

How to cite: Fotheringham, M., Gourmelen, N., Tsamados, M., and Slater, D.: Ice- Ocean- Atmosphere Interactions in the Arctic: Glaciers and Ice Caps, EGU General Assembly 2024, Vienna, Austria, 14–19 Apr 2024, EGU24-17109, https://doi.org/10.5194/egusphere-egu24-17109, 2024.

EGU24-17177 | ECS | Posters on site | CR2.3

Testing a PICO quadratic sub-shelf basal melt module in the GRISLI ice sheet model 

Maxence Menthon, Pepijn Bakker, Aurélien Quiquet, and Didier Roche

The Antarctic ice sheet dynamics is primarily driven by basal melting under the ice shelves. The limitation of computational resources forces the usage of simplified parametrizations in ice-sheet models. Multiple parametrizations have been developed and implemented over the last years (Reese et al. 2018, Lazeroms et al. 2018, Pelle et al. 2019, Jourdain et al. 2020, etc.). The PICO module (Reese et al. 2018) demonstrates to be a good trade-off between complexity and computational resources for paleo ice-sheet reconstructions. Lately, Burgard et al. 2022 suggested that the implementation of a quadratic version of the PICO module could improve it significantly.

Here we test the implementation of the PICO module with a quadratic relationship between the thermal forcing and the melt in the GRISLI ice sheet model. We test a wide range of parameter values to calibrate the module, we compare the quadratic version of the module with the original version, under 2 different resolutions. Eventually, we show the results of simulations on paleo and future applications.

How to cite: Menthon, M., Bakker, P., Quiquet, A., and Roche, D.: Testing a PICO quadratic sub-shelf basal melt module in the GRISLI ice sheet model, EGU General Assembly 2024, Vienna, Austria, 14–19 Apr 2024, EGU24-17177, https://doi.org/10.5194/egusphere-egu24-17177, 2024.

EGU24-17297 | Orals | CR2.3

Geometric amplification and suppression of ice-shelf basal melt in West Antarctica 

Jan De Rydt and Kaitlin Naughten

Ice shelves along the Amundsen Sea coastline in West Antarctica are continuing to thin, albeit at a decelerating rate, whilst ice discharge across the grounding lines has been observed to increase by up to 100% since the early 1990s. Here, the ongoing and future evolution of ice-shelf mass balance components (basal melt, grounding line flux, calving flux) is assessed in a high-resolution coupled ice-ocean model that includes the Pine Island, Thwaites, Crosson and Dotson ice shelves. For a range of idealized ocean-forcing scenarios, the combined evolution of ice-shelf geometry and basal melt rates is simulated over a 200-year period. For all ice-shelf cavities, a reconfiguration of the 3D ocean circulation in response to changes in cavity geometry is found to cause significant and sustained changes in basal melt rate, ranging from a 75% decrease up to a 75% increase near the grounding lines, irrespective of the far-field ocean conditions. These poorly explored feedbacks between changes in ice-shelf geometry, ocean circulation and basal melting have a demonstrable impact on the net ice-shelf mass balance, including grounding line discharge, at multidecadal timescales. They should be considered in future projections of Antarctic mass loss, alongside changes in ice-shelf melt due to anthropogenic trends in the ocean temperature and salinity.

How to cite: De Rydt, J. and Naughten, K.: Geometric amplification and suppression of ice-shelf basal melt in West Antarctica, EGU General Assembly 2024, Vienna, Austria, 14–19 Apr 2024, EGU24-17297, https://doi.org/10.5194/egusphere-egu24-17297, 2024.

EGU24-17302 | ECS | Posters on site | CR2.3

Modelling ocean melt of ice mélange at Greenland's marine-terminating glaciers 

Lokesh Jain, Donald Slater, and Peter Nienow

Greenland’s marine-terminating glaciers have retreated and accelerated in recent decades, contributing significantly to sea level rise. An increase in ocean temperatures, and in particular the increased submarine melting of calving fronts, is often cited as the dominant driver of this retreat. However, the presence of ice mélange and its associated buttressing force on a glacier terminus also has a substantial impact on glacier advance and retreat. The buttressing force theoretically depends on the mélange thickness, and thickness will be modulated by ocean melt rate, but our understanding of mélange melting remains limited, and it is not yet known how melt rates vary across a range of glacial and environmental conditions.

Here, we perform high-resolution numerical simulations using MITgcm to model the melting of ice mélange. In order to map out the parameter space for mélange melting at Greenland’s marine-terminating glaciers, we vary each of the ocean temperature, ocean stratification, the flux of freshwater emerging from beneath the glacier (subglacial discharge) and the mélange geometry. We study how each factor affects the magnitude and distribution of ocean melt of the ice mélange and seek a parameterisation that would allow us to simply predict mélange melt rate. Furthermore, this work is also a step towards including iceberg melting in larger climate and ice sheet models which is important because of the need to improve the characterisation of freshwater fluxes into fjord systems.

How to cite: Jain, L., Slater, D., and Nienow, P.: Modelling ocean melt of ice mélange at Greenland's marine-terminating glaciers, EGU General Assembly 2024, Vienna, Austria, 14–19 Apr 2024, EGU24-17302, https://doi.org/10.5194/egusphere-egu24-17302, 2024.

EGU24-17430 | Posters on site | CR2.3

The changes of basal conditions on Fleming Glacier, Antarctic Peninsula, between 2008 and 2021 

Yuting Dong, Huimin Liu, Angelika Humbert, Ji Zhao, Dana Floricioiu, Lukas Krieger, Michael Wolovick, Thomas Kleiner, and Lea-Sophie Höyns

The Wordie Ice Shelf (WIS) in the Antarctic Peninsula (AP) has continued to retreat since 1966, and it almost completely disintegrated in the late 1990s. Although the main supply glacier of the WIS, the Fleming Glacier (FG), did not respond immediately, increases in the glacier velocity and dynamic thinning have been observed over the past two decades, especially after 2008 when only a small ice shelf remained at the Fleming Glacier front. As FG is now the fastest flowing outlet glaciers in the west Antarctic Peninsula, ice dynamics is the primary cause of mass loss. Basal sliding is the key mechanism for glacier acceleration and as it responds to thinning and changes in basal conditions. Furthermore, changes in ice-ocean interaction, such as changes in buttressing of ice streams and outlet glaciers like Fleming Glacier, are also leading to acceleration.

Here, we use the Shallow Shelf Approximation (SSA) implementation of the Ice-sheet and Sea-level System Model (ISSM) simulating the basal shear stress distribution of FG in the years 2008, 2011, 2014, 2017, 2019 and 2021 using inverse modelling. To better regularize the glaciological inverse problem, we adopt the latest published L-curve analysis to select the optimal regularization level. Considering Fleming Glacier has a relatively small drainage basin, high resolution geometric data is necessary to obtain better constrained information of the basal conditions. We use TanDEM-X DEMs acquired in austral winter of 2011, 2014, 2017, 2019, and 2021 to provide accurate glacier surface elevations. These DEMs were generated from bi-static InSAR data acquired by the TanDEM-X mission and are with the most complete time series and the best quality that can be obtained in this area at present.  We evaluate the existing ice velocity products and performed a spatio-temporal interpolation to obtain the average velocity of the year corresponding to the elevation data. We use the higher Antarctic ice sheet surface mass balance data RACM2.3p2 at 2 km resolution as a boundary condition. Regarding the bedrock topography, one of the main factors restricting the inversion accuracy, we evaluated all the existing subglacial topography data products within our inversions. To more accurately represent friction at the bed, we also tested Budd’s, Weertman’s and Schoof’s sliding laws, with different friction exponents and variable geometric data.

Comparison of simulated basal shear stresses for 2008 and 2021 suggests the migration of the grounding line 8~9 km upstream by 2021 from the 2008 ice front/grounding line positions. This migration is consistent with the change in floating areas deduced from the calculated height above buoyancy. Our results indicate that the reducing basal shear stress may be directly related to the subglacial hydrologic system and lead to rapid increases in basal sliding and ongoing ungrounding. It will further promote the dynamic loss of glaciers when coupled with ocean forcing and retrograde bedrock. 

How to cite: Dong, Y., Liu, H., Humbert, A., Zhao, J., Floricioiu, D., Krieger, L., Wolovick, M., Kleiner, T., and Höyns, L.-S.: The changes of basal conditions on Fleming Glacier, Antarctic Peninsula, between 2008 and 2021, EGU General Assembly 2024, Vienna, Austria, 14–19 Apr 2024, EGU24-17430, https://doi.org/10.5194/egusphere-egu24-17430, 2024.

EGU24-17929 | ECS | Orals | CR2.3

The relative importance of subglacial discharge and iceberg melt forcing in Greenlandic glacial fjord circulation 

Eleanor Johnstone, Donald Slater, Tom Cowton, Neil Fraser, Mark Inall, and Martim Mas e Braga

Glacial fjords form a crucial coupling between the Greenland ice sheet and the surrounding ocean, but observational data is scarce and their complex multi-scale physics can be difficult to model. Thus, glacial fjord processes are often excluded from large-scale ice sheet models that project  sea level contribution and ocean models that are forced by ice sheet freshwater. A key driver of fjord dynamics is the input of ice sheet freshwater, primarily from subglacial discharge rising in a buoyant plume and from iceberg melt. These freshwater sources set up a density gradient between the fjord and shelf, driving fjord circulation and exporting freshwater to the ocean. Observational evidence from a few fjords suggests that fjords can store this freshwater, leading to an export to the shelf that is modified in properties and lagged in time compared to the input of the freshwater to the fjord. Yet little is known about how this freshwater modification varies across Greenland’s diverse fjords, and the relative importance of the sources of freshwater in this process has not been quantified.  

Here, we use a two-layer box model to simulate fjord dynamics in a simple yet realistic way. We isolate the circulation driven by freshwater input from each of subglacial discharge and iceberg melting to assess the relative impact of each process on (i) strength of circulation and (ii) modification and export of freshwater. The model suggests that fjord geometry and the strength of the fjord-shelf exchange are the key controllers of the lag time for freshwater export, with strong fjord-shelf exchange and smaller fjords promoting nearly instant freshwater export, and weak fjord-shelf exchange and large fjords giving long lags in freshwater export. The wider aims of the project are to quantify freshwater export and heat import at glacial fjords on a Greenland-wide scale.

How to cite: Johnstone, E., Slater, D., Cowton, T., Fraser, N., Inall, M., and Mas e Braga, M.: The relative importance of subglacial discharge and iceberg melt forcing in Greenlandic glacial fjord circulation, EGU General Assembly 2024, Vienna, Austria, 14–19 Apr 2024, EGU24-17929, https://doi.org/10.5194/egusphere-egu24-17929, 2024.

EGU24-18382 | ECS | Posters on site | CR2.3

An attempt to capture diverse tidewater glacier calving styles within a single framework 

Donald Slater, Doug Benn, and Till Wagner

The complexity of the processes and the difficulty of collecting observations mean that the treatment of the ice-ocean boundary remains one of the most challenging aspects of running models of the Greenland ice sheet. With geometry, climate forcing, ice properties and feedbacks between these factors all playing a role, tidewater glaciers display a range of calving styles that are hard to capture within the simple parameterisations that are necessary for large-scale ice sheet modeling.

Here we attempt to place some dominant calving styles within a single framework. We study submarine melt undercut-driven calving using linear elastic fracture mechanics within 2D elastic simulations, together with analytical approaches to calving driven by the intersection of basal and surface crevasses and to ice cliff failure. Taken together, these approaches give a prediction of calving style as a function of the calving front ice thickness, ocean depth and submarine melt undercut length, or equivalently as a function of the frontal tension, bending moment and shear. We discuss possible implementations in ice sheet models.

How to cite: Slater, D., Benn, D., and Wagner, T.: An attempt to capture diverse tidewater glacier calving styles within a single framework, EGU General Assembly 2024, Vienna, Austria, 14–19 Apr 2024, EGU24-18382, https://doi.org/10.5194/egusphere-egu24-18382, 2024.

The marine-terminating glaciers in Svalbard are retreating and losing mass at an alarming rate due to the rapidly warming climate. And glacier calving is one of the most important process contributing to the glacier mass loss. Hence, it is very important to observe the glacier termini to understand calving variability and the influence of local environmental conditions on them.

Here, high frequency time-lapse images have been used to observe the calving front of Hansbreen (a tidewater glacier in the Honrsund fjord, Svalbard) at a 15-minute interval. The time-lapse images have been visually analyzed from April 2016 to October 2016, to observe the calving variability. The calving events are identified and then classified based on several parameters. The environmental parameters like air temperature, sea surface temperature, tidal cycle, water salinity, etc, for the same region have been understood to see if they have any influence spatial and temporal distribution of the observed calving events. [This research has been supported by the National Science Centre, Poland (grant no. 2021/43/D/ST10/00616) and the Ministry of Education and Science, Poland (subsidy for the Institute of Geophysics, Polish Academy of Sciences).]

How to cite: Maniktala, D. and Glowacki, O.: Studying the influence of environmental parameters on calving variability at Hansbreen, in Svalbard, EGU General Assembly 2024, Vienna, Austria, 14–19 Apr 2024, EGU24-18558, https://doi.org/10.5194/egusphere-egu24-18558, 2024.

EGU24-18561 | ECS | Orals | CR2.3

Simulating cracks in glacier ice by means of the phase field method 

Rabea Sondershaus, Angelika Humbert, and Ralf Müller

Calving is still a poorly understood process, hence a physically based calving law has not yet been found. Large ice sheet models are using simplified parameterisations to describe calving, which are tuned by observational data. Therefore the demands for the development of physically based models for calving are large.

Calving is facilitated by fracture formation and propagation, which description is the objective of fracture mechanics. Based on the fundamental theory for fracture proposed by Griffith a numerical approach has been developed to describe cracks: the so-called phase field method. This method represents the state of a material, whether it is intact or broken, by means of an additional continuous scalar field. The advantage of the phase field method is its simple numerical implementation and the avoidance of explicit representation of crack faces as well as costly remeshing.

This work adjust the phase field method for fracture to simulate fracture in glacier ice. Thereby the ice rheology is considered by using a viscoelastic material description where a nonlinear viscosity, based on Glen’s flow law, is taken into account. Furthermore finite strain theory is used to capture the large deformations occurring in ice shelves and floating glacier tongues.

The developed theoretical framework is utilized to simulate crack initiation and propagation at ice rises. Here the calving front geometry of the 79N Glacier in Greenland is used to validate the proposed model by comparing the simulated crack paths to satellite imagery.

How to cite: Sondershaus, R., Humbert, A., and Müller, R.: Simulating cracks in glacier ice by means of the phase field method, EGU General Assembly 2024, Vienna, Austria, 14–19 Apr 2024, EGU24-18561, https://doi.org/10.5194/egusphere-egu24-18561, 2024.

EGU24-19514 | ECS | Orals | CR2.3

Stability of radially spreading extensional flows and ice shelves 

Lielle Stern and Roiy Sayag

Ice shelves that spread into the ocean can develop rifts, which can trigger ice-berg calving and enhance ocean-induced melting. Fluid mechanically, this system is analogous to the radial propagation of a non-Newtonian, strain-rate-softening fluid representing ice that displaces a relatively inviscid and denser fluid that represents an ocean. Laboratory experiments showed that rift patterns can emerge in such systems and that the number of rifts declines in time. Such a dynamics was confirmed theoretically, but only for the earlier stage of the flow and for a fluid layer of uniform thickness. We investigate numerically the stability and late-time evolution of radially spreading, axisymmetric fluid layer of non-uniform thickness. We validate the two dimensional finite-element Úa model using similarity solutions of radially spreading layers of Newtonian fluid that were found consistent with laboratory experiments. We then explore the stability of the flow by introducing geometric perturbations to the initial front and tracing their evolution. Our simulations show that the front of Newtonian fluids is stable, though memory of the perturbation spectral form persists.

How to cite: Stern, L. and Sayag, R.: Stability of radially spreading extensional flows and ice shelves, EGU General Assembly 2024, Vienna, Austria, 14–19 Apr 2024, EGU24-19514, https://doi.org/10.5194/egusphere-egu24-19514, 2024.

EGU24-22433 | Orals | CR2.3

Grounding line migration at Orville Coast, Ronne Ice Shelf, West Antarctica, based on long interferometric Sentinel-1 time series 

Michał Tympalski, Marek Sompolski, Anna Kopeć, and Wojciech Milczarek

Determining the grounding lines of ice shelf glaciers (the border at which the ice begins to float in the ocean) is obligatory in precise measuring and understanding of ice sheet mass balance and glacier dynamics. Awareness of its migration range (grounding zone) is also crucial when estimating the impact of glacier/ice sheet waters on the ocean water level. Currently, the most precise large-scale method is based on the viscoelastic tidal movement of the ice shelf identified on a 4-pass DInSAR results. In some places, however, the measurements are impossible or significantly difficult due to the decorrelation between scenes. According to our preliminary results, it may be possible to use unwrapped phase interferograms as a new/supportive method for detecting ground lines. Combined with algorithms for automatic delineation, it can become a powerful solution for obtaining results with unprecedented frequency.


The latest results revealed that for many glaciers the grounding zone width is two orders of magnitude larger than expected. This contradicts existing physical models, which are based on zero ice melt and fixed grounding line position. Irregular interactions between ice and seawater might have a strong impact on glacier evolution and projections if implemented in physical models. We employed a long-time series of Sentinel-1 differential radar interferometry from 2017 to 2021 to detect the variability in grounding line position on Orville Coast, the region of the western Ronne Ice Shelf. The research carried out over a long period and with high frequency allowed a more detailed study of changes occurring in the grounding zone. Observation from a broader perspective gave us the opportunity to detect seasonality and a persistent trend. We compared changes in grounding line migration with external factors e.g. ocean tides. This might provide a better understanding of the behavior of the ice sheet and glaciers, which are currently undergoing such rapid changes.

How to cite: Tympalski, M., Sompolski, M., Kopeć, A., and Milczarek, W.: Grounding line migration at Orville Coast, Ronne Ice Shelf, West Antarctica, based on long interferometric Sentinel-1 time series, EGU General Assembly 2024, Vienna, Austria, 14–19 Apr 2024, EGU24-22433, https://doi.org/10.5194/egusphere-egu24-22433, 2024.

EGU24-926 | ECS | Posters on site | CR2.2

Simulating the impact of an AMOC weakening on the Antarctic Ice Sheet using a coupled climate and ice sheet model 

Anna Höse, Moritz Kreuzer, Willem Huiskamp, Torsten Albrecht, Stefan Petri, Ricarda Winkelmann, and Georg Feulner

Many model studies show that a shutdown of the Atlantic meridional overturning circulation (AMOC) causes reduced northward heat transport into the North Atlantic and a warming Southern Ocean in addition to shifts in large-scale atmospheric circulations. How these changing climate conditions could influence the present-day state of the Antarctic Ice Sheet is little studied even though observational data of AMOC strength show a slowdown trend over the last decades. The ocean current as well as the Antarctic Ice Sheet might reach climate tipping points triggering irreversible processes with consequences already on human time-scales. It's unclear whether increasing Southern Ocean temperatures due to a AMOC shutdown could accelerate basal melting rates, the critical parameter which in turn may induce tipping of the West Antarctic Ice Sheet.

Here, a freshwater hosing that forces the shutdown of the AMOC is applied to the North Atlantic in a global climate model with an interactive ice sheet model for Antarctica. This model framework consists of the Parallel Ice Sheet Model (PISM) that is coupled to the CM2Mc global Earth system model via the ice shelf cavity model PICO (Potsdam Ice-shelf Cavity mOdel). PISM is interactively coupled to the ocean module in order to investigate feedbacks at the ice-ocean boundary, while the atmospheric forcing is prescribed. Preliminary results show that an AMOC shutdown results in warming sea surface temperatures in the southern hemisphere along with a small shift in the mid-latitude westerlies due to reduced northward heat transport, which is in line with previous studies. Antarctic marginal temperatures decrease, however, resulting in a reduction of Antarctic mass through increased calving and decreased basal melting.

How to cite: Höse, A., Kreuzer, M., Huiskamp, W., Albrecht, T., Petri, S., Winkelmann, R., and Feulner, G.: Simulating the impact of an AMOC weakening on the Antarctic Ice Sheet using a coupled climate and ice sheet model, EGU General Assembly 2024, Vienna, Austria, 14–19 Apr 2024, EGU24-926, https://doi.org/10.5194/egusphere-egu24-926, 2024.

EGU24-966 | ECS | Orals | CR2.2

Greenland Ice Sheet evolution during the Last Interglacial with an improved surface mass balance modeling approach  

Thi Khanh Dieu Hoang, Aurélien Quiquet, Christophe Dumas, Andreas Born, and Didier M. Roche

The Last Interglacial period (LIG) (130 - 116 kaBP), characterized by higher global mean temperature and sea levels compared to the present-day due to the Earth’s orbit configuration, has been well-studied as a recent example of a climate period warmer than today. There is particular interest in studying the ice sheet-climate interactions in view of our current climate change. However, the extent of the ice sheet and its contribution to the rise of sea levels during the LIG remain debatable as different approaches suggest a wide range of estimations. In order to cover such a long period, some processes are simplified in the modeling approach by using prescribed forcings, simple surface mass balance (SMB) schemes, or equilibrium simulations, which all affect the numerical estimation of ice sheet evolution. 

In our work, to perform transient simulations, we use an Earth system model of intermediate complexity (iLOVECLIM), which has been widely used to study various long-timescale periods. Additionally, we use a physically-based energy and mass balance model with 15 vertical snow layers BESSI (BErgen Snow Simulator) to account for the effect of insolation changes as well as snow-albedo feedback. The climate forcings of the snow model are obtained by running iLOVECLIM transiently from 135 to 115 kaBP, downscaled over the Northern Polar region. Using the SMB computed by BESSI, we then simulate the ice sheet evolution during the LIG with GRISLI - the ice sheet model in the iLOVECLIM framework. 

To assess the benefits of using a physically-based SMB model in the ice sheets simulation, the outputs of GRISLI-BESSI are compared to the current SMB scheme of iLOVECLIM, a simple parametrization called ITM (Insolation Temperature Melt). The Greenland ice sheet volume simulated by the two SMB models reaches the minimum value at 127.5 kaBP, around 500 years after the peak of global mean temperature. The magnitude of ice sheet retreat and its contribution to the sea level in ITM simulations are significantly higher than in BESSI due to an overestimation of the zones of ablation. 

The findings suggest that, compared to a parameterization, we have more confidence in the ice sheet estimation with a physically-based SMB model. Further works with fully interactive ice sheet modeling that takes into account the melt-elevation feedback can improve the simulation of the ice sheet-climate interactions of long-time scales. 

How to cite: Hoang, T. K. D., Quiquet, A., Dumas, C., Born, A., and Roche, D. M.: Greenland Ice Sheet evolution during the Last Interglacial with an improved surface mass balance modeling approach , EGU General Assembly 2024, Vienna, Austria, 14–19 Apr 2024, EGU24-966, https://doi.org/10.5194/egusphere-egu24-966, 2024.

EGU24-1991 | ECS | Orals | CR2.2 | Highlight

When will the Antarctic ice shelves not be viable anymore? 

Clara Burgard, Nicolas C. Jourdain, Christoph Kittel, Cyrille Mosbeux, Justine Caillet, and Pierre Mathiot

The Antarctic contribution to sea-level rise in the coming centuries remains very uncertain, due to the possible triggering of instabilities such as the Marine Ice Sheet Instability (MISI) and Marine Ice Cliff Instability (MICI). These instabilities are mainly linked to the evolution of the floating ice shelves, which usually buttress the ice flow from the ice-sheet to the ocean. However, these are currently thinning. Better understanding the evolution of ice shelves in the next decades to centuries is therefore important and crucial to better anticipate the evolution of sea-level rise.

In this study, we investigate the viability of ice shelves for a number of climate models and scenarios. This is estimated from the emulation of the surface and basal mass balance of MAR and NEMO respectively, and from high-end dynamical ice flows obtained through Elmer/Ice. We then use a Bayesian calibration to give weight to members closer to observations. We find that large uncertainties remain, mainly because of the uncertainty in basal melt, and that viability limits vary largely depending on the ice-shelf location.

How to cite: Burgard, C., Jourdain, N. C., Kittel, C., Mosbeux, C., Caillet, J., and Mathiot, P.: When will the Antarctic ice shelves not be viable anymore?, EGU General Assembly 2024, Vienna, Austria, 14–19 Apr 2024, EGU24-1991, https://doi.org/10.5194/egusphere-egu24-1991, 2024.

EGU24-3666 | Orals | CR2.2

Deciphering Antarctic Ice Sheet Mass Loss: A Modeling Approach to Distinguish Climate Change from Natural Variability 

Johanna Beckmann, Hélène Seroussi, Lawrence Bird, Justine Caillet, Nicolas Jourdain, Felcity McCormack, and Andrew Mackintosh

The Antarctic Ice Sheet (AIS) is currently undergoing accelerated mass loss, significantly contributing to rising sea levels (SLR). Despite numerous observations, uncertainties persist in understanding the drivers and dynamic responses of AIS mass loss. Climate variability strongly influences AIS dynamics, but limited observational data hinders precise attribution to climate change or natural variability. This study addresses this gap by employing advanced modeling techniques to assess the extent to which observed and future AIS mass loss can be attributed to climate change versus variability. Utilizing a unique "initialization method" with the ISSM model, we approximate the AIS state circa 1850, a period minimally affected by anthropogenic forces. From this baseline, we project AIS development using UKESM1 forcing, comparing scenarios with and without anthropogenic influence. This investigation aims to enhance our understanding of the impact of climate change on the AIS and its implications for future SLR.

How to cite: Beckmann, J., Seroussi, H., Bird, L., Caillet, J., Jourdain, N., McCormack, F., and Mackintosh, A.: Deciphering Antarctic Ice Sheet Mass Loss: A Modeling Approach to Distinguish Climate Change from Natural Variability, EGU General Assembly 2024, Vienna, Austria, 14–19 Apr 2024, EGU24-3666, https://doi.org/10.5194/egusphere-egu24-3666, 2024.

EGU24-4093 | ECS | Posters on site | CR2.2

Interactions between ocean circulation and the Northern Hemisphere ice sheets at 40 ky B.P. in an Earth System Model (iLOVECLIM-GRISLI) 

Louise Abot, Claire Waelbroeck, Aurélien Quiquet, Casimir Delavergne, and Nathaelle Bouttes

During the last glacial period, the climate went through rapid fluctuations together with changes in ocean circulation and ice sheets volume accompanied by iceberg discharges. These rapid climate variations, namely Dansgaard-Oeschger events, are still not fully explained. This study’s aim is to contribute to their better understanding, focusing on interactions between ice sheets and ocean circulation. To this end, we use the iLOVECLIM-GRISLI coupled climate-ice sheet model and run two different perturbation experiments related to the ice sheet and ocean components. Starting from a quasi equilibrium corresponding to 40 ky B.P. greenhouse gas concentration, incoming solar radiation and ice sheet volume, the first experiment consists in imposing either constant or amplified sub-shelf melt rates in comparison with the control simulation. In the second experiment, we focus on the interface between the ice sheets and the bedrock. The basal friction coefficient values are imposed following the same procedure. These two experiments are similar to freshwater hosing experiments but here the water comes directly from the interactively computed ice sheets change. For each experiment, the perturbation is imposed for 500 years before returning to the unperturbed conditions for one thousand years and its impacts on the climate system are investigated. Our results highlight feedbacks that may help to explain the abrupt nature of the climate transitions observed during the last glacial period. 

How to cite: Abot, L., Waelbroeck, C., Quiquet, A., Delavergne, C., and Bouttes, N.: Interactions between ocean circulation and the Northern Hemisphere ice sheets at 40 ky B.P. in an Earth System Model (iLOVECLIM-GRISLI), EGU General Assembly 2024, Vienna, Austria, 14–19 Apr 2024, EGU24-4093, https://doi.org/10.5194/egusphere-egu24-4093, 2024.

EGU24-4802 | Orals | CR2.2

A synchronously coupled global model iOM4: a new modeling tool for simulations of the ocean-cryosphere interactions  

Olga Sergienko, Matthew Harrison, Alexander Huth, and Nicole Schlegel

How to cite: Sergienko, O., Harrison, M., Huth, A., and Schlegel, N.: A synchronously coupled global model iOM4: a new modeling tool for simulations of the ocean-cryosphere interactions , EGU General Assembly 2024, Vienna, Austria, 14–19 Apr 2024, EGU24-4802, https://doi.org/10.5194/egusphere-egu24-4802, 2024.

EGU24-5104 | ECS | Posters on site | CR2.2

Simulating Antarctic Ice Sheet evolution through the mid-Pleistocene transition 

Christian Wirths, Antoine Hermant, Christian Stepanek, Johannes Sutter, and Thomas Stocker

Unravelling the main drivers of the mid-Pleistocene transition (MPT; around 1.2–0.8 million years ago) remains a significant challenge in paleoclimate research. Noteworthy changes that occurred in the climate system during that time include a pronounced shift from 41-kyr to 100-kyr periodicity of glacial cycles and the emergence of much larger ice sheets. While a number of studies have focused on the interplay between the climate system and northern hemispheric ice sheets during the MPT, the role of Antarctica in driving and responding to climate change at that time remains largely unknown. This is particularly relevant as, consequently, the response of Antarctica’s vast ice sheets to a major transition in Quaternary climate, and their potential role in shaping the transition, remain uncertain. 

Here, we use the Parallel Ice Sheet Model (PISM) to simulate the transient evolution of the Antarctic Ice Sheet through the MPT. Computation of the evolution of ice sheets in PISM is enabled by means of a climate index approach that is based on snapshots of climatic conditions at key periods. The climate index approach interpolates between individual climate snapshots based on various paleo-proxy records. Further, we test Antarctica's response to different pre-MPT GCM snapshots of different CO2, orbital, and land-sea mask configurations. Climate snapshots are derived from the Community Earth System Models (COSMOS), a general circulation model that simulates atmosphere, ocean, sea ice and land vegetation in dependence of reconstructions of paleogeography, orbital configuration, and greenhouse gas concentrations.  

Our study aims to better understand the evolution of the Antarctic Ice Sheets during the MPT and to constrain potential dynamical transitions in the climate-cryosphere system. Furthermore, we seek to clarify the influence of different pre-MPT ice sheet configurations on simulated characteristics of this transition.  

The findings from this study will contribute to an improved understanding of cryospheric changes that occurred during the Quaternary. Furthermore, we aim to provide insights into potential future Antarctic trajectories under anthropogenic climate change. 

How to cite: Wirths, C., Hermant, A., Stepanek, C., Sutter, J., and Stocker, T.: Simulating Antarctic Ice Sheet evolution through the mid-Pleistocene transition, EGU General Assembly 2024, Vienna, Austria, 14–19 Apr 2024, EGU24-5104, https://doi.org/10.5194/egusphere-egu24-5104, 2024.

EGU24-5525 | Orals | CR2.2

Modeling the Antarctic Surface Mass Balance with a coarse temporal resolution 

Enrico Maiero, Florence Colleoni, Cécile Agosta, Carlo Barbante, and Barbara Stenni

Sublimation is the most important ablation term in the Antarctic Surface Mass Balance (SMB) (Agosta et al., 2019), while it is currently negligible for both Greenland and mountain glaciers (prevailing surface melt). Since simple parameterized SMB models are usually developed for Greenland and Alpine glaciers, they mostly misrepresent sublimation. To face this problem, we developed EBAL, a new parameterized Energy SMB model for Antarctica based on SEMIC (Krapp et al., 2017), which is an Energy SMB model developed for Greenland whose main innovations are a sinusoidal parameterization for the diurnal cycle to assess melt and refreezing and an albedo dependence on snow depth. EBAL was calibrated with both MAR (Kittel et al., 2022) and RACMO (Wessem et al., 2018) outputs for the period 1979-2000 and for the period 2075-2099 under the SSP5-8.5. EBAL can reproduce the statistical properties of MAR and RACMO sublimation time series and spatial distribution even if it uses a coarse time step (1 day). However, our final aim is to use EBAL for paleoclimate simulations, for which the temporal resolution of the inputs is even coarser, as often only monthly data is available. Thus, we have tested the idea of superimposing the present day-to-day variability on the MAR monthly atmospheric forcing of SSP5-8.5. Simulated SMB with EBAL forced with MAR original daily SSP5-8.5 inputs leads to a 210 Gt/yr sublimation, and to a 1425 Gt/yr melt. When forcing EBAL with monthly means only (linearly interpolated), we obtain a 113 Gt/yr sublimation and a 620 Gt/yr melt. When adding present-day variability to linearly interpolated monthly inputs, EBAL computes a 175 Gt/yr sublimation and a 1386 Gt/yr melt. Those latter numbers are very similar to those obtained when forcing with daily inputs. We propose to use this method to test EBAL for paleoclimate applications.

References

  • Agosta, C. et al., (2019). “Estimation of the Antarctic surface mass balance using the regional climate model MAR (1979–2015) and identification of dominant processes”. The Cryosphere. 13,  pp. 281-296. 10.5194/tc-13-281-2019. 
  • Kittel, C. et al., (2022). “Clouds drive differences in future surface melt over the Antarctic ice shelves”. The Cryosphere. 16, pp. 2655-2669. 10.5194/tc-16-2655-2022.
  • Krapp, M et al., (July 2017). “SEMIC: an efficient surface energy and mass balance model applied to the Greenland ice sheet”. The Cryosphere 11.4, pp. 1519–1535. 10.5194/tc-11-1519-2017
  • Wessem, J. M. et al., (Apr. 2018). “Modelling the climate and surface mass balance of polar ice sheets using RACMO2 – Part 2: Antarctica (1979–2016)”. The Cryosphere 12, pp. 1479–1498. 10.5194/tc-12-1479-2018

How to cite: Maiero, E., Colleoni, F., Agosta, C., Barbante, C., and Stenni, B.: Modeling the Antarctic Surface Mass Balance with a coarse temporal resolution, EGU General Assembly 2024, Vienna, Austria, 14–19 Apr 2024, EGU24-5525, https://doi.org/10.5194/egusphere-egu24-5525, 2024.

EGU24-5584 | Orals | CR2.2

Future Greenland melt in coupled ice sheet-climate CESM simulations: feedbacks, thresholds, reversibility 

Miren Vizcaino, Thirsza Feenstra, Michele Petrini, Raymond Sellevold, Georgiou Sotiria, Katherine Thayer-Calder, William Lipscomb, and Julia Rudlang

Estimates of future Greenland ice sheet (GrIS) melt are mostly based on regional climate modelling for a fixed GrIS topography or on ice sheet modelling with forcing from climate models. This prevents the modelling of climate and GrIS feedbacks and other types of interaction. Here we examine a set of multi-century simulations with the Community Earth System Model featuring an interactive GrIS to explore future relationship between global climate change and ice sheet change. To this end, we compare a set of coupled CESM-CISM 1% CO2 increase simulations until stabilization at two, two and a half, three and four times pre-industrial CO2 levels to examine the sensitivity of the GrIS to emission mitigation. Here we find a large role of ocean circulation weakening and associated regional climate changes on GrIS melt for moderate emission scenarios and large melt differences between the three times and four times CO2 stabilization scenarios. In addition, we examine the role of feedbacks on ice sheet evolution by comparing a 1% to 4xCO2 coupled simulation with a simulation where the GrIS topography and meltwater fluxes to the ocean are prescribed as pre-industrial. Finally, we explore the effects on GrIS melt rates of a fast 5% CO2 reduction from four times to pre-industrial levels, with a focus on restoration of high latitude climate, GrIS albedo, surface energy fluxes and refreezing capacity.  

How to cite: Vizcaino, M., Feenstra, T., Petrini, M., Sellevold, R., Sotiria, G., Thayer-Calder, K., Lipscomb, W., and Rudlang, J.: Future Greenland melt in coupled ice sheet-climate CESM simulations: feedbacks, thresholds, reversibility, EGU General Assembly 2024, Vienna, Austria, 14–19 Apr 2024, EGU24-5584, https://doi.org/10.5194/egusphere-egu24-5584, 2024.

EGU24-5698 | ECS | Posters on site | CR2.2

Geoengineering's role in reducing future Antarctic mass loss is unclear 

Mira Adhikari, Daniel Martin, Tamsin Edwards, Antony Payne, James O'Neill, and Peter Irvine

Using the BISICLES ice sheet model, we compare the Antarctic ice sheet’s response over the 22nd century in a scenario where idealised large scale, instantaneous geoengineering is implemented in 2100 or 2050 (geoengineering), with scenarios where the climate forcing is held constant in the same year (stabilisation). Results are highly climate model dependent, with larger differences between models than between geoengineering and stabilisation scenarios, but show that geoengineering cannot prevent significant losses from Antarctica over the next two centuries. If implemented in 2050, sea level contributions under geoengineering are lower than under stabilisation scenarios. If implemented in 2100, under high emissions, geoengineering produces higher sea level than stabilisation scenarios, as increased surface mass balance in the warmer stabilisation scenarios offsets some of the dynamic losses. Despite this, dynamic losses appear to accelerate and may eventually negate this initial offset, indicating that beyond 2200, geoengineering could eventually be more effective.

How to cite: Adhikari, M., Martin, D., Edwards, T., Payne, A., O'Neill, J., and Irvine, P.: Geoengineering's role in reducing future Antarctic mass loss is unclear, EGU General Assembly 2024, Vienna, Austria, 14–19 Apr 2024, EGU24-5698, https://doi.org/10.5194/egusphere-egu24-5698, 2024.

EGU24-6140 | ECS | Orals | CR2.2

Long term ice-sheet albedo feedback constrained by most recent deglaciation 

Alice Booth, Philip Goodwin, and Bb Cael

Slow climate feedbacks that operate on timescales of more than a century are currently underrepresented in model assessments of climate sensitivity, and this continues to hinder efforts to accurately predict future climate change beyond the end of the 21st Century. As such, the magnitude of multi-centennial and millennial climate feedbacks are still poorly constrained. We utilise recent reconstructions of Earth’s Energy Imbalance (EEI) to estimate both the total climate feedback parameter and the ice-sheet albedo feedback since the Last Glacial Maximum. This new proxy-based record of EEI facilitates the first opportunity to simultaneously calculate both the magnitude and timescale of Earth’s climate feedback over the most recent deglaciation using a purely proxy data-driven approach, and without the need for simulated reconstructions. We find the ice-sheet albedo feedback to have been an amplifying feedback reaching an equilibrium magnitude of 0.55 Wm-2K-1, with a 66% confidence interval of 0.45 Wm-2K-1 to 0.63 Wm-2K-1. The timescale for the ice-sheet albedo feedback to reach equilibrium is estimated as 3.61Kyrs, with a 66% confidence interval of 1.88Kyrs to 5.48Kyrs. These results provide new evidence for the timescale and magnitude of the amplifying ice-sheet albedo feedback that will continue to drive anthropogenic warming for millennia to come, further increasing the urgency for an effective climate change mitigation strategy to avoid serious long-term consequences for our planet and its ecosystems.

How to cite: Booth, A., Goodwin, P., and Cael, B.: Long term ice-sheet albedo feedback constrained by most recent deglaciation, EGU General Assembly 2024, Vienna, Austria, 14–19 Apr 2024, EGU24-6140, https://doi.org/10.5194/egusphere-egu24-6140, 2024.

EGU24-7415 | ECS | Orals | CR2.2 | Highlight

Stability regimes and safe overshoots in West and East Antarctica 

Ann Kristin Klose and Ricarda Winkelmann

Earth's climate will likely exceed a warming of 1.5°C in the coming decades. Maintaining such warming levels for a longer period of time may pose a considerable risk of crossing critical thresholds in Antarctica and, thereby, triggering self-sustained, potentially irreversible ice loss, even if the forcing is reduced in a temperature overshoot. Due to the complex interplay of several amplifying and dampening feedbacks at play in Antarctica, the duration and amplitude of such warming overshoots as well as their eventual 'landing' climate will determine the long-term evolution of the ice sheet.

Using the Parallel Ice Sheet Model, we systematically test for the reversibility of committed large-scale ice-sheet changes triggered by warming projected over the next centuries, and thereby explore (1) the stability regimes of the Antarctic Ice Sheet and (2) the potential for safe overshoots of critical thresholds in Antarctica.

We demonstrate crucial features of the Antarctic Ice Sheet's stability landscape for its long-term trajectory in response to future human actions: Given ice-sheet inertia, an early reversal of climate may allow for avoiding self-sustained ice loss that would otherwise be irreversible (for the same reduction in warming) due to multistability of the ice sheet at the basin- and continental scale. While we show that such safe overshoots of critical thresholds in Antarctica may be possible, it is also clear that limiting global warming is the only viable option to evade the risk of widespread ice loss in the long term.

How to cite: Klose, A. K. and Winkelmann, R.: Stability regimes and safe overshoots in West and East Antarctica, EGU General Assembly 2024, Vienna, Austria, 14–19 Apr 2024, EGU24-7415, https://doi.org/10.5194/egusphere-egu24-7415, 2024.

EGU24-8333 | ECS | Orals | CR2.2

Coupled ensemble simulations of the Northern Hemisphere ice sheets at last two glacial maxima  

Violet Patterson, Lauren Gregoire, Ruza Ivanovic, Niall Gandy, Stephen Cornford, and Sam Sherriff-Tadano

Coupled climate-ice sheet models can capture important interactions between the ice sheets and the climate that can help us better understand an ice sheet's response to changes in forcings. In this respect, they are a useful tool for simulating future ice sheet and sea level changes as a result of climate change. However, such models have large uncertainties related to the choice of climate and ice sheet parameters used. The same processes that operate today, also occurred in glacial times, and previous work has shown that simulating the North American ice sheet at the Last Glacial Maximum (LGM; ~21 ka BP) provides a strong benchmark for testing coupled climate-ice sheet models and recalibrating uncertain parameters that control surface mass balance and ice flow (Gandy et al., 2023).

Here, we build on this work by performing the first coupled FAMOUS-BISICLES simulations of the last two glacial maxima, including all Northern Hemisphere ice sheets interactively. The ice sheet component of this model is capable of efficiently simulating marine ice sheets, such as the Eurasian ice sheet, despite the high computational cost of higher order physics. We simulate and compare both the LGM and the Penultimate Glacial Maximum (PGM; ~140 ka BP), since both periods displayed major differences in the distribution of ice between Eurasia and North America. Uncertainty is explored by running ensembles of 120 simulations, randomly varying the uncertain parameters controlling ice sheet dynamics and climate through Latin Hypercube Sampling. We also work on improving the representation of ice streams in the model through performing internal ice temperature spin ups and sensitivity tests varying till water drainage properties. The ensemble members are evaluated against empirical data on ice sheet extent and ice stream location to find combinations of parameters that produce reasonable simulations of the North American and Eurasian ice sheets for both periods. We determine the impact of the uncertainty in these parameters on the result and whether both ice sheets show similar sensitivities to the model parameters. These simulations will provide a starting point for analysing some of the interactions between the climate and the ice sheets during glacial periods and how they may have led to different ice sheet evolutions.

How to cite: Patterson, V., Gregoire, L., Ivanovic, R., Gandy, N., Cornford, S., and Sherriff-Tadano, S.: Coupled ensemble simulations of the Northern Hemisphere ice sheets at last two glacial maxima , EGU General Assembly 2024, Vienna, Austria, 14–19 Apr 2024, EGU24-8333, https://doi.org/10.5194/egusphere-egu24-8333, 2024.

The dynamics of the ice sheets on glacial-interglacial time scales are highly controlled by interactions with the solid Earth, i.e., glacial isostatic adjustment (GIA). Particularly at marine ice sheets, competing feedback mechanisms govern the migration of the ice sheet’s grounding line and hence the ice sheet stability.

In this study, we run coupled ice sheet–solid Earth simulations over the last two glacial cycles. For the ice sheet dynamics we apply the Parallel Ice Sheet Model PISM and for the load response of the solid Earth we use the three-dimensional viscoelastic Earth in view of sea-level and vertical displacement changes we apply the Viscoelastic Lithosphere and Mantle Model VILMA.

With our coupling setup we evaluate the relevance of feedback mechanisms for the glaciation anddeglaciation phases in Antarctica considering different 3D Earth structures resulting in a range of load-response time scales. For rather long time scales, in a glacial climate associated with far-field sea level low stand, we find grounding line advance up to the edge of the continental shelf mainly in West Antarctica, dominated by a self-amplifying GIA feedback, which we call the ‘forebulge feedback’. For the much shorter time scale of deglaciation, dominated by the Marine Ice Sheet Instability, our simulations suggest that the stabilizing GIA feedback can significantly slow-down grounding line retreat in the Ross sector, which is dominated by a very weak Earth structure (i.e. low mantle viscosity and thin lithosphere).

The described coupled framework, PISM-VILMA, allows for defining restart states to which to run multiple sensitivity simulations. It can be easily implemented in Earth System Models (ESMs) and provides the tools to gain a better understanding of ice sheet stability on glacial time scales as wellas in a warmer future climate.

How to cite: Albrecht, T., Bagge, M., and Klemann, V.: Feedback mechanisms controlling Antarctic glacial cycle dynamics simulated with a coupled ice sheet–solid Earth model, EGU General Assembly 2024, Vienna, Austria, 14–19 Apr 2024, EGU24-9032, https://doi.org/10.5194/egusphere-egu24-9032, 2024.

EGU24-10162 | ECS | Orals | CR2.2

A new climate and surface mass balance product for the Antarctic and Greenland ice sheet using RACMO2.4.1 

Christiaan van Dalum, Willem Jan van de Berg, Srinidhi Nagarada Gadde, and Michiel van den Broeke

Recent progress in parameterizations of surface and atmospheric processes have led to the development of a major update of the polar version of the Regional Atmospheric Climate Model (RACMO2.4.1). Here, we present a new high-resolution climate and surface mass balance product by applying RACMO2.4.1 to the Antarctic and Greenland ice sheet for the historical period (starting in 1960 and 1945, respectively). In addition, RACMO output is now available for the first time on a pan-Arctic domain, starting in 1980. We assess these products by comparing model output of the surface mass balance and its components and the near-surface climate with in-situ and remote sensing observations, and study differences with the previously operational RACMO iteration, RACMO2.3p2. 

Among other changes, RACMO2.4.1 includes new and updated parameterizations related to surface and atmospheric processes. Most major updates are part of the physics package of cycle 47r1 of the Integrated Forecast System (IFS) of the European Center for Medium-Range Weather Forecasts (ECMWF), which is embedded in RACMO2.4.1. This includes updates to the cloud, radiation, convection, turbulence, aerosol and lake scheme. Other major changes are directly related to the cryosphere, such as the introduction of a new spectral albedo and radiative transfer scheme for glaciated snow, fixes to the snow drift scheme, a new multilayer snow scheme for seasonal snow and an updated ice mask. These updates lead to changes in the near-surface climate. For example, the horizontal transport of snow that is present in the atmosphere leads to a redistribution of snowfall. Furthermore, the spatial resolution for the Antarctic domain is increased to 11 km, which is also used for the pan-Arctic domain, while 5.5 km is used for Greenland. Here, we also discuss the impact that aforementioned changes have on the climate of the polar regions and the surface mass balance and its components of the ice sheets.

How to cite: van Dalum, C., van de Berg, W. J., Nagarada Gadde, S., and van den Broeke, M.: A new climate and surface mass balance product for the Antarctic and Greenland ice sheet using RACMO2.4.1, EGU General Assembly 2024, Vienna, Austria, 14–19 Apr 2024, EGU24-10162, https://doi.org/10.5194/egusphere-egu24-10162, 2024.

EGU24-10256 | ECS | Orals | CR2.2

Reconstructing the Greenland ice Sheet during the last two deglaciations 

Majbritt Kristin Eckert, Mikkel Lauritzen, Nicholas Rathmann, Anne Solgaard, and Christine Hvidberg

The Parallel Ice Sheet Model (PISM) is used to build up a glacial Greenland ice sheet, simulate the evolution of the Greenland ice sheet through glacial terminations I and II and investigate the evolution during previous warmer climates, the Eemian and the Holocene thermal maximum. During the Holocene, surface elevation changes derived from ice cores suggest a large thinning in the North, suggesting that the Greenland ice sheet was connected to the North American ice sheet in Canada during the last glacial. By including Canada in the modelling domain this thinning in the early Holocene as the connecting ice bridge broke up will be investigated. 

How to cite: Eckert, M. K., Lauritzen, M., Rathmann, N., Solgaard, A., and Hvidberg, C.: Reconstructing the Greenland ice Sheet during the last two deglaciations, EGU General Assembly 2024, Vienna, Austria, 14–19 Apr 2024, EGU24-10256, https://doi.org/10.5194/egusphere-egu24-10256, 2024.

EGU24-12773 | ECS | Orals | CR2.2

Improved treatment of snow over ice sheets in the NASA GISS climate model: towards ice sheet–climate coupling 

Damien Ringeisen, Patrick Alexander, Lettie Roach, Ken Mankoff, and Igor Aleinov

Representing the interactions between ice sheets and climate is essential for more accurate prediction of climate change and sea level rise. Ice sheets interact with the overlying atmosphere via the accumulation of snow and its compaction into firn, then ice, as well as the melting of surface snow and ice and the creation of runoff water. Getting an adequate representation of heat transfer, compaction, and melting processes is essential for an accurate representation of snow on land ice in global climate models. We are implementing an improved snow model on top of land ice as part of an effort to couple the NASA GISS climate model with the PISM ice sheet model. The new snow model includes additional layers and processes that are not currently incorporated (e.g., liquid water retention, percolation and refreezing, and snow densification), and mass and energy transfer methods that are consistent with both static ice sheets (with implicit iceberg fluxes) and interactive ice sheets (with explicit dynamics). We are tuning the densification scheme of this snow model with temperature and density data from common FirnCover and SumUp observations at locations in the accumulation zone of Greenland, and we compare the resulting density profiles to other SumUp density profiles in Greenland and Antarctica. We will assess the impact of this new snow model in climate model simulations with a static ice sheet compared with the previous (simpler) 2-layer snow model. Finally, we aim to use the non-coupled simulations as a baseline to assess the impact of dynamic coupling with an interactive ice sheet model.

How to cite: Ringeisen, D., Alexander, P., Roach, L., Mankoff, K., and Aleinov, I.: Improved treatment of snow over ice sheets in the NASA GISS climate model: towards ice sheet–climate coupling, EGU General Assembly 2024, Vienna, Austria, 14–19 Apr 2024, EGU24-12773, https://doi.org/10.5194/egusphere-egu24-12773, 2024.

EGU24-13618 | ECS | Orals | CR2.2

Reconstructing the coupled Greenland Ice Sheet–climate evolution during the Last Interglacial warm period 

Matt Osman, Jessica Tierney, and Marcus Lofverstrom

During the Last Interglacial (LIG), approximately 130-118 thousand years ago (ka), the Arctic experienced relative warmth and global sea levels considerably higher than modern.  While this interval is thus considered key for understanding long-term ice–climate feedbacks under warm-state climate conditions, large uncertainties remain surrounding i. the magnitude and spatial expression of LIG global temperature change, ii. the relative contributions of the Antarctic vs. Greenlandic Ice Sheets (GrIS) to LIG sea level rise, and iii. the sensitivity of the GrIS to centennial- to millennial-scale ocean-atmospheric forcing.  Here, we present, to our knowledge, a first attempt at reconstructing the coupled GrIS–climate evolution during the LIG using an internally consistent offline “paleoclimate data assimilation” approach.  Our methodology combines a newly compiled database of nearly 400 chronologically consistent marine geochemical and ice sheet-derived climate-proxy records (spanning 250 sites globally) with recently developed, state-of-the-art transient simulations of the LIG using the coupled Community Earth System Model v2 featuring an interactive Community Ice Sheet Model v2 (CESM2-CISM2).  Our preliminary assimilations suggest LIG peak global mean surface warming of +0.1-0.5˚C (±2 range) above the pre-industrial state, arising from enhanced and widespread (>2-5˚C) high Arctic warming.  Leveraging our CESM2-coupled CISM2 results, we further identify a max GrIS contribution of 2.0 (±0.6) meters of sea level rise equivalent at around 125 ka, nearly ~two millennia after peak LIG climate forcing.  These initial results provide a new proxy-model integration framework for reconciling past GrIS contributions to global sea level rise and benchmark the potential long-term sensitivity of the GrIS to ongoing Arctic warming.

How to cite: Osman, M., Tierney, J., and Lofverstrom, M.: Reconstructing the coupled Greenland Ice Sheet–climate evolution during the Last Interglacial warm period, EGU General Assembly 2024, Vienna, Austria, 14–19 Apr 2024, EGU24-13618, https://doi.org/10.5194/egusphere-egu24-13618, 2024.

Mass loss from ice sheets under the ongoing anthropogenic warming episode is a major source for sea-level rise. Due to the slow responses of ice sheets to changes in atmospheric and oceanic boundary conditions, ice sheets are projected to undergo further retreat as the climate reaches a new equilibrium, producing a long-term commitment to future sea-level rise that is fulfilled on multi-millennial scale. Future projections of ice sheets beyond 2100 have routinely employed end-of-the-century atmosphere-ocean conditions from climate model output under specified emission scenarios. This approach, however, does not account for long-term responses of the climate system to external forcings. Here we analyze the long-term atmospheric and oceanic responses to a variety of emission scenarios in several climate models and show that polar climates may see substantial changes after the atmospheric CO2 level stabilizes. With a 3-D ice sheet model, we demonstrate that the long-term climate responses are crucial for evaluating ice sheets' commitment to future sea-level rise.

How to cite: Li, D.: Effects of long-term climate responses on ice sheets' commitment to future sea-level rise, EGU General Assembly 2024, Vienna, Austria, 14–19 Apr 2024, EGU24-15160, https://doi.org/10.5194/egusphere-egu24-15160, 2024.

EGU24-15323 | ECS | Posters on site | CR2.2

Investigating the evolution and stability of the Greenland ice sheet using remapped surface mass balance forcing 

Charlotte Rahlves, Heiko Goelzer, and Michele Petrini

Surface mass balance (SMB) forcing for projections of the future evolution of the Greenland ice sheet with stand-alone modeling approaches is commonly produced on a fixed ice sheet geometry. As changes of ice sheet geometry become significant over longer time scales, conducting projections for the long-term evolution and stability of the Greenland ice sheet usually requires a coupled climate-ice sheet modeling setup. In this study we use an SMB remapping procedure to capture the first order feedbacks of a coupled climate-ice sheet system with a stand-alone modeling approach. Following a remapping procedure originally developed to apply SMB forcing to a range of initial ice sheet geometries (Goelzer et al., 2020), we produce SMB forcing that adapts to the changing ice sheet geometry as it evolves over time. SMB forcing from a regional climate model is translated from a function of absolute location to a function of surface elevation depending on 25 regional drainage basins, thereby reducing biases that would arise by applying the SMB derived from a fixed ice sheet geometry. We use forcing for different emission scenarios from the CMIP6 archive to compare results from the remapping approach with results from commonly used methods of parameterizing the SMB-height feedback, as well as with results from a semi-coupled climate-ice sheet simulation.

How to cite: Rahlves, C., Goelzer, H., and Petrini, M.: Investigating the evolution and stability of the Greenland ice sheet using remapped surface mass balance forcing, EGU General Assembly 2024, Vienna, Austria, 14–19 Apr 2024, EGU24-15323, https://doi.org/10.5194/egusphere-egu24-15323, 2024.

EGU24-15401 | Posters on site | CR2.2

Development and implementation of a refined climate index forcing for paleo ice-sheet modeling applications  

Antoine Hermant, Christian Wirths, and Johannes Sutter

The contribution of the Antarctic Ice Sheet (AIS) to sea-level rise under future scenarios remains uncertain. Simulations of the AIS covering past-climate periods provide valuable insights into its response to a range of climatological background states and transitions, as well as its past contributions to sea-level change. However, data to constrain the modelled ice-flow and the paleo-climate forcing is often lacking, leading to considerable uncertainties with respect to paleo ice sheet evolution. Here, we implement and test a framework to provide paleo-climate scenarios for continental scale ice sheet models. Our approach involves the use of an improved climate index based on ice-core records to translate paleo forcing snapshots from Earth System Models and regional models into transient paleo-climate scenarios, specifically to simulate the dynamics of the AIS throughout the last glaciation and deglaciation. Additionally, we refine paleo-accumulation scenarios by introducing a regionally-specific and temperature-dependant scaling of accumulation. Our study aims to enhance our understanding of AIS dynamics on glacial-interglacial time-scales and provide improved paleo-informed initializations for AIS projections. 

How to cite: Hermant, A., Wirths, C., and Sutter, J.: Development and implementation of a refined climate index forcing for paleo ice-sheet modeling applications , EGU General Assembly 2024, Vienna, Austria, 14–19 Apr 2024, EGU24-15401, https://doi.org/10.5194/egusphere-egu24-15401, 2024.

EGU24-15987 | ECS | Posters on site | CR2.2

Assessing Antarctic Ice Sheet dynamics under temporary overshoot and long-term temperature stabilization scenarios   

Emma Spezia, Fabrice Kenneth Michel Lacroix, Vjeran Visnjevic, Christian Wirths, Antoine Hermant, Thomas Frölicher, and Johannes Sutter

Current projections of Antarctic Ice Sheet dynamics during the next centuries are subject to large uncertainties both reflecting the ice sheet model setup as well as the climate pathways taken into consideration. Assessing both we present model projections of the Antarctic Ice Sheet’s response to a range of temporary temperature overshoot and stabilization scenarios until the year 2500 accounting for various ice sheet sensitivities. We employ the ice sheet model PISM at continental scale forced by Earth system model data tailored to specific global temperature scenarios via an adaptive greenhouse gas emissions approach. These scenarios reflect both emission pathways which result in a transient temperature overshoot during the 21st and 22nd century as well as stabilization of global temperatures without overshoot. We contrast these simulations with the well- known CMIP6 scenarios to illustrate the diverse potential pathways of Antarctic Ice Sheet dynamics under uncertain future climate trajectories. 

How to cite: Spezia, E., Lacroix, F. K. M., Visnjevic, V., Wirths, C., Hermant, A., Frölicher, T., and Sutter, J.: Assessing Antarctic Ice Sheet dynamics under temporary overshoot and long-term temperature stabilization scenarios  , EGU General Assembly 2024, Vienna, Austria, 14–19 Apr 2024, EGU24-15987, https://doi.org/10.5194/egusphere-egu24-15987, 2024.

EGU24-16455 | ECS | Posters on site | CR2.2

Ice-dammed lake-glacier interactions: Modelling the impact on Fennoscandian Ice Sheet retreat 

Ankit Pramanik, Sarah Greenwood, Carl Carl Regnéll, and Richard Gyllencreutz

Ice-dammed lakes expedite glacier retreat, leading to the expansion of lakes and an elevated risk of Glacial Lake Outburst Floods (GLOFs), and delay the freshwater inflow to the ocean. The escalating number of ice-dammed lakes in Greenland, High Mountain Asia, and Patagonia, driven by the swift retreat of glaciers amid rapid warming, poses a significant threat of natural disasters. In the geological record, evidence indicates the rapid retreat of the Fennoscandian ice sheet, marked by the formation, expansion, and drainage of large (10s-1000s km2 surface area and up to 100s m deep) ice-dammed proglacial lakes along the entire length of the late-deglacial ice margin. The deglaciation and ice-lake interactions of the Fennoscandian Ice Sheet (FIS) provide a valuable analogue for projecting the future retreat of the Greenland ice sheet, where a manifold increase in the number and volume of ice-dammed lakes is anticipated.

Despite extensive research on marine-terminating glaciers, the dynamics of lacustrine-terminating glaciers remain poorly understood. While there are some notable differences in thermo-mechanical processes between marine and lacustrine glaciers, a significant contrast lies in the fact that the calving of lake-terminating glaciers is governed by the stress balance induced by rapidly fluctuating lake levels and thermodynamics inherent of lakes. Our study delves into accessing the impact of critical factors, such as lake size and bathymetry, on the retreat of the Fennoscandian Ice Sheet, using the Ice-sheet and Sea-level System Model (ISSM). Furthermore, we aim to evaluate the influence of calving, subaqueous melt, and rapidly fluctuating lake levels on the FIS retreat. The model's accuracy will be ensured through calibration and validation against geologically reconstructed ice sheet boundaries and lake levels.

How to cite: Pramanik, A., Greenwood, S., Carl Regnéll, C., and Gyllencreutz, R.: Ice-dammed lake-glacier interactions: Modelling the impact on Fennoscandian Ice Sheet retreat, EGU General Assembly 2024, Vienna, Austria, 14–19 Apr 2024, EGU24-16455, https://doi.org/10.5194/egusphere-egu24-16455, 2024.

EGU24-16702 | ECS | Posters on site | CR2.2

Isochronally constrained ice flow evolution of Dronning Maud Land, Antarctica during the Last Glacial Period 

Vjeran Visnjevic, Julien Bodart, Antoine Hermant, Christian Wirths, Emma Spezia, and Johannes Sutter

To improve the robustness of future simulations of ice flow across the Antarctic continent as well as the projections of sea-level rise accompanying it, it is necessary to improve our understanding of the past evolution of ice dynamics. This is specially the case considering the lack of constraints on climate and basal conditions on the regional scale. To address this, we use high resolution regional ice flow modeling combined with radar obtained repositories of internal reflection horizons and ice core data, to constrain the ice flow evolution of both grounded and floating ice across the Dronning Maud Land during the Last Glacial Period. Combining the modeling results obtained using the ice sheet model PISM with radar and ice core data will enable us to improve our knowledge of conditions at the ice base, but also provide an opportunity to test and compare a range of potential climate reconstructions. The presented workflow will further be expanded to other basins in Antarctica as well as to the interglacial-glacial transition, and the results will be used to improve future simulations of ice flow across Antarctica.

How to cite: Visnjevic, V., Bodart, J., Hermant, A., Wirths, C., Spezia, E., and Sutter, J.: Isochronally constrained ice flow evolution of Dronning Maud Land, Antarctica during the Last Glacial Period, EGU General Assembly 2024, Vienna, Austria, 14–19 Apr 2024, EGU24-16702, https://doi.org/10.5194/egusphere-egu24-16702, 2024.

EGU24-17391 | ECS | Orals | CR2.2

Critical thresholds of the Greenland Ice Sheet from the LGM to the future 

Lucía Gutiérrez-González, Jorge Alvarez-Solas, Marisa Montoya, Ilaria Tabone, and Alexander Robinson

In recent decades the Greenland Ice Sheet (GrIS) has undergone accelerating ice-mass loss. The GrIS is thought to be a tipping element of the Earth system due to the existence of positive feedbacks with the climate. Previous work has shown threshold behavior in the system, and its stability has been studied in a range of temperatures of the present to a global warming of +4K. However, there is still no consensus on the values of its critical thresholds for the future. Furthermore,  its stability at  lower temperatures hasn’t been studied yet. Here we use the ice-sheet model Yelmo coupled with the regional climate model REMBO and a parametrization of the ice-ocean interactions to obtain the bifurcation diagram of the GrIS from temperatures representative of the LGM (-12K) to a warmer scenario (+4K). The preindustrial simulated equilibrium volume is larger than the observations, a feature common to many other ice-sheet models. This could indicate model biases, but also that the GrIS could currently not be fully in equilibrium with the preindustrial forcing, with implications for future projections. To investigate this issue, we simulated the transient evolution of the GrIS since the LGM to the present day in the context of the bifurcation diagram, with equilibrium states acting as attractors. 

How to cite: Gutiérrez-González, L., Alvarez-Solas, J., Montoya, M., Tabone, I., and Robinson, A.: Critical thresholds of the Greenland Ice Sheet from the LGM to the future, EGU General Assembly 2024, Vienna, Austria, 14–19 Apr 2024, EGU24-17391, https://doi.org/10.5194/egusphere-egu24-17391, 2024.

EGU24-18501 | Posters on site | CR2.2

Protocol for a Last Interglacial Antarctic ice-sheet model inter-comparison 

Lauren Gregoire, Maxence Menthon, Edward Gasson, and Louise Sime

During the last interglacial, geological records show evidence that the sea level peaked between 6 and 9 m above pre-industrial sea level, with a major contribution from the Antarctic ice sheet. However, ice-sheet models give a very large range of values due to a lack of understanding of the mechanisms leading to the Antarctic ice sheet retreat during the Last Interglacial

Here, we propose a protocol to apply systematically to multiple ice-sheet models to better understand the climate and ice-sheet model uncertainties as well as mechanisms leading to a smaller Antarctic ice sheet. We present the climate forcing choices and methodology, ice-sheet model requirements and the group of simulations suggested. The protocol includes transient penultimate deglaciation and last interglacial equilibrium simulations to make it accessible to all types of ice-sheet models. The protocol includes also sensitivity experiments such as hosing.

Inputs from the community are welcome to improve the protocol under development and make it relevant to all ice-sheet modelling groups interested in participating!

How to cite: Gregoire, L., Menthon, M., Gasson, E., and Sime, L.: Protocol for a Last Interglacial Antarctic ice-sheet model inter-comparison, EGU General Assembly 2024, Vienna, Austria, 14–19 Apr 2024, EGU24-18501, https://doi.org/10.5194/egusphere-egu24-18501, 2024.

EGU24-19165 | Posters on site | CR2.2

Oceanic gateways in Antarctica - Impact of relative sea-level change on sub-shelf melt 

Moritz Kreuzer, Torsten Albrecht, Lena Nicola, Ronja Reese, and Ricarda Winkelmann

Relative sea level (local water depth) on the Antarctic continental shelf is changing by the complex interplay of processes associated with Glacial Isostatic Adjustment (GIA). This involves near-field visco-elastic bedrock displacement and gravitational effects in response to changes in Antarctic ice load, but also far-field interhemispheric effects on the sea-level pattern. On glacial time scales, these changes can be in the order of several hundred meters, potentially affecting the access of ocean water masses at different depths to Antarctic grounding lines and ice sheet margins. Due to strong vertical gradients in ocean temperature and salinity at the continental shelf margin, basal melt rates of ice shelves could change significantly just by variations in relative sea level alone.
Based on a coupled ice sheet – GIA model setup and the analysis of bathymetric features such as troughs and sills that regulate the access of open ocean water masses onto the continental shelf (oceanic gateways), we conduct sensitivity experiments to derive maximum estimates of Antarctic basal melt
rate changes, solely driven by relative sea-level variations.
Under Last Glacial Maximum sea-level conditions, this effect would lead to a substantial decrease of present-day sub-shelf melt rates in East Antarctica, while the strong subsidence of bedrock in West Antarctica can lead up to a doubling of basal melt rates. For a hypothetical globally ice-free sea-level
scenario, which would lead to a global mean (barystatic) sea-level rise of around +70 m, sub-shelf melt rates for a present-day ice sheet geometry can more than double in East Antarctica, but can also decrease substantially, where bedrock uplift dominates. Also for projected sea-level changes at the
year 2300 we find maximum possible changes of ±20 % in sub-shelf melt rates, as a consequence of relative sea-level changes only.

How to cite: Kreuzer, M., Albrecht, T., Nicola, L., Reese, R., and Winkelmann, R.: Oceanic gateways in Antarctica - Impact of relative sea-level change on sub-shelf melt, EGU General Assembly 2024, Vienna, Austria, 14–19 Apr 2024, EGU24-19165, https://doi.org/10.5194/egusphere-egu24-19165, 2024.

EGU24-20197 | ECS | Posters on site | CR2.2

Constraining projections of future freshwater fluxes from Antarctica  

Violaine Coulon, Javier Blasco, Qing Qin, Jan De Rydt, and Frank Pattyn

As global temperatures rise, Antarctica's grounded ice sheet and floating ice shelves are experiencing accelerated mass loss, releasing meltwater into the Southern Ocean. This increasing freshwater discharge poses significant implications for global climate change. Despite these consequences, interactive ice sheets and ice shelves have generally not been included in coupled climate model simulations, such as those in CMIP6. Consequently, CMIP6 projections lack a detailed representation of spatiotemporal trends in ice-sheet freshwater fluxes and their impact on the global climate system, introducing major uncertainties in future climate and sea-level projections. To address this, we provide future Antarctic freshwater forcing data and uncertainty estimates for climate models. These are derived from an ensemble of historically calibrated standalone ice sheet model projections, produced with the Kori-ULB ice flow model, under different climate scenarios up to 2300. Here, we analyse spatiotemporal trends in calving rates, ice shelf basal melt and surface mass balance for all Antarctic ice shelves. 

How to cite: Coulon, V., Blasco, J., Qin, Q., De Rydt, J., and Pattyn, F.: Constraining projections of future freshwater fluxes from Antarctica , EGU General Assembly 2024, Vienna, Austria, 14–19 Apr 2024, EGU24-20197, https://doi.org/10.5194/egusphere-egu24-20197, 2024.

EGU24-20332 | ECS | Orals | CR2.2

The effect of Pacific climatology on the North American Ice Sheet at the Last Glacial Maximum 

William J. Dow, Sam Sherriff-Tadano, Lauren J. Gregoire, and Ruza Ivanovic

Surface ocean conditions and atmospheric dynamics can affect the surface mass balance (SMB) of remote ice sheets via their influence on heat and moisture transport. Here, we use the FAMOUS-ice coupled climate-ice sheet model, coupled to a slab ocean, to simulate the Last Glacial Maximum (LGM). The model was run hundreds of times to produce a large ensemble that captures a range of uncertain model inputs (parameter values). We investigate the range of simulated atmospheric circulation patterns in the 16 ‘best’ ensemble members based on constraints, such as global temperature, their relationship to sea surface conditions in the North Pacific and the interactions with the North American ice sheet. We present evidence of upper tropospheric planetary waves that facilitate communication between the tropical Pacific and extratropical Laurentide ice sheet region, yet there are clear differences in upper tropopsheric dynamics when compared to recent historical period. There is limited evidence for this tropical-extra-tropical relationship being directly responsible for regional differences in Laurentide SMB evolution.

How to cite: Dow, W. J., Sherriff-Tadano, S., Gregoire, L. J., and Ivanovic, R.: The effect of Pacific climatology on the North American Ice Sheet at the Last Glacial Maximum, EGU General Assembly 2024, Vienna, Austria, 14–19 Apr 2024, EGU24-20332, https://doi.org/10.5194/egusphere-egu24-20332, 2024.

EGU24-21079 | Orals | CR2.2

Understanding conditions leading to WAIS collapse, from the Last Interglacial to the modern 

Mira Berdahl, Gunter Leguy, Eric Steig, William Lipscomb, Bette Otto-Bliesner, Nathan Urban, Ian Miller, and Harriet Morgan

It is virtually certain that the West Antarctic Ice Sheet (WAIS) collapsed during past warm periods in Earth’s history, prompting concerns about the potential recurrence under anthropogenic climate change. Despite observed ice shelf thinning in the region, the combination of climate forcing and ice sheet sensitivity driving these changes remains unclear. Here, we investigate the joint effects of climate forcing and ice sheet sensitivity to evaluate conditions leading to WAIS collapse. We run ensembles of the Community Ice Sheet Model (CISM), spun up to a pre-industrial state, and apply climate anomalies from the Last Interglacial (LIG, 129 to 116 yr ago), and the future (SSP2-4.5).  Forcing is derived from Community Earth System Model (CESM2) global simulations. We find that only modest ocean warming is required to cause significant WAIS mass loss, though such loss takes multiple centuries to millennia to manifest.

How to cite: Berdahl, M., Leguy, G., Steig, E., Lipscomb, W., Otto-Bliesner, B., Urban, N., Miller, I., and Morgan, H.: Understanding conditions leading to WAIS collapse, from the Last Interglacial to the modern, EGU General Assembly 2024, Vienna, Austria, 14–19 Apr 2024, EGU24-21079, https://doi.org/10.5194/egusphere-egu24-21079, 2024.

EGU24-348 | ECS | Orals | CR3.3

Ridge-formation simulations in three dimensions using discrete element methods 

Marek Muchow and Arttu Polojärvi

Sea-ice ridges form as a part of sea-ice deformation, while the ice is moved by winds and ocean currents. While ridging is a localized process, it is assumed to limit the compressive strength of sea ice in large scale. However, formulations of large-scale ice strength, as used in Earth System Models, do not consider individual ridge formation processes in detail. Thus, it is necessary to understand the energy spend in ridge formation and various processes related to generating ice rubble and redistributing it. To investigate ridge formation in detail, we use the Aalto University in-house discrete-element-method (DEM) model. This three-dimensional DEM model features deformable, multi-fracturing, ice floes, which can fail and form ridges when coming into contact, while recording the ridging forces. With this, we discuss why three-dimensional simulations are important to investigate ridge formation process.

How to cite: Muchow, M. and Polojärvi, A.: Ridge-formation simulations in three dimensions using discrete element methods, EGU General Assembly 2024, Vienna, Austria, 14–19 Apr 2024, EGU24-348, https://doi.org/10.5194/egusphere-egu24-348, 2024.

EGU24-1671 | ECS | Posters on site | CR3.3

Monthly Arctic sea ice prediction based on a data-driven deep learning model  

Xiaohe Huan, Jielong Wang, and Zhongfang Liu

There is growing interest in sub-seasonal to seasonal predictions of Arctic sea ice due to its potential effects on midlatitude weather and climate extremes. Current prediction systems are largely dependent on physics-based climate models. While climate models can provide good forecasts for Arctic sea ice at different timescales, they are susceptible to initial states and high computational costs. Here we present a purely data-driven deep learning model, UNet-F/M, to predict monthly sea ice concentration (SIC) one month ahead. We train the model using monthly satellite-observed SIC for the melting and freezing seasons, respectively. Results show that UNet-F/M has a good predictive skill of Arctic SIC at monthly time scales, generally outperforming several recently proposed deep learning models, particularly for September sea-ice minimum. Our study offers a perspective on sub-seasonal prediction of future Arctic sea ice and may have implications for forecasting weather and climate in northern midlatitudes.

How to cite: Huan, X., Wang, J., and Liu, Z.: Monthly Arctic sea ice prediction based on a data-driven deep learning model , EGU General Assembly 2024, Vienna, Austria, 14–19 Apr 2024, EGU24-1671, https://doi.org/10.5194/egusphere-egu24-1671, 2024.

EGU24-2377 | ECS | Posters on site | CR3.3

Multivariate state and parameter estimation using data assimilation in a Maxwell-Elasto-Brittle sea ice model 

Yumeng Chen, Polly Smith, Alberto Carrassi, Ivo Pasmans, Laurent Bertino, Marc Bocquet, Tobias Sebastian Finn, Pierre Rampal, and Véronique Dansereau

In an idealised setup, a dynamics-only sea ice model is used to investigate the fully multivariate state and parameter estimations that uses a novel Maxwell-Elasto-Brittle (MEB) sea ice rheology. In the fully multivariate state estimation, the level of damage, internal stress and cohesion are estimated along with the observed sea ice concentration, thickness and velocity. In the case of parameter estimation, we estimate the air drag coefficient and the damage parameter of the MEB model. The air drag coefficients adjust the strength of the forcing on the sea ice dynamics while the damage parameter controls the mechanical behaviour of the internal property of sea ice. We show that, with the current observation network, it is possible to improve all model state forecast and the parameter accuracy using data assimilation approaches even though problems could arise in such an idealised setup where the external forcing dominates the model forecast error growth.

How to cite: Chen, Y., Smith, P., Carrassi, A., Pasmans, I., Bertino, L., Bocquet, M., Finn, T. S., Rampal, P., and Dansereau, V.: Multivariate state and parameter estimation using data assimilation in a Maxwell-Elasto-Brittle sea ice model, EGU General Assembly 2024, Vienna, Austria, 14–19 Apr 2024, EGU24-2377, https://doi.org/10.5194/egusphere-egu24-2377, 2024.

EGU24-3367 | ECS | Orals | CR3.3

Perscribing Antarctic landfast sea ice in a sea ice-ocean model. 

Noé Pirlet, Thierry Fichefet, Martin Vancoppenolle, Clément Rousset, Pierre Mathiot, Alexander Fraser, Antoine Barthélemy, and Christoph Kittel

The coastal polynyas of the Southern Ocean play a crucial role in the formation of dense water and have an impact on the stability of ice shelves. Therefore, it is important to accurately simulate them in climate models. To achieve this goal, the relationship between grounded icebergs, landfast ice and polynyas appears to be central. Indeed, grounded icebergs and landfast ice are believed to be key drivers of coastal polynyas. However, ESMs do not simulate Antarctic landfast ice. Moreover, at a circumpolar scale, there are no observations of grounded icebergs available. Hence, we must seek model representations that can overcome these issues. To address these gaps, we conducted a study using an antarctic circumpolar configuration of the ocean–sea ice model NEMO4.2-SI–3 at the 1/4° resolution. We ran two simulations for the period 2001–17, with the only difference being the inclusion or exclusion of landfast ice information based on observations. All other factors, including initial conditions, resolution and atmospheric forcings, were kept the same. We then compared the results of these simulations with observations from the advanced microwave scanning radiometer to evaluate the performance of the new simulation. Our analysis allowed us to determine the extent to which prescribing the distribution of landfast ice and setting the sea ice velocity to zero on landfast ice regions influenced various aspects of the sea ice, such as polynyas, landfast ice and sea ice distribution in the model. In the future, we plan to look at the impact on the ocean and to develop a physical parameterization in order to model landfast ice and consequently polynyas on a permanent basis.

How to cite: Pirlet, N., Fichefet, T., Vancoppenolle, M., Rousset, C., Mathiot, P., Fraser, A., Barthélemy, A., and Kittel, C.: Perscribing Antarctic landfast sea ice in a sea ice-ocean model., EGU General Assembly 2024, Vienna, Austria, 14–19 Apr 2024, EGU24-3367, https://doi.org/10.5194/egusphere-egu24-3367, 2024.

EGU24-4144 | ECS | Orals | CR3.3

A model for ice-mélange based on particle and continuums mechanics 

Saskia Kahl and Carolin Mehlmann

Ice mélange (a mixture of sea ice, bergy bits and icebergs) can have a strong influence on the sea-ice-ocean interaction. So far, ice mélange is not represented in climate models as numerically efficient realizations are missing. This motivates the development of an ice-mélange model based on the viscous-plastic sea-ice rheology, which is currently the most commonly used material law for sea ice in climate models. Starting from the continuum mechanical formulation, we modify the rheology so that icebergs are represented by thick, highly compact pieces of sea ice. These compact pieces of sea ice are held together by a modified tensile strength in the material law. In this framework, the ice mélange is considered as one single fluid, where the icebergs are realised by particles.
Using idealized test cases, we demonstrate that the proposed changes in the material law are crucial to represent icebergs with the viscous-plastic rheology. Similar to the viscous-plastic sea-ice model, the ice-mélange model is highly nonlinear. Solving the model at the resolution needed to represent the typical size of icebergs in ice mélange (< 300m) is therefore challenging. We show that the ice-mélange formulation can be approximated efficiently with a modified Newton's method. Overall, the simple extension of the viscous-plastic sea-ice model is a promising path towards the integration of ice mélange into climate models.

How to cite: Kahl, S. and Mehlmann, C.: A model for ice-mélange based on particle and continuums mechanics, EGU General Assembly 2024, Vienna, Austria, 14–19 Apr 2024, EGU24-4144, https://doi.org/10.5194/egusphere-egu24-4144, 2024.

Rapid decline of Arctic sea ice has created more open water for ocean wave development and highlighted the importance of wave-ice interactions in the Arctic. Some studies have made contributions to our understanding of the potential role of the prognostic floe size distribution (FSD) on sea ice changes. However, these efforts do not capture the full interactions between atmosphere, ocean, wave, and sea-ice. In this study, a modified joint floe size and thickness distribution (FSTD) is implemented in a newly-developed regional atmosphere-ocean-wave-sea ice coupled model and a series of pan-Arctic simulation is conducted with different physical configurations related to FSD changes, including FSD-fixed, FSD-varied, lateral melting rate, wave-fracturing formulation, and wave attenuation rate. Firstly, atmosphere-ocean-wave-sea ice coupled simulations show that the prognostic FSD leads to reduced ice area due to enhanced ice-ocean heat fluxes, but the feedbacks from the atmosphere and the ocean partially offset the reduced ice area induced by the prognostic FSD. Secondly, lateral melting rate formulations do not change the simulated FSD significantly, but they influence the flux exchanges across atmosphere, ocean, and sea-ice and thus sea ice responses. Thirdly, the changes of FSD are sensitive to the simulated wave parameters associated with different wave-fracturing formulations and wave attenuation rates, and the limited oceanic energy imposes a strong constraint on the response of sea ice to FSD changes. Finally, the results also show that wave-related physical processes can have impacts on sea ice changes with the constant FSD, indicating the indirect influences of ocean waves on sea-ice through the atmosphere and the ocean.

How to cite: Yang, C.-Y. and Liu, J.: Understanding influence of ocean waves on Arctic sea ice simulation: A modeling study with an atmosphere-ocean-wave-sea ice coupled model, EGU General Assembly 2024, Vienna, Austria, 14–19 Apr 2024, EGU24-4502, https://doi.org/10.5194/egusphere-egu24-4502, 2024.

EGU24-5177 | ECS | Posters on site | CR3.3

Improving the representation of snow over sea-ice in the SI3 model 

Theo Brivoal, Virginie Guemas, Clement Rousset, and Martin Vancoppenolle

Snow plays a crucial role in the formation and sustainability of sea ice. Due to its thermal properties, snow acts as an insulating layer, shielding the ice from the air above. This insulation reduces the heat transfer between the sea-ice and the atmosphere. Due to its reflective properties, the snow cover also strongly contributes to albedo over ice-covered region, which gives it a significant role in the Earth's climate system.

Current state-of-art climate models use over-simple representations of the snow cover. The snow cover is often represented with a one-layer scheme, assuming a constant density, no wet or dry metamorphism or assuming that no liquid water is stored in the snow. Here, we present the integration of a more advanced snow scheme (ISBA-ES) into the sea-ice model SI3, which serves as the sea-ice component for upcoming versions of the CNRM climate model (CNRM-CM). We compare 1D simulations over the Arctic using this new scheme with observational data and simulations utilizing the previous SI3 snow scheme. Overall, the snow simulated by the ISBA-ES scheme is realistic. We also present a sensitivity analysis of the snow and sea-ice in the SI3 model, exploring various options in the ISBA-ES scheme. Our findings reveal a strong sensitivity of both the snow and the sea-ice to the representation of liquid water in snow and the parameterization employed for calculating snowfall density.

How to cite: Brivoal, T., Guemas, V., Rousset, C., and Vancoppenolle, M.: Improving the representation of snow over sea-ice in the SI3 model, EGU General Assembly 2024, Vienna, Austria, 14–19 Apr 2024, EGU24-5177, https://doi.org/10.5194/egusphere-egu24-5177, 2024.

EGU24-5374 | ECS | Orals | CR3.3

Floe-scale ocean / sea ice energy transfers in the marginal ice zone 

Mukund Gupta, Andrew Thompson, and Patrice Klein

Marginal ice zones are regions where individual sea ice floes interact mechanically and thermodynamically with turbulent ocean currents at the (sub-)mesoscale. Fine scale exchanges of momentum, heat and salinity at the interface between the ocean and the sea ice floes have important effects on upper-ocean energetics, under-ice tracer mixing, and the ice-pack melt rates. The dynamics of these moving floes remain poorly constrained, notably due to the challenge of numerically resolving sub-mesoscale processes and modelling the discrete behavior of sea ice in traditional climate models. 

Here, we use oceanic Large Eddy Simulations (LES), two-way coupled to a Discrete Element Model (DEM) of disk-shaped sea ice floes, to quantify the kinetic energy transfers between ocean and sea ice during summer-like conditions, varying sea ice concentration and floe size distribution. The damping of oceanic currents by floes is found to be important for a sea ice concentration as low as 40%, when the sizes of floes are comparable to the characteristic eddy size. This damping is largely compensated by the generation of kinetic energy due to melt-induced baroclinic instability at the edge of sea ice floes, leading to a net energy sink of approximately 15%, relative to a simulation with no floes. At higher sea ice concentrations, the oceanic kinetic energy production weakens, while energy loss due to ice/ocean damping and floe-floe collisions both increase. These energy fluxes are mediated by the spatial aggregation of sea ice floes that occurs within the high-strain regions surrounding ocean mesoscale eddies. Eddy-driven aggregation can also reduce the melt rate of small floes as they become shielded from warm waters by neighboring larger floes. These results highlight the need for scale-aware, and specifically floe-scale parameterizations of sea ice and its coupling to ocean turbulence, within global climate models.

How to cite: Gupta, M., Thompson, A., and Klein, P.: Floe-scale ocean / sea ice energy transfers in the marginal ice zone, EGU General Assembly 2024, Vienna, Austria, 14–19 Apr 2024, EGU24-5374, https://doi.org/10.5194/egusphere-egu24-5374, 2024.

EGU24-6441 | ECS | Posters on site | CR3.3

Application of mixed least-squares FEM to study sea ice dynamics 

Sonja Hellebrand, Carina Schwarz, and Jörg Schröder

The behavior of sea ice has been studied for many decades. In order to model its viscous-plastic behavior at scales spanning several thousand kilometers, different numerical models have been proposed. Based on the established approach in [1], this contribution presents a simulation model for sea ice dynamics to describe the sea ice circulation and its evolution over one seasonal cycle. In course of that, the sea ice concentration and the sea ice thickness are considered, of which the physical behavior is governed by transient advection equations. Here, the sea ice velocity serves as coupling field.

Recently developed approaches base on a finite element implementation choosing a (mixed) Galerkin variational approach, see e.g. [2] and [3]. But therein, challenges may occur regarding the stability of the numerically complex scheme, especially when dealing with the first-order advection equations. Thus, we propose the application of the mixed least-squares finite element method, which has the advantage to be also applicable to first-order systems, i.e., it provides stable and robust formulations even for non-self-adjoint operators, such as the tracer equations (for sea ice thickness and sea ice concentration).

For solving the instationary sea ice equation the presented least-squares finite element formulation takes into account the balance of momentum and a constitutive law for the viscous-plastic flow. The considered primary fields are the stresses σ, the velocity v, the concentration Aice and the thickness Hice. In relation, four residuals are defined for the derivation of a first-order least-squares formulation based on the balance of momentum, the constitutive relation for the stresses, and two tracer-equations. Different approaches can be made with respect to the approximation functions of the primary fields, i.e., choosing e.g. conforming (H(div) interpolation functions) or non-conforming (Lagrangian interpolation functions) stress approximations, while Lagrangian interpolation functions are chosen for the remaining fields. In order to compare such approaches, the box test case is utilized, cf. [3], which is well described in literature.

References:

[1] W.D. Hibler III. A dynamic thermodynamic sea ice model. Journal of Physical Oceanography, 9(4):815-846, 1979.

[2] S. Danilov, Q. Wang, R. Timmermann, M. Iakovlev, D. Sidorenko, M. Kimmritz, T. Jung. Finite-Element Sea Ice Model (FESIM), Version 2. Geoscientific Model Development, 8:1747-1761, 2015.

[3] C. Mehlmann and T. Richter. A modified global Newton solver for viscous-plastic sea ice models. Ocean Modelling, 116:96-107, 2017.

How to cite: Hellebrand, S., Schwarz, C., and Schröder, J.: Application of mixed least-squares FEM to study sea ice dynamics, EGU General Assembly 2024, Vienna, Austria, 14–19 Apr 2024, EGU24-6441, https://doi.org/10.5194/egusphere-egu24-6441, 2024.

EGU24-6569 | ECS | Posters on site | CR3.3

Using discrete element methods to understand in-plane fragmentation of sea ice floes 

Adam Bateson, Daniel Feltham, David Schröder, Scott Durski, Jennifer Hutchings, Rajlaxmi Basu, and Byongjun Hwang

Sea ice floe size can impact several processes that determine the evolution of the Arctic sea ice, including lateral melt volume, momentum exchange, and rheology. Floe size distribution (FSD) models are applied within continuum sea ice models to capture the evolution of the FSD through parameterisations of the processes that modify floe size such as lateral melting and wave break-up of floes. FSD models do not yet adequately resolve in-plane fragmentation processes of floes such as the breakup of floes under wind forcing, through interactions between neighbouring floes, or through thermal weakening. It is challenging to characterise and therefore parameterise these in-plane floe breakup processes due to limited availability of in-situ observations. Discrete element models (DEMs) offer an alternative way to understand the different mechanisms of floe fragmentation. By resolving relevant properties such as shear and normal stress and sea ice strength at the sub-floe scale, it is possible to use DEMs as a virtual laboratory and directly simulate the break-up of floes into smaller fragments.

In this study, we describe how in-situ observations of sea ice can be combined with output from sea ice DEMs to develop parameterisations of in-plane breakup of floes that can then be applied in continuum models. We then discuss the necessary model developments in order to apply a sea ice DEM to floe fragmentation at smaller scales. We will also present results from a series of DEM simulations used to model the fracture of sea ice under different forcing conditions and with varying sea ice states to identify the important sea ice parameters and processes in determining the size of the floes that form from in-plane breakup events.

How to cite: Bateson, A., Feltham, D., Schröder, D., Durski, S., Hutchings, J., Basu, R., and Hwang, B.: Using discrete element methods to understand in-plane fragmentation of sea ice floes, EGU General Assembly 2024, Vienna, Austria, 14–19 Apr 2024, EGU24-6569, https://doi.org/10.5194/egusphere-egu24-6569, 2024.

Arctic sea ice has experienced a differential decline in speed due to the same anthropogenic greenhouse gas forcing, as evidenced by rapid decline after the end of the last century. Our convergent observations, last-millennium reanalysis, and model analyses have revealed that large tropical volcanic eruptions can lead to a decadal increase in Arctic sea ice, and the 1982 and 1991 large volcanic eruptions slowed down the decline of Arctic sea ice during the last century. The models, selected based on the observed sensitivity of Arctic sea ice to volcanic eruptions, suggest that the earliest ice-free summer year in the Arctic will be around 2040 in high-emission sceneria of SSP585. These findings emphasized the crucial need to incorporate volcanic influences when projecting future Arctic changes amid global warming.

How to cite: Wang, X.: Historical volcanic eruptions slowed down rapid decline in Arctic sea ice linked to global warming, EGU General Assembly 2024, Vienna, Austria, 14–19 Apr 2024, EGU24-9554, https://doi.org/10.5194/egusphere-egu24-9554, 2024.

EGU24-9802 | ECS | Posters virtual | CR3.3

The sea ice component of MUSE, the unstructured-mesh global ocean model of CMCC 

Francesco Cocetta, Lorenzo Zampieri, and Doroteaciro Iovino

The rapidly evolving sea ice cover requires novel modeling approaches and mathematical techniques to accurately simulate the sea ice dynamics, thermodynamics, and its interactions with the atmosphere and ocean at varying spatiotemporal resolutions. In this context, the CMCC is developing the Multiscale Unstructured model for Simulating the Earth’s water environment (MUSE), a novel global ocean-sea ice model on unstructured meshes.

MUSE employs a finite-element numerical discretization on unstructured meshes, aiming at offering flexibility in simulating the global ocean for various applications, ranging from physical process understanding to operational sea ice predictions. The ongoing implementation of the sea ice component utilizes the traditional continuous sea ice formulation and the 2+1 split assumption, meaning that the sea ice dynamics and advection are solved for horizontal motions while the thermodynamics and radiative processes are parameterized at the subgrid scale.   

MUSE employs a modified elastic-viscous-plastic (mEVP) solver for the sea ice dynamics and a Flux Corrected Transport (FCT) advection scheme, alongside the state-of-the-art column physics package "Icepack" maintained by the CICE consortium.

Here, we describe the global implementation of the sea ice component in MUSE and its coupling with the ocean. We present the resulting representation of vertical thermodynamic processes and horizontal dynamics of sea ice.

How to cite: Cocetta, F., Zampieri, L., and Iovino, D.: The sea ice component of MUSE, the unstructured-mesh global ocean model of CMCC, EGU General Assembly 2024, Vienna, Austria, 14–19 Apr 2024, EGU24-9802, https://doi.org/10.5194/egusphere-egu24-9802, 2024.

EGU24-10098 | Posters on site | CR3.3

Best of SIDFEx: Highlights and lessons learned from six years of sea-ice drift forecasting 

Simon F. Reifenberg, Valentin Ludwig, and Helge F. Goessling and the SIDFEx Team

We showcase the Sea Ice Drift Forecast Experiment (SIDFEx) database. SIDFEx is a collection of close to 225,000 lagrangian drift forecasts for the trajectories of assets (mostly buoys) on the Arctic and Antarctic sea ice, at lead times from daily to seasonal with mostly daily resolution. The forecasts are based on systems with varying degrees of complexity, ranging from free-drift forecasts to forecasts by fully coupled dynamical general circulation models. Combining several independent forecasts allows us to construct a best-guess consensus forecast, with a seamless transition from systems with lead times of up to 10 days to systems with seasonal lead times. The forecasts are generated by 13 research groups using 23 distinct forecasting systems and sent regularly to the Alfred-Wegener-Institute, where they are archived and evaluated. Many groups send forecasts operationally in near-real time.

In our presentation, we will introduce the motivation behind and setup of SIDFEx, as well as an overview on the general forecast skill. We will focus on selected highlights, comprising the operational support of research cruises, short-term predictions of sea-ice deformation and regular contributions to the Sea Ice Outlook competition.

How to cite: Reifenberg, S. F., Ludwig, V., and Goessling, H. F. and the SIDFEx Team: Best of SIDFEx: Highlights and lessons learned from six years of sea-ice drift forecasting, EGU General Assembly 2024, Vienna, Austria, 14–19 Apr 2024, EGU24-10098, https://doi.org/10.5194/egusphere-egu24-10098, 2024.

EGU24-11288 | Orals | CR3.3

Towards improving numerical sea ice predictions with data assimilation and machine learning 

William Gregory, Mitchell Bushuk, Yongfei Zhang, Alistair Adcroft, and Laure Zanna

In this presentation we highlight recent developments in the implementation of Machine Learning (ML) algorithms into the large-scale sea ice model, SIS2. Specifically, we show how a Convolutional Neural Network (CNN) can be used to systematically reduce global sea ice biases during a 5-year ice-ocean simulation. The CNN has been trained to learn a functional mapping from model state variables to sea ice concentration Data Assimilation (DA) increments. Therefore, during model integration, the CNN ingests information about the numerical model's atmosphere, ocean, and sea ice conditions, and predicts the appropriate correction to the sub-grid category sea ice concentration terms (without seeing any actual sea ice observations). We also show how this combined DA+ML approach leads to a natural framework for augmenting training data for neural networks; one which can lead to significant improvements in online performance, without the need for direct online learning. The bias reductions over the 5-year simulation period for this CNN correction scheme are even competitive with the bias reductions achieved from DA. These findings therefore suggest that our approach could be used to reduce systematic sea ice biases in fully coupled climate model predictions on seasonal-to-climate timescales.

How to cite: Gregory, W., Bushuk, M., Zhang, Y., Adcroft, A., and Zanna, L.: Towards improving numerical sea ice predictions with data assimilation and machine learning, EGU General Assembly 2024, Vienna, Austria, 14–19 Apr 2024, EGU24-11288, https://doi.org/10.5194/egusphere-egu24-11288, 2024.

EGU24-11413 | Posters virtual | CR3.3

Sea ice strength in SI3 

Emma Fiedler, Ed Blockley, Clement Rousset, and Martin Vancoppenolle

The NEMO sea ice model, SI3, includes the simple formulation of Hibler (1979; H79) to parameterise the compressive strength of sea ice. This assumes that thick and compact sea ice has more strength than thin and low concentration sea ice. However, the H79 strength scheme does not consider physical assumptions around energy conservation. The strength scheme of Rothrock (1975; R75) is based on the amount of potential energy gained and frictional energy dissipated during ridging, and has been introduced to SI3. Additionally, the option for a negative exponential redistribution of ridged ice among thickness categories, to better approximate observations and improve stability compared to the existing uniform redistribution when using R75, has been included. The R75 strength formulation is stable and works well in SI3 at version 4.2 with an EVP rheology, under a Met Office forced NEMO/SI3 model configuration. Sea ice strength is generally reduced for the R75 scheme compared to H79. The most notable effect on the model output is a greater number of, and sharper, features in the resulting modelled ice field when using the R75 scheme compared to the H79 scheme, which are particularly apparent in the ice thickness field. An increase in the model effective resolution is therefore demonstrated.

How to cite: Fiedler, E., Blockley, E., Rousset, C., and Vancoppenolle, M.: Sea ice strength in SI3, EGU General Assembly 2024, Vienna, Austria, 14–19 Apr 2024, EGU24-11413, https://doi.org/10.5194/egusphere-egu24-11413, 2024.

EGU24-11908 | ECS | Orals | CR3.3

A data-driven sea-ice model with generative deep learning 

Tobias Sebastian Finn, Charlotte Durand, Flavia Porro, Alban Farchi, Marc Bocquet, Yumeng Chen, and Alberto Carrassi

The current generation of sea-ice models with Brittle rheologies can represent the observed temporal and spatial scaling of the sea-ice dynamics at resolutions of around 10 km. However, running those models is expensive, which can prohibit their use in coupled Earth system models. The promising results of neural networks for the fast prediction of the sea-ice extent or sea-ice thickness offer an opportunity to remedy this shortcoming. Here, we present the development of a data-driven sea-ice model based on generative deep learning that predicts together the sea-ice velocities, concentration, thickness, and damage. Trained with more than twenty years of simulation data from neXtSIM, the model can extrapolate to previously unseen conditions, thereby exceeding the performance of baseline models.

Relying on deterministic data-driven models can lead to overly smoothed predictions, caused by a loss of small-scale information. This is why the ability to perform stochastic predictions can be instrumental to the success of data-driven sea-ice models. To generate stochastic predictions with neural networks, we employ denoising diffusion models. We show that they can predict the uncertainty that remains unexplained by deterministic models. Furthermore, diffusion models can recover the information at all scales. This resolves the issues with the smoothing effects and results in sharp predictions even for longer horizons. Therefore, we see a huge potential of generative deep learning for sea-ice modelling, which can pave the way towards the use of data-driven models within coupled Earth system models.

How to cite: Finn, T. S., Durand, C., Porro, F., Farchi, A., Bocquet, M., Chen, Y., and Carrassi, A.: A data-driven sea-ice model with generative deep learning, EGU General Assembly 2024, Vienna, Austria, 14–19 Apr 2024, EGU24-11908, https://doi.org/10.5194/egusphere-egu24-11908, 2024.

EGU24-12451 | ECS | Posters on site | CR3.3

Development of ship navigation risk indicator in sea ice-infested water 

Xinfang Zhang

There's increasing transpolar shipping in both the Arctic and Antarctic as a result of the reduction of sea ice and the desire from social economics.  Sea ice is a hazard for shipping in ice-infested water, Ship navigability in ice-covered sea depends on sea ice concentration, ice thickness, fraction of pressure ridges, and multi-year ice as well as ice speed and compression, it also depends on the vessel ice class. IMO introduced Risk Index Outcome(RIO) to provide guidelines for safe navigation, calculation of RIO requires accurate sea ice information including sea ice concentration and thickness. We developed a method similar to RIO to calculate navigation risk indicators using forecasting models including ECMWF S2S data, Copernicus data, and DMI data. Other than conventional sea ice parameters sea ice concentration and sea ice thickness, ice salinity, and ice age are also taken into account in risk indicator calculation. We select the time March 2019 -Oct 2020 and adopt the initial condition of the model forecast for sea ice to demonstrate the capabilities of seasonal forecasting of this navigation risk indicator in different models. In future, the calculation method will be implemented within the ClimateDT environment.

How to cite: Zhang, X.: Development of ship navigation risk indicator in sea ice-infested water, EGU General Assembly 2024, Vienna, Austria, 14–19 Apr 2024, EGU24-12451, https://doi.org/10.5194/egusphere-egu24-12451, 2024.

EGU24-12804 | Posters on site | CR3.3

 A laboratory model of fragmentation of a 2D membrane by waves. Analogies and differences with sea ice. 

Michael Berhanu, Louis Saddier, Mathéo Aksil, Palotai Ambre, and Michel Tsamados

The marginal ice zone is the transition region between the dense floating ice pack and the open ocean. In this zone, the interaction of surface waves with sea ice is highly complex. The sea ice is broken up into fragments, the floes, which can split into smaller parts and drift under the action of waves and underwater current. Although the downscaling is challenging, laboratory model experiments can contribute to a better understanding of this process coupling fluid and solid mechanics on a large range of time and space scales. We propose to study the fragmentation of a floating membrane, made up of 10 µm graphite particles arranged in a monolayer, by gravity surface waves with a wavelength of around 15 cm [1]. For a sufficiently strong wave amplitude, the raft progressively breaks up, developing cracks and producing fragments whose sizes decrease over a time scale that is long relative to the wave period. We then study the distribution of the fragments produced during the fragmentation process. The visual appearance of the size-distributed fragments surrounded by open water bears a striking resemblance to the floes produced by the fracturing of sea ice by waves. The fragmentation concepts and morphological tools developed for sea ice floes can be applied to our macroscopic analog. Although the mechanics of the two systems differ in their physical properties and in the fracture process, our experiment provides a model laboratory system for studying the fragmentation of floating 2D materials


[1] Saddier, L., Palotai, A., Aksil, M., Tsamados, M., & Berhanu, M. (2023). Breaking of a floating particle raft by water waves. In arXiv preprint arXiv:2310.16188.

How to cite: Berhanu, M., Saddier, L., Aksil, M., Ambre, P., and Tsamados, M.:  A laboratory model of fragmentation of a 2D membrane by waves. Analogies and differences with sea ice., EGU General Assembly 2024, Vienna, Austria, 14–19 Apr 2024, EGU24-12804, https://doi.org/10.5194/egusphere-egu24-12804, 2024.

EGU24-12912 | Orals | CR3.3

Improvements in September Arctic sea ice predictions via assimilation of summer CryoSat-2 sea ice thickness observations 

Yong-Fei Zhang, Mitch Bushuk, Michael Winton, Bill Hurlin, William Gregory, Jack Landy, and Liwei Jia

Because of a spring predictability barrier, the seasonal forecast skill of Arctic summer sea ice is limited by the availability of melt-season sea ice thickness (SIT) observations. The first year-round SIT observations, retrieved from CryoSat-2 from 2011 to 2020, are assimilated into the GFDL ocean–sea ice model. The model's SIT anomaly field is brought into significantly better agreement with the observations, particularly in the Central Arctic. Although the short observational period makes forecast assessment challenging, we find that the addition of May–August SIT assimilation improves September local sea ice concentration (SIC) and extent forecasts similarly to SIC-only assimilation. Although most regional forecasts are improved by SIT assimilation, the Chukchi Sea forecasts are degraded. This degradation is likely due to the introduction of negative correlations between September SIC and earlier SIT introduced by SIT assimilation, contrary to the increased correlations found in other regions.

How to cite: Zhang, Y.-F., Bushuk, M., Winton, M., Hurlin, B., Gregory, W., Landy, J., and Jia, L.: Improvements in September Arctic sea ice predictions via assimilation of summer CryoSat-2 sea ice thickness observations, EGU General Assembly 2024, Vienna, Austria, 14–19 Apr 2024, EGU24-12912, https://doi.org/10.5194/egusphere-egu24-12912, 2024.

EGU24-13528 | ECS | Orals | CR3.3

A MAGICC Arctic Sea Ice Emulator 

Sian Chilcott, Malte Meinshausen, and Dirk Notz

CMIP6 models present our best understanding of the Earth system, yet they currently fail to simulate a plausible evolution of sea ice area to changes in the global-mean temperature. We aim to assess whether correcting the temperature and Arctic Amplification biases between CMIP6 models and observations can simulate a sensitivity of sea ice loss to global warming that is within the plausible range. To do this, we develop an emulator that is calibrated to physically-based CMIP6 models and then constrained to observations. Such a tool efficiently translates the global-mean temperature of a specific year into a physically-based and observationally constrained probabilistic ensemble of SIA in each month. This setup allows our emulator to capture the core physical processes of CMIP6 projections, while capturing the observed sensitivity of sea ice loss to global warming through the observational constraint of Arctic Amplification. While there are many application possibilities of our emulator, we use our model here to probabilistically diagnose the timing of an ice-free Arctic Ocean. We find that under a high (SSP5-8.5), medium (SSP2-4.5) and low (SSP1-2.6) emission scenario, an ice-free September Ocean is ‘likely’ at 1.73 of global warming above the pre-industrial level, however we note that the probability in the lower emission scenario reduces to ‘unlikely’ in the late 21st century as the global temperature partially recovers. Our projections suggest that the probability of an ice-free summer ocean rises rapidly from ‘unlikely’ at 1.5 of global warming to ‘likely’ at 2 of global warming, stressing the importance of preventing global temperatures rising above 1.5, as the probability of losing sea ice coverage in September rises sharply thereafter. For March, we also find that the observational constraints increase the probability of an ice-free ocean under SSP5-8.5, becoming ‘likely’ in early 2200, while the probability remains very low under SSP2-4.5 and SSP1-2.6 as less than 5% of models reach ice-free conditions. Our projections suggest an ice-free summer ocean could occur at 0.5 cooler levels than the CMIP6 multi-model ensemble mean implies. Likewise, our approach suggests the probability of an ice-free Arctic Ocean year-round is increased when constraining the Arctic Amplification to observations.

How to cite: Chilcott, S., Meinshausen, M., and Notz, D.: A MAGICC Arctic Sea Ice Emulator, EGU General Assembly 2024, Vienna, Austria, 14–19 Apr 2024, EGU24-13528, https://doi.org/10.5194/egusphere-egu24-13528, 2024.

EGU24-15487 | Posters on site | CR3.3

Extended seasonal forecast of Antarctic Sea Ice using ANTSIC-UNet 

Ziying Yang, Jiping Liu, and Rune Grand Graversen

Antarctic sea-ice variability affects the ocean and atmosphere both locally through thermodynamic processes and beyond the Antarctic regions remotely through dynamic processes, which may all change due to global warming. In this study, we develop the ANTSIC-UNet, a deep-learning model trained on physically enriched climate variables, to predict the extended seasonal Antarctic sea ice concentration of up to 6 months in advance. We assess the predictive skill of ANTSIC-UNet as regards linear trend prediction and anomaly persistence prediction in the Pan- and regional Antarctic areas using comparative analyses with two baseline models. Our results exhibit superior performance of ANTSIC-UNet for the extended seasonal Antarctic forecast. The predictive skill of ANTSIC-UNet is notably season-dependent, showing distinct variations across regions. Optimal prediction accuracy is found in winter, while diminished skill found during the summer can be largely attributed to the ice-edge error. High predictive skills are found in the Weddell Sea throughout the year, which suggests that regional Antarctic sea-ice predictions beyond 6 months are possible. We further quantify variable importance through a post-hoc interpretation method which indicates that ANTSIC-UNet has learned the relationships between SIC and other climate variables and the method therefore provides information on the physics of the model. At short lead times, on timescales of up to two months, ANTSIC-UNet predictions exhibit heightened sensitivity to sea surface temperature, radiation conditions and vertical atmospheric circulation conditions in addition to the sea-ice itself. At longer lead times, predictions are dependent on stratospheric circulation patterns at 7-8 months lead in addition to sea-ice. Furthermore, we discuss the potential of implementing physical constraints to enhance sea-ice-edge predictability.

How to cite: Yang, Z., Liu, J., and Grand Graversen, R.: Extended seasonal forecast of Antarctic Sea Ice using ANTSIC-UNet, EGU General Assembly 2024, Vienna, Austria, 14–19 Apr 2024, EGU24-15487, https://doi.org/10.5194/egusphere-egu24-15487, 2024.

EGU24-18506 | ECS | Orals | CR3.3

Direct Numerical Simulation of shear turbulence interacting with a melting-freezing ice layer 

Diego Perissutti, Francesco Zonta, Alessio Roccon, Cristian Marchioli, and Alfredo Soldati

When a turbulent flow of water interacts with an ice boundary at near-freezing temperature, the fluid can undergo freezing or melting, depending on the local temperature. The turbulence structures that develop in proximity to the ice layer can affect the convective heat transport patterns, leading to the formation of complex phase-boundary morphologies. The ice layer evolves as part of the solution and modifies the near-boundary fluid structures, resulting in heat transfer perturbations. We investigate these ice-water interactions at small scales by performing Direct Numerical Simulations of an open channel flow at shear Reynolds number in the range between 10^2 and 10^3. The upper section of the channel is occupied by ice, while free shear conditions are applied at the bottom. Temperature is imposed on both walls. The ice melting/freezing is simulated using a phase field method [1] combined with a volume penalization immersed boundary method. A pseudo-spectral scheme [2] is used to solve the equations for momentum and energy transport and for phase evolution. We investigated how the behavior of the system changes with the flow conditions (i.e. Reynolds number), with a specific focus on characterizing the features of the ice morphology. In particular, we observed a remarkable influence of turbulence intensity on the ice morphology: at low shear Reynolds, the typical streamwise-oriented canyons already reported in similar studies [3] are present. However, at higher shear Reynolds, spanwise instabilities are triggered, making the final ice morphology more complex.

FIgure1: Render view from below of the open channel flow at a low Reynolds number. On the top section of the channel, the corrugated ice layer is shown. On the ice boundary, the normalized heat flux passing through it is displayed (high heat flux is shown in red, low heat flux in blue). The local temperature field is reported on the side domain boundaries. The typical streamwise-oriented canyons at the ice interface are visible and the heat flux correlates well with those patterns (the heat flux is higher inside the canyons).

[1]R. Yang et al., Morphology evolution of a melting solid layer above its melt heated from below, Journal of Fluid Mechanics, 956, A23, 2023.

[2]F Zonta et al., Nusselt number and friction factor in thermally stratified turbulent channel flow under non-Oberbeck–Boussinesq conditions, International journal of heat and fluid flow, 44:489–494, 2013.

[3]L. A. Couston et al., Topography generation by melting and freezing in a turbulent shear flow, Journal of Fluid Mechanics, 911, A44, 2021.

How to cite: Perissutti, D., Zonta, F., Roccon, A., Marchioli, C., and Soldati, A.: Direct Numerical Simulation of shear turbulence interacting with a melting-freezing ice layer, EGU General Assembly 2024, Vienna, Austria, 14–19 Apr 2024, EGU24-18506, https://doi.org/10.5194/egusphere-egu24-18506, 2024.

EGU24-19333 | Orals | CR3.3

Recent progress in nesting a DEM- based regional sea ice model within a continuum model 

Wenjun Lu, Andrei Tsarau, Yuan Zhang, Raed Lubbad, and Sveinung Løset

Understanding sea-ice dynamics at the floe scale is crucial to improve regional ice forecast and comprehend the polar climate systems. Continuum models are commonly used to simulate large-scale sea-ice dynamics. However, they have both theoretical and computational limitations in accurately representing sea-ice behaviour at small scales. Discrete Element Models (DEMs), on the other hand, are well-suited for modelling the behaviour of individual ice floes but face limitations due to computational constraints. To address the limitations of both approaches while combining their strengths, we explored the feasibility of nesting a DEM within a continuum model. This paper reports recent progresses in addressing two challenges associated with this method: 1) how to couple a discrete element method (DEM) – based model (a Lagrangian model explicitly tracking each element in space) into a continuum model (a Eulerian model with fixed spatial mesh transferring state variables within); 2) how to explicitly model fracture of sea ice at large scales. Based on our assessment, integrating DEM and continuum model simulations showed potential for offering accurate, high-resolution predictions of sea ice, particularly in coastal areas and near islands. Simulating fracture of sea ice still poses great computational challenges. However, we see a potential in a data-driven approach to accelerate the computational efficiency in resolving floe-scale ice fractures.  

How to cite: Lu, W., Tsarau, A., Zhang, Y., Lubbad, R., and Løset, S.: Recent progress in nesting a DEM- based regional sea ice model within a continuum model, EGU General Assembly 2024, Vienna, Austria, 14–19 Apr 2024, EGU24-19333, https://doi.org/10.5194/egusphere-egu24-19333, 2024.

EGU24-22361 | Posters on site | CR3.3

neXtSIM-DG – A next-generation discontinuous Galerkin sea ice model 

Einar Ólason, Timothy Spain, and Thomas Richter and the The neXtSIM team

We present neXtSIM-DG, the novel sea ice model created as part of the Scale Aware Sea Ice Project (SASIP). NeXtSIM-DG is a continuum sea ice model that combines several new model paradigms at once: besides established rheologies, we use the newly developed Brittle Bingham–Maxwell rheology. The discretization is based on higher-order continuous and discontinuous finite elements. We take advantage of the object orientation of the C++ implementation of the model to create a flexible, maintainable, and easily modifiable code base ready for adaptation and adaptation by the user. Finally, the C++ implementation uses modern data structures that allow for efficient shared-memory parallelization and are ready for GPU acceleration. These aspects reflect better the different scales of sea ice dynamics in space and time. In this poster, we review the basic modelling features and present some details of numerical realization. In particular, we study the effect of high-order discretization and the role of different rheologies. 

How to cite: Ólason, E., Spain, T., and Richter, T. and the The neXtSIM team: neXtSIM-DG – A next-generation discontinuous Galerkin sea ice model, EGU General Assembly 2024, Vienna, Austria, 14–19 Apr 2024, EGU24-22361, https://doi.org/10.5194/egusphere-egu24-22361, 2024.

EGU24-3232 | Posters on site | AS4.2

A climatological satellite view of marine cold air outbreaks in the northeast Atlantic 

Abhay Devasthale and Michael Tjernström

Given the high rate of sea ice loss and the Arctic amplification, the dynamical processes responsible for airmass transport into or out of the Arctic, thus affecting the seasonal melt and recovery of sea ice, need to be understood and scrutinized from different observational perspectives. In a classical, rather binary view of transport “into or out of the Arctic”, a lot of attention in the recent years has rightfully been given on understanding the role of heat and moisture transport into the Arctic in regulating the sea ice melt. However, the cold and dry Arctic airmasses with long residence times are more than occasionally transported out of the Arctic over the open ocean waters, creating one of the most spectacular air mass transformations: the marine cold air outbreaks (MCAOs). The most tangible manifestation of MCAOs are the convectively rolled, narrow cloud streets formed over open water off the edges of the Arctic sea ice in the Nordic and Barents Seas, seen vividly in visible satellite imageries. MCAOs can also locally influence the onset of sea ice melt as they often happen in spring.  

By combining nearly 20 years of remotely sensed data from the hyperspectral Atmospheric Infrared Sounder (AIRS), the Moderate Resolution Imaging Spectroradiometer (MODIS) and the Clouds and the Earth’s Radiant Energy System (CERES) instruments onboard NASA’s Aqua satellite, this study presents a climatological view of the vertical structure of atmosphere and the cloud radiative effects during MCAOs in the northeast Atlantic.

How to cite: Devasthale, A. and Tjernström, M.: A climatological satellite view of marine cold air outbreaks in the northeast Atlantic, EGU General Assembly 2024, Vienna, Austria, 14–19 Apr 2024, EGU24-3232, https://doi.org/10.5194/egusphere-egu24-3232, 2024.

EGU24-3662 | ECS | Orals | AS4.2

Non-conservative nature of Boron in low salinity Arctic ice and ice melt zones 

Samantha Rush, Chang-Ho Lee, Kitack Lee, Penny Vlahos, and Lauren Barrett

The Arctic Ocean is one of the most rapidly changing environments on the planet as sea ice extent and thickness have declined extensively over the last 40 years. It is predicted that by 2050, Arctic summers will become mostly ice-free, and the Arctic Ocean will be dominated by seasonally annual, rather than multiyear, sea ice. Arctic sea ice serves as a mediator of biogeochemical processes globally, though the impacts of increased ice melt and water column freshening on Arctic biogeochemistry are uncertain. Specifically, declining sea ice raises significant concerns regarding the future carbon uptake potential of the Arctic and the buffering capacity, or alkalinity, of seawater. Boron (B) is a major element in seawater, and in the form of the borate ion, it serves as the third largest contributor to alkalinity. Boron concentrations in the open ocean are typically conservative and accounted for through relationships with other water components, such as with salinity (S) in the boron to salinity ratio (B/S). Well established B/S ratios have been defined for the open ocean; however, salinity variability can create discrepancies in the open ocean boron corrections for alkalinity. In 2021, work in the marginal ice zone of the Bering and Chukchi Seas revealed non-conservative boron behavior and significant alkalinity system inaccuracies based on the deviation in computed B/S ratios in ice cores and brine. In this study, we investigate the B/S ratio in ice melt zone waters, snow, brine, annual, and multiyear sea ice from the eastern Arctic basin. A total of 169 samples were collected during the onset on melt (May-June 2023) on the ARTofMELT expedition across a range of salinities (2 - 63). High salinity samples (S>29) included 1 lead, 7 brine, 16 under-ice, and 28 open ocean water samples. Low salinity samples (S<29) included 1 brine, 10 snow, and 106 ice core samples. Excluding snow, results indicate deviations from the accepted open ocean B/S ratio (0.1336 mg/kg). For both the entire high salinity sample set and the open ocean subset within it, the B/S average value (0.1304 ± 0.001 mg/kg) was lower. For low salinity samples, the average B/S value (0.1328 ± 0.003) was higher than the high salinity sample value but still lower than the accepted field value. The range of B/S ratios was much larger in low salinity samples (0.1260-0.1425 mg/kg) than high salinity samples (0.1275-0.1350 mg/kg); however, both ranges were significantly smaller than the 2021 B/S ratio range (0.0900-0.1850 mg/kg). The smaller deviation from the accepted B/S ratio in this study resulted in carbon system analysis inaccuracies less than 2 µmol/kg across the entire salinity range. We present the computed B/S ratios and the differences in these datasets using the δ18O isotopic ratios to understand the heterogeneity of western, annual ice in the marginal ice zone and eastern, multiyear ice in pack ice regions. The marked distinction in the datasets allows potential insight into boron concentrations and the conversion of total alkalinity to carbonate alkalinity across current and future systemic climate-change shifts in the Arctic.

How to cite: Rush, S., Lee, C.-H., Lee, K., Vlahos, P., and Barrett, L.: Non-conservative nature of Boron in low salinity Arctic ice and ice melt zones, EGU General Assembly 2024, Vienna, Austria, 14–19 Apr 2024, EGU24-3662, https://doi.org/10.5194/egusphere-egu24-3662, 2024.

EGU24-4403 | ECS | Posters on site | AS4.2

Near-surface particle concentration profiles above the Arctic sea ice 

Theresa Mathes and Andreas Held

The Arctic region is warming rapidly, and aerosol-cloud-sea-ice interactions are considered to be one of the key features of the Arctic climate system. It is therefore crucial to identify Arctic particle sources and sinks in order to study their impact on cloud formation and properties. Scott and Levin (1972) were the first to describe open leads as potential sources of atmospheric particles and thus a local source of particle emissions in the central Arctic. Held et al. (2011) found that open leads and ice ridges in particular emit high levels of particles. Particle concentrations have also been shown to be altered by the intrusion of warm and moist air masses and can be strongly enhanced in turbulence-dominated cases (You et al., 2022). Despite significant progress in Arctic research in recent years, there is still a lack of information on near-surface particle concentrations over different surface types, especially before and during the ice-melting period.

Here, we present measurements of near-surface particle concentration profiles to help to quantify the vertical aerosol exchange between Arctic sea ice and the atmosphere. In spring 2023, during the research cruise ARTofMELT on board the icebreaker Oden, we successfully carried out vertical particle measurements. From 17 May to 9 June 2023, near-surface particle concentration profiles were measured during 16 individual measurement periods. Due to the early season, measurements could be taken both before and during the melting process.

For the profile measurements, an aersol inlet was automatically moved up and down by a 1.50 m linear actuator. A plate was attached to the lift to hold sensors for the distance, wind and temperature as well as the aerosol inlet. An  box containing the condensation particle counter (CPC 3007, TSI, St. Paul, MN, USA) was connected to the inlet. Total particle number concentrations with a lower cut-off diameter of 10 nm were then determined at six different heights from 6 cm above the surface to 1.30 m. These measurements were carried out on the ice close to an open lead or surrounded by a closed ice surface.

Figure 1 shows an example for two days of fluxes at 79.8 ° N and 1.9° W. Due to the proximity to the open lead, an emission (red) of aerosols predominates, which is partially alternated by a deposition (blue). The flow calculations are based on 26 height profiles measured on 17 May and 24 on 18 May.

We thank our colleagues from Leibniz Institute for Tropospheric Research, Stockholm University, Swedish polar research secretariat as well as all expedition participants who provided insight and expertise that greatly assisted the research.

Held, A., Brooks, I.M., Leck, C., and Tjernström, M. (2011) On the potential contribution of open lead particle emissions to the central Arctic aerosol concentration. Atmos.Chem.Phys. 11, 3093-3105.
Scott, W. D. and Z. Levin (1972) Open channels in sea ice as ion sources. Science 177, 425-426.
You, C., Tjernström, M., Devasthale, A. (2022) Warm and moist air intrusions into the winter Arctic: a Lagrangian view on the near-surface energy budgets. Atmos.Chem.Phys. 22, 8037–8057.

How to cite: Mathes, T. and Held, A.: Near-surface particle concentration profiles above the Arctic sea ice, EGU General Assembly 2024, Vienna, Austria, 14–19 Apr 2024, EGU24-4403, https://doi.org/10.5194/egusphere-egu24-4403, 2024.

EGU24-5124 | ECS | Orals | AS4.2 | Highlight

Is spring melting in the Arctic detectable by under-ice radiation? 

Philipp Anhaus, Christian Katlein, Marcel Nicolaus, Noémie Planat, and Martin Schiller

A trend towards earlier sea-ice melt is detected in many ice-covered regions in the Arctic. The timing of the melt onset has a strong impact on the sea-ice energy budget. Melt onset changes the radiative properties of the ice due to increasing snow wetness and meltwater. So far, satellite passive microwave data are used to detect the melt onset. We analyzed transmitted radiation spectra as collected underneath drifting sea-ice using a remotely operated vehicle during the ARTofMELT expedition in the Fram Strait in spring 2023. We colocated those spectra with measurements of snow depth, sea ice and surface topography, chlorophyll-a concentration in the water column, and with aerial images. This combined dataset enables us to track down possible subsurface pathways and accumulation pools of meltwater. Areas of low snow load and depressed surface topography are characterized by higher transmitted radiation compared to areas with a thick snow cover. Those areas overlapped with areas that showed the first signs of surface melt. Chlorophyll-a concentrations varied only slightly in magnitude and did not match with the heterogeneous pattern of snow depth and ice topography. Here we discuss how to disentangle the influences of chlorophyll a and the subsurface meltwater on the spectral shape of transmitted radiation. We propose that upon successful disentanglement, the spectra can be used as an indicator for subsurface melting. Our study suggests that sea-ice melting starts subsurface and that measurements of transmitted solar radiation spectra could be used to identify the melt onset prior to surface melting. This can provide an interesting complementary information on melt occurrence and on the location of the water in the snowpack in addition to satellite passive microwave data.

How to cite: Anhaus, P., Katlein, C., Nicolaus, M., Planat, N., and Schiller, M.: Is spring melting in the Arctic detectable by under-ice radiation?, EGU General Assembly 2024, Vienna, Austria, 14–19 Apr 2024, EGU24-5124, https://doi.org/10.5194/egusphere-egu24-5124, 2024.

EGU24-5372 | Orals | AS4.2

Impact of warm and moist intrusions on black carbon deposition and summer snow melt in the central Arctic 

Hélène Angot, Marion Réveillet, and Julia Schmale and the MOSAiC team

Warm and moist intrusions (WAMIs) into the central Arctic, predominantly observed in winter and early spring, are becoming more frequent, significantly affecting the region’s near-surface energy budget. This study focuses on the deposition pulses of black carbon (BC) triggered by WAMIs and their subsequent impact on snow properties and melting during the summer, using a modeling approach and comprehensive datasets from the 2019–2020 Multidisciplinary drifting Observatory for the Study of the Arctic Climate (MOSAiC) expedition. Our findings reveal that WAMIs induce episodes of intense BC wet deposition in the central Arctic shoulder season (Nov–Apr) due to transported pollution and moisture. We demonstrate that WAMIs result in exceptionally high BC deposition (> 4 orders of magnitude compared to typical winter/spring conditions) across an area of nearly 1 million km2, approximately 20% of the central Arctic Ocean. Furthermore, we establish a direct connection between these winter/spring BC deposition pulses and subsequent summer increases in absorbed solar energy (> 4 W/m2) and snowpack melt rate (+15%). Despite their sporadic occurrence (only 8% of the time), WAMIs play a significant role in the central Arctic surface energy budget through the BC snow albedo effect.

How to cite: Angot, H., Réveillet, M., and Schmale, J. and the MOSAiC team: Impact of warm and moist intrusions on black carbon deposition and summer snow melt in the central Arctic, EGU General Assembly 2024, Vienna, Austria, 14–19 Apr 2024, EGU24-5372, https://doi.org/10.5194/egusphere-egu24-5372, 2024.

EGU24-5901 | ECS | Posters on site | AS4.2

Aerosol-Cloud-Precipitation Interactions in the Arctic: Insights from the ARTofMELT Campaign 

Lea Haberstock, Julia Asplund, Almuth Neuberger, Luisa Ickes, Gabriel Freitas, Fredrik Mattsson, Darrel Baumgardner, Ilona Riipinen, and Paul Zieger

Aerosol-cloud interactions play a crucial role in the Arctic’s radiative budget. During the campaign ‘Atmospheric rivers and the onset of sea ice melt’ (ARTofMELT 2023) we aimed to improve our understanding of aerosol-cloud interactions by conducting in-situ measurements of microphysical and chemical properties of aerosols, cloud droplets, and precipitation in the Arctic during the onset of sea ice melt. A ground-based fog and aerosol spectrometer (GFAS) and a fog monitor (FM-120) from Droplet Measurement Technologies (DMT) were used to measure among other things droplet size, number concentration, and liquid water content. Precipitation was measured with a meteorological particle spectrometer (MPS, DMT). Throughout the campaign, we observed several fog and blowing snow events, along with occasional precipitation. These events provided an opportunity to investigate and compare the distinctive microphysical properties associated with each event. Our findings reveal significant variations in the size distribution and particle phase of blowing snow, precipitation, and fog.

How to cite: Haberstock, L., Asplund, J., Neuberger, A., Ickes, L., Freitas, G., Mattsson, F., Baumgardner, D., Riipinen, I., and Zieger, P.: Aerosol-Cloud-Precipitation Interactions in the Arctic: Insights from the ARTofMELT Campaign, EGU General Assembly 2024, Vienna, Austria, 14–19 Apr 2024, EGU24-5901, https://doi.org/10.5194/egusphere-egu24-5901, 2024.

EGU24-5950 | ECS | Posters on site | AS4.2

What we can learn from aerosol size distribution measurements over the spring Arctic pack ice 

Julia Asplund, Lea Haberstock, Jessica Matthew, Fredrik Mattson, Lovisa Nilsson, Erik Swietlicki, Megan Willis, Cort Zang, and Paul Zieger

Aerosol- cloud interactions remain among the most uncertain key parameters in the fast-changing Arctic climate system, in large part due to a lack of observational data from this hardly accessible region. The spring-summer transition is a particularly under sampled time period, due to harsh ice conditions. Here, we present five weeks of aerosol size distribution measurements over the spring Arctic pack ice, including more than 30 hours of in-cloud data, obtained during the ARTofMELT 2023 expedition. A setup of three inlets, including a whole-air, an interstitial, and a counterflow virtual impactor inlet, were used to cover the full aerosol population as well as both the activated and interstitial aerosol when in cloud. We will show an overview of the collected observations and the link between the size distribution properties and parallel measured aerosol parameters such as chemical tracers, as well as an air mass source analysis. Fog events were recorded during a range of aerosol conditions, allowing us to study the activated fraction when concentrations span from under 20 particles per cc, to over 150. The dataset also features several distinct regimes where different processes such as blowing snow, new particle formation, and secondary ice production dominate or influence the aerosol population, and we will demonstrate how the regimes are characterized by the dominant mode of the size distribution.

How to cite: Asplund, J., Haberstock, L., Matthew, J., Mattson, F., Nilsson, L., Swietlicki, E., Willis, M., Zang, C., and Zieger, P.: What we can learn from aerosol size distribution measurements over the spring Arctic pack ice, EGU General Assembly 2024, Vienna, Austria, 14–19 Apr 2024, EGU24-5950, https://doi.org/10.5194/egusphere-egu24-5950, 2024.

EGU24-6663 | Orals | AS4.2

Perspectives on limitations and mechanisms for atmospheric initiation of onset of the summer melt season over sea ice 

Christopher Cox, Amy Solomon, Ola Persson, Matthew Shupe, Michael Gallagher, Von Walden, Michael Town, Donald Perovich, Sarah Webster, and Jacob Anderson

Onset of surface melt over sea ice is a factor in the duration of the melt season. Onset is often triggered by advection of warm, moist air from lower latitudes. This is especially characteristic of early dates of onset, but such events have also been hypothesized to precondition the ice for an earlier onset even when they don’t act as the trigger. The importance of atmospheric advection to the melt season is well-recognized by the community. Less attention has been given to the potential limitations of these events and to what alternate mechanisms may also be important for initiation, which is the subject of this presentation. We discuss two case studies.

In the first case, atmospheric advection from the North Atlantic in late May 2020 caused onset to occur over a wide area of the sea ice north of Greenland, including the floe being measured by the Multidisciplinary drifting Observatory for the Study of Arctic Climate (MOSAiC) expedition. Approximately 6 weeks prior, in April, an anomalously warm advection event also impacted the MOSAiC floe and was responsible for ~40% of the total warming the ice underwent that spring. Using a diffusion model for the ice forced by surface temperatures that both include (observationally) and exclude (synthetically) the April event, we show that its influence relative to its absence was reduced by ~80% within 10 days. The result is explained by a negative feedback that suppresses conduction within the ice when warming events occur. Consequently, despite the apparent influential nature of the April event suggested by the observations, the ice temperatures would likely have been similar several weeks before onset if the April event had not occurred. This implies there are limitations to such events in preconditioning the sea ice for early onset.

Our second case examines data collected from a buoy in the Beaufort Sea during a regional onset event observed in June 2022. In this case, the air that caused melt at the buoy came from the north during a period of generally zonal flow of the polar jet (and lack of poleward moisture transport). Analysis of back trajectories indicates that the air had a residence time in the Arctic of 7-10 days prior to causing melt. The air began at mid-tropospheric levels near the pole then circulated around persistent, large-scale high pressure over the East Siberian Sea, descending along its track. Reanalysis data suggests the adiabatic contribution to the subsidence was sufficient to warm the air to the freezing point when it reached the surface, moving southward across the Beaufort Sea. This case indicates that subsidence is a mechanism internal to the Arctic that is capable of causing melt onset, though its climatological significance remains an open question.

How to cite: Cox, C., Solomon, A., Persson, O., Shupe, M., Gallagher, M., Walden, V., Town, M., Perovich, D., Webster, S., and Anderson, J.: Perspectives on limitations and mechanisms for atmospheric initiation of onset of the summer melt season over sea ice, EGU General Assembly 2024, Vienna, Austria, 14–19 Apr 2024, EGU24-6663, https://doi.org/10.5194/egusphere-egu24-6663, 2024.

EGU24-11158 | ECS | Orals | AS4.2

Synoptic situation during the ARTofMELT 2023 spring expedition 

Sonja Murto and Michael Tjernström

A 6-week long expedition ARTofMELT (Atmospheric rivers and the onset of Arctic sea-ice melt) with the Swedish Icebreaker Oden took place in the Arctic Ocean during late winter and spring of 2023. The aim was to collect observations and study processes leading up to the sea-ice melt onset. One of the targets was to assess the role of atmospheric rivers (ARs), i.e., southerly warm and moist-air injections, in advancing the melt-timing. This paper presents the synoptic situation during the expedition, based on observations measured onboard Oden and reanalysis data (ERA5). Additionally, the origin and paths of airmasses reaching Oden are determined using 7-day backward trajectories computed with the Lagrangian analysis tool LAGRANTO. The meteorological conditions were quite dynamic during these 35 days, strongly influenced by several (at least 6) surface cyclones passing Oden and only two warming events accompanied by rather weak ARs were observed, the latter one leading to the melt onset at the end of the expedition.


Based on meteorological conditions from 6-hourly launched radiosoundings, the expedition can be divided into six periods. The first short period encompasses the first days of the expedition, when Oden was located at the marginal ice zone. The winds were variable, mainly southerly, and it was moist with slightly below-freezing temperatures. As Oden was moving northwestwards, a one-week cold (~-15 - -10) and dry period followed. This period was mainly governed by northerly winds, guided by a persistent family of surface cyclones located over the Laptev and Kara Seas. The first major storm, that coincided with an atmospheric blocking over Scandinavia, was related to a cyclone forming to the southwest of Greenland and moving northeast, bringing winds over 25 m/s as it hit Oden on 13 May.  Northerly winds followed after the stormed had passed, guided by a surface pressure dipole between a high over Greenland and a low over the Arctic Ocean.


The first one-week long ice camp was built at the end of the second period, extending into the third period. A low-pressure over Greenland and high-pressure and an upper-level blocking over Scandinavia resulted in a pathway for a transient warm-air mass from the south, and melting was observed for the first-time. However, this warming was only temporary, as temperatures dropped below freezing after the AR had passed. Several weaker storms governed this third milder period, ending with the second major storm associated with a cyclone on 25 May. Again, winds turned northerly after the storm passed, which made the entry to the fourth longer, colder and drier period. The second 2-week long ice camp was established at the beginning of this period and expanded over the two last periods. These captured the forecasted (6 June) and the real melt onset (10 June). A surface pressure dipole with a high over Greenland and a low over the Arctic Ocean dominated at the beginning of the fifth period, and warm but dry air aloft was observed. As the winds turned southerly, the melt-onset period was characterized as warm and moist.

How to cite: Murto, S. and Tjernström, M.: Synoptic situation during the ARTofMELT 2023 spring expedition, EGU General Assembly 2024, Vienna, Austria, 14–19 Apr 2024, EGU24-11158, https://doi.org/10.5194/egusphere-egu24-11158, 2024.

EGU24-11515 | ECS | Posters on site | AS4.2

Overview of SMÄLTA: Secondary Marine Aerosol precursors and Links to aerosol growth at ice-melT onset in the Arctic 

Cort Zang, Megan Willis, Julia Asplund, Fredrik Mattsson, Paul Zieger, and Michael Tjernström

The sources, composition, and reactive transformation of reactive organic carbon (ROC, non-methane organic carbon) as well as the processing, abundances, and distribution of organosulfur compounds in the Arctic marine atmosphere are unconstrained partially due to a lack of targeted measurements.  Understanding the emission, transport and processing of ROC and organosulfur compounds is important for improving our understanding of the impacts of gaseous precursors on aerosol nucleation and growth, and atmospheric oxidation capacity. There is a shift in aerosol size distribution that occurs with the Arctic spring-to-summer transition period and there are very few Arctic marine measurements of trace gases during this same period. Constraining the composition of organosulfur compounds and ROC is important for understanding the drivers in the shift of aerosol size distribution.

We present shipborne gas-phase measurements of ROC and organosulfur compounds in the Arctic marine atmosphere as part of the Atmospheric Rivers and the onseT of sea ice MELT (ARTofMELT) campaign. ARTofMELT took place from May 7th to June 15th of 2023 over pack ice and within the marginal ice zone between 78 and 81°N in the Fram Strait. We deployed a reagent ion switching chemical ionization mass spectrometer to target ROC and organosulfur compounds using H­3O+ ionization for the detection of reduced compounds and NH4+ ionization for the detection oxidized species. The measurements encompass a variety of different conditions including ozone depleted air masses (<10ppbv), cloud influenced air masses, a range of aerosol concentrations, and air masses with southern and northern airmass history with influences from biologically rich marine regions as well as transport from over pack ice. Additionally, measurements of ROC show the presence of ≥C5 organics in the environment with implications for aerosol size and growth. Here, we show an overview of our measurements and some initial observations of the ROC present during the campaign.

How to cite: Zang, C., Willis, M., Asplund, J., Mattsson, F., Zieger, P., and Tjernström, M.: Overview of SMÄLTA: Secondary Marine Aerosol precursors and Links to aerosol growth at ice-melT onset in the Arctic, EGU General Assembly 2024, Vienna, Austria, 14–19 Apr 2024, EGU24-11515, https://doi.org/10.5194/egusphere-egu24-11515, 2024.

EGU24-12340 | ECS | Orals | AS4.2

Sea ice drift and wave pattern analysis of the early melt onset during the ARTofMELT cruise 2023 

Thibault Desjonquères, Leif E. B. Eriksson, Malin Johansson, Denis Demchev, Truls Karlsen, Timo Vihma, and Bing Cheng

In May-June 2023 the ARTofMELT 2023 expedition took place, with the aim to capture the melt onset in the Arctic Ocean. For the sea ice dynamics part of the cruise, in-situ observations were collected to co-inside with satellite observations, enabling studies of changes in drift patterns, capture the breakup of ice floes and studies of changes in backscatter signatures in satellite images as a consequence of melt onset. 

Seven OpenMETbuoys-v2021 and three SIMBA buoys, were placed on four first-year ice floes, away from the Marginal Ice Zone (MIZ). The OpenMETbuoys, equipped with GNSS (Global Navigation Satellite Systems), gyro, and accelerometer, facilitated horizontal motion, rotation, potential deformation, and wave action analysis. SIMBA buoys, with GNSS and thermistor strings, focused on temperature effects connected to melt onset. Three OpenMETbuoys and one SIMBA buoy were deployed on two larger floes. The two remaining drifters were deployed on individual floes. Deploying multiple buoys on each floe allowed detailed examination of small-scale drift changes, convergence, divergence, rotational patterns, frequencies, and connections to satellite Synthetic Aperture Radar (SAR) images. This deployment provides insights into the remaining wave energy in the pack ice. 

Low noise Radarsat Constellation Missions (RCM) SAR images in dual polarization (HH+VV or HH+HV) were acquired to overlap with the campaign in space and time. The temperature sensors onboard the SIMBA buoys enables us to connect changes in  backscatter values in the SAR images from the winter conditions into the early melt season and help define limitations for the SAR sea ice drift retrieval algorithm. 

Initial findings from wave and GNSS data offer insights into the condition of ice floes, including dislocation, disintegration, melting, and interactions with neighboring floes. The dislocation of the floes is indicated by the physical dissociation of the buoys present on the same floe. The OpenMETbuoys' recorded wave height and wave period indicate the drifter's location: on ice, in a transition phase on a small piece of ice or floating in the water between pieces of brash ice, or in open water.

Regarding the two bigger floes, on the first one, the drifters were launched 2023-05-22. An OpenMET drifter was dislocated from the rest of the floe on the 26th of May, and was in the transition phase on the 1st of July. The two remaining drifters were separated on the 29th of May. The last OpenMET drifter reached the transition phase on the 25th of May. The drifters on the second floe were launched 2023-05-28. The first dislocation occurred on the 8th of June, the second one on the 18th of June. The two remaining OpenMET drifters on this floe reached the transition phase on the 13th of June and 15th of June. The third floe contained a SIMBA drifter launched 2023-06-06 and the fourth one an OpenMETbuoy launched 2023-05-28. The latter reached the transition phase on the 10th of June.

How to cite: Desjonquères, T., Eriksson, L. E. B., Johansson, M., Demchev, D., Karlsen, T., Vihma, T., and Cheng, B.: Sea ice drift and wave pattern analysis of the early melt onset during the ARTofMELT cruise 2023, EGU General Assembly 2024, Vienna, Austria, 14–19 Apr 2024, EGU24-12340, https://doi.org/10.5194/egusphere-egu24-12340, 2024.

EGU24-15627 | Orals | AS4.2 | Highlight

Arctic spring and the onset of sea-ice melt: Early impressions from the ARTofMELT expedition 

Michael Tjernström, Paul Zieger, and Sonja Murto and the ARTofMELT Science Team

The spring season in the Arctic Ocean has gained relatively little attention with detailed observations from expeditions, due to difficulties to navigate in the ice at this time of the year. This paper reviews experiences from the ARTofMELT (Atmospheric rivers and the onset of sea-ice melt) expedition in spring of 2023.

ARTofMELT had two objectives: To study processes leading up to the onset of the sea-ice melt and to explore links to so-called atmospheric rivers (ARs). ARs are spatially and temporally distinct inflows of warm and moist air from farther south. To fulfill these goals, we instrumented the Swedish research icebreaker Oden and planned to locate her in the Atlantic sector of the Arctic Ocean north of Svalbard from early May to mid-June. Oden was equipped with advanced meteorological instrumentation including standard meteorology and 6-horly radiosoundings, radar and lidars for cloud and wind measurements, and a surface flux tower with eddy-covariance. An advanced suite of atmospheric chemistry and aerosol observations were also deployed along with water isotope measurements, and also sampled and profiled the upper ocean structure. To identify upcoming ARs, we used ensemble forecasts from the European Centre for Medium-Range Weather Forecasts (ECMWF) at lead time up to seven days, to allow time to navigate the icebreaker to optimal positions and establish ice camps. While carrying out most of the observations on board, in-situ observations on the ice provide valuable details on the impact of ARs on the ice. On ice camps we therefore deployed a surface energy budget station and an ROV surveying the ice from below and also flew a tethered balloon HELIKITE system from the aft of the ship. Additionally, we also used the helicopter to deploy scientists on the ice (sampling snow, ice and water) and deploying buoys, and for flying the HELIPOD instrument package.

ARTofMELT left Svalbard on 8 May and returned on 15 June. Starting with quite cold later winter conditions there was a brief warming period around mid-May, with an AR that brought air temperatures above the melting point twice (19 and 20 May). This was interrupted by a major storm, followed by a cooler period. From the end of May the surface started to gain heat, culminating in the onset of the melt at a second AR on 10 June. Both ARs were documented from ice stations.

A major uncertainty was the navigation in the ice during late winter and this also tuned out to be the most difficult part of the deployment. The ice was thick and hard to break, the size of the largest ice floes was much larger than expected and short-term variations of the ice pressure made navigation very difficult. The maximum latitude obtained was ~80.5 °N, hence, we stayed in the Fram Strait ice pack. Also, only two brief ARs were encountered, less than expected. In spite of this we were able to gain a large amount of unique observations, both from the icebreaker when in transit and from two ice camps.

How to cite: Tjernström, M., Zieger, P., and Murto, S. and the ARTofMELT Science Team: Arctic spring and the onset of sea-ice melt: Early impressions from the ARTofMELT expedition, EGU General Assembly 2024, Vienna, Austria, 14–19 Apr 2024, EGU24-15627, https://doi.org/10.5194/egusphere-egu24-15627, 2024.

EGU24-17193 | ECS | Orals | AS4.2

The composition and sources of airborne bacteria and proteinaceous Ice Nucleating Particles in the High Arctic marine region during Spring 

Jennie Spicker Schmidt, Marianne Glasius, Camille Mavis, Jessie Creamean, Gabriel Freitas, Paul Zieger, Kai Finster, and Tina Šantl-Temkiv

The Arctic is a particularly vulnerable region on Earth, where climate change takes place at an intense pace. Clouds represent an essential element within the Arctic atmosphere and play a crucial role in the regional radiative balance. The physical properties of clouds are tightly interlinked with the presence of aerosols that can serve as cloud condensation nuclei (CCN) and as ice nucleating particles (INPs), which facilitate the formation of cloud droplets and ice crystals, respectively. Consequently, they affect cloud thickness, lifetime, and albedo.

More studies propose that various biological aerosols e.g., aerosolized microbial cells, proteinaceous compounds and fragments actively contribute to cloud processes serving as INPs active at high subzero temperatures (>-15°C). However, our understanding of microorganisms responsible for producing compounds serving as INPs, their source environments, and their level of activity, remains highly uncertain.

Given the profound impact of climate change in the Arctic region, understanding the role of biological INPs in the atmosphere becomes particularly critical during Arctic melt season. Here, we present an overview of bioaerosol observations and sources tracking from the recent Arctic expedition ”Atmospheric rivers and the onset of Arctic melt” (ARTofMELT 2023).

Biological INPs are thought to originate from the ocean and meltwater sources during the Arctic Spring and Summer. To assess the potential contribution of these sources to INP active aerosols, aerosols were generated from bulk seawater and sea ice melt water with a temperature-controlled sea spray simulation chamber. The presence of microorganisms in the bulk water and aerosol was quantified using flow cytometry and qPCR while the composition of the microbial communities was determined by amplicon sequencing. Additionally, fluorescent bioaerosols generated by the chamber were  analyzed using a Multiparameter Bioaerosol Spectrometer (MBS). Simultaneously, ambient air samples were analyzed for the presence of microbial cells, bioaerosols, and the composition of the collected microbial community. The ice nucleating properties of water, sea ice melt, and aerosols from the chamber and ambient aerosol were also measured to determine their relevance for Arctic cloud formation.

Preliminary results from the ambient measurements revealed low concentrations of airborne bacterial cells and highly active INPs. From the sea spray simulations, we found that ice melt, snow melt and seawater samples generated a high flux of bacterial cells which were accompanied by INPs active predominantly at low freezing temperatures (<-15°C). Therefore, it seems that the local sea spray is not a likely source of proteinaceous INPs detected in the Arctic spring atmosphere, which will be further explored through bacterial community analysis. Our results will thus provide comprehensive insights into the contribution of local and long-range transported sources of bioaerosols to the Arctic.

How to cite: Schmidt, J. S., Glasius, M., Mavis, C., Creamean, J., Freitas, G., Zieger, P., Finster, K., and Šantl-Temkiv, T.: The composition and sources of airborne bacteria and proteinaceous Ice Nucleating Particles in the High Arctic marine region during Spring, EGU General Assembly 2024, Vienna, Austria, 14–19 Apr 2024, EGU24-17193, https://doi.org/10.5194/egusphere-egu24-17193, 2024.

EGU24-17589 | Posters on site | AS4.2

Intense formation of low liquid clouds over the Arctic sea-ice during May.   

Jean Lac and Hélène Chepfer

Low-liquid stratiform clouds are ubiquitous in the Arctic. Their high surface longwave warming induces change in the surface radiative budget that might have effects on the sea-ice melt especially during transitioning seasons. In particular, low liquid clouds formed in Spring may trigger early melt onset that might have an impact on the following evolution of the sea-ice during summer. 

However, relatively little is known about the existence and the drivers of such clouds in the early melt season. Here we used 13 years of space based lidar cloud profile observations with complementary data to show that the predominance of low clouds happens in May. First, we showed that the low cloud fraction reaches 75% of the Arctic Ocean in May over the sea-ice only with a low interannual variability. This cover increase in May seems to be homogeneous over the whole Arctic Ocean. Second, we investigated potential early summer drivers forming those low liquid clouds. One feature is the moisture sources that could explain the availability of such liquid droplets to form liquid clouds. While the other feature is the boundary layer structure, that might affect the stability and the ocean/atmosphere interaction over sea-ice leads.  

Overall, this study suggests a peak of Arctic low liquid clouds occurring in May that might impact the sea-ice summer melt by triggering early Spring melt. 

How to cite: Lac, J. and Chepfer, H.: Intense formation of low liquid clouds over the Arctic sea-ice during May.  , EGU General Assembly 2024, Vienna, Austria, 14–19 Apr 2024, EGU24-17589, https://doi.org/10.5194/egusphere-egu24-17589, 2024.

EGU24-17977 | ECS | Posters on site | AS4.2

Springtime observations of black carbon aerosols in and outside of low-level Arctic clouds 

Lovisa Nilsson, August Thomasson, Paul Zieger, Julia Asplund, Pontus Roldin, Fredrik Mattson, Erik Ahlberg, and Erik Swietlicki

Few expeditions have ventured into the Arctic to observe the processes that take place in the transition from winter to summer. Particularly, direct observations of aerosol-cloud interactions are scarce, and comprise a large source of uncertainty in radiative forcing estimations in the Arctic.

Light absorbing aerosol particles, such as black carbon (BC) from incomplete combustion, exert a positive forcing upon direct absorption of sunlight, and affect clouds by serving as cloud condensation nuclei (CCN). During the icebreaker expedition ARTofMELT in spring 2023, we measured BC with a multi-angle absorption photometer (MAAP) and a single particle soot photometer (SP2) for five weeks. The two instruments differ by principle and can be used to inform on complementary aspects of the light absorbing aerosol. For example, the MAAP provides the total mass concentrations of so-called equivalent BC (eBC), whereas the single particle instrument SP2 determines the mass of individual refractory BC (rBC) aggregates. Most of the time, the MAAP and SP2 sampled the total BC concentration on the same inlet (whole-air). However, during cloud-events, the SP2 measured downstream of a counterflow virtual impactor (CVI) inlet that samples just cloud droplets or ice crystals without the interstitial or non-activated aerosol.

Our first results indicate overall low out-of-cloud BC mass concentrations for both instruments (median and interquartile range, IQR: 4.4 (1.6-8.5) ngm-3 for the MAAP and 2.5 (1.2-4.7) ngm-3 for the SP2). The variation in mass concentration was small, although the tendency of a gradual decrease was observed towards the onset of the melt.

The SP2 instrument enables studies of the BC mass size distribution. For example, during a cloud event we observed that the geometric mean diameter (GMD, mass equivalent diameter) shifted from smaller (171 nm, whole-air inlet) to larger sizes (175-192 nm), as the SP2 switched to sampling the cloud-residual BC (CVI inlet). Further investigation is needed to examine the underlying causes for this observation (e.g. variation in airmass origin). 

The total aerosol concentration is influenced by local natural sources and production from gaseous precursors, as opposed to the BC concentration which is mainly affected by anthropogenic activities. BC source footprints from the Lagrangian dispersion model FLEXPART, indicate little influence from industrialized regions during the whole campaign. This may explain the comparably low median concentration of rBC-particles (1.1 cm-3, IQR: 0.5-2.1) to the total aerosol number concentration (in the range ~20-150 cm-3).

How to cite: Nilsson, L., Thomasson, A., Zieger, P., Asplund, J., Roldin, P., Mattson, F., Ahlberg, E., and Swietlicki, E.: Springtime observations of black carbon aerosols in and outside of low-level Arctic clouds, EGU General Assembly 2024, Vienna, Austria, 14–19 Apr 2024, EGU24-17977, https://doi.org/10.5194/egusphere-egu24-17977, 2024.

EGU24-19851 | ECS | Orals | AS4.2

Characteristics of natural Arctic aerosols emitted from a wide range of local sources during ARTofMELT2023 

Gabriel Freitas, Kouji Adachi, Julia Asplund, Jessie Creamean, Fredrik Mattsson, Camille Mavis, Lovisa Nilsson, Matthew Salter, Jennie Spiecker Schmidt, Tina Šantl-Temkiv, and Paul Zieger

The Arctic has been experiencing a rise in ambient temperature several times higher than the global average. This warming trend has led to a continuous decline in sea ice coverage and snowpack prevalence. Aerosol sources, such as those from the open ocean and tundra, have become more prevalent throughout the year. These sources emit primary biological aerosol particles (bioaerosols) some of which exhibit ice nucleating properties at high temperatures (>-15C). Ice nucleating particles (INPs) play a crucial role in cloud ice formation, affecting cloud physical and optical properties, as well as their lifetime. Consequently, this has a substantial impact on the Arctic climate. 

During the ARTofMELT2023 expedition (“Atmospheric Rivers and the Onset of Sea Ice Melt 2023”) conducted aboard the Swedish icebreaker Oden in the Atlantic sector of the Arctic Ocean, we assessed the relative importance of several natural bioaerosol sources, such as sea ice, snow melt (to simulate melt ponds) and bulk ocean water. This involved several sea spray simulation chamber and nebulizer experiments, referred to as “source experiments”. The aerosol particles generated in the 61 source experiments conducted were analyzed using single-particle ultraviolet fluorescence spectroscopy along with other complementary aerosol measurements. These included particle size, black carbon content, particle chemical composition, as well as the microbial community and INP concentration of emitted particles. Additionally, filter samples were obtained for transmission electron microscopy (TEM) analysis. 

Our findings indicate that sea ice and snow melt are more significant sources of bioaerosols compared to the bulk ocean water, including the sea surface microlayer, indicating the potential importance of melt ponds as a local Arctic bioaerosol source. Furthermore, we found significant differences in the chemical composition, black carbon content and size distribution of the various analyzed aerosol sources.

How to cite: Freitas, G., Adachi, K., Asplund, J., Creamean, J., Mattsson, F., Mavis, C., Nilsson, L., Salter, M., Spiecker Schmidt, J., Šantl-Temkiv, T., and Zieger, P.: Characteristics of natural Arctic aerosols emitted from a wide range of local sources during ARTofMELT2023, EGU General Assembly 2024, Vienna, Austria, 14–19 Apr 2024, EGU24-19851, https://doi.org/10.5194/egusphere-egu24-19851, 2024.

EGU24-19946 | Orals | AS4.2 | Highlight

Helicopter borne measurements during melt onset in the Fram strait as part of ARTofMELT23 

Falk Pätzold, Lutz Bretschneider, Magnus Asmussen, Barbara Altstädter, Evelyn Jäkel, Hendrik Stapel, Tim Sperzel, Manfred Wendisch, Birgit Wehner, Ralf Käthner, and Astrid Lampert

In the Arctic climate system, the onset of melting is a crucial point, and timing is still difficult to predict. Therefore, the expedition ARTofMELT was dedicated to exploring atmospheric conditions and processes that are involved in triggering the onset of melting.

The helicopter borne sensor system HELIPOD was deployed in this expedition to measure the spatial variability of atmospheric dynamics, radiation, aerosols, trace gases and surface properties on a horizontal scale up to 40 km around the icebreaker ODEN. During the ARTofMELT23 expedition, the HELIPOD conducted 12 measurement flights in the FRAM strait around 80° North and the prime meridian between 9 May and 9 June 2023 with 26.5 hours in the air. The flights covered an area of about 20 NM around the location of the icebreaker ODEN and a vertical range from 50 m to 2700 m above sea level. The flight patterns were aligned parallel and perpendicular to dominating directions as the sea ice edge and the wind direction. In one case a cloud layer edge apparently structured the atmospheric situation. The flights covered pre-melt onset conditions, refreezing situations and the melt onset. Synoptic air mass changes were probed as well.    

The presentation gives an overview of the temporal changes of the ambient conditions during the research flights, and a first assessment of the flights during transient weather situations.

How to cite: Pätzold, F., Bretschneider, L., Asmussen, M., Altstädter, B., Jäkel, E., Stapel, H., Sperzel, T., Wendisch, M., Wehner, B., Käthner, R., and Lampert, A.: Helicopter borne measurements during melt onset in the Fram strait as part of ARTofMELT23, EGU General Assembly 2024, Vienna, Austria, 14–19 Apr 2024, EGU24-19946, https://doi.org/10.5194/egusphere-egu24-19946, 2024.

EGU24-20594 | Posters on site | AS4.2

Sea ice, snow caps, and freshwater lenses: The hurdles local Arctic aerosols must overcome to become airborne 

Jessie Creamean and the MOSAiC and ARTofMELT field teams

Aerosol particles and clouds play a critical role in regulating radiation reaching the Arctic, which is warming faster than anywhere else globally. However, the magnitude of their effects is not adequately quantified, especially in the Arctic Ocean over sea ice. Specifically, particles generated from open leads, melt ponds, and the snow-covered sea ice surfaces remain poorly understood, yet could have significant impacts on cloud condensation nuclei (CCN) and ice nucleating particle (INP) concentrations, and thus, central Arctic cloud formation. While marine biological processes have been demonstrated to be potentially key primary aerosol sources in the Arctic summer, exact sources and emission processes of these particles remain highly uncertain. 

For this presentation, we provide an overview of aerosol observations from two recent Arctic field campaigns: the 2019–2020 Multidisciplinary drifting Observatory for Study of Arctic Climate (MOSAiC) and the 2023 Atmospheric rivers and the onset of Arctic melt (ARTofMELT) expeditions. We highlight preliminary findings focused on aerosols that have the potential to impact cloud phase and lifetime over the Arctic Ocean, specifically those from local sources in the early spring and summer melt periods. The evolution of open water within the pack ice in late spring and the Arctic melt season coincides with an increase in aerosol particle concentration, which may be attributed to biological activity within seawater and sea ice. However, the emission of aerosol particles is contingent on features like open leads and melt ponds, and whether they are covered by snow, freshwater melt layers, or ice lids. This integrative study involves the use of detailed aerosol, meteorological, oceanographic, and sea ice observations from MOSAiC and ARTofMELT. Overall, this work will enable us to assess local aerosol processes associated with cloud formation to better understand the Arctic system through a holistic approach.

How to cite: Creamean, J. and the MOSAiC and ARTofMELT field teams: Sea ice, snow caps, and freshwater lenses: The hurdles local Arctic aerosols must overcome to become airborne, EGU General Assembly 2024, Vienna, Austria, 14–19 Apr 2024, EGU24-20594, https://doi.org/10.5194/egusphere-egu24-20594, 2024.

EGU24-21926 | Posters on site | AS4.2

Water Isotope measurements contribute to the understanding of atmospheric, sea ice, ocean interactions during the ArtofMelt expedition, Fram Strait, spring 2023 

Jeff Welker, Ben Kopec, Eric Klein, Julia Muchowski, Timo Vihma, Paul Zieger, Falk Paetzold, Astrid Lampert, Penny Vlahos, John Prytherch, Valtteri Hyöky, and Truls Karlsen

Transitions periods between seasons in the Arctic are phases when the atmosphere-sea ice-ocean interactions are heightened, especially during these periods of exceptional warming.  These transition periods may be accompanied by shifts in atmospheric transport patterns, the distribution of sea ice and extreme events, such as atmospheric rivers.  Atmospheric Rivers may act as accelerants of sea ice melt and its redistribution, leading to spatial complexity in ice-ocean-atmosphere exchanges of mass and energy.

As part of an interdisciplinary team aboard the I/B Oden from early May to mid-June, four main water isotope measurement packages were collected to maximize collaborations and to resolve nuisances of the Arctic System throughout the cruise track between Svalbard and NE Greenland (Figure 1).  First, in order to delineate longitudinal distribution of the warm and salty W Svalbard current compared to the cold and fresh E Greenland current, we continuously measured the near surface water δ18O, δ2H and d-excess values. Second, in order to source water vapor and moisture sources from the warm, moist, and isotopically enriched subpolar & N Atlantic, compared to cold, dry and isotopically depleted Arctic air, we also continuously measured the δ18O, δ2H and d-excess values of water vapor collected from the ship’s, bow-mounted, eddy covariance tower. Third, in order to understand the horizontal and altitudinal patterns of water vapor parcels that surround the ship; in-situ water vapor isotopes were measured during fHeliPod flight lines that extended up to 30 km N-S-E-W of the Oden and from ~ 50 m above the sea ice and open water to over 2k in altitude.  Fourth, in order to delineate the source of moisture (sea water vs. meteoric water) throughout the sea ice core profiles and the patterns and sources of moisture in the snow pack profiles; ice cores and snow pits were collected (drilled) and dug at ~10 different locations and water isotope samples were analyzed for δ18O, δ2H and d-excess values back in the laboratory.

Four major discoveries will be presented: A) mixing of the surface W Svalbard and NE Greenland current is found to be farther east than previously reported and the surface water masses may differ by up to 5 ‰ δ18O during spring; B) water vapor isotopes responded at hourly time scales as moisture sources during Atmospheric River events begin with northward fluxes of warm, moist air masses but passing cyclones deliver N-S cold-dry, isotopically depleted water vapor in extreme Arctic-sourced storm events lasting a day or more; C) Horizontal and vertical transects during Heliopod flights captured horizontal and altitudinal variation in water vapor isotopes during periods when the weather of the ship was dominated by cold-dry Arctic air, interrupted by periods when the ship was experiencing pulses of warm, moist, and high humidity conditions; D) ice cores and snow packs exhibit vertical isotopic variation indicative of different moisture sources and morphogenesis processes.

How to cite: Welker, J., Kopec, B., Klein, E., Muchowski, J., Vihma, T., Zieger, P., Paetzold, F., Lampert, A., Vlahos, P., Prytherch, J., Hyöky, V., and Karlsen, T.: Water Isotope measurements contribute to the understanding of atmospheric, sea ice, ocean interactions during the ArtofMelt expedition, Fram Strait, spring 2023, EGU General Assembly 2024, Vienna, Austria, 14–19 Apr 2024, EGU24-21926, https://doi.org/10.5194/egusphere-egu24-21926, 2024.

EGU24-1026 | ECS | Orals | CL1.2.6

Input and output fluxes of surface CO2 over the Late Quaternary 

Luca Castrogiovanni, Pietro Sternai, Claudia Pasquero, and Nicola Piana Agostinetti

Ice core archives allow us to retrieve the atmospheric CO2 concentration of the past 800,000 years characterized by periodically lower and higher CO2 levels corresponding to ice ages and interglacials, respectively. However, there is no broadly accepted consensus regarding the leading drivers of such variability. To a large extent, what prevents us from identifying the mechanisms that underlie changes in atmospheric CO2 concentrations is our inability to split the overall atmospheric CO2 budget into its sources and sinks terms, thereby assessing the fluxes of carbon among different reservoirs. Here, we use a reversible-jump Markov chain Monte Carlo (rj-McMC) algorithm to invert the atmospheric CO2 concentration dataset provided by the EPICA ice core based on a general forward formulation of the geological carbon cycle. We can quantify the most likely temporal variability of atmospheric carbon fluxes in ppm/yr throughout the last 800,000 years. Results suggest that temperature changes have been driving the variations of atmospheric CO2 until the Mid-Brunhes Event (MBE), when the onset of a progressive cyclic increase of  the atmospheric carbon fluxes marks a distinct behavioral change of the climate system. We ascribe such change to mechanisms internal to the Earth system, possibly related to the deglacial triggering of global volcanism and associated feedbacks on climate or a combination of geological, biological, and physical processes. Regardless, our unprecedented quantification of past atmospheric input and output CO2 fluxes provide (1) new constraints for climate carbon cycle and paleoclimate models to assess dominant climate-driving mechanisms, and (2) the benchmark for climate models intercomparison projects and better assessing the anthropogenic perturbation to the geological carbon cycle an associated climatic effect.


How to cite: Castrogiovanni, L., Sternai, P., Pasquero, C., and Piana Agostinetti, N.: Input and output fluxes of surface CO2 over the Late Quaternary, EGU General Assembly 2024, Vienna, Austria, 14–19 Apr 2024, EGU24-1026, https://doi.org/10.5194/egusphere-egu24-1026, 2024.

One of the critical features of deglaciations is the sudden increase in atmospheric CO2 levels. Regulating the Pleistocene atmospheric CO2 variations requires the involvement of oceanic carbon storage changes. However, the mechanisms and pathways for air-sea carbon exchanges remain elusive, partly resulting from the insufficiency of marine carbonate system proxy data with a robust age control beyond Termination I.

The deglacial CO2 rise toward Marine Isotope Stage (MIS) 9e (Termination IV) started from 197.1 ppm to 300.7 ppm[1], representing the highest natural atmospheric CO2 recorded in the Antarctic ice cores over the past 800 ka[2]. Our high-resolution carbonate system records from the Iberian Margin with a robust age control suggest an expansion of southern-sourced Glacial Antarctic Bottom Water at the onset of the deglaciation, followed by a net release of CO2 from the Atlantic sector of the Southern Ocean. However, our results indicate a different ocean circulation pattern during Termination III, when atmospheric CO2 increases by 85 ppm[2]. Unlike Termination III, the north-sourced water seems to take a large proportion of the deep Atlantic Ocean during this period.

References:

[1] Nehrbass-Ahles, C. et al. (2020), Science vol. 369 1000–1005.

[2] Bereiter, B. et al. (2015), Geophys. Res. Lett. 42, 542–549.

How to cite: Ji, X. and Yu, J.: The mechanism controlling air-sea CO2 exchange under different ocean circulation conditions, a case study from Iberian Margin, EGU General Assembly 2024, Vienna, Austria, 14–19 Apr 2024, EGU24-1157, https://doi.org/10.5194/egusphere-egu24-1157, 2024.

EGU24-3128 | Orals | CL1.2.6

Bølling-Allerød warming as a part of orbitally induced climate oscillation  

Yuchen Sun, Xu Zhang, Gregor Knorr, Martin Werner, Lev Tarasov, and Gerrit Lohmann

Deglacial abrupt warming event is a ubiquitous feature of deglaciations during the Late Pleistocene. Nevertheless, during the last deglaciation an unusually early onset of abrupt Northern Hemisphere warming event, known as Bølling/Allerød (B/A) warming, complicates our understanding of their underlying dynamics, especially due to the large uncertainty in histories of ice sheet retreat and meltwater distributions. Here applying the latest reconstruction of ice sheet and meltwater flux, we conduct a set of transient climate experiments to investigate the triggering mechanism of the B/A warming. We find that the realistic spatial distribution of meltwater flux can stimulate the warming even under a persistent meltwater background. Our sensitivity experiments further show that its occurrence is associated with an orbitally induced climate self-oscillation under the very deglacial climate background related to atmospheric CO2 level and ice sheet configurations. Furthermore, the continuous atmospheric CO2 rising and ice sheet retreating appear to mute the oscillation by freshening the North Atlantic via modulating moisture transport by the Westerly. 

How to cite: Sun, Y., Zhang, X., Knorr, G., Werner, M., Tarasov, L., and Lohmann, G.: Bølling-Allerød warming as a part of orbitally induced climate oscillation , EGU General Assembly 2024, Vienna, Austria, 14–19 Apr 2024, EGU24-3128, https://doi.org/10.5194/egusphere-egu24-3128, 2024.

EGU24-4269 | ECS | Posters on site | CL1.2.6

Impact of iron fertilisation on Southern Ocean ecosystems and global carbon cycle during the last glacial cycle 

Himadri Saini, Katrin Meissner, Laurie Menviel, and Karin Kvale

Rising atmospheric CO2 concentration is a major driver of climate change. One of the several processes proposed to explain the lower atmospheric CO2 concentration during the last glacial period is an increase in aeolian iron flux into the Southern Ocean. As the Southern Ocean is a high-nutrient-low-chlorophyll region, increased iron deposition can impact Southern Ocean marine ecosystems,  increase export production, and reduce surface Dissolved Inorganic Carbon (DIC) concentration. Here, we investigate the responses of Southern Ocean marine ecosystems to changes in iron flux and their impact on ocean biogeochemistry and atmospheric CO2 during the last glacial period. We use a recently developed complex ecosystem model that includes four different classes of phytoplankton functional types and fully incorporated iron, silica and calcium carbonate cycles. We show that the changes in atmospheric CO2 are more sensitive to the solubility of iron in the ocean than the regional distribution of the iron fluxes. If surface water iron solubility is considered constant through time, we find a CO2 drawdown of ∼4 to ∼8 ppm. However, there is evidence that iron solubility was higher during glacial times. A best estimate of solubility changing from 1 % during interglacials to 3 % to 5 % under glacial conditions yields a ∼9 to 11 ppm CO2 decrease at 70 ka, while a plausible range of CO2 drawdown between 4 to 16 ppm is obtained using the wider but possible range of 1 % to 10 %. We also show that the decrease in CO2 as a function of Southern Ocean iron input follows an exponential decay relationship, which arises due to the saturation of the biological pump efficiency and levels out at ∼21 ppm in our simulations.

We also investigate the role of iron flux changes on the abrupt atmospheric CO2 increase during Heinrich Stadials, which are associated with a near collapse of the Atlantic Meridional Overturning Circulation (AMOC), a sudden decrease in Greenland temperature and warming in the Southern Ocean. Previous modelling studies have investigated the role of the ocean circulation in driving changes in atmospheric CO2 concentration during these abrupt events, while the role of reduced aeolian iron input during Heinrich stadials remained poorly constrained. We show that a weakened iron fertilisation during Heinrich Stadials can lead to ~6 ppm rise in CO2 out of the total increase of 15 to 20ppm as observed. This is caused by a 5% reduction in nutrient utilisation in the Southern Ocean, leading to reduced export production and increased carbon outgassing from the Southern Ocean.

How to cite: Saini, H., Meissner, K., Menviel, L., and Kvale, K.: Impact of iron fertilisation on Southern Ocean ecosystems and global carbon cycle during the last glacial cycle, EGU General Assembly 2024, Vienna, Austria, 14–19 Apr 2024, EGU24-4269, https://doi.org/10.5194/egusphere-egu24-4269, 2024.

EGU24-4451 | Posters on site | CL1.2.6

Simulating glacial-interglacial CO2 variations: What's right with CLIMBER? 

Malte Heinemann, Victor Brovkin, Matteo Willeit, Joachim Segschneider, and Birgit Schneider

Despite intense efforts, current generation comprehensive Earth system models have, to our knowledge, not been able to simulate the full extent of the atmospheric pCO2 drawdown (as recorded in ice cores) during the Last Glacial Maximum (LGM). Yet, the intermediate complexity model CLIMBER-2 has successfully been used to simulate not only the LGM drawdown but also the transient evolution of CO2 concentrations during entire glacial–interglacial cycles. To better understand why this is the case, we compare the CLIMBER-2 results to pre-industrial and LGM simulations using two related models with increasing complexity, namely, the recently developed intermediate complexity model CLIMBER-X and the state-of-the-art comprehensive Earth system model MPI-ESM as used in the PalMod project, focusing on ocean carbon cycle changes.

How to cite: Heinemann, M., Brovkin, V., Willeit, M., Segschneider, J., and Schneider, B.: Simulating glacial-interglacial CO2 variations: What's right with CLIMBER?, EGU General Assembly 2024, Vienna, Austria, 14–19 Apr 2024, EGU24-4451, https://doi.org/10.5194/egusphere-egu24-4451, 2024.

EGU24-4464 | ECS | Posters on site | CL1.2.6

Polar Twins: Glacial CO2 outgassing reduced in the Southern Ocean by upwelling of well-ventilated waters from the North Pacific  

Madison Shankle, Graeme MacGilchrist, William Gray, Casimir de Lavergne, Laurie Menviel, Andrea Burke, and James Rae

The Southern Ocean is widely thought to have played a driving role in the atmospheric CO2 fluctuations of the ice ages, ventilating carbon-rich deep waters to the atmosphere during interglacial periods and limiting this CO2 leakage during glacial periods. A more efficient Southern Ocean biological pump during glacial periods is one of the leading hypotheses for how this “leak” might have been stemmed, but the exact dynamics responsible are still debated. Previous hypotheses have invoked reduced upwelling and/or enhanced stratification in reducing the carbon and nutrient supply to the glacial Southern Ocean surface, thus enhancing the net efficiency of its biological pump. Here we consider an alternative, complementary scenario in which the nutrient and carbon content of the upwelled water itself is reduced. Noting the striking similarity between proxy records from the North Pacific and Southern Ocean over the Last Glacial Cycle and given that carbon-rich waters upwelling in the Southern Ocean today are largely fed by the North Pacific, we propose that low-carbon/nutrient glacial Southern Ocean surface waters could have been sourced from a well-ventilated, low-carbon/nutrient glacial North Pacific. We then show in intermediate-complexity Earth system model simulations how a well-ventilated North Pacific can directly reduce the outgassing potential of waters upwelled in the Southern Ocean. While not precluding the possibility of changes to upwelling or mixing, our results demonstrate the ability of changes in the upwelled waters’ carbon content – outside of any changes to Southern Ocean physical dynamics (e.g., upwelling rate) – to change Southern Ocean carbon content and outgassing. This provides a novel mechanism linking Northern Hemisphere climate to Southern Ocean carbon cycling and may thus help explain the cyclic CO2 variations of the ice ages.

How to cite: Shankle, M., MacGilchrist, G., Gray, W., de Lavergne, C., Menviel, L., Burke, A., and Rae, J.: Polar Twins: Glacial CO2 outgassing reduced in the Southern Ocean by upwelling of well-ventilated waters from the North Pacific , EGU General Assembly 2024, Vienna, Austria, 14–19 Apr 2024, EGU24-4464, https://doi.org/10.5194/egusphere-egu24-4464, 2024.

EGU24-5280 | ECS | Orals | CL1.2.6

Sensitivity of millennial-scale climate oscillations to boundary conditions in HadCM3 glacial simulations 

Brooke Snoll, Ruza Ivanovic, Lauren Gregoire, Yvan Rome, and Sam Sherriff-Tadano

Romé et al. (2022) present a new set of long-run Last Glacial Maximum experiments with millennial-scale climate oscillations between cold and warm modes. These oscillations are triggered by different snapshots of ice-sheet meltwater derived from the early stages of the last deglaciation. The overall characteristics of the oscillating events share similarities with δ18O records of the last glacial period. We test the robustness of these oscillations under different climate conditions, i.e., changes in atmospheric carbon dioxide concentration and orbital configuration. These experiments were run with intentions to better understand the range of conditions the oscillations can be sustained within the model and provide additional insight into the triggering mechanisms that control abrupt climate changes. The results of our sensitivity analysis show that small changes in carbon dioxide concentrations can impact the periodicity and existence of oscillations. A decrease in carbon dioxide concentration decreases periodicity, and an increase in carbon dioxide concentration increases periodicity, leading to an end of the oscillations. Our results also show that for changes in orbital configuration, an increase in Northern Hemisphere summer insolation decreases periodicity and potentially also amplitude. The results show that small changes in climate conditions can impact the shape and existence of oscillations and how this could relate to the changing periodicity and amplitude of observed Dansgaard-Oeschger events as well as transitions from glacial to interglacial states.

How to cite: Snoll, B., Ivanovic, R., Gregoire, L., Rome, Y., and Sherriff-Tadano, S.: Sensitivity of millennial-scale climate oscillations to boundary conditions in HadCM3 glacial simulations, EGU General Assembly 2024, Vienna, Austria, 14–19 Apr 2024, EGU24-5280, https://doi.org/10.5194/egusphere-egu24-5280, 2024.

Pleistocene temperatures correlate well with glacial-interglacial changes in global ice volume. While a discharge of ice-rafter debris (IRD) into the ocean directly reflects the rates of growth and decay (deglaciations) of glacial ice sheet margins at sea level, it is also the result of a rapidly changing global environment which affected both the meridional overturning in the ocean and the patterns in ocean-atmosphere circulation on a regional scale.  Circum-arctic land regions and adjacent ocean basins hold clues of varying ice sheet sizes through time. Understanding these records correctly is therefore an important asset to better appreciate Quaternary climate change also within a much broader global context. Marine sediment core data from the Nordic Seas show a stepwise trend of decreasing fluxes of IRD during major glaciations of the last 500 ka, i.e., marine isotope stages (MIS) 12, 6, and 2. Strongest IRD deposition occurred in MIS 12 (Elsterian), while it was lower in MIS 6 (Saalian) and 2 (Weichselian). These marine results of iceberg discharge rates from the western European margins, in particular, point to significant temporal changes in the ice-sheet coverage over northern Eurasia. Indeed, field data provide evidence for several major pre-Weichselian glaciations. Although their maximum limits were likely asynchronous in certain places, it seems evident that these ice sheets not only pre-date the Saalian time, they also extended much farther south (and east) than at any time later. The stepwise decreases in Eurasian ice-sheet extents during glacial maxima terminated in quite contrasting deglaciations and subsequent interglacial developments. It appears evident that such a systematic change in ice-sheet sizes were the result of specific ocean heat circulation, which influenced the pathways of atmospheric moisture transfer across northern Eurasia.

How to cite: Bauch, H.: Impact of waxing and waning of Northern Ice sheets on Pleistocene climate , EGU General Assembly 2024, Vienna, Austria, 14–19 Apr 2024, EGU24-5426, https://doi.org/10.5194/egusphere-egu24-5426, 2024.

EGU24-5549 | Orals | CL1.2.6

Simulated radiocarbon cycle revisited by considering the bipolar seesaw and benthic 14C data 

Peter Köhler, Luke Skinner, and Florian Adolphi

Carbon cycle models used to interpret the IntCal20 compilation of atmospheric Δ14C have so far neglected a key aspect of the millennial-scale variability connected with the thermal bipolar seesaw: changes in the strength of the Atlantic meridional overturning circulation (AMOC) related to Dansgaard/Oeschger and Heinrich events. Here we implement such AMOC changes in the carbon cycle box model BICYCLE-SE to investigate how model performance over the last 55 kyr is affected, in particular with respect to available 14C and CO2 data. Constraints from deep ocean 14C suggest that the AMOC in the model during Heinrich stadial 1 needs to be highly reduced or even completely shutdown. Ocean circulation and sea ice coverage combined are the processes that almost completely explain modelled changes in deep ocean 14C age, and these are also responsible for a glacial drawdown of ~60 ppm of atmospheric CO2. A further CO2 drawdown of ~25 ppm is caused by the colder ocean surface at the last glacial maximum. We find that the implementation of AMOC changes in the model setup that was previously used for the calculation of the non-polar mean surface marine reservoir age, Marine20, leads to differences of less than ±100 14C years. The representation of AMOC changes therefore appears to be of minor importance for deriving mean ocean radiocarbon calibration products such as Marine20, where atmospheric carbon cycle variables are forced by reconstructions. However, simulated atmospheric CO2 exhibits minima during AMOC reductions in Heinrich stadials, in disagreement with ice core data. This mismatch supports previous suggestions that millennial-scale changes in CO2 were probably mainly driven by biological and physical processes in the Southern Ocean. By modifying the 14C production rate (Q), between one that varies so as to fit simulated atmospheric ∆14C to IntCal20 and an alternative constant Q, we can furthermore show that in our model setup the variability in deep ocean 14C age, especially during the Bølling/Allerød—Younger Dryas—Early Holocene climate transition, has its root cause in the carbon cycle, while a Q that achieves agreement with the IntCal20 atmospheric ∆14C record only enhances deep ocean age anomalies and thus optimizes agreement with the benthic 14C data.

How to cite: Köhler, P., Skinner, L., and Adolphi, F.: Simulated radiocarbon cycle revisited by considering the bipolar seesaw and benthic 14C data, EGU General Assembly 2024, Vienna, Austria, 14–19 Apr 2024, EGU24-5549, https://doi.org/10.5194/egusphere-egu24-5549, 2024.

EGU24-6271 | ECS | Orals | CL1.2.6

High-resolution sedimentological and palaeoceanographic investigation of the Last Glacial Termination (T1) recorded on the western margin of the Svalbard (Arctic) 

Fernando Sergio Gois Smith, Renata Giulia Lucchi, Monica Bini, Caterina Morigi, Patrizia Ferretti, Laura Bronzo, and Nessim Douss

The Last Glacial Maximum (LGM) was defined based on the low stand sea-level records from the most recent period when global ice sheets reached their maximum volume, between 26,500 and 19,000 years before present. The end of this cold period was the last glacial termination (T1), occurred between 20 and 11.7 ka BP marking the transition to the current interglacial. During T1, the sea level rise responded to a variety of processes although the melting of the world widely distributed ice sheets was initially the main contributor and responsible for abrupt relative sea level rises known as meltwater pulses (MWPs) that deeply changed the Earth’s physiography. MWPs are short-lived global acceleration in sea-level rise resulting from intense glacial melting, surge of large ice streams into oceans and intense iceberg discharge during ice sheet disintegration. Nowadays, the main concerns related to the present fast global climate change is the possibility that sudden drastic ice loss from the Greenland and/or in the West Antarctic Ice Sheet would lead to a new abrupt acceleration of the relative sea level with consequent inundation of vast coastal areas and/or to cause an abrupt slowdown of the Atlantic Meridional Overturning Circulation (i.e. Golledge et al., 2019). To better understand the dynamics and risks associated with the onset of those events, their impact on thermohaline ocean circulation and climate it is pivotal the study of the well-preserved polar marine sediment records of the events occurred during the T1. Here, we present the results of a high-resolution sedimentological, micropaleontological and geochemical investigation of 3 sediment cores collected on the western margin of Svalbard and eastern side of the Fram Strait (Artic). The sediment cores were collected between 1322 m and 1725 m of water depth, in correspondence of the southern IODP sites that will be drilled during the IODP Exp-403 (June-August 2024).

How to cite: Gois Smith, F. S., Lucchi, R. G., Bini, M., Morigi, C., Ferretti, P., Bronzo, L., and Douss, N.: High-resolution sedimentological and palaeoceanographic investigation of the Last Glacial Termination (T1) recorded on the western margin of the Svalbard (Arctic), EGU General Assembly 2024, Vienna, Austria, 14–19 Apr 2024, EGU24-6271, https://doi.org/10.5194/egusphere-egu24-6271, 2024.

EGU24-6599 | ECS | Posters virtual | CL1.2.6

A two-phased Heinrich Stadial 11 as revealed by alkenone-based temperature record from the western tropical North Atlantic  

Anastasia Zhuravleva, Kirsten Fahl, and Henning A. Bauch

Paleo-data and models show that reductions in the strength of the Atlantic meridional overturning circulation (AMOC) lead to significant subsurface warming in the western tropical North Atlantic. The thermal response at the sea surface is less constrained due to the competing nature of the atmospheric and oceanic processes that produce opposite signs of temperature change. Here, we used alkenone unsaturation in sediments to reconstruct sea surface temperature (SST) evolution in the southeastern Caribbean (core MD99-2198, 1330 m water depth) during the last glacial-interglacial cycle, including Heinrich Stadial 11, which was a period of intense AMOC weakening. Our data show a 1 °C SST warming associated with the onset of Heinrich Stadial 11, and a 1 °C cooling during the late Heinrich, followed by a gradual 1 °C warming during the early last interglacial. Although stadial events are generally associated with wind-induced surface cooling in the tropical North Atlantic, the positive Caribbean SST anomaly during Heinrich Stadial 11 is consistent with previous findings. It likely originates from the upwelling of subsurface water that warmed in response to the initial AMOC weakening. Reduction in the Caribbean SST during the late Heinrich, associated with a particularly weak AMOC strength as suggested by our benthic d13C values, can indicate that the subsurface warming has diminished in the tropical North Atlantic possibly due to a general cooling in the source region (i.e., the subtropical gyre). A two-phased Heinrich is supported by the planktic foraminifera assemblage data, indicating that cooling occurred in the late Heinrich. In addition, this late phase is characterized by coarser sediments, which can be due to a strongly reduced outflow of the Orinoco and a particularly southern position of the intertropical convergence zone. For the last interglacial, our alkenone-derived SST record suggests stable conditions. However, the obtained interglacial values are characterized by very high alkenone unsaturation indexes that can incorporate large measurement and calibration errors due to the lack of Caribbean sediment traps and core-top data. These results, therefore, emphasize the need to better quantify the effectiveness of alkenones in reconstructing interglacial SST history in the Caribbean.

How to cite: Zhuravleva, A., Fahl, K., and Bauch, H. A.: A two-phased Heinrich Stadial 11 as revealed by alkenone-based temperature record from the western tropical North Atlantic , EGU General Assembly 2024, Vienna, Austria, 14–19 Apr 2024, EGU24-6599, https://doi.org/10.5194/egusphere-egu24-6599, 2024.

Understanding the impact of freshwater discharge from the late Pleistocene Laurentide Ice Sheet (LIS) to the North Atlantic has been considered pivotal due to its direct regulating influence on the climate of the surrounding continents. Numerous studies using indirect paleo-proxies for iceberg discharge and fine-grained sediment supply have reconstructed the instabilities of the LIS. This study employs direct proxies for iceberg discharge and fine-grained sediment supply using the ice-rafted detritus (IRD) and X-ray fluorescence (XRF) scan combined with published X-ray diffraction (XRD) data from the same samples of the Integrated Ocean Drilling Program (IODP) Site U1313 (41°N; 32.57°W). Prominent Heinrich IRD events (H-events) of the last glacial cycle were accompanied by Ti/Ca and Fe/Ca peaks, consistent with the dolomite and calcite peaks, suggesting their Ordovician and Silurian carbonate rocks source that floor the Hudson Bay and Hudson Strait. However, despite the lack of an IRD/g peak, Ti/Ca and Fe/Ca peaks in H-event 3 suggest the arrival of fine-grained sediments in the southern edge of the IRD belt, most likely by sediment plume. In contrast to the last glacial cycle, IRD/g and Ti/Ca and Fe/Ca peaks, often assigned as Heinrich-like events, were only identified during the cold marine isotope stage (MIS) 6, 8, 10, and 12. The IRD/g, Ti/Ca, and Fe/Ca peaks, in addition to the dolomite and calcite peaks during the MIS 7, suggest a fundamentally different configuration of the LIS compared to the other warm MISs of the last 500 ka. Our data suggest that the LIS-sourced icebergs impacted the northern edge of the subtropical gyre (STG) by directly injecting meltwater and modifying the upper water masses, which most likely resulted in the southward movements of the Polar and Arctic fronts. These frontal movements were accompanied by frequent encroachment of the subpolar to transitional water masses to the STG. The polar water-dwelling planktonic foraminifera Neogloboquadrina pachyderma coupled to the IRD/g or Fe/Ca and Ti/Ca peaks support this hypothesis. The new sedimentological and micropaleontological data suggest that the instability and configuration of the LIS were not uniform during all the warm MISs of the last 500 ka.

How to cite: Rashid, H., Zeng, M., and Menke, M.: Impact of the Laurentide Ice Sheet instabilities on the mid-latitude North Atlantic and subtropical gyre during the last five glacial cycles, EGU General Assembly 2024, Vienna, Austria, 14–19 Apr 2024, EGU24-6815, https://doi.org/10.5194/egusphere-egu24-6815, 2024.

EGU24-7296 | Orals | CL1.2.6

The Southern Ocean’s role in the global carbon cycle over the last 800 kyr constrained using reconstructions of the CO2 system 

Chen Xu, Jessica Crumpton-Banks, Madison Shankle, Megan Pelly, Hana Jurikova, Jimin Yu, Bradley Opdyke, Claus-Dieter Hillenbrand, Andrea Burke, and James Rae

The critical role of the Southern Ocean in controlling the Pleistocene atmospheric CO2 oscillations is widely acknowledged. However, owing to sampling difficulties surrounding Antarctica, the underlying mechanism and associated pathway of ocean-atmosphere CO2 exchange in the Antarctic Zone (AZ) of the Southern Ocean remains mysterious. Here, we present a new planktonic δ11B record from sediment core PS1506 (68.73°S, 5.85°W) that tracks the pH and surface pCO2 of the AZ over the last 8 glacial cycles. These data are complemented by benthic B/Ca and carbonate preservation indices; due to the location of this core on the continental margin of the eastern Weddell Sea, these data allow us to track the source CO2 chemistry of the dense Antarctic waters that feed the ocean’s lower overturing cell. We find coherent CO2 change between surface and deep waters, indicating persistent formation of AABW that transfers Antarctic surface water signals to depth. Critically, we discover abrupt AZ CO2 decline during glacial onset conditions, coinciding with initial atmospheric CO2 drawdown, highlighting the AZ’s key control on glacial-interglacial CO2 change. After assessing proposed drivers, our findings implicate shifts in Southern Ocean circulation linked to changes in sea ice and/or the Southern Hemisphere westerlies in this glacial onset CO2 change, while productivity, solubility, and sea ice 'lid' effects appear insignificant or counterproductive in this region and time interval. Overall, these reconstructed CO2 system dynamics provide critical insights into Southern Ocean carbon cycling and the associated influence on the atmosphere.

How to cite: Xu, C., Crumpton-Banks, J., Shankle, M., Pelly, M., Jurikova, H., Yu, J., Opdyke, B., Hillenbrand, C.-D., Burke, A., and Rae, J.: The Southern Ocean’s role in the global carbon cycle over the last 800 kyr constrained using reconstructions of the CO2 system, EGU General Assembly 2024, Vienna, Austria, 14–19 Apr 2024, EGU24-7296, https://doi.org/10.5194/egusphere-egu24-7296, 2024.

Global sea-level changes are significantly associated with variations in Northern Hemisphere ice sheets (NHISs) during the last glacial cycle. However, their responses to glacial millennial-scale climate variability (also known as Dansgaard - Oeschger (DO) cycles), especially during the Marine Isotope Stage 3 (MIS3, ~30-65ka), remains poorly studied, in addition to the contrast lines of geological evidence regarding paleo-sea level changes. Instead of applying Glacial Index Method which overlooks potential tempo-spatial heterogeneity of temperature and precipitation in the northern high latitudes, in this study, we conducted transient PISM ice sheet modeling by imposing full climate forcing derived from fully coupled climate model experiments which are characterized by spontaneous millennial variability. Our results show that control factors of ice volume changes in Laurentide and Eurasian ice sheets are different due to spatially heterogenous climate forcing. During stadial periods, North American Ice sheets is growing because of increased precipitation especially along the margins of the ice sheets, despite spatially heterogenous but trivial changes in the surface air temperature. Meanwhile, dramatic cooling on the southern regions of Eurasian Ice sheets effectively reduces ice loss and hence promote the overall ice growth. In brief, NHIS ice volume grows during stadials while declines during interstadials. We hence propose that stadial-to-interstadial duration ratio is the key to the net change in NHIS volume in a signal DO cycle, providing dynamic understanding of accelerated sea level drop during 40-30ka.

How to cite: Zhang, Y. and Zhang, X.: Millennial-scale Northern Hemisphere ice sheet growth controlled by stadial-versus-interstadial duration, EGU General Assembly 2024, Vienna, Austria, 14–19 Apr 2024, EGU24-7339, https://doi.org/10.5194/egusphere-egu24-7339, 2024.

EGU24-8676 | Posters on site | CL1.2.6

Abrupt climate changes triggered with GLAC-1D ice sheet, but not with ICE-6G_C, in simulations of the Last Glacial Maximum/Deglaciation 

Ruza Ivanovic, Yvan Rome, Lauren Gregoire, Brooke Snoll, Oliver Pollard, and Jacob Perez

In the course of glacial terminations, the increases in greenhouse gas concentrations, summer insolation and the ice sheet demise can trigger episodes of millennial-scale variability. Such variability was observed during the last deglaciation, between 19 ka BP (thousand years ago) and 8 ka BP, in the form of  the abrupt North Atlantic temperature shifts of the Bølling–Allerød Warming (14.5 ka BP) and Younger Dryas (12.900 ka BP).

In some climate models, abrupt climate changes are generated by modifications to the boundary conditions and freshwater discharge. Despite much study, the sensitivity of climate simulations to ice sheet geometry and meltwater is complex and not fully understood, which is a caveat when considering the impact of the rapid demise of the Northern Hemisphere ice sheets during the last deglaciation. In a new set of last glacial maximum HadCM3 simulations that can produce millennial-scale variability, we studied the influence of two ice sheet reconstructions, ICE-6G_C and GLAC-1D, and their associated deglacial meltwater history, on the simulated chain of events of the last deglaciation.

In this experiment, our simulations using the GLAC-1D ice sheet reconstruction produced abrupt climate changes. Triggered by freshwater released close to the Nordic Seas and Iceland Basin deep water formation sites, these simulations display abrupt shifts in the Atlantic Meridional Overturning Circulation (AMOC) that are decoupled from the meltwater flux. In contrast, the reconstructed ICE-6_G ice sheet modifies the North Atlantic wind patterns in the model, preventing convection in the Nordic Seas and intensifying the Iceland Basin deep water formation. As a result, no abrupt climate changes are simulated with ICE-6G_C ice sheets and the AMOC decreases almost linearly with the introduction of freshwater.

The simulations do not capture the timing of the last deglaciation chain of events, but the modelled abrupt changes replicate the main Northern Hemisphere characteristics of the Bølling Warming/Younger Dryas transitions, and are very similar to Dansgaard-Oeschger events.

How to cite: Ivanovic, R., Rome, Y., Gregoire, L., Snoll, B., Pollard, O., and Perez, J.: Abrupt climate changes triggered with GLAC-1D ice sheet, but not with ICE-6G_C, in simulations of the Last Glacial Maximum/Deglaciation, EGU General Assembly 2024, Vienna, Austria, 14–19 Apr 2024, EGU24-8676, https://doi.org/10.5194/egusphere-egu24-8676, 2024.

EGU24-8715 | ECS | Orals | CL1.2.6

Tracking the fate of meltwater from different Northern ice sheet sectors over Heinrich Stadial 1 

Laura Endres, Ruza Ivanovic, Yvan Romé, Julia Tindall, and Heather Stoll

The addition of meltwater from continental ice sheets to the North Atlantic is thought to have played a pivotal role in the reorganization of climate and ocean circulation over the last deglaciation as well as during Heinrich events. This is supported by recent analysis of PMIP and CMIP results, which shows that meltwater addition into the North Atlantic can largely alter global climate, and remains a key uncertainty for both reconstruction and climate projections. 

To date, most model studies of freshwater “hosing” assume a relatively uniform distribution and apply meltwater to a large portion of the North Atlantic basin. However, AMOC weakening is sensitive to the actual input position of the typically cold and non-saline meltwater perturbation, and, on a centennial-millennial timescale, the resulting temperature and salt anomaly will only partially disperse over the entire North Atlantic surface ocean. In contrast, most proxy data sensitive to meltwater record the signal at a specific location. It is unclear if spatial heterogeneity of the ocean’s distribution of the meltwater anomaly may contribute to disagreements between freshwater proxy records and model simulations with freshwater additions tuned to reproduce the record of past AMOC weakenings.

To enhance understanding of the spatial distribution of meltwater anomalies during deglaciations, we present the results of a model sensitivity study using HadCM3 and artificial dye tracers to track the fate of meltwater originating from different Northern ice sheet sectors. We consider different meltwater scenarios consistent with Heinrich Stadial 1 ice sheet reconstructions and compare the results under different AMOC states. The results confirm that, on a centennial timescale, meltwater distribution is not uniform over the North Atlantic Ocean. The emerging patterns expose that the efficiency of a meltwater injection to produce a surface ocean anomaly (in, e.g., salinity or δ18Osw) at a given proxy location differs between different ice sheet sectors by orders of magnitudes. Further, besides the direct effect of meltwater, the sensitivity of climate indicators, such as temperature, to changes in AMOC strength also shows regional discrepancies. 

How to cite: Endres, L., Ivanovic, R., Romé, Y., Tindall, J., and Stoll, H.: Tracking the fate of meltwater from different Northern ice sheet sectors over Heinrich Stadial 1, EGU General Assembly 2024, Vienna, Austria, 14–19 Apr 2024, EGU24-8715, https://doi.org/10.5194/egusphere-egu24-8715, 2024.

EGU24-9143 | Orals | CL1.2.6

Bipolar control on millennial atmospheric CO2 changes over the past glacial cycle 

Jimin Yu, Robert Anderson, Zhangdong Jin, Xuan Ji, David Thornalley, Lixin Wu, Nicolas Thouveny, Yanjun Cai, Liangcheng Tan, Fei Zhang, Laurie Menviel, Jun Tian, Xin Xie, Eelco Rohling, and Jerry McManus

Ice-core measurements show diverse atmospheric CO2 variations – increasing, decreasing or remaining stable – during millennial-scale North Atlantic cold periods called stadials. The reasons for these contrasting trends remain elusive. Ventilation of carbon-rich deep oceans can profoundly affect atmospheric CO2, but its millennial-scale history is poorly constrained. In this study, I will show a high-resolution deep-water acidity record from the Iberian Margin in the North Atlantic, a unique setting that allows us to construct a robust chronology for confident comparisons between marine and ice-core records. The new data combined with ice-core CO2 records reveal multiple ocean ventilation modes involving an interplay of the two polar regions, rather than by the Southern Ocean alone. These modes governed past deep-sea carbon storage and thereby atmospheric CO2 variations on millennial timescales. Overall, our record suggests a bipolar control on millennial atmospheric CO2 changes during the past glacial cycle.

How to cite: Yu, J., Anderson, R., Jin, Z., Ji, X., Thornalley, D., Wu, L., Thouveny, N., Cai, Y., Tan, L., Zhang, F., Menviel, L., Tian, J., Xie, X., Rohling, E., and McManus, J.: Bipolar control on millennial atmospheric CO2 changes over the past glacial cycle, EGU General Assembly 2024, Vienna, Austria, 14–19 Apr 2024, EGU24-9143, https://doi.org/10.5194/egusphere-egu24-9143, 2024.

EGU24-9411 | ECS | Orals | CL1.2.6

An Early Warming Over the Southern Ocean During the Last Deglaciation 

Peisong Zheng, Matthew Osman, and Thomas Bauska

The last deglaciation, spanning approximately 23 to 6 thousand years before present (ky BP), represents the most recent period in which Earth’s climate underwent large-scale reorganizations comparable (albeit not strictly analogous) to those projected under future climate changes. However, the precise sequence of events – in particular, the timing and spatial manifestation of the initial warming – remains uncertain. Here we present a new method using Gaussian Mixture Model clustering to objectively decompose a model and proxy-based climate reconstruction (LGMR; Osman et al., 2021) into four patterns of temperature change across the last deglaciation. Broadly speaking, the patterns allow us to delineate the impact of retreating Northern Hemisphere ice sheets, the rise in greenhouse gases, and the influence of the bipolar seesaw. Crucially, our analysis reveals that the high latitudes of the Southern Hemisphere exhibited the earliest signs of warming onset around 21 kyr BP, coincident with a retreat of sea ice across the Southern Ocean. A similar pattern is observed when decomposing a solely model-based climate reconstruction (TraCE-21k; He et al., 2013).  Using a combination of both highly-simplified energy balance-type models and fully-coupled climate models forced with insolation alone, we show that the early warming and sea ice retreat was likely linked to an initial rise in high latitude summertime energy that is dominated by enhanced obliquity-driven forcing. Our findings collectively suggest that insolation dynamics in the Southern Hemisphere were a critical trigger of the Last Deglacial onset and, further, may represent one of the key prerequisites for glacial terminations during the late Pleistocene.

How to cite: Zheng, P., Osman, M., and Bauska, T.: An Early Warming Over the Southern Ocean During the Last Deglaciation, EGU General Assembly 2024, Vienna, Austria, 14–19 Apr 2024, EGU24-9411, https://doi.org/10.5194/egusphere-egu24-9411, 2024.

EGU24-9419 | ECS | Orals | CL1.2.6

Assessing transient changes in the ocean carbon cycle during the last deglaciation through carbon isotope modeling  

Hidetaka Kobayashi, Akira Oka, Takashi Obase, and Ayako Abe-Ouchi

Atmospheric carbon dioxide concentrations (pCO2) have increases by approximately  from the Last Glacial Maximum (LGM) to the late Holocene (last deglaciation). These changes in atmospheric greenhouse gases are recognized as climate system responses to gradual changes in insolation. Previous modeling studies have suggested that the deglacial increases in atmospheric pCO2 are primarily attributed to the release of CO2 from the ocean. In addition, it has been suggested that abrupt changes in the Atlantic Meridional Overturning Circulation (AMOC) and associated interhemispheric climate changes are involved in the release of CO2. However, there is still limited understanding in oceanic circulation changes, factors responsible for changes in chemical tracers in the ocean of the last deglaciation and its impact on atmospheric pCO2.

In this study, we investigate the evolution of the ocean carbon cycle during the last deglaciation (21 to 11 ka BP) using three-dimensional ocean fields from the transient simulation of the MIROC 4m climate model, which exhibits abrupt AMOC changes as in reconstructions. We validate the simulated ocean carbon cycle changes and discuss possible biases and missing or underestimated processes in the model by comparing simulated carbon isotope ratios with sediment core data.

The qualitative changes in atmospheric pCO2 are consistent with ice core records: during Heinrich Stadial 1 (HS1), atmospheric  increases by . This is followed by a decrease of  during the Bølling–Allerød (BA) and an increase of  during the Younger Dryas (YD). However, the model underestimates the changes in atmospheric  during these events compared to ice core data. Radiocarbon and stable isotope signatures ( and ) indicate that the model underestimates the activated deep ocean ventilation and reduced efficiency of biological carbon export in the Southern Ocean, and active ventilation in the North Pacific Intermediate Water during HS1. The relatively small changes in simulated atmospheric  changes during HS1 may be attributed to these underestimations of ocean circulation changes. The changes in  associated with strengthening and weakening in the AMOC during the BA and YD are generally consistent with the sediment core record. On the other hand, while the data show a continuous  increase in the deep ocean throughout the YD, the model shows the opposite trend. This suggests that the model simulates excessive weakening of the AMOC during the YD, or limited representations in geochemical processes in the model including marine ecosystem responses and terrestrial carbon storage.

Decomposing the factors behind changes in ocean  reveals that changes in temperature and alkalinity have the main effects on atmospheric  changes. The compensation of the effects of temperature and alkalinity suggests the AMOC changes and associated bipolar climate changes contribute to a slight decrease or increase in atmospheric  during the BA and YD periods, respectively.

How to cite: Kobayashi, H., Oka, A., Obase, T., and Abe-Ouchi, A.: Assessing transient changes in the ocean carbon cycle during the last deglaciation through carbon isotope modeling , EGU General Assembly 2024, Vienna, Austria, 14–19 Apr 2024, EGU24-9419, https://doi.org/10.5194/egusphere-egu24-9419, 2024.

Be10 in ice cores provides a uniquely well resolved indication of past radionuclide production rates, with a direct bearing on past radiocarbon production.  In the absence of past carbon cycle perturbations (e.g. involving ocean-atmosphere carbon exchange), Be10-based radiocarbon production rate anomalies should correlate directly with atmospheric radiocarbon anomalies, as confirmed by models.  Over the past ~30ka, Be10-inferred radiocarbon production rates and atmospheric radiocarbon (i.e. Intcal20) both exhibit recurrent millennial anomalies, typically of ~5ka duration.  A correlation between these anomalies breaks down during the deglaciation.  This is intriguing and suggests a mix of millennial carbon cycle and radionuclide production influences. Here, global compilations of marine carbon isotope data (radiocarbon and 𝛿13C) are used to assess the potential contribution of ocean circulation and air-sea gas exchange to the apparent millennial component of variability in Intcal20, and atmospheric CO2. We find that existing marine 𝛿13C data provide strong support for a marine influence on atmospheric radiocarbon. Support from marine radiocarbon data is more complex, due to the influence of ‘attenuation biases’ (arising from radiocarbon production changes), and due to a distinct regionalism in the ocean’s impact on atmospheric radiocarbon, versus atmospheric CO2, with air-sea gas-exchange playing a significant role. Major differences in the long-term evolution of radiocarbon and 𝛿13C across the last deglaciation further point to distinct and independent controls on these isotopes systems, providing clues as to the nature and timing of different carbon cycle processes during deglaciation.

How to cite: Skinner, L.: Globally resolved marine carbon isotope data spanning the last 25ka: what do they tell us about the drivers of atmospheric radiocarbon and CO2 on millennial and deglacial timescales? , EGU General Assembly 2024, Vienna, Austria, 14–19 Apr 2024, EGU24-9678, https://doi.org/10.5194/egusphere-egu24-9678, 2024.

EGU24-9708 | ECS | Orals | CL1.2.6

Glacial-interglacial variability using a low-complexity, physically based model 

Sergio Pérez-Montero, Jorge Alvarez-Solas, Marisa Montoya, and Alexander Robinson

Pleistocene glacial-interglacial variability is still under debate, as the many hypotheses proposed are subject to the models used and assumptions made. The longer time scales involved in glacial cycles make it difficult to use comprehensive climate models because of its large computational cost. In this context, conceptual models are built to mimic complex processes in a simpler and more computationally efficient way. Here we present a conceptual climate-ice sheet model that aims to represent the state-of-the-art physical processes affecting glacial-interglacial variability. Our model was constructed using linear equations that explicitly represent ice-sheet modeling approaches. Preliminary results are consistent with Late Pleistocene variability and point to the existence of nonlinearities related to both ice dynamics and ice aging that determine the timing and shape of deglaciations.

How to cite: Pérez-Montero, S., Alvarez-Solas, J., Montoya, M., and Robinson, A.: Glacial-interglacial variability using a low-complexity, physically based model, EGU General Assembly 2024, Vienna, Austria, 14–19 Apr 2024, EGU24-9708, https://doi.org/10.5194/egusphere-egu24-9708, 2024.

EGU24-10190 | Orals | CL1.2.6

Perspective on ice age Terminations from absolute chronologies provided by global speleothem records 

Nikita Kaushal, Heather Stoll, and Carlos Pérez-Mejías

Glacial Terminations represent the largest amplitude climate changes of the last several million years.  Over ~ 10 ky timescale, large northern hemisphere ice sheets retreat and sea level rises, and atmospheric CO2 and global temperatures make a full transition from glacial to interglacial levels.  Several possible orbital-insolation triggers have been described to initiate and sustain glacial Terminations, and feedbacks between ice sheet retreat, ocean circulation and ocean carbon storage are invoked to explain the unstoppable progression. 

Because of the availability of radiocarbon dating, the most recent termination (TI) has been extensively characterized. Yet, it is widely discussed whether this sequence of feedbacks and millennial events, and rate of warming is recurrent over previous Terminations or is unique.  Beyond the limit of radiocarbon dating, the chronologies of climate records from ice and marine cores are often developed by tuning to orbital parameters which limits their use in understanding climate dynamics, particularly the response to orbital forcing.

Speleothems provide absolute age control and high-resolution proxy measurements. This archive therefore provides unique records of climate change across Terminations, and additionally may provide the opportunity to tune ice and marine core archives.  However, speleothem climate signals are encoded in a number of proxies. Unlike proxies in other archives like ice or marine cores, the climatic interpretation of a given proxy can vary quite significantly among different regions.

In this study, we

  • synthesize the available speleothem records providing climate information for Terminations: TII, TIII, TIV and TV.
  • present the records based on the aspect of climate encoded in the available records.
  • examine the effects of different ice volume corrections on the final climate proxy record.
  • evaluate whether there are leads and lags in the manifestation of Terminations across different aspects of the climate systems and different regions.
  • we speculate on suitable tuning targets among marine and ice core proxies, and discuss what model outputs maybe most suitable for comparison.

How to cite: Kaushal, N., Stoll, H., and Pérez-Mejías, C.: Perspective on ice age Terminations from absolute chronologies provided by global speleothem records, EGU General Assembly 2024, Vienna, Austria, 14–19 Apr 2024, EGU24-10190, https://doi.org/10.5194/egusphere-egu24-10190, 2024.

EGU24-10579 | Orals | CL1.2.6

A mechanism for reconciling the synchronisation of Heinrich events and Dansgaard-Oeschger cycles 

Clemens Schannwell, Uwe Mikolajewicz, Marie-Luise Kapsch, and Florian Ziemen

The evolution of the northern hemispheric climate during the last glacial period was shaped by two prominent signals of glacial climate variability known as Dansgaard-Oeschger cycles and Heinrich events. Dansgaard- Oeschger cycles are characterised by a period of rapid, decadal warming of up to 14°C in the high northern latitudes, followed by a more gradual cooling spanning several centuries. Temperature reconstructions from ice cores indicate a dominant recurrence interval of ∼1,500 years for Dansgaard-Oeschger cycles. Heinrich events are quasi-episodic iceberg discharge events from the Laurentide ice sheet into the North Atlantic. The paleo record places most Heinrich events into the cold phase of the millennial-scale Dansgaard-Oeschger cycles. However, not every Dansgaard-Oeschger cycle is accompanied by a Heinrich event, revealing a complex interplay between the two prominent modes of glacial variability that remains poorly understood to this day. Here, we present simulations with a coupled ice sheet-solid earth model to introduce a new mechanism that explains the synchronicity between Heinrich events and the cooling phase of the Dansgaard-Oeschger cycles. Unlike earlier studies, our proposed mechanism does not require a trigger mechanism during the cooling phase. Instead, the atmospheric warming signal associated with the interstadial phase of the Dansgaard-Oeschger cycle causes enhanced ice stream thickening such that a critical ice thickenss and temperature threshold is reached faster, triggering the Heinrich event during the early cooling phase of the Dansgaard-Oeschger cycle. An advantage of our mechanism in comparison to previous theories is that it is not restricted to marine-terminating ice streams, but applies equally to land-terminating ice streams that only become marine-terminating during the actual Heinrich event. Our simulations demonstrate that this mechanism is able to reproduce the Heinrich event characteristics as known from the paleo record under a wide range of forcing scenarios and provides a simple explanation for the observational evidence of synchronous Heinrich events from different ice streams within the Laurentide ice sheet.

How to cite: Schannwell, C., Mikolajewicz, U., Kapsch, M.-L., and Ziemen, F.: A mechanism for reconciling the synchronisation of Heinrich events and Dansgaard-Oeschger cycles, EGU General Assembly 2024, Vienna, Austria, 14–19 Apr 2024, EGU24-10579, https://doi.org/10.5194/egusphere-egu24-10579, 2024.

Despite decades of research, the cause of glacial-interglacial CO2 cycles is not fully understood, leaving a critical gap in our understanding of Earth’s climate system. One hypothesis is that shoaling of the boundary between Northern Source Water (NSW) and Southern Source Water (SSW) enhanced oceanic carbon sequestration during glacial intervals, resulting in lower atmospheric pCO2. To test this hypothesis, we generated vertical profiles of [CO32-], δ13C, and δ18O using a depth transect of cores from the Brazil Margin, focusing on the two major drops in atmospheric pCO2 during the last glacial cycle at ~115 ka and ~70 ka. Given that [CO32-] is inversely related to the concentration of dissolved inorganic carbon, [CO32-] should decrease if the Atlantic sequestered CO2. We observe no significant change in the [CO32-] across the first decrease in atmospheric pCO2 and no evidence for watermass boundary shoaling in the δ13C and δ18O profiles.  [CO32-] decreased only at ~3600 m, the core site most influenced by SSW.  During the second pCO2 decline at ~70 ka, [CO32-] decreased by ~30 µmol/kg below 2000 m water depth, coincident with marked shoaling in the δ13C and δ18O profiles. The lack of evidence for shoaling and deep Atlantic carbon sequestration at ~115 ka, a time of intermediate ice sheet extent and moderate global cooling, but the clear evidence for shoaling and carbon sequestration at ~70 ka, a time of near glacial maximum ice sheet extent, implies that the deep Atlantic’s capacity to store carbon depends on the Earth’s mean climate state. Our results highlight that distinct mechanisms are necessary to explain the two major drops in atmospheric pCO2 of the last glacial cycle. 

How to cite: Garity, M. and Lund, D.: Investigating oceanic carbon sequestration during glacial inception using vertical profiles of [CO32-], d13C, and d18O from the Southwest Atlantic, EGU General Assembly 2024, Vienna, Austria, 14–19 Apr 2024, EGU24-12112, https://doi.org/10.5194/egusphere-egu24-12112, 2024.

EGU24-12199 | ECS | Orals | CL1.2.6

Reconstructing the global mean surface temperature of the last 130 thousand years 

Jean-Philippe Baudouin, Nils Weitzel, Lukas Jonkers, Andrew M. Dolman, and Kira Rehfeld

Global mean surface temperature (GMST) is a fundamental measure of climate evolution in both past and present and a key quantity to evaluate climate simulations. However, for paleoclimate periods, its reconstruction hinges on uncertain and indirect observations which are distributed sparsely and non-uniformly in both space and time. Large datasets of homogenised proxy records help to reduce the sparsity. Then, the records can be aggregated in an algorithm retrieving the GMST signal. Here, we build on the algorithm designed in Snyder 2016, and on a recent database of ocean temperature proxy records to reconstruct the GMST evolution over the last glacial cycle (the last 130 thousand years). First, we evaluate the algorithm and quantify the sources of uncertainty. This analysis draws on pseudo-proxy experiments using a range of simulations of the last glacial cycle. We find that the over-representation of some regions (e.g. coasts, the Atlantic), to the detriment of others (e.g. the central Pacific) significantly impacts the reconstructed temperature anomaly and its variations. Additionally, millennial and shorter timescale variability cannot be reconstructed by the algorithm, due to bioturbation and age uncertainty. However, these experiments also demonstrate the ability of our algorithm to reconstruct the amplitude and timing of GMST variations occurring at orbital timescale (>10.000 years). Second, we reconstruct the GMST evolution during the last glacial cycle. We compare our result to previous studies, and discuss the improvements coming from the use of the recent proxy database. The high number of proxy records allow us to additionally investigate smaller regions (e.g. hemisphere) and overall further our understanding of the driver of orbital-scale GMST variability.

How to cite: Baudouin, J.-P., Weitzel, N., Jonkers, L., Dolman, A. M., and Rehfeld, K.: Reconstructing the global mean surface temperature of the last 130 thousand years, EGU General Assembly 2024, Vienna, Austria, 14–19 Apr 2024, EGU24-12199, https://doi.org/10.5194/egusphere-egu24-12199, 2024.

EGU24-13226 | Posters on site | CL1.2.6

Super-cooled glacial deep waters 

Miho Ishizu, Axel Timmermann, and Kyung-Sook Yun

Sea-ice formation in the Southern Ocean can generate supercooled waters, which can even remain below the in-situ freezing point at depths below 1,000 m. These water masses can play an important role in carbon transport to the abyssal ocean and may have therefore also played an important role in glacial-interglacial CO2 cycles.

To address this question, we examined model outputs from the transient 3 Ma simulation conducted with the CESM1.2 model (Community Earth System Model version 1.2, ~3.75 horizontal resolution. This simulation was driven by time-varying orbital forcing and estimates of atmospheric greenhouse gas concentrations and northern hemispheric ice-sheet orography and albedo. Our analysis shows the presence of large swaths of supercooled glacial deep waters mainly in the northern Pacific. This water is originally formed in the seasonal sea-ice formation regions in the subarctic North Pacific during periods of brine release and rapid mixed layer deepening. During interglacial periods, the volume of supercooled water decreases, which may hint towards a possible positive climate-carbon cycle feedback.

In climate models the freezing condition is usually only applied at the surface. Hence, they are incapable of simulating brinicles – vertical sea-ice structures that can extend from the surface to shallower depths, sometimes even reaching the ocean floor. In my presentation, I will address whether such structures may have played a more prominent role during glacial periods, and whether localized deep ocean freezing may have been a possibility.

How to cite: Ishizu, M., Timmermann, A., and Yun, K.-S.: Super-cooled glacial deep waters, EGU General Assembly 2024, Vienna, Austria, 14–19 Apr 2024, EGU24-13226, https://doi.org/10.5194/egusphere-egu24-13226, 2024.

EGU24-14346 | Orals | CL1.2.6

Weathering of shelf sediments exposed during a glacial period: Evidence from geochemistry and Sr-Nd isotopes 

Gyana Ranjan Tripathy, Priyasha Negi, Rakesh Kumar Rout, and Ravi Bhushan

Erosion of continental rocks controls nutrient and sediment supply, soil formation and global climate. Intensity of this land-surface process is driven by both climatic (runoff, and temperature) and non-climatic (vegetation, lithology and basin slope) factors. Additionally, climatic-driven fluctuations in sea-level may also influence the exposed land-area, which is available for weathering. The coupling between exposed shelf sediments and weathering, however, has received limited attention. In this contribution, geochemical and Sr-Nd isotopic compositions of a sediment core (VM29-17PC) from the western Bay of Bengal have been investigated to reconstruct weathering and climate interaction during last glacial-interglacial cycle. Radiocarbon dating of foraminifera samples establishes that the core preserves a continuous erosional record for last 35 kyr.  Average Sr-Nd isotopic data for the decarbonated sediments confirm dominant sediment supply from the Higher Himalaya to the core site, with sub-ordinate input from the Deccan region. Temporal changes in the isotopic data hint at a sudden increase in the Himalayan source around 15 kyr BP, which is synchronous with the Bølling-Allerød (B/A) warm phase and the strengthening of the south-west (SW) monsoon. Downcore variation of Chemical Index of Alteration (CIA) and K/Al ratios indicates intensification of chemical weathering around 25 kyr BP. This change in weathering intensity is synchronous to dropping of sea level due to onset of glaciation. This sea-level regression and sudden rise in CaCO3 concentration during this period point to weathering of additional surface exposed in the shelf regions. This enhanced weathering of the shelf sediments may have contributed to the atmospheric CO2 level during the glacial period.

How to cite: Tripathy, G. R., Negi, P., Rout, R. K., and Bhushan, R.: Weathering of shelf sediments exposed during a glacial period: Evidence from geochemistry and Sr-Nd isotopes, EGU General Assembly 2024, Vienna, Austria, 14–19 Apr 2024, EGU24-14346, https://doi.org/10.5194/egusphere-egu24-14346, 2024.

EGU24-14882 | ECS | Orals | CL1.2.6

Impact of marine productivity on atmospheric pCO2 during the Last Glacial Maximum: a model-data comparison 

Pauline Depuydt, Stéphanie Duchamp-Alphonse, Nathaelle Bouttes, Chiara Guarnieri, Alice Karsenti, Ji-Woong Yang, Jean-Yves Peterschmitt, and Amaëlle Landais

Measurements of the air trapped in Antarctic ice cores reveal that atmospheric CO2 concentration (pCO2) during the Last Glacial Maximum (LGM) was about 80 ppmv lower than that recorded during the current Holocene interglacial (Bereiter et al., 2015). Studies also show a strong link between pCO2, ice volume and Antarctic temperature, suggesting pCO2 as a forcing or amplifying factor behind glacial/interglacial cycles (Petit et al., 1999; Parrenin et al., 2013). Despite such importance in the global climate changes, mechanisms behind rapid variations in pre-anthropic pCO2 remain elusive. Numerical models emphasized the crucial role of exported marine productivity Pexp, (namely, the Soft Tissue Pump) in such changes. In particular, they feature marine productivity patterns from the Southern Ocean and show that a decrease in Pexp in the Sub-Antarctic zone, linked to a reduction in iron inputs from aeolian dusts, could have increased pCO2 by 20 to 50 ppmv (Köhler and Fischer, 2006; Martínez-Garcia et al., 2009; Lambert et al., 2012). However, these studies are usually compared to proxy data from the Atlantic sector of the Subantarctic Zone i.e., an area under the direct influence of wind fields that makes it possible to test the “Fe-hypothesis” (Martin et al., 1990) but that is not necessarily representative of the entire ocean (e.g. Lambert et al., 2015). Due to a lack of recent Pexp data compilation but also of direct comparisons with model outputs integrating marine biogeochemistry­­, it remains difficult to understand the role marine biological productivity exerted on the carbon cycle and more specifically on the low pCO2 during the LGM.

The aim of this study is to explore Pexp patterns during the LGM compared to the pre-industrial Holocene and understand the mechanisms driving their global changes, in order to try and estimate the contribution of marine productivity to the pCO2 signalbased on (i) a new compilation of Pexp proxy data using the strategy previously proposed by Kohfeld et al. (2005) after Bopp et al., (2003), and (ii) a comparison of these data to outputs from the iLOVECLIM intermediate complexity.

Proxy data show that Pexp is generally higher during the LGM compared to the pre-industrial Holocene. This is particularly the case in the sub-Antarctic and sub-Arctic areas, in the equatorial Atlantic Ocean and in coastal upwelling settings i.e., regions that usually witness higher nutrient content due to revigorated ocean circulation and/or intensified surface winds. Simulations generally confirm such features except from the coastal upwelling and the Southern Ocean, due to a lack of spatial resolution and of aeolian inputs in the model, respectively. However, preliminary results from sensitivity tests show (i) net marine productivity fronts around ~40°N and 45°S due to extended sea ice cover and reduced global temperature, (ii) a decreased Pexp in the Pacific Ocean due to an overall thermohaline circulation slow down and (iii) an increase of Pexp in areas where fertilization by iron-rich dusts is expected (Lambert et al., 2021).

How to cite: Depuydt, P., Duchamp-Alphonse, S., Bouttes, N., Guarnieri, C., Karsenti, A., Yang, J.-W., Peterschmitt, J.-Y., and Landais, A.: Impact of marine productivity on atmospheric pCO2 during the Last Glacial Maximum: a model-data comparison, EGU General Assembly 2024, Vienna, Austria, 14–19 Apr 2024, EGU24-14882, https://doi.org/10.5194/egusphere-egu24-14882, 2024.

EGU24-14929 | ECS | Orals | CL1.2.6

Significant change in the flow regime in the deep Southern Ocean through the MPT 

Eva M. Rückert and Norbert Frank

The deep Southern Ocean (SO) circulation is of major significance for the understanding of the ocean´s impact on Earth’s climate as uptake and release of CO2 strongly depend on the redistribution of well and poorly ventilated water masses.

Neodymium isotopes (εNd) preserved in deep sea sediment have proven useful to study the Deep Ocean Circulation and water mass provenance and are of special interest over major climate changes as the Mid Pleistocene Transition (MPT). The MPT marks the change from a 41 ka to a 100 ka glacial-interglacial cyclicity and goes along with a significant intrusion of southern sourced waters (SSW) in the deep North Atlantic.

Here, we present the first millennial resolved authigenic εNd data in the Southern Atlantic spanning across  the MPT of a deep sea sediment core positioned at the polar front. The pre-MPT εNd values of ODP 1093 show a small variability of approx. 2 ε-units around the modern AABW signature of -8. In contrast, the post-MPT εNd variability increases to 6 ε-units with glacial extremes of around -3 – εNd values that can not be found in any Atlantic sourced water mass today!

This supports not only the exsiting hypotesis of stonger SSW export to the North, but rather advocates for a radiogenic  watermass influencing the flow regime in the Atlantic south of the polar front. Increasing ice volume during post-MPT glacials has been argued to lead to a reduced AABW production. Due to continuity of flow, this opens up the possiblity of glacial intrusion through the Drake passage of a water masses likely originating in the Pacific, which would generate  the strongly radiogenic glacial εNd values. At present Pacific deep waters are enriched with respired carbon. Assuming this to hold true in the past, the intrusion of such carbon rich water masses into the deep South Atlantic could further reinforce the strong glacials and the overall global cooling trend after the MPT as suggested previously.

Hence, the SO south of the polar front played a leading role in  reinjecting respired CO2 into the deep Atlantic Ocean and the Atmosphere during climate transitions. 

How to cite: Rückert, E. M. and Frank, N.: Significant change in the flow regime in the deep Southern Ocean through the MPT, EGU General Assembly 2024, Vienna, Austria, 14–19 Apr 2024, EGU24-14929, https://doi.org/10.5194/egusphere-egu24-14929, 2024.

EGU24-15214 | Orals | CL1.2.6

Exploring the differing CO2 response to Dansgaard-Oeschger and Heinrich events 

Matteo Willeit, Daniela Dalmonech, Bo Liu, Tatiana Ilyina, and Andrey Ganopolski

Dansgaard-Oeschger (DO) and Heinrich (H) events are ubiquitous features of glacial climates involving abrupt and large changes in climate over the North Atlantic region, extending also to the Southern Hemisphere through the bipolar seesaw mechanism. Ice core data also indicate that the DO and H events are accompanied by pronounced changes in atmospheric CO2 concentration, but their origin remains uncertain. Here, we use simulations with the fast Earth system model CLIMBER-X, which produces self-sustained DO events as internal variability, to explore the processes involved in the atmospheric CO2 response. While the DO events are internally generated in the model, the Heinrich events are mimicked by adding a freshwater flux of 0.05 Sv over 1000 years in the latitudinal belt between 40°N and 60°N in the North Atlantic.
The simulated Greenland temperature varies by ~7-8°C between stadials and interstadials, with only small differences between H and DO stadials, while Antarctic temperature responds substantially stronger to H than to DO events, broadly in agreement with observations. In the CLIMBER-X simulations, atmospheric CO2 varies by ~5 ppm during DO events, but by ~15 ppm during H events, comparable with ice core data. The peak in CO2 concentrations is delayed by several centuries relative to both the stadial-interstadial transition and the peak in Antarctic temperature. The CO2 rise during the H stadial is driven by ocean outgassing. In contrast, the rapid CO2 increase after the transition to the interstadial results from soil carbon release from high NH latitudes originating from substantial warming.

How to cite: Willeit, M., Dalmonech, D., Liu, B., Ilyina, T., and Ganopolski, A.: Exploring the differing CO2 response to Dansgaard-Oeschger and Heinrich events, EGU General Assembly 2024, Vienna, Austria, 14–19 Apr 2024, EGU24-15214, https://doi.org/10.5194/egusphere-egu24-15214, 2024.

EGU24-15672 | ECS | Orals | CL1.2.6

Carbon and nitrogen stable isotopes across the last deglaciation: perspectives from snow petrel stomach oil deposits 

Thale Damm-Johnsen, Michael J. Bentley, Darren R. Gröcke, Dominic Hodgson, and Erin L. McClymont

Evidence from both marine and ice cores strongly indicates that surface ocean processes influencing air-sea gas exchange of the Southern Ocean played a crucial role in the transition from a glacial to interglacial climate state. However, few archives have been able to reconstruct how high latitude surface ocean processes affected the biogeochemical changes occurring in nutrient utilization, primary productivity, and their effects on carbon sequestering in ecosystems. An opportunity to explore these processes is provided by accumulated snow petrel (Pagodroma nivea) stomach oil deposits, defensively regurgitated by snow petrels at their nest sites. These deposits provide a record of biogeochemical processes in the austral summer, at a high trophic level and integrated over a relatively wide area defined by snow petrel foraging range. Here, we present a joint carbon and nitrogen stable isotope record from stomach oil deposits from the Lake Untersee nunataks in Dronning Maud Land (DML) integrating data from a coastal area of 65-70°S. Our results show a 3‰ offset in δ13C and 4‰ offset in δ15N between LGM and Holocene, indicating that the coastal high latitudes underwent large changes over the deglaciation. The δ15N depletion into the Holocene shows strong similarity to changes occurring in nutrient utilization along the margin of the polar front, indicating that the Southern Ocean high latitudes were not an isolated oasis during the LGM but biogeochemically connected to the surface ocean beyond the summer sea-ice margin. In addition, the presence of stomach oil deposits indicates that open water was present in summer along the coast of DML over both the LGM and Holocene. Such highly productive, open water areas were potentially an important factor in the air-sea gas exchange contributing to the deglacial atmospheric CO2 -rise.

How to cite: Damm-Johnsen, T., Bentley, M. J., Gröcke, D. R., Hodgson, D., and McClymont, E. L.: Carbon and nitrogen stable isotopes across the last deglaciation: perspectives from snow petrel stomach oil deposits, EGU General Assembly 2024, Vienna, Austria, 14–19 Apr 2024, EGU24-15672, https://doi.org/10.5194/egusphere-egu24-15672, 2024.

EGU24-16591 | Orals | CL1.2.6

Bridging Proxy Discrepancies: SST Reconstructions from the Alboran Sea During the Last Glacial Maximum and Deglaciation.  

Alvaro Fernandez, Laura Rodríguez-Sanz, Victoria Taylor, Nele Meckler, and Francisca Martínez-Ruiz

The last glacial maximum (LGM) is the most recent time period in Earth’s history with a climate that was much colder than the present. Robust temperature reconstructions from this period are needed to improve estimates of Earth's climate sensitivity and aid in future climate change projections. However, reconstructing sea surface temperatures (SSTs) during this period can be challenging due to the various limitations with the commonly used proxies. Here, we present new SST estimates from the Alboran Sea in the Western Mediterranean, an area where existing SST records for the LGM (derived from UK37, TEX86, planktic foraminiferal Mg/Ca) show large disagreements. Our new SST estimates are based on clumped isotope analyses of planktic foraminifera (G. bulloides), the same species as used for the Mg/Ca measurements in this area. Due to the insensitivity of the clumped isotope thermometer to changes in seawater chemistry, our results offer new independent constraints on the range of temperature shifts between glacial and interglacial periods in this area. Our findings are evaluated against existing SST estimates, highlighting the benefits and limitations of different proxy estimates. We find that while all proxies agree on the general millennial scale temperature trends during the period of deglaciation, they diverge in the magnitude of these temperature changes. Temperature reconstructions derived from clumped isotopes align more closely with those based on alkenone and Mg/Ca proxies than with those from TEX86, which show large differences. Our research demonstrates that clumped isotopes are a potentially effective tool to improve the accuracy of climate reconstructions from the LGM and the subsequent deglacial period.


How to cite: Fernandez, A., Rodríguez-Sanz, L., Taylor, V., Meckler, N., and Martínez-Ruiz, F.: Bridging Proxy Discrepancies: SST Reconstructions from the Alboran Sea During the Last Glacial Maximum and Deglaciation. , EGU General Assembly 2024, Vienna, Austria, 14–19 Apr 2024, EGU24-16591, https://doi.org/10.5194/egusphere-egu24-16591, 2024.

EGU24-17501 | ECS | Posters on site | CL1.2.6

Constraining glacial ocean carbon cycle – A multi-model study 

Bo Liu, Tatiana Ilyina, Victor Brovkin, Matteo Willeit, Ying Ye, Christoph Völker, Peter Köhler, Malte Heinemann, Takasumi Kurahashi-Nakamura, André Paul, Michael Schulz, Ute Merkel, and Fanny Lhardy

The ocean contained a larger carbon content at the Last Glacial Maximum (LGM, ~21kyr before present) compared to the late Holocene, making a considerable contribution to the deglacial atmospheric CO2 rise of about 90 ppm. Yet, there’s no consensus on the mechanisms controlling the glacial-interglacial changes in oceanic carbon storage due to uncertainties and sparseness of proxy data. Numerical simulations have been widely used to quantify the impact of key factors, such as changes in sea surface temperatures, ocean circulation and biological production, on glacial ocean carbon sequestration. However, the robustness of these findings is subject to further testing due to the differences in process representation, parameterization, model architecture, or external forcing employed by models.

Towards further constraining the LGM ocean carbon cycle, we conducted a multi-model comparison with three comprehensive Earth System Models (Alfred Wegener Institute Earth System Model, AWI-ESM; Community Earth System Model, CESM; Max Planck Institute Earth System Model, MPI-ESM) and one Earth system Model of Intermediate Complexity (CLIMBER-X). We carried out three coordinated experiments with each model: 1) PI (the pre-industrial control simulation), 2) LGM-PMIP (following PMIP4 LGM protocol) and 3) LGM-LowCO2 (as LGM-PMIP, but with boosted alkalinity inventory to lower atmospheric CO2 to about 190 ppm. All experiments were conducted with the prognostic CO2 for the carbon cycle, considering only the atmosphere and ocean reservoirs, and prescribed CO2 for radiative forcing.

All models consistently show that applying the PMIP4 LGM boundary conditions alone leads to only a 5-40 ppm decrease in atmospheric CO2. Globally, the glacial CO2 drawdown in LGM-PMIP is mainly controlled by the enhanced solubility pump. The spatial distribution of the increased glacial DIC depends on the ocean circulation state in each model. In MPI-ESM and CLIMBER-X, the shallower and weaker AMOC facilitates carbon storage in the deep Atlantic. An LGM atmospheric CO2 of 190 ppm can be achieved by boosting alkalinity by 5-8% in scenario LGM-LowCO2. In all models, boosting LGM alkalinity inventory increases DIC in the bottom water. However, comparison to proxy data reveals that the models lack respired carbon, particularly in the deep Pacific. This suggests a need to enhance the glacial biological carbon pump in the models.

How to cite: Liu, B., Ilyina, T., Brovkin, V., Willeit, M., Ye, Y., Völker, C., Köhler, P., Heinemann, M., Kurahashi-Nakamura, T., Paul, A., Schulz, M., Merkel, U., and Lhardy, F.: Constraining glacial ocean carbon cycle – A multi-model study, EGU General Assembly 2024, Vienna, Austria, 14–19 Apr 2024, EGU24-17501, https://doi.org/10.5194/egusphere-egu24-17501, 2024.

EGU24-17778 | ECS | Orals | CL1.2.6

Physical and biological controls on deep Pacific carbon storage over the last glacial cycle 

Megan Pelly, Madison Shankle, Molly Trudgill, Bruno Millet, Chen Xu, Gwyn Owens, Hermione Owen, Alan Foreman, Thomas Bauska, Andy Ridgwell, Elisabeth Michel, William Gray, Andrea Burke, and James Rae

The ability of the deep ocean to store and exchange large quantities of CO2 with the atmosphere on relatively short timescales means that it is thought to play a key role in dictating glacial-interglacial changes in atmospheric CO2, however records of deep ocean carbon storage and release remain sparse. The Pacific Ocean contains the largest store of carbon in the ocean-atmosphere system. As a result, changes in its circulation dynamics and biogeochemistry have the potential to significantly impact global climate. Despite this, changes in Pacific conditions and carbon storage over the last glacial cycle are poorly constrained.

Here we present new geochemical proxy records from abyssal, deep, and intermediate depths in the Southwestern Pacific to determine the changes in deep ocean carbon storage over the last glacial cycle and the mechanisms involved in driving these changes. Foraminiferal trace element and stable isotope data indicate that increased carbon storage occurred over the course of the last glaciation, promoting a drawdown in atmospheric CO2. The processes involved in driving glacial ocean carbon storage are debated, however proxy data from these sites indicate that changes in circulation dynamics promoting the isolation and expansion of deep Pacific waters was likely a key process involved. Comparison of δ13C data to box model and Earth system model output provides further insight into the physical as well as biogeochemical mechanisms involved and their relative contributions at different stages over the last glacial cycle. This includes the role of Southern Ocean sea-ice expansion, reduced ocean temperatures, and increased Southern Ocean stratification and biological productivity. We find that physical processes dominate the early in the glacial cycle, with biological processes promoting further drawdown as glacial conditions intensify. These results help to improve the understanding of deep ocean carbon cycling over the last glacial cycle and provide a new framework with which to interpret proxy δ13C data.

How to cite: Pelly, M., Shankle, M., Trudgill, M., Millet, B., Xu, C., Owens, G., Owen, H., Foreman, A., Bauska, T., Ridgwell, A., Michel, E., Gray, W., Burke, A., and Rae, J.: Physical and biological controls on deep Pacific carbon storage over the last glacial cycle, EGU General Assembly 2024, Vienna, Austria, 14–19 Apr 2024, EGU24-17778, https://doi.org/10.5194/egusphere-egu24-17778, 2024.

EGU24-17827 | ECS | Orals | CL1.2.6

A million-year reconstruction of global volcanism intensity: How does it link to glaciation? 

Jack Longman, Thomas M. Gernon, Thea K. Hincks, Sina Panitz, and Martin R. Palmer

Reduced ice volume during interglacials is hypothesized to amplify volcanic activity because ice-mass removal reduces pressure on magma chambers (Huybers & Langmuir, 2009). There is some evidence for this process occurring on regional (Maclennan et al., 2002) and perhaps semi-global scales (Kutterolf et al., 2019), but there is a lack of globally representative tephra production records. Therefore, our understanding of the global relationship between glacial-interglacial cycles and volcanism uncertain. As a result, we do not know whether deglaciation directly drives enhanced volcanism, or if the feedbacks are more complex. In this work we use a database of visible tephra layers in marine sediments, and a weighted bootstrap resampling method to develop a record of global tephra (the products of explosive volcanism) production which covers the past million years.

Our results show an intensification of global tephra production around 420 to 400 thousand years ago (ka), which coincides with Marine Isotope Stage (MIS) 11 – the warmest interglacial of the past million years. MIS11 was a period of high sea level (up to 10 m above present) and low ice cover, with Greenland likely largely ice free. We suggest the low ice levels drove enhanced volcanism, and consequently enhanced volcanic carbon dioxide degassing, which in turn drove further ice sheet ablation. This positive feedback may the explain this warmth, and in turn, the Mid-Brunhes transition, which heralded the arrival of generally warmer interglacials after 400 ka. Further, after 400 ka we begin to see cyclicity in the tephra record, mirroring eccentricity forcing seen in ice volume records. More pronounced ice-volcano feedbacks may therefore explain the stronger interglacials of the past 400,000 years.

References

Huybers, P., & Langmuir, C. (2009). Feedback between deglaciation, volcanism, and atmospheric CO2. Earth and Planetary Science Letters, 286(3–4), 479–491.

Kutterolf, S., Schindlbeck, J. C., Jegen, M., Freundt, A., & Straub, S. M. (2019). Milankovitch frequencies in tephra records at volcanic arcs: The relation of kyr-scale cyclic variations in volcanism to global climate changes. Quaternary Science Reviews, 204, 1–16.

Maclennan, J., Jull, M., McKenzie, D., Slater, L., & Grönvold, K. (2002). The link between volcanism and deglaciation in Iceland. Geochemistry, Geophysics, Geosystems, 3(11), 1–25.


How to cite: Longman, J., Gernon, T. M., Hincks, T. K., Panitz, S., and Palmer, M. R.: A million-year reconstruction of global volcanism intensity: How does it link to glaciation?, EGU General Assembly 2024, Vienna, Austria, 14–19 Apr 2024, EGU24-17827, https://doi.org/10.5194/egusphere-egu24-17827, 2024.

The ocean plays an essential role in the rise of atmospheric CO2 by about 90 ppmv during the last deglaciation. The deglacial oceanic CO2 outgassing is jointly controlled by the physical, biological and geochemical processes, which affect the variations in ocean circulation, biological carbon pump and alkalinity inventory. Transient simulations of climate-carbon feedback, particularly using the comprehensive Earth System Models, are instrumental tools to quantify the contribution of different processes and their interactions. Nonetheless, knowledge gaps still exist in the deglacial variations of oceanic carbon and nutrient cycling because considerable model uncertainties arise from the choices of model processes and parameters, and the proxy data is too sparse to fully constrain the model outcome.

We conduct transient simulations for the last deglaciation with the Max Planck Institute Earth System Model (MPI-ESM) and examine the impact of different model tuning of the global ocean biogeochemistry component and a sediment module on the deglacial CO2 outgassing. The atmospheric CO2 is prognostically computed for the carbon cycle, considering only the atmosphere and ocean compartments, and it is prescribed for radiation computation. We force the model with reconstructions of atmospheric greenhouse gas concentrations, orbital parameters, ice sheet and dust deposition. In line with the physical ocean component, we account for the automatic adjustment of marine biogeochemical tracers in response to changing bathymetry and coastlines related to deglacial meltwater discharge and isostatic adjustment.

We find the deglacial CO2 outgassing is mainly driven by the sea surface warming in MPI-ESM, whereas variations in surface alkalinity and DIC have a relatively small contribution (~18%). Furthermore, the parameterisation of organic debris remineralisation considerably affects the deglacial increase in the global NPP due to different recycling rates of nutrients in the upper ocean. When a longer lifetime of dissolved organic matter is prescribed, the dissolved organic carbon pool in the glacial ocean increases, further facilitating the glacial ocean carbon sequestration. Including an interactive sediment module strongly impacts surface alkalinity due to input-sedimentation imbalance, affecting air-ocean CO2 flux. Thus, attention has to be given to tuning and adjustments regarding the input-sedimentation imbalance of alkalinity in ESMs to better represent proxy data and the deglacial oceanic CO2 outgassing.

How to cite: Liu, B. and Ilyina, T.: Quantifying the role of ocean biogeochemistry on the deglacial atmospheric CO2 rise using transient simulations with MPI-ESM, EGU General Assembly 2024, Vienna, Austria, 14–19 Apr 2024, EGU24-18082, https://doi.org/10.5194/egusphere-egu24-18082, 2024.

EGU24-18786 | ECS | Posters on site | CL1.2.6

Mechanisms of atmospheric CO2 drawdown during Marine Isotope Stage 4 based on Atlantic deep-water temperature and bottom-water oxygenation reconstructions  

Svetlana Radionovskaya, Julia Gottschalk, David Thornalley, Mervyn Greaves, and Luke Skinner

Understanding the evolution of deep ocean circulation and chemistry over the last glacial cycle is key to elucidating the ocean’s role in modulating atmospheric CO2 changes on millennial and orbital timescales. MIS 4 is a key paleoclimatic interval of the last glacial inception for assessing the role of the deep-ocean carbon storage in driving atmospheric CO2 levels, because it is characterized by a large decrease of air temperature and a rapid atmospheric CO2 drop of ~40 ppmv, and includes several millennial climatic events, for example Heinrich Stadial 6. Although various paleo proxy records suggest a weakened Atlantic overturning during MIS 4, and particularly HS 6, changes in AMOC strength and the geometric extent of NADW shoaling remain poorly understood. Here, we present deep-water temperature reconstructions based on infaunal benthic foraminiferal Mg/Ca ratios and bottom water oxygen concentration reconstructions using redox-sensitive foraminiferal U/Ca, from the deep North (~2.65km) and South (~3.8km) Atlantic to assess the changes in deep water hydrography and by extension circulation.

Our reconstructed deep-water temperature changes from the Iberian Margin (~2.65 km water depth) suggest a stronger influence of colder southern sourced waters during MIS 4 and particularly during HS 6; and a clear subsurface warming during MIS 5a stadials. Meanwhile, changes in deep-water temperatures in the Atlantic Sector of the Southern Ocean (SO) closely follow variations in Antarctic temperature, atmospheric CO2 and the mean ocean temperature, likely mediated by buoyancy forcing in the SO, which is in turn likely linked to sea-ice expansion at the MIS 5a/4 transition. Together with (arguably smaller) contributions from reduced air-sea gas exchange efficiency in the SO, these combined changes would have lowered atmospheric CO2through more efficient carbon sequestration in an expanded deep Atlantic reservoir during MIS 4, through their impact on the solubility- and soft tissue “pumps” (i.e. the ocean’s disequilibrium and respired carbon budgets). Indeed, bottom water oxygenation reconstructions from the South Atlantic support the conclusion that the Southern Ocean appears to have represented a significant reservoir for sequestering CO2 away from the atmosphere during MIS 4.

How to cite: Radionovskaya, S., Gottschalk, J., Thornalley, D., Greaves, M., and Skinner, L.: Mechanisms of atmospheric CO2 drawdown during Marine Isotope Stage 4 based on Atlantic deep-water temperature and bottom-water oxygenation reconstructions , EGU General Assembly 2024, Vienna, Austria, 14–19 Apr 2024, EGU24-18786, https://doi.org/10.5194/egusphere-egu24-18786, 2024.

EGU24-19515 | Posters on site | CL1.2.6

Sea surface temperature variations in the Eastern Equatorial Pacific (ODP Site 1240) over the last 160 kyr from three lipid paleothermometers (UK'37, TEXH86 and LDI) 

Eva Calvo, Lucía Quirós-Collazos, Marta Rodrigo, Stefan Schouten, Jaap Sinninghe-Damsté, Leopoldo Pena, Isabel Cacho, and Carles Pelejero

The Pacific Ocean equatorial upwelling region is of great interest to understand climate dynamics within the context of current global change. It plays a key role in global biogeochemical cycles, especially in the carbon cycle, as it stands for being one of the areas with largest CO2 fluxes from the ocean to the atmosphere. Moreover, tropical regions play a key role in regulating global climate, since they control the transfer of thermal energy from low to high latitudes. In this context, and with the aim of reconstructing paleoclimate conditions at glacial-interglacial time scales in this region, we analysed selected molecular biomarkers in the marine sediment core ODP 1240, at the easternmost region of the Eastern Equatorial Pacific (EEP), covering the last 160 kyr. We focused on long-chain alkenones, glycerol dialkyl glycerol tetraethers (GDGTs) and long-chain alkyl diols (LCDs). Upon quantification of these lipids, we calculated the UK'37, TEXH86 and LDI indices, and discussed their suitability as paleotemperature proxies to reconstruct sea surface conditions in the study region. We found that UK'37 and TEXH86 derived-temperatures track the warming and cooling trends typical of glacial-interglacial variations. However, while they provide similar temperatures during the last two interglacial maxima, they disagree during glacial periods, when the TEXH86-based estimations display significantly cooler temperatures. The LDI-derived record also shows similar temperatures to those from the UK'37 and TEXH86during the more recent interglacial but, for the last glacial-interglacial period, LDI-derived temperatures remain colder than those of the UK’37 and even colder than those of the TEXH86 at some periods. Multiple factors could be behind this variability and disagreement between the three paleothermometers: depth dwelling, production or exportation of the different biological producers of each lipid, seasonality, diagenetic processes and changes in biogeochemistry conditions of the studied marine region, amongst others. In this presentation, the factors that we believe are most important in the study region will be presented and discussed, to improve our understanding of the biological dynamics of the precursors of each proxy and of their reconstructed marine temperatures in the EEP.

How to cite: Calvo, E., Quirós-Collazos, L., Rodrigo, M., Schouten, S., Sinninghe-Damsté, J., Pena, L., Cacho, I., and Pelejero, C.: Sea surface temperature variations in the Eastern Equatorial Pacific (ODP Site 1240) over the last 160 kyr from three lipid paleothermometers (UK'37, TEXH86 and LDI), EGU General Assembly 2024, Vienna, Austria, 14–19 Apr 2024, EGU24-19515, https://doi.org/10.5194/egusphere-egu24-19515, 2024.

EGU24-19780 | Orals | CL1.2.6

The influence of proglacial lakes on climate and surface mass balance of retreating ice sheets: A study of the Laurentide and Fennoscandian ice sheets at 13 ka BP 

Uta Krebs-Kanzow, Lianne Sijbrandij, Gregor Knorr, Lars Ackermann, Lu Niu, and Gerrit Lohmann

During the last deglaciation large proglacial lakes formed at the base of the retreating northern hemisphere ice sheets. We assess the effect of these ice-contact lakes on regional climate and on the ice sheet surface mass balance components of the adjacent  Laurentide (LIS) and Fennoscandian (FIS) ice sheets,  using an atmosphere general circulation model with a novel extension for proglacial lakes in combination with a surface mass balance scheme for ice sheets, which, for the first time, allows to estimate the effect of the cold surface of these extensive lakes on the surface mass balance of the adjacent ice sheets. In a set of simulations inspired by the  Allerød interstadial around 13000 years before present, we demonstrate that the presence of proglacial lakes significantly reduces summer air temperatures in a larger area around the proglacial lakes and leads to reduced precipitation with increased snow/rain ratio. In consequence surface ablation reduces by 39% over the FIS and 28% over the LIS while accumulation only changes slightly by 1% and -3%  respectively. About one quarter of the response in surface ablation is related to the perennially cold surface of the proglacial lakes.

How to cite: Krebs-Kanzow, U., Sijbrandij, L., Knorr, G., Ackermann, L., Niu, L., and Lohmann, G.: The influence of proglacial lakes on climate and surface mass balance of retreating ice sheets: A study of the Laurentide and Fennoscandian ice sheets at 13 ka BP, EGU General Assembly 2024, Vienna, Austria, 14–19 Apr 2024, EGU24-19780, https://doi.org/10.5194/egusphere-egu24-19780, 2024.

EGU24-175 | ECS | Orals | CL2.4

Why do oceanic nonlinearities play a weak role in Extreme El Niño events? 

Fangyu Liu, Jérôme Vialard, Alexey V. Fedorov, Christian Éthé, Renaud Person, and Matthieu Lengaigne

Extreme El Niño events exhibit outsized impacts worldwide and considerably enhance the El Niño Southern Oscillation (ENSO) warm/cold phase asymmetries. While many mechanisms were proposed, no consensus has been reached and the relative role of atmospheric and oceanic processes remains to be illustrated. Here we quantitatively assess the contribution of oceanic nonlinearities through a state-of-the-art oceanic general circulation model, which realistically simulates extreme El Niño related characteristics and the oceanic nonlinear processes responsible for ENSO skewness. An effective way is developed to isolate sea surface temperature (SST) nonlinear response based on paired experiments forced with opposite wind stress anomalies. We demonstrate that the overall oceanic nonlinearities play a marginal role on extreme El Niño amplitude, which largely arises from the compensation between positive contributors from tropical instability waves (TIWs) and nonlinear dynamic heating (NDH) and negative contributors from subsurface processes and air-sea fluxes. The physical processes keep robust when using the other mixing scheme or mixed layer option for the heat budget. Our findings quantitively reveal the subtle contribution of oceanic nonlinearities, yielding strong evidence for the paramount role of atmospheric nonlinearities in shaping extreme El Niño events.

How to cite: Liu, F., Vialard, J., V. Fedorov, A., Éthé, C., Person, R., and Lengaigne, M.: Why do oceanic nonlinearities play a weak role in Extreme El Niño events?, EGU General Assembly 2024, Vienna, Austria, 14–19 Apr 2024, EGU24-175, https://doi.org/10.5194/egusphere-egu24-175, 2024.

EGU24-626 | ECS | Posters on site | CL2.4

Dynamical evolution of ENSO in a warming background: A review of recent trends & future projections 

Sreevathsa Golla, Joël Hirschi, Jennifer Mecking, Adam Blaker, Stephen Kelly, and Robert Marsh

The wide-spread implications of El Niño–Southern Oscillation (ENSO) on global and regional climate necessitates a better understanding of how the underlying interannual dynamics have changed over recent years. Year-to-year changes in ENSO impact terrestrial and marine habitats, water availability, food security and social stability (Santoso et al., 2017). With abundant evidence of a warming climate, it is imperative to understand how a large-scale climatic oscillation such as ENSO is evolving and influencing changes in large-scale atmospheric circulation patterns (Alizadeh et al., 2022; Cai et al., 2021). Furthermore, quantifying the influence of the ocean on changes in this climatic pattern is an interesting and important question to answer. Evaluating the ability of models to appropriately represent the underlying physics and dynamical changes impacting the spatiotemporal extent and the intensity of ENSO is crucial to understanding ocean-climate teleconnections and changes in climatic extremes. In this study, we review and evaluate the representation of ENSO in several high-resolution CMIP6 and HighResMIP models and forced ocean-only simulations focusing on the ability of current state-of-the-art models to represent central equatorial pacific warming and cooling. This evaluation involves looking at the development and propagation of warm temperature anomalies on surface and sub-surface levels in the equatorial Pacific and understanding the differences in simulating surface heat budget and exchange with the overlying atmosphere and the deeper ocean. Surface and sub-surface (up to 200m depth) temperature anomalies in the Niño 3.4 region were calculated from modelled data and were then compared with anomalies from observational and reanalysis temperature datasets (like EN4, ORAS5). We find good agreement in the timing and vertical structure of surface/sub-surface temperature anomalies in the forced model simulations, particularly during strong ENSO years. Moreover, the genesis of sub-surface anomalies and their further propagation to the surface was well simulated in the forced simulations. The vertical coherence of temperature anomalies was relatively more pronounced in forced ocean-only simulations than in coupled high-resolution model runs. Furthermore, we comment on the shortcomings and suggest potential improvements that can be made in the models that could improve the model’s ability to capture ENSO strength and variability.

How to cite: Golla, S., Hirschi, J., Mecking, J., Blaker, A., Kelly, S., and Marsh, R.: Dynamical evolution of ENSO in a warming background: A review of recent trends & future projections, EGU General Assembly 2024, Vienna, Austria, 14–19 Apr 2024, EGU24-626, https://doi.org/10.5194/egusphere-egu24-626, 2024.

EGU24-696 | ECS | Orals | CL2.4

Tropical SST Impacts on the Subtropical Atmospheric Circulation and Regional Precipitation 

Weiteng Qiu, Mat Collins, Adam Scaife, and Agus Santoso

The tropical Pacific Ocean hosts the Earth’s most prominent year-to-year climate fluctuation, the El Niño-Southern Oscillation (ENSO), which exerts strong impacts on remote regions of the globe through atmospheric teleconnection. In this study, we use reanalysis data and Coupled Model Intercomparison Project Phase 6 (CMIP6) historical simulations to investigate the relationship between tropical and subtropical atmospheric circulation, and the tropical SST patterns and regional precipitation.   

We find dynamical relationships between subtropical high intensity, the Hadley and Ferrel Circulation intensity, and the Eady Growth Rate from the reanalysis. A poleward shift of the maximum in Eady Growth Rate is associated with a strengthening of the descending branches of the Ferrel and Hadley Cells, with subtropical troposphere adiabatic warming and an increased intensity and poleward movement of the subtropical highs. Shifts in the poleward Eady Growth Rate are dominated by changes in vertical wind shear which, in turn, are in thermal wind balance with variations and trends in temperature. The mechanism for the intensification of the subtropical highs involves feedbacks from high-frequency transient eddies. Strong North Pacific and South Pacific Subtropical highs are associated with La-Niña conditions. We also show that the mechanisms for interannual variations are similar to those for trends in the highs.

We further analysed the performance of the coupled models in reproducing the trends (1979-2014) of the tropical zonal wind and regional precipitation. The CMIP6 historical simulations do not capture the intensification of trade winds within the Niño 4 region, and they also fail to reproduce the statistically significant precipitation trends over the Southern North America and the Amazon. However, a linear adjustment, based on ENSO teleconnections, can be applied to the coupled models to make the precipitation trends much closer to observations. The relationship between SST patterns and precipitation trends are confirmed by looking at atmosphere-only simulations. This study provides further evidence of the importance of reconciling observed and modelled SST patterns in the tropical Pacific.

How to cite: Qiu, W., Collins, M., Scaife, A., and Santoso, A.: Tropical SST Impacts on the Subtropical Atmospheric Circulation and Regional Precipitation, EGU General Assembly 2024, Vienna, Austria, 14–19 Apr 2024, EGU24-696, https://doi.org/10.5194/egusphere-egu24-696, 2024.

EGU24-1547 | ECS | Orals | CL2.4

Variable-resolution global atmospheric models are sensitive to driving SST in ENSO/IOD-Australian rainfall teleconnections 

Ying Lung Liu, Lisa Alexander, Jason Evans, and Marcus Thatcher

We have investigated the sensitivity of a global climate model to driving sea surface temperatures (SST) in simulating Australian rainfall characteristics, including the El Niño-Southern Oscillation (ENSO)- and Indian Ocean Dipole (IOD)-related rainfall variability. We employed the Conformal Cubic Atmospheric Model (CCAM), a global atmospheric model characterized by variable resolution, CCAM was forced by two SST datasets with different spatiotemporal resolutions: the 0.25° daily Optimum Interpolation Sea Surface Temperature (CCAM_OISST) version 2.1 and the 2° monthly Extended Reconstruction SSTs Version 5 (CCAM_ERSST5). A benchmarking framework was employed to appraise model performance, revealing strong agreement between the simulations and the Australian Gridded Climate Data (AGCD) in climatological rainfall spatial patterns, seasonality, and annual trends. It is noted that both simulations tend to overestimate rainfall amount, with CCAM_OISST exhibiting a larger bias.

Moreover, CCAM's performance in capturing ENSO and IOD correlations with rainfall was assessed during Austral spring (SON) using a novel hit rate metric. The findings underscore that only CCAM_OISST effectively reproduces observed SON ENSO- and IOD-rainfall correlations, achieving hit rates of 86.6% and 87.5%, respectively, in contrast to 52.7% and 41.8% for CCAM_ERSST5. Noteworthy disparities in sea surface temperatures were observed along the Australian coastline between OISST and ERSST5 (the so-called “Coastal Effect”). These disparities may be attributed to spatial interpolation errors arising from the differences in resolution between the model and driving SST. An additional experiment within CCAM, masking OISST with ERSST within a 5° proximity to the Australian continent, underscores the pronounced impact of the “Coastal Effect” on IOD-Australian rainfall simulations. Conversely, its influence on ENSO-Australian rainfall was constrained. Therefore, realistic local SSTs are important if model simulations are to reproduce realistic IOD-rainfall responses over Australia. Additionally, even though an SST product with a longer time span is preferred in simulating IOD-related variability, circumspection is warranted in the analysis of the impact of IOD on Australian rainfall when utilizing climate model output with a substantial discrepancy in spatial resolutions between the model and the driving SST. After showing CCAM’s ability to simulate ENSO- and IOD-rainfall, our future research will involve pacemaker experiments to isolate remaining climate modes and investigate their independent impact on Australian rainfall.

How to cite: Liu, Y. L., Alexander, L., Evans, J., and Thatcher, M.: Variable-resolution global atmospheric models are sensitive to driving SST in ENSO/IOD-Australian rainfall teleconnections, EGU General Assembly 2024, Vienna, Austria, 14–19 Apr 2024, EGU24-1547, https://doi.org/10.5194/egusphere-egu24-1547, 2024.

EGU24-1749 | ECS | Orals | CL2.4

Seasonality of Feedback Mechanisms Involved in Pacific Coastal Niño Events 

Daniel Rudloff, Sebastian Wahl, and Joke Lübbecke

The 2017 Pacific Coastal Niño Event was the strongest of its type. It caused torrential rainfall and devastating flooding in Peru and Ecuador and thus rapidly caught the attention of the scientific community. Multiple studies have been conducted focusing on the causes and consequences of this event. While the strong connection between SST anomalies and local rainfall, especially during boreal spring, is well established, the causes of the extreme warming are still a subject of discussion. In this study, we focus on the seasonality of the effectiveness of mechanisms and feedbacks involved in coastal Niño Events, utilising reanalysis products and historical model simulations from the Flexible Ocean and Climate Infrastructure (FOCI).

The 2017 event stands out due to its strength and timing as it occurred earlier in the year than most other events. We find that the atmospheric conditions during this time of year are very different due to the presence of atmospheric convection which modulates the SST-cloud feedback. Further, the event coincided with the season of strongest wind-driven upwelling. This combination enables a different forcing of a short but strong event. Additional model sensitivity experiments are performed for a better understanding of underlying mechanisms. We show how the same local wind stress forcing acts differently in different seasons, with its strongest impact during the months of strongest entrainment. Events forced by local heat fluxes and wind stress forcing only do not show any subsurface warming, which is found to be the main reason for their rapid decay. Even though the atmospheric response to a coastal warming varies seasonally, without any subsurface forcing, e.g., the events cannot be sustained through atmospheric feedbacks.

How to cite: Rudloff, D., Wahl, S., and Lübbecke, J.: Seasonality of Feedback Mechanisms Involved in Pacific Coastal Niño Events, EGU General Assembly 2024, Vienna, Austria, 14–19 Apr 2024, EGU24-1749, https://doi.org/10.5194/egusphere-egu24-1749, 2024.

EGU24-2133 | Orals | CL2.4

The El Niño Southern Oscillation (ENSO) recharge oscillator conceptual model : past achievements, future prospects. 

Jérôme Vialard and the CLIVAR ENSO conceptual model Working Group

The Recharge Oscillator (RO) is a simple mathematical model of the El Niño Southern Oscillation (ENSO). It is based on two ordinary differential equations that describe the evolution of eastern Pacific sea surface temperature and western Pacific oceanic heat content. These equations are based on physical principles that operate in nature: (i) the air-sea interaction loop known as the Bjerknes feedback, (ii) a delayed negative feedback arising from the slow oceanic response to near-equatorial winds, (iii) state-dependent stochastic forcing from intraseasonal wind variations known as Westerly Wind Events, and (iv) nonlinearities such as those related to deep atmospheric convection and oceanic advection. These elements can be combined in different levels of RO complexity. The RO reproduces the ENSO key properties in observations and climate models: its amplitude, dominant timescale, seasonality, warm/cold phases asymmetries, and the seasonal predictability decrease known as the “spring barrier”. We then discuss the RO in view of timely research questions. First, the RO can be extended to account for pattern ENSO diversity (with events that either peak in the central or eastern Pacific). Second, the core RO hypothesis that ENSO is governed by tropical Pacific dynamics is discussed under the perspective of research suggesting an influence from other basins. Finally, we discuss the RO relevance for studying ENSO response to climate change, and underline that accounting for diversity and better linking the RO parameters to the long term mean state are important research avenues. We end by proposing a list of ten important RO-based research problems.

How to cite: Vialard, J. and the CLIVAR ENSO conceptual model Working Group: The El Niño Southern Oscillation (ENSO) recharge oscillator conceptual model : past achievements, future prospects., EGU General Assembly 2024, Vienna, Austria, 14–19 Apr 2024, EGU24-2133, https://doi.org/10.5194/egusphere-egu24-2133, 2024.

EGU24-2166 | Orals | CL2.4

Mechanisms of Tropical Pacific Decadal Variability 

Antonietta Capotondi and the CLIVAR Tropical Pacific Decadal Variability Working Group

Naturally-occurring variability in the Tropical Pacific at timescales in the 7-70 years range, defined here as Tropical Pacific Decadal Variability (TPDV), modulates ENSO characteristics and its global impacts, and is linked to the rate of change of the globally-averaged surface temperature. Thus, understanding TPDV is integral to robustly separate the forced climate response from internally-generated climate variability and thereby produce reliable projections of the tropical Pacific and global climate. Several oceanic mechanisms have been proposed to explain TPDV, including off-equatorial Rossby wave activity, propagation of spiciness anomalies from the subtropical to the tropical regions, and changes in the strength of the shallow upper-ocean overturning circulations, known as “Subtropical Cells”. However, uncertainties remain on the relative importance of these oceanic mechanisms. Another critical source of uncertainty concerns the nature and origin of the atmospheric forcing of those oceanic processes. Anomalous wind forcing could arise as a response to tropical Pacific sea surface temperature (SST) anomalies, be induced by Pacific extra-tropical influences or result from tropical basin interactions. This presentation critically reviews the nature and relative importance of the oceanic and atmospheric processes driving TPDV. Although uncertain, the tropical oceanic adjustment through Rossby wave activity is likely a dominant source of variability at decadal timescales. A deeper understanding of the origin of TPDV-related winds is a key priority for future research.

How to cite: Capotondi, A. and the CLIVAR Tropical Pacific Decadal Variability Working Group: Mechanisms of Tropical Pacific Decadal Variability, EGU General Assembly 2024, Vienna, Austria, 14–19 Apr 2024, EGU24-2166, https://doi.org/10.5194/egusphere-egu24-2166, 2024.

EGU24-2466 | ECS | Posters on site | CL2.4

Asymmetric Influences of ENSO Phases on the Predictability of North Pacific Sea Surface Temperature 

Zhaolu Hou, Jianping Li, and Yina Diao

The North Pacific sea surface temperature (SST) exerts profound climatic influence. El Niño-Southern Oscillation (ENSO) significantly impacts North Pacific SST, yet the influence from ENSO’s distinct phases on SST predictability remains unclear. Overcoming model limitations, this study assesses SST predictability under diverse ENSO phases using reanalysis. Quantifying predictability limits (PL), results unveil asymmetry: El Niño PL at 5.5 months, La Niña at 8.4 months, and Neutral at 5.9 months. This asymmetry mirrors contemporary multimodal prediction skills. Error growth dynamics reveal La Niña's robust signal strength with slow error growth rate, contrasting El Niño's weaker signal and faster error growth. Neutral exhibits intermediate signal strength and elevated error growth. Physically, predictability signal strength aligns with SST variability, whereas error growth rate correlates with atmospheric-ocean heating anomalies. La Niña, inducing positive heating anomalies, minimizes atmospheric noise impact, resulting in lower error growth. The results are beneficial for improving North Pacific SST predictions.

How to cite: Hou, Z., Li, J., and Diao, Y.: Asymmetric Influences of ENSO Phases on the Predictability of North Pacific Sea Surface Temperature, EGU General Assembly 2024, Vienna, Austria, 14–19 Apr 2024, EGU24-2466, https://doi.org/10.5194/egusphere-egu24-2466, 2024.

EGU24-2993 | Posters on site | CL2.4

El Niño Southern Oscillation and Tropical Basin Interaction in Idealized Worlds 

Dietmar Dommenget and David Hutchinson

In this study we discuss a set of fully coupled general circulation model simulations with idealised geometries of the tropical ocean basins and land with a focus on important characteristics of El Niño Southern Oscillation (ENSO) type of variability and tropical basin interaction. In a series of 15 simulations we first vary the zonal width of a single tropical ocean basin from 50o to 360o, while the rest of the tropical zone is set as land. Further we discuss different simplified configurations of two or three tropical ocean basins. The results show remarkable changes in ENSO characteristics as function of basin width and due to the interaction with other basins that challenge our current understanding of ENSO dynamics. A single basin ENSO has an optimal basin width of about 150o at which ENSO preferred period is the longest, the wind stress feedback is the strongest and variability is stronger than in all other basin widths, expect for the 350o basin. Tropical basin interactions substantially affect ENSO strength, periodicity, feedbacks, non-linearity, spatial scale and pattern. In experiments with two or three identical ocean basins we find highly synchronized ENSO modes that are identical between basins and far more energetic and oscillatory then the single basin modes. The results suggest that tropical basin interaction is an essential part of ENSO. The framework of these experiments can help to better understand the atmospheric dynamics of ENSO and should help to formulate an ENSO theory that incorporates tropical basin interactions as a core element.

How to cite: Dommenget, D. and Hutchinson, D.: El Niño Southern Oscillation and Tropical Basin Interaction in Idealized Worlds, EGU General Assembly 2024, Vienna, Austria, 14–19 Apr 2024, EGU24-2993, https://doi.org/10.5194/egusphere-egu24-2993, 2024.

This study investigates the delayed influence of the Indian Ocean dipole (IOD),  isolated and combined with ENSO, on the early winter North Atlantic-European (NAE) circulation.  Results reveal that a positive IOD induces a strong response in the NAE region during December, leading to a positive North Atlantic Oscillation (NAO)-like pattern. This circulation response also induces a north-south precipitation dipole and a positive temperature anomaly over Europe. The underlying physical mechanism involves a rainfall dipole response to the IOD in the Indian Ocean, persisting into early winter, which triggers a perturbation in the zonal wind within the subtropical South Asian jet (SAJET) region. This initiates a wave-train that propagates northeastward into the North Atlantic. Additionally, a positive IOD enhances transient eddy activity in the European region. Transient eddy forcing provides strong positive feedback to the NAO-like anomaly. While the ECMWF-SEAS5 seasonal hindcast system reproduces the sign of the response, its magnitude is considerably weaker. The possible reasons for this weak response are investigated. The model can reproduce the delayed rainfall dipole response to the IOD, however, the structure of the response shows some differences with the re-analysis. The zonal wind perturbation in ECMWF-SEAS5 in the SAJET region is only about half of the re-analysis magnitude. Moreover, the wave propagation into the stratosphere, as estimated by the 100h𝑃𝑎 eddy heat fluxes, plays a minor role in the re-analysis and the model.

How to cite: Kucharski, F., Raganato, A., and Abid, M. A.: The combined  impact of Indian Ocean dipole and ENSO on the North Atlantic-European circulation during early boreal winter in re-analysis and in the ECMWF-SEAS5 hindcast , EGU General Assembly 2024, Vienna, Austria, 14–19 Apr 2024, EGU24-3110, https://doi.org/10.5194/egusphere-egu24-3110, 2024.

EGU24-3728 | Orals | CL2.4 | Highlight

Super El Niño: A product of three-ocean interactions  

Chunzai Wang, Jiazhen Wang, and Hanjie Fan

El Niño, the largest climate phenomenon on Earth, profoundly influences global climate, weather, ecosystems, and human societies. Super (or extreme) El Niño, in particular, has a significant impact on climate and extreme weather events, but its formation mechanism remains unknown. This presentation utilizes observations, climate model outputs, and coupled model experiments to demonstrate that interactions among the tropical Pacific, Indian, and Atlantic Oceans contribute to the development of super El Niño. The early onset of El Niño imparts sufficient strength in the summer and fall to trigger the Atlantic Niña and Indian Ocean dipole. Subsequently, the Atlantic Niña and Indian Ocean dipole alternately generate additional westerly wind anomalies over the equatorial western-central Pacific, reinforcing El Niño through the Bjerknes feedback and leading to the emergence of super El Niño. This novel mechanism is termed the Indo-Atlantic booster. The findings emphasize super El Niño as a product of three interactions, suggesting that incorporating both the Indian and Atlantic Oceans and their teleconnections with the Pacific will significantly enhance predictions of super El Niño and climate.

How to cite: Wang, C., Wang, J., and Fan, H.: Super El Niño: A product of three-ocean interactions , EGU General Assembly 2024, Vienna, Austria, 14–19 Apr 2024, EGU24-3728, https://doi.org/10.5194/egusphere-egu24-3728, 2024.

The El Niño-Southern Oscillation (ENSO) is one of the most significant integrated interannual oscillations with coupled atmosphere-ocean processes in the tropical Pacific. Most coupled climate models are weak in depicting ENSO asymmetry over equatorial Pacific subsurface. And it is still unclear how the stand-alone ocean model contributes to this bias. In this study, we found that most ocean models from the Ocean Model Intercomparison Project (OMIP), driven by JRA55, underestimate the asymmetry of ENSO in the equatorial western Pacific subsurface. We investigated the primary factors contributing to this bias using composite analysis and diagnostics, and found that the weaker responses in upwelling and stronger responses in downwelling to westerly and easterly wind stress anomalies in the models are mainly responsible for the bias. Furthermore, the underestimation of zonal current variability over western Pacific subsurface, influenced by the gradient of mean state of sea surface height along the equatorial Pacific, leads to an opposite relationship between asymmetry and the zonal component of nonlinear dynamic heating in the western Pacific subsurface comparing to that in the eastern Pacific subsurface. Our study emphasizes the importance of accurately modeling ocean currents to capture the characteristics of ENSO nonlinearity and highlights the significance of nonlinear dynamic responses to external forcing.

How to cite: Li, J. and Yu, Y.: Underestimated ENSO Asymmetry and Zonal Currents over the Equatorial Western Pacific in OMIP2 experiments , EGU General Assembly 2024, Vienna, Austria, 14–19 Apr 2024, EGU24-4811, https://doi.org/10.5194/egusphere-egu24-4811, 2024.

EGU24-4820 | ECS | Posters on site | CL2.4

Synchronous Decadal Climate Variability in the Tropical Central Pacific and Tropical South Atlantic 

Chao Liu, Soon-Il An, Soong-Ki Kim, Malte Stuecker, Wenjun Zhang, Fei-Fei Jin, Jae-Heung Park, Leishan Jiang, Aoyun Xue, Xin Geng, Hyo-Jin Park, Young-Min Yang, and Jong-Seong Kug

The El Niño-Southern Oscillation (ENSO), the strongest interannual climate signal, has a large influence on remote sea surface temperature (SST) anomalies in all three basins. However, a missing map piece in the widespread ENSO teleconnection is the Equatorial Atlantic, where the ENSO footprint on local SST is less clear. Here, using reanalysis data and partially coupled pacemaker experiments, we show that the tropical Pacific SST anomalies, manifested as a Central Pacific (CP) ENSO-like structure, synchronize the tropical South Atlantic (40°W-10°E, 15°S-0°) SST anomalies over the last seven decades, but on a quasi-decadal (8-16 year) timescale. Such a decadal connection is most evident during the boreal spring-summer season, when the CP ENSO-like decadal SST anomalies induce a cooling of the South Atlantic SSTs through atmospheric teleconnections involving both Southern Hemisphere extratropical Rossby waves and equatorial Kelvin waves. The resulting subtropical South Atlantic low-level anticyclonic circulation and easterlies at its northern flank cause local ocean-atmosphere feedback and strengthen the Pacific-to-Atlantic teleconnections. In contrast, the concurrent tropospheric temperature teleconnection is less destructive to the above Atlantic SST response due to the weaker and more west decadal Pacific SST anomalies compared to the interannual ENSO counterpart. Pacific-driven coupled simulations reproduce key observational features fairly well, while parallel Atlantic-driven simulations show little forcing into the Pacific. Our results show that the tropical Central Pacific is an important source of decadal predictability for the tropical South Atlantic SST and the surrounding climate.

How to cite: Liu, C., An, S.-I., Kim, S.-K., Stuecker, M., Zhang, W., Jin, F.-F., Park, J.-H., Jiang, L., Xue, A., Geng, X., Park, H.-J., Yang, Y.-M., and Kug, J.-S.: Synchronous Decadal Climate Variability in the Tropical Central Pacific and Tropical South Atlantic, EGU General Assembly 2024, Vienna, Austria, 14–19 Apr 2024, EGU24-4820, https://doi.org/10.5194/egusphere-egu24-4820, 2024.

EGU24-5122 | Orals | CL2.4

The mechanism of multi-year La Niña events and their impact on spring precipitation over southern China 

Licheng Feng, Guangliang Li, and Ronghua Zhang

By diagnosing and analyzing the frequent occurrence of multi-year La Niña events in recent years, this study reveals the process and mechanism of the Southeast Pacific subsurface cold water triggering multi-year La Niña events. Revealing for the first time the propagation channels and physical processes of multi-year La Niña events triggered by subsurface cold water. In late spring and early summer, the anomalous eastward wind strengthens in the central equatorial Pacific, while abnormal wind stress divergence occurs in the eastern Pacific, which strengthens and spreads westward over time. The weak negative sea surface temperature anomaly in the eastern equatorial Pacific is accompanied by upwelling, providing a source of cold water for the surface. As the season progresses, the weakened equatorial undercurrent and the enhanced southern equatorial current cause cold water to spread westward and accumulate in the central Pacific, thereby extending upwards to expose the sea surface. The exposed cold water causes a cooling of the sea surface and triggers local sea atmosphere interactions, leading to abnormal development of sea atmosphere and ultimately forming a multi-year La Niña events. Composite analyses were performed in this study to reveal the differences in spring precipitation over southern China during multiyear La Niña events from 1901-2015. It was found that there is significantly below normal precipitation in the first boreal spring, but above normal in the second year. The differences in spring precipitation over southern China are correlative to the changes in anomalous atmospheric circulations over the northwest Pacific, which can in turn be attributed to different anomalous sea surface temperatures (SSTs) over the tropical Pacific. During multiyear La Niña events, anomalous SSTs were stronger in the first spring than those in the second spring. As a result, the intensity of abnormal cyclones (WNPC) in the western North Pacific Ocean (WNP) in the first year is stronger, which is more likely to reduce moisture transport, leading to prolonged precipitation deficits over southern China. In contrast, the tropical SST signal is too weak to induce appreciable changes in the WNPC and precipitation over South China in the second year. The difference in SST signals in two consecutive springs leads to different spatial patterns of precipitation in southern China by causing different WNPC.

How to cite: Feng, L., Li, G., and Zhang, R.: The mechanism of multi-year La Niña events and their impact on spring precipitation over southern China, EGU General Assembly 2024, Vienna, Austria, 14–19 Apr 2024, EGU24-5122, https://doi.org/10.5194/egusphere-egu24-5122, 2024.

Understanding external drivers of the El-Nino Southern Oscillation (ENSO) is essential for predicting its future evolution. Orbital precession has been identified as a driver of ENSO variability through both proxy records and climate model simulations, yet the exact mechanics remain unclear. This orbital cycle moderates the seasonal timing of insolation relative to Earth's revolution around the Sun, thereby adjusting the magnitude of the seasonal cycle experienced by each hemisphere. Here, we analyze output from a suite of simulations in NCAR CESM 2.1.1 designed to analyze ENSO under different precessional extremes that significantly modify the meridional temperature gradients and the cold tongue seasonal cycle in the Pacific ocean. Variations in orbital precession have a strong impact on the magnitude, periodicity, and spatial expression of tropical Pacific variability. We find a critical role for both the North and South Pacific Meridional Modes (NPMM and SPMM) in explaining changes in ENSO and decadal variability by propagating subtropical anomalies to the equatorial Pacific along with a shift in the meridional structure of equatorial winds. As an example, when the perihelion of orbit occurs during boreal winter creating a dampened (strengthened) seasonal cycle in the Northern (Southern) Hemisphere, the SPMM becomes significantly more active while the NPMM weakens. This precessional state experiences a shift toward amplified decadal variability and a greater prevalence of Eastern El Nino events in comparison with the other orbital configurations tested. Understanding the precessional control of tropical variability via subtropical pathways may help explain developments that have occurred in the past, as well as future changes which may be observed due to shifts in meridional temperature gradients.

How to cite: Persch, C. and Sanchez, S.: A Critical Role for Meridional Modes in Determining the Equatorial Pacific Response to Orbital Precession, EGU General Assembly 2024, Vienna, Austria, 14–19 Apr 2024, EGU24-6660, https://doi.org/10.5194/egusphere-egu24-6660, 2024.

The winter sea surface temperature (SST) anomalies in the Kuroshio and adjacent regions (KAR), which greatly influence the East Asian–North Pacific–North American climate, are closely related to El Niño–Southern Oscillation (ENSO). This SST relationship between the KAR and the equatorial eastern-central Pacific is widely assumed to be symmetric between El Niño and La Niña. Compared to previous studies indicating the significant and strong KAR warming during El Niño winters, this study indicates weakly negative KAR SST anomalies in the composite analysis for all La Niña events. Positive winter KAR SST anomalies unexpectedly appear in approximately half of La Niña events, which counteract negative SST anomalies in the rest of La Niña events. Further analysis suggests that the impact of La Niña on KAR SST anomalies is modulated by the East Asian winter monsoon (EAWM) during early winter. The weaker-than-normal EAWM offsets the anomalous northeasterly winds in the KAR induced by La Niña and then reinforces the KAR warming through warm oceanic advection. As for strong EAWM, it enhances the northeasterly winds to the west of an anomalous Philippine Sea cyclone associated with La Niña, leading to KAR cooling with more latent heat flux loss from the ocean and anomalous cold oceanic advection. Additionally, when the EAWM is independent of ENSO and is associated with the western Pacific pattern, it also can exhibit a pronounced influence on the KAR SST anomalies via the major processes of surface latent flux and horizontal heat advection in the ocean, accompanied by a change in Kuroshio transport.

How to cite: Chen, S., Chen, J., Wang, X., and Xiao, Z.: Varying Relationship between La Nin a and SST Anomalies in the Kuroshio and Adjacent Regions during Boreal Winter: Role of the East Asian Winter Monsoon, EGU General Assembly 2024, Vienna, Austria, 14–19 Apr 2024, EGU24-7307, https://doi.org/10.5194/egusphere-egu24-7307, 2024.

EGU24-7849 | ECS | Orals | CL2.4

On the decadal changes of Atlantic-Pacific interactions and the effects of external forcing 

Soufiane Karmouche, Evgenia Galytska, Gerald A. Meehl, Jakob Runge, Katja Weigel, and Veronika Eyring

We show the results of a study investigating the predominant role of external forcing in steering Atlantic and Pacific ocean variability during the latter half of the 20th (and early 21st) century. By employing the PCMCI+ causal discovery method, we analyze reanalysis data, pacemaker simulations, and a CMIP6 pre-industrial control run. The results reveal a gradual (multi)decadal change in the interactions between major modes of Atlantic and Pacific interannual climate variability from 1950 to 2014. A sliding window analysis identifies a diminishing El Niño-Southern Oscillation (ENSO) effect on the adjacent Atlantic basin through the tropical route, coinciding with the North Atlantic trending toward and maintaining an anomalously warm state after the mid-1980s. In reanalysis, this is accompanied by the prevalence of an extra-tropical pathway connecting ENSO to the tropical Atlantic. Meanwhile, causal networks from reanalysis and pacemaker simulations indicate that increased external forcing might have contributed to strengthening ENSO’s opposite sign response to tropical Atlantic variability during the 1990s and early 21st century, where warming tropical Atlantic sea surface temperatures induced La Niña-like easterly winds in the equatorial Pacific. The analysis of the pre-industrial control run underscores that modes of natural climate variability in the Atlantic and Pacific influence each other also without anthropogenic forcing. Modulation of these interactions by the long-term states of both basins is observed. This work demonstrates the potential of causal discovery for a deeper understanding of mechanisms driving changes in regional and global climate variability.


Karmouche, S., Galytska, E., Meehl, G.A., Runge, J.,Weigel, K.,& Eyring,V. (2023b, in review). Changing effects of external forcing on Atlantic-Pacific interactions. EGUsphere, 2023, 1–36. https://doi.org/10.5194/egusphere-2023-1861

How to cite: Karmouche, S., Galytska, E., Meehl, G. A., Runge, J., Weigel, K., and Eyring, V.: On the decadal changes of Atlantic-Pacific interactions and the effects of external forcing, EGU General Assembly 2024, Vienna, Austria, 14–19 Apr 2024, EGU24-7849, https://doi.org/10.5194/egusphere-egu24-7849, 2024.

Processes leading to the onset and development of an El Niño event in the tropical Pacific remain elusive. Observed data and Ocean General Circulation Model (OGCM) simulations are used to reveal a well-defined pattern of sea surface temperature (SST) perturbations along the mean North Equatorial Countercurrent (NECC) pathways in association with the onset and evolution of some El Niño events. The OGCM-based sensitivity experiments are conducted to illustrate how a warm SST anomaly (SSTA) on the equator can result from a thermal forcing that is prescribed north of 10°N, similar to observed SST anomalies in December 1988. Within approximately one year, the imposed SST anomaly north of 10°N tends to be transported to the dateline region on the equator by the mean ocean circulation in the western Pacific (the low-latitude western boundary current (LLWBC) and the NECC). In due course, an upper-layer ocean warming is generated off the equator at 6-10°N and then on the equator, which acts to induce a westerly wind anomaly response; a simple statistical atmospheric wind stress model is then used to depict an expected westerly wind response. These resultant SST and surface wind perturbations can couple together over the western tropical Pacific, forming air-sea interactions and setting up a stage for El Niño onset. As such, this pathway mechanism can reasonably well explain the appearance of a warm SST anomaly on the equator in the dateline region and the corresponding development of westerly wind anomalies over the western Pacific in association with El Niño onset.


How to cite: Gao, C. and Zhang, R.: A Mechanism from Pathway Perspective for the Generation of a Warm SST Anomaly in the Western Equatorial Pacific, EGU General Assembly 2024, Vienna, Austria, 14–19 Apr 2024, EGU24-8442, https://doi.org/10.5194/egusphere-egu24-8442, 2024.

EGU24-8581 | ECS | Posters on site | CL2.4 | Highlight

Increased predictability of extreme El Niño from decadal interbasin interaction 

Xuan Ma, Rizhou Liang, Xiaosong Chen, Fei Xie, Jinqing Zuo, Cheng Sun, and Ruiqiang Ding

Predicting extreme El Niño–Southern Oscillation (ENSO) events remains a formidable task. Utilizing eigen microstates (EMs) of complex systems, we elucidate the interplay of two key sea surface temperature (SST) anomaly modes, the newly identified North Atlantic–west Pacific Mode (NAPAM) and discovered Victoria Mode (VM). Our findings demonstrate that a cold NAPAM phase coupled with a positive VM phase markedly elevates the probability of extreme El Niño events; NAPAM's decadal variability serves as a key modulator of extreme El Niño events' frequency. Our empirical model, capitalizing on these modes, achieves robust forecasts with a 6–8 month lead time and boasts a 0.73 correlation with the observed ENSO index in hindcasts. Notably, the model precisely forecasts the intensity of four landmark extreme El Niño episodes: 1982/1983, 1987/1988, 1997/1998, and 2015/2016. Our findings offer promising avenues for refining ENSO predictive frameworks and deepen our understanding of the key climatic drivers.

How to cite: Ma, X., Liang, R., Chen, X., Xie, F., Zuo, J., Sun, C., and Ding, R.: Increased predictability of extreme El Niño from decadal interbasin interaction, EGU General Assembly 2024, Vienna, Austria, 14–19 Apr 2024, EGU24-8581, https://doi.org/10.5194/egusphere-egu24-8581, 2024.

EGU24-9096 | ECS | Orals | CL2.4 | Highlight

Effects of Niño1+2 and Niño3.4 ENSO Events over Euro-Mediterranean Climate Variability  

Ece Yavuzsoy-Keven, Yasemin Ezber, and Omer Lutfi Sen

El Niño Southern Oscillation (ENSO) is a climate phenomenon that affects the atmospheric circulation of the Northern Hemisphere and causes short-term variability in temperature and precipitation patterns. ENSO impacts over the Euro-Mediterranean (EM) region are commonly defined by using Niño3.4 and Niño3 indices. However, some recent studies indicate that the ENSO event represented by both Niño1+2 and Niño3.4 indices (shared ENSO) is more effective over EM region climate.

In this study, we examine the response of the EM climate to ENSO events detected by Niño1+2 and Niño3.4 regions. NCEP/NCAR Reanalysis surface air temperature, precipitation, 500 hPa geopotential height, 850 hPa wind, and 300 hPa zonal wind datasets and SST-based ENSO indices from ERSSTv4 were used in the analysis for boreal winters between 1950 and 2019. For composite analysis, we separated ENSO events as El Niño and La Niña according to those observed in Niño1+2, Niño3.4, and both regions. We also tried to understand if there is any relation between ENSO and teleconnection patterns such as NAO, East Atlantic (EA), Trough Displacement Index for the Mediterranean Trough (TDI_MedT), and East Atlantic/Western Russia (EAWR) by using the cross-correlation analysis. Additionally, investigate the winter (December, January, February, DJF) ENSO’s possible lagged impacts on the teleconnection patterns in the subsequent seasons, spring (March-April-May, MAM), summer (June-July-August, JJA), and autumn (September-October-November, SON).

The major finding of this study is that the shared ENSO event is more effective over the EM climate than the ENSO events detected only by Niño1+2 or Niño3.4 indices. Further, it is also important for the predictability of the EM climate. In the shared El Niño event, the Middle East and much of North Africa tend to become colder than climatology while Europe becomes warmer. The anticyclonic wind anomaly over western Europe causes drier air in southern Europe and wetter air in northern Europe. The shared El Niño event also modulates the westerly flows at the upper troposphere. The westerly flow accelerates over high latitudes while decelerates over European mid-latitudes, causing northern Europe to be wetter and the Mediterranean Basin to be drier. The cross-correlation analysis including all SST-based ENSO indices and teleconnection indices that the EA index has a significant correlation with the Niño1+2 index across all seasons.

How to cite: Yavuzsoy-Keven, E., Ezber, Y., and Sen, O. L.: Effects of Niño1+2 and Niño3.4 ENSO Events over Euro-Mediterranean Climate Variability , EGU General Assembly 2024, Vienna, Austria, 14–19 Apr 2024, EGU24-9096, https://doi.org/10.5194/egusphere-egu24-9096, 2024.

EGU24-9334 | ECS | Orals | CL2.4

Characterizing Nonlinearities in ENSO Dynamics Using Hybrid Machine Learning Models 

Jakob Schlör, Jannik Thuemmel, Antonietta Capotondi, Matthew Newman, and Bedartha Goswami

Event-to-event differences of the El Niño Southern Oscillation (ENSO) result in different patterns of extreme climate conditions globally, which requires ENSO forecasts that accurately predict both the likelihood and the type of an event. One question regarding predictable ENSO dynamics is the extent to which they may be captured by multivariate linear dynamics and, relatedly, whether predictable nonlinearities must be accounted for or may be treated stochastically.

In this study, we combine Recurrent Neural Networks with the Linear Inverse Model (LIM) to assess the role of predictable nonlinearities and non-Markovianity in the evolution of tropical Pacific sea surface temperature anomalies. We observe that modeling nonlinearities significantly enhances the forecast accuracy, particularly in the western tropical Pacific within a 9 to 18-month lag time. Our results indicate that the asymmetry of warm and cold events is the main source of the nonlinearity. Moreover, we demonstrate that the predictability of the Hybrid-model can be reliably inferred from the theoretical skill of the LIM whereas a similar assessment is not possible in pure deep learning models.

How to cite: Schlör, J., Thuemmel, J., Capotondi, A., Newman, M., and Goswami, B.: Characterizing Nonlinearities in ENSO Dynamics Using Hybrid Machine Learning Models, EGU General Assembly 2024, Vienna, Austria, 14–19 Apr 2024, EGU24-9334, https://doi.org/10.5194/egusphere-egu24-9334, 2024.

The interannual variability of boreal summer sea surface temperature (SST) in the tropical Atlantic displays two dominant modes, the Atlantic zonal mode highlighting SST variations in the equatorial–southern tropical Atlantic (ESTA) region and the northern tropical Atlantic (NTA) mode focusing on SST fluctuations in the NTA region except in the Gulf of Guinea. Observational evidence indicates that both the boreal summer ESTA and NTA warming are accompanied by a pair of anomalous low-level anticyclones over the western tropical Pacific, and the NTA-related anticyclone is more obvious than the ESTA-related one. Both atmosphere-only and partially coupled experiments conducted with the Community Earth System Model version 1.2 support the observed NTA–Pacific teleconnection. In contrast, the ESTA-induced atmospheric circulation response is negligible over the tropical Pacific in the atmosphere-only experiments, and although the response becomes stronger in the partially coupled experiments, obvious differences still exist between the simulations and observation. The ESTA-induced atmospheric circulation response features an anomalous low-level cyclone over the western tropical Pacific in the partially coupled experiments, opposite to its observed counterpart. It is found that the ESTA warming coincides with significantly La Ni ñ a–like SST anomalies in the central–eastern equatorial Pacific,the influence of which on the tropical atmospheric circulation is opposite to that of the ESTA warming, and therefore contributes to difference between the ESTA-related simulations and observation. Moreover, the cold climatological mean SST in the ESTA region is unfavorable to enhancing the ESTA–Pacific teleconnection during boreal summer

How to cite: Ren, H.: The Impact of Tropical Atlantic SST Variability on the Tropical Atmosphere duringBoreal Summer, EGU General Assembly 2024, Vienna, Austria, 14–19 Apr 2024, EGU24-9772, https://doi.org/10.5194/egusphere-egu24-9772, 2024.

EGU24-10200 | ECS | Orals | CL2.4 | Highlight

Roles of Tropical-Pacific Interannual–Interdecadal Variability in Forming the Super Long La Niña Events 

Run Wang, Hong-Li Ren, and Minghong Liu

The super long La Niña phenomenon, which has an extremely long duration, like the recent 2020–2023 La Niña event, is less concerned than the super El Niño. In this study, we identify five super long La Niña events after 1950 and investigate roles of the 2–3-year quasi-biennial (QB) and 3–7-year low-frequency (LF) ocean–atmosphere coupled processes of El Niño–Southern Oscillation (ENSO), and the interdecadal background in forming the basin-scale prolonged negative sea surface temperature anomalies (SSTAs) during these events. We group the five events into the thermocline-driven type (the 1983–1986 and 1998–2002 events) and the wind-driven type (the 1954–1957, 1973–1976, and 2020–2023 events). The former inherited a sufficiently discharged state of equatorial upper-ocean heat content from the preceding super El Niño and dominated by the thermocline feedback, leading to a LF oceanic dynamical adjustment to support the maintenance of negative ENSO SSTAs. The latter were promoted by the relatively more important zonal advective feedback and Ekman pumping feedback and deeply affected by a strongly negative equatorial zonal wind stress background state that sourced from the strong negative phase of the Interdecadal Pacific Oscillation. Besides, the QB ENSO variability with casual contributions during these events is less important. Results show that both the LF ENSO variability and the interdecadal Pacific background could assist to the genesis of such elongated La Niñas.

How to cite: Wang, R., Ren, H.-L., and Liu, M.: Roles of Tropical-Pacific Interannual–Interdecadal Variability in Forming the Super Long La Niña Events, EGU General Assembly 2024, Vienna, Austria, 14–19 Apr 2024, EGU24-10200, https://doi.org/10.5194/egusphere-egu24-10200, 2024.

EGU24-11374 | ECS | Orals | CL2.4 | Highlight

The El Niño response to tropical volcanic eruptions and geoengineering  

Clarissa Kroll and Robert Jnglin Wills

Following tropical volcanic eruptions and in response to geoengineering efforts in climate models, the occurrence of El Niño is notably enhanced. However, the precise mechanisms leading to the preference of the El Niño state remain a subject of ongoing debate. In this study, we explore the El Niño response within the context of stratospheric aerosol injection experiments using the Community Earth System Model version 1, with the Whole Atmosphere Community Climate Model atmospheric component (CESM1 WACCM). Our investigation is centered around the Stratospheric Aerosol Geoengineering Large Ensemble Dataset encompassing three distinct scenarios: a simulation of the RCP8.5 scenario as baseline climate change scenario, a geoengineering scenario, in which surface temperature increases are completely compensated and a scenario focusing solely on the stratospheric heating derived from the geoengineering approach. Our analysis reveals that the El Niño response is primarily linked to the heating in the tropical tropopause layer and lower stratosphere, and notably, it occurs independently of tropospheric cooling effects. We explain the increased occurrence of El Niño after volcanic eruptions and simulated geoengineering interventions by a slow down of the tropical atmospheric circulation, which is caused by increases in gross moist stability due to aerosol heating in tropical tropopause layer.

How to cite: Kroll, C. and Jnglin Wills, R.: The El Niño response to tropical volcanic eruptions and geoengineering , EGU General Assembly 2024, Vienna, Austria, 14–19 Apr 2024, EGU24-11374, https://doi.org/10.5194/egusphere-egu24-11374, 2024.

EGU24-11643 | ECS | Orals | CL2.4

Dynamical systems analysis of the "El Niño Southern Oscillation" phenomenon  

Julia Mindlin, Gabriel B Mindlin, and Pedro di Nezio

Since the 1980s, when the World Meteorological Organization launched the TOGA (Tropical Ocean-Global Atmosphere Program) program, great advances have been made in understanding ENSO by studying a hierarchy of models (Dijkstra, 2005). At the most complex end of this hierarchy are the Global Climate Models (GCMs), with which simulations of the entire climate system are performed, while at the most elementary end are the simple dynamical models that involve the minimum number of modes necessary to generate the phenomenon and therefore represent the dominant physical processes. Conceptually, two different ways of understanding the irregular oscillations of ENSO are still valid: it could be either a self-sustained oscillator of a chaotic nature or a stable mode excited by atmospheric noise. 

In this work, we use methods from complex systems to revisit the ideas regarding two plausible dynamics of ENSO. We ask if the dynamics can be better represented as a self-sustained oscillator of a chaotic nature or a stable mode excited by noise. For this, we analyzed the sea surface temperatures (SSTs), one of the output variables of the simulations generated with GCMs, the most complex simulations available from the extended system. This temperature field averaged in a particular region of the eastern equatorial Pacific (Niño 3.4) gives rise to a temporal signal widely used for ENSO monitoring and as a proxy for the study of the oscillation. In order to analyze the dynamics of the system, we reconstruct the phase space from an embedding of the temporal signal. We find that three modes are enough to recover the ENSO dynamics of the extended system, in principle of infinite dimension. Our conceptual model is based on the existence of a self-sustaining oscillation with a critical slowing down in phase space; that is, the system traverses a region of phase oscillation with a critical slowing down in phase space; that is, the system traverses a region of phase space more slowly, and includes a periodic forcing that gives rise to chaotic behavior for certain values of the parameters. We validate the model with a topological and statistical analysis of the periodic orbits in the system and, in addition, we show that the complexity of the signal is better represented as a self-sustained oscillator of a chaotic nature than as a stable mode excited by noise (Wang, 2018).

Dijkstra, HA, Nonlinear Physical Oceanography, volume 28. Springer, 2nd revised edition, 2005.

Wang C., A review of ENSO theories, National Science Review, Volume 5, Issue 6, November 2018, Pages 813–825

How to cite: Mindlin, J., Mindlin, G. B., and di Nezio, P.: Dynamical systems analysis of the "El Niño Southern Oscillation" phenomenon , EGU General Assembly 2024, Vienna, Austria, 14–19 Apr 2024, EGU24-11643, https://doi.org/10.5194/egusphere-egu24-11643, 2024.

EGU24-12873 | ECS | Orals | CL2.4

The Dynamics and Propagation of Westerly Wind Bursts 

Inko Bovenzi, Minmin Fu, and Eli Tziperman

Westerly wind bursts (WWBs), a westerly anomaly in equatorial winds in the Pacific, occur before every major El Niño event, yet major aspects of their mechanism are still not fully understood. Proposed mechanisms include cyclones approaching the equator, eastern-propagating convective heating, and wind-induced surface heat exchange, which amplifies WWBs near their peaks (Fu and Tziperman, 2019). To better understand WWB dynamics, we study their composite momentum budget using reanalysis and examine the role of convective heating and other factors. We find that many WWBs are not directly explained by nearby tropical cyclones or convective precipitation. We study their momentum budget before, during, and after the peak of the event, finding different balances at each stage. A comparison of the deduced balance to that in atmospheric general circulation climate models should add confidence in their ability to simulate this important factor in El Niño's development.

How to cite: Bovenzi, I., Fu, M., and Tziperman, E.: The Dynamics and Propagation of Westerly Wind Bursts, EGU General Assembly 2024, Vienna, Austria, 14–19 Apr 2024, EGU24-12873, https://doi.org/10.5194/egusphere-egu24-12873, 2024.

EGU24-12936 | Orals | CL2.4

A Regime View of ENSO Flavors Through Clustering in CMIP6 Models 

Pradeebane Vaittinada Ayar, David Battisti, Camille Li, Martin King, Mathieu Vrac, and Jerry Tjiputra

El Niño-Southern Oscillation (ENSO) flavors in the tropical Pacific are studied from a regime perspective. Five recurring spatial patterns or regimes characterizing the diversity of ENSO are established using a clustering approach applied to the HadISST sea surface temperature (SST) anomalies. Compared to previous studies, our approach gives a monthly characterization of the diversity of the warm and cold phases of ENSO established from observations but commonly applied to models and observations. Two warm (eastern and central El Niño), two cold (basin wide and central La Niña) and a neutral reference regimes are found. Simulated SST anomalies by the models from the latest Coupled Model Intercomparison Project Phase 6 are then matched to these reference regimes. This allows for a consistent assessment of the skill of the models in reproducing the reference regimes over the historical period and the change in these regimes under the high-warming Shared Socio-economic Pathway (SSP5.8.5) scenario. Results over the historical period show that models simulate well the reference regimes with some discrepancies. Models simulate more intense and spatially extended ENSO patterns and have issues in capturing the correct regime seasonality, persistence, and transition between regimes. Some models also have difficulty simulating the frequency of regimes, the eastern El Niño regime in particular. In the future, both El Niño and central La Niña regimes are expected to be more frequent accompanied with a less frequent neutral regime. The central Pacific El Niño and La Niña regimes are projected to increase in amplitude and variability. 
Reference:
Vaittinada Ayar, P.Battisti, D. S.Li, C.King, M.Vrac, M., & Tjiputra, J. (2023). A regime view of ENSO flavors through clustering in CMIP6 modelsEarth's Future11, e2022EF003460. https://doi.org/10.1029/2022EF003460

How to cite: Vaittinada Ayar, P., Battisti, D., Li, C., King, M., Vrac, M., and Tjiputra, J.: A Regime View of ENSO Flavors Through Clustering in CMIP6 Models, EGU General Assembly 2024, Vienna, Austria, 14–19 Apr 2024, EGU24-12936, https://doi.org/10.5194/egusphere-egu24-12936, 2024.

In recent decades, a growing body of research has highlighted the intricate interplay between the El Niño-Southern Oscillation (ENSO) and various climatic patterns across multiple ocean basins. Several studies have highlighted the significance of the South Atlantic Subtropical Dipole (SASD) and its association with ENSO.

This investigation examines the interaction between SASD and ENSO, focusing on the critical role of the South Pacific High in these dynamics. Our study proposes that the onset of the South American Monsoon (SAM) plays a crucial role in this connection, challenging the traditional perception of land's passive role in tropical interbasin interactions.

We identified two eastern Pacific and two central Pacific ENSO precursors from SAM onset period using ERA5 reanalysis data along with 1200-year CESM2 PI run. Applying partial linear regressions revealed the following patterns: initially, warm Southwestern Tropical Atlantic (SWTA) and basin-wide low pressure in the equatorial and subequatorial Atlantic, evolving into cold Southeastern Tropical Pacific (boreal spring); then, negative South Pacific Oscillation (SPO) during the following boreal summer, culminating in La Niña conditions between 12 and 15 months later (SON and DJF of the following year).

We hypothesize that anomalous upper-level divergent monsoonal circulation acts as a bridge connecting the two ocean basins. Ekman dynamics arguably transfers and amplify atmospheric signals from the SAM and SPO to the equatorial Pacific Ocean.

Random Forest and Support Vector Machines for regression analysis yielded results consistent with those from the linear model; superior skill was noted in La Niña prediction compared to under-predicted El Niño events.

Moving forward, we intend to construct causal networks to disentangle the complex interplays described herein while ensuring independence from other known teleconnections; alternatively, we plan to design appropriate numerical experiments using coupled GCMs.

This study's preliminary results present exciting opportunities to enhance early ENSO prediction by considering the impact of the South American Monsoon on aligning the variability of the tropical South Atlantic and South Pacific oceans.

How to cite: Bellacanzone, F. and Bordoni, S.: Enhancing early ENSO prediction: how the South American Monsoon onset connects the South Atlantic Subtropical Dipole and the South Pacific Oscillation, EGU General Assembly 2024, Vienna, Austria, 14–19 Apr 2024, EGU24-13140, https://doi.org/10.5194/egusphere-egu24-13140, 2024.

EGU24-13513 | ECS | Posters on site | CL2.4 | Highlight

Impact of summer-persistent ENSO events on the global climate and the occurrence of extreme weather events 

Anna Schultze, Zhengyao Lu, Qiong Zhang, Minjie Zheng, and Thomas Pugh

El Niño Southern Oscillation (ENSO), the most prominent climate variability in the tropical Pacific Ocean, significantly influences global climate and weather patterns, impacting ecosystems and societies worldwide. Our study focuses on the underexplored aspect of summer-persistent ENSO events, their global climatic impacts, and their role in triggering extreme weather occurrence.

ENSO events follow a distinct cycle, with El Niños more tightly bound to this cycle, while some La Niñas tend to fall below the ENSO threshold during the summer and then re-intensify in the following winter, resulting in multi-year La Niña events. However, there have been cases of slower ENSO decay, where sea surface temperature anomalies (SSTA) exceeding the ENSO threshold values into the northern-hemisphere summer, have been observed. The 2018/2019 El Niño, persisting until July, is a recent example, linked to significant events like the severe Australian bushfires in 2020 and the longest heatwave in history in the North Pacific in 2019. The El Niño was followed by a triple-dip La Niña, linked to extreme weather events in Africa, Australia and the United States. This highlights the importance of understanding the summer-persistent ENSO events.

Our study is structured based on three aims: identifying past summer-persistent ENSO events, assessing their impacts on global temperature and precipitation patterns, and examining their linkage to extreme weather events. Utilizing the Oceanic Niño Index calculated from the extended reconstructed sea surface temperature (ERSSTv5), we categorised ENSO events into conventional, summer-persistent, and multi-year summer-persistent types. The latter two were defined by events in which the Oceanic Niño Index exceeded the ENSO threshold until June for one or two consecutives summer seasons, respectively. We identified 12 summer-persistent ENSO events since 1940, separated into four summer-persistent El Niños, five summer-persistent La Niñas, and three multi-year summer-persistent La Niñas. Analyzing ERA5 reanalysis composites of 2-m temperature and precipitation, we compared the climatic impacts of these ENSO variants across winter and summer. This study advances our understanding of the climatic consequences of summer-persistent ENSO events, providing insights crucial for developing mitigation strategies for their impacts on global climate and extreme weather occurrences.

How to cite: Schultze, A., Lu, Z., Zhang, Q., Zheng, M., and Pugh, T.: Impact of summer-persistent ENSO events on the global climate and the occurrence of extreme weather events, EGU General Assembly 2024, Vienna, Austria, 14–19 Apr 2024, EGU24-13513, https://doi.org/10.5194/egusphere-egu24-13513, 2024.

The El Niño Southern Oscillation (ENSO) dominates tropical climate variability. While it is defined by alterations in sea surface temperatures in the eastern and central tropical Pacific, ENSO influences temperature and precipitation patterns across the globe through a network of atmospheric and oceanic teleconnections. Whether ENSO is controlled or responds to external climate factors has long remained elusive, in large part due to the lack of paleoclimate evidence of tropical variability during different climate states. Here we utilize the geochemical signatures of planktic foraminifera to reconstruct eastern and central tropical variability during the last glacial maximum (LGM), some 20-25,000 years ago. Climate conditions during the LGM were very different, featuring atmospheric CO2 concentrations, global temperatures, and sea level all substantially lower than today. However, precessional forcing, thought to be a potential control on ENSO expression, was similar to modern orbital configuration. Our reconstruction spans the central and eastern tropical Pacific during this key time frame and assesses how the patterns of variability - or ENSO ‘flavors’ - may have changed. We compare our spatial reconstructions of variability to changes in the equatorial Pacific thermocline and test hypotheses of thermocline control of ENSO. We explore the evolution of the eastern and central Pacific thermocline, and how their relationship may be an additional factor in influencing ENSO expression. Our results provide key insights into the evolution and history of tropical variability under differing background climate states, providing context for modern ENSO behavior and prediction.

How to cite: Rustic, G., Rosenheim, E., Slotter, J., and Hill, K.: Reconstructing Tropical Pacific Variability During the Last Glacial Maximum Using Individual Foraminifera: An Investigation of ENSO Flavors , EGU General Assembly 2024, Vienna, Austria, 14–19 Apr 2024, EGU24-13790, https://doi.org/10.5194/egusphere-egu24-13790, 2024.

EGU24-13992 | ECS | Orals | CL2.4

Oceans outside the tropical Pacific influence ENSO when ENSO predictability is poor 

Jemma Jeffree, Nicola Maher, Dillon Amaya, and Dietmar Dommenget

Various studies demonstrate that the El Niño Southern Oscillation is influenced by each of the Atlantic Ocean, Indian Ocean, extra-tropical Pacific Ocean and Southern Ocean. However, there is no cohesive picture of the relative importance of different ocean basins. Furthermore, even when considering only one basin, there is disagreement over the strength of it's influence on ENSO. Differences between previous studies likely arise from differences in their design. Untangling interbasin influences is non-trivial, due to  the need to distinguish between correlation and causation. Investigating these interbasin interactions is additionally complicated by model bias, and computational expense limiting the breadth of model studies.

We investigate the interbasin influences on ENSO from a new angle. We use analogue forecasting instead of initialised ensemble forecasting: we select analogues similar to some target state from a long model run (e.g. pre-industrial control or single model initial-condition large ensemble), rather than initialising from that target state. The analogue forecasts, made by following the selected analogues through time in the model run, have been previously evaluated to show similar skill to an initialised forecast. These forecasts are much faster than traditional initialised forecasts, allowing us to explore multiple models, lead times and initialisation months. We explore whether these analogue forecasts are improved by considering information from regions outside the tropical Pacific, and then infer how these regions contribute to ENSO evolution.

When ENSO forecasts are skilful, before the Spring Predictability Barrier, outside influences have little impact on ENSO forecast skill. When ENSO forecasts cross the Spring Predictability Barrier and are poor, then considering information from outside the Tropical Pacific Ocean improves forecasts. We conclude that when ENSO is in a growth phase it dominates the climate system, but in a decay phase ENSO is influenced by regions outside the tropical Pacific. This behaviour is consistent across at least two global coupled climate models, despite large variability in the way these models represent ENSO's seasonal evolution. We intend to expand this investigation to more models, and to compare the impacts of verifying forecasts against observational or model data.

How to cite: Jeffree, J., Maher, N., Amaya, D., and Dommenget, D.: Oceans outside the tropical Pacific influence ENSO when ENSO predictability is poor, EGU General Assembly 2024, Vienna, Austria, 14–19 Apr 2024, EGU24-13992, https://doi.org/10.5194/egusphere-egu24-13992, 2024.

EGU24-15294 | ECS | Orals | CL2.4

Towards a better understanding of ENSO diversity: a paleoclimate perspective 

Isma Abdelkader Di Carlo, Pascale Braconnot, Matthieu Carré, Mary Elliot, and Olivier Marti

El Niño-Southern Oscillation (ENSO) events are hard to put in one category because they differ in intensity, spatial pattern, and temporal evolution. Studies have characterized events into two main categories: central Pacific (CP) and eastern Pacific (EP) events. The indicators used to compute EP and CP events are varied, from area-averaged regions to Empirical Orthogonal Function (EOF) analysis. In the recent climatic period, they all show similar results. However, future projections show differing results when using two different methods of computing EP and CP events. Since the observational period is too short, we use paleoclimate reconstructions, which provide unique and quantitative measures of past climate changes over long time scales. We will first synthesize previous studies and discuss how they have used paleoclimate modeling and/or data to provide clues into how ENSO diversity may have been shaped in past climates. Our results indicate that many apparent inconsistencies in future projection studies are due to misleading use of ENSO diversity indicators and that investigating ENSO diversity with a climate change perspective requires assessing both changes in the climate mean state (annual mean and seasonality) and changes in variability. 

How to cite: Abdelkader Di Carlo, I., Braconnot, P., Carré, M., Elliot, M., and Marti, O.: Towards a better understanding of ENSO diversity: a paleoclimate perspective, EGU General Assembly 2024, Vienna, Austria, 14–19 Apr 2024, EGU24-15294, https://doi.org/10.5194/egusphere-egu24-15294, 2024.

EGU24-17071 | ECS | Posters on site | CL2.4

Present and future of Extreme El Niño teleconnections over North America in CMIP6 models 

Margot Beniche, Jérôme Vialard, and Matthieu Lengaigne

Previous studies did suggest a diversity of the ENSO teleconnection pattern, with an eastward shifted pattern for El Niño relative to La Niña or for “eastern Pacific” (EP) relative to “central Pacific” (CP) El Niño events. Recently, Beniche et al. (in revision) demonstrated that extreme El Niño events (i.e. the strongest EP events, such as those in 1982/83, 1997/98, and 2015/16) were the only events leading to a clear eastward shift of the winter ENSO teleconnection pattern over North America. This specific teleconnection is also associated with reproducible wet (warm) anomalies over the western USA coast (northern USA and Canada). They did however demonstrate it based on the limited observational dataset, and a single AMIP CNRM-CM6.1 ensemble.

The current study aims at evaluating the robustness of these results using the broader AMIP6 and CMIP6 datasets. The specificity of the Extreme El Niño North American winter teleconnection pattern, and its inter-event and inter-member reproducibility, are robust across 23 historical AMIP ensembles (1979-2014). These events are associated with 73% chances of warm conditions over the Northern USA and Canada and 68% chances of wet conditions over the Western US coast across the AMIP ensemble. The stronger reproducibility of the extreme El Niño teleconnections can be explained by a more favourable Signal to Noise (SNR) ratio (mainly due to stronger signal).

We further evaluate the realism of these teleconnections patterns in presence of the systematic biases that are present in CMIP6. We only select CMIP6 models that reproduce Extreme El Niño events based on the precipitation-index of Cai et al. (2014). In agreement with previous studies using CMIP5 (e.g. Bayr et al., 2019), we find that models with stronger cold climatological SST bias are unable to simulate extreme Niño3 rainfall anomaly events. CMIP6 models that reproduce extreme El Niño tropical rainfall reasonably also reproduce the specific extreme El Niño 500 hPa geopotential height and surface temperature winter teleconnection pattern over North America. They however do not reproduce well the specific wet anomalies over the west American coast associated with those events, casting doubt on the CMIP6 ability to project precipitation changes over this region. We end by discussing the relevance of these results for understanding projected changes in ENSO teleconnections over North America in the context of different Shared Socioeconomic Pathways (SSPs) scenarii.

How to cite: Beniche, M., Vialard, J., and Lengaigne, M.: Present and future of Extreme El Niño teleconnections over North America in CMIP6 models, EGU General Assembly 2024, Vienna, Austria, 14–19 Apr 2024, EGU24-17071, https://doi.org/10.5194/egusphere-egu24-17071, 2024.

EGU24-17210 | ECS | Posters on site | CL2.4 | Highlight

Crying wolf with the 2023 El Niño: a predicted event that failed to materialize? 

Sandro Carniel, Gian Luca Eusebi Borzelli, Aniello Russo, and Cosimo Enrico Carniel

The El Niño–Southern Oscillation (ENSO) is a phenomenon that involves the redistribution of heat in the tropical Pacific Ocean, resulting in irregular oscillations in the sea surface temperature (SST) between warm (El Niño) and cold (La Niña) phases, and impacting the global planetary climate. In July 2023 the World Meteorological Organization, formally responsible to declare the onset of El Niño, officially announced its onset to the media, urging governments to prepare for potential high impacts on health, ecosystems and economies. However, the analysis of long-term meteorological and oceanographic data updated to the end of 2023 shows that while the eastern Pacific was warmer than normal in the second half of the year, the overall configuration of the tropical Pacific climate system did not indicate a strong El Niño event. Our findings show that the 2023-24 El Niño event, initially predicted to be at least moderate and possibly strong, turned out to be weak and, de facto, the year closed confirming it as a weaker than expected event. Based on historical records, we hypothesize that the state of the Pacific climate system at the end of 2023, following the unusual 2023-24 El Niño, may lead to the development of a strong or very strong El Niño by mid-2024.

How to cite: Carniel, S., Eusebi Borzelli, G. L., Russo, A., and Carniel, C. E.: Crying wolf with the 2023 El Niño: a predicted event that failed to materialize?, EGU General Assembly 2024, Vienna, Austria, 14–19 Apr 2024, EGU24-17210, https://doi.org/10.5194/egusphere-egu24-17210, 2024.

EGU24-20761 | ECS | Orals | CL2.4

Visualizing the transition from LaNiño to ElNiño from NASA's model outputs 

Atousa Saberi and Gregory Shirah

The ENSO affects global weather. We used NASA GEOS Subseasonal to Seasonal (S2S) Coupled ocean-atmosphere model, NASA MERRA‐2 reanalysis, along with NOAA Niño3.4 SST anomaly index time series to visualize the transition from  LaNiño 2021 to ElNiño 2023. The visualization is a comprehensive model explainer showing changes in the top 300 meters of the Pacifc Ocean (such as thermocline flattening, movements of the temperature anomalies) coupled with the Walker Circulation and the continous coupled interaction between the ocean and the atmosphere. It's the first effort in visualizing the Walker Circulation and the moving convective branch across the Pacific without schematic plots but rather with climate model outputs.  We will also cover the effect of the two phases of ENSO on the global weather pattern. This visualization will be narrated and released to the public in the future.

How to cite: Saberi, A. and Shirah, G.: Visualizing the transition from LaNiño to ElNiño from NASA's model outputs, EGU General Assembly 2024, Vienna, Austria, 14–19 Apr 2024, EGU24-20761, https://doi.org/10.5194/egusphere-egu24-20761, 2024.

EGU24-21415 | Posters on site | CL2.4

How closely related are the Interdecadal Pacific Oscillation and El Niño-Southern Oscillation? 

Tim Cowan, Hanna Heidemann, Scott B. Power, and Benjamin J. Henley

Sea surface temperature (SST) patterns in the Pacific Ocean cause climate variability in many parts of the world. This is due to the El Niño-Southern Oscillation (ENSO) on interannual timescales and the Interdecadal Pacific Oscillation (IPO) acting on decadal to interdecadal timescales, modifying ENSO teleconnections. However, how both ENSO, ENSO diversity and the IPO interact with each other still requires further clarification. In this study, we use observations of Pacific Ocean SSTs from 1920 to 2022 to explore the statistical relationships between decadal ENSO variability and the IPO. More specifically, we show how ENSO event characteristics of both central and eastern Pacific El Niño, as well as all La Niña events varies between their occurrence in warm (positive), compared to cool (negative) phases of the IPO. We further show that up to 60% of the variability in the IPO Tripole Index can be reconstructed by using simple ENSO metrics such as the relative frequency of El Niño and La Niña events. While statistically a clear relationship between ENSO and the IPO exists, some of the IPO’s key features, especially North Pacific SSTs, cannot be explained by decadal ENSO variability.  

How to cite: Cowan, T., Heidemann, H., Power, S. B., and Henley, B. J.: How closely related are the Interdecadal Pacific Oscillation and El Niño-Southern Oscillation?, EGU General Assembly 2024, Vienna, Austria, 14–19 Apr 2024, EGU24-21415, https://doi.org/10.5194/egusphere-egu24-21415, 2024.

Monsoon rainfall and year-to-year variability play an important role in Africa’s energy, agriculture, and other societal sectors. Within the African continent, east African countries are affected much by higher degrees of variability in seasonal monsoon precipitation. Two large-scale climate drivers, the Indian Ocean Dipole (IOD) and El Niño Southern Oscillation (ENSO) are studied in this regard. A strong connection starting from a season ahead is identified for early austral summer (Oct-Nov-Dec, OND) monsoonal rain in eastern Africa.  This has been examined using various data sources, detrending data beforehand, analysing either recent or earlier time periods - covering two decades each, and using the analyses of regression. Results of compositing also suggested a strong significant anomaly in OND rain covering that region of east Africa (named here as region A:18˚S-12˚N, 25˚E-52˚E).  When IOD and ENSO are both negative in July-August-September(JAS) there is a significant deficit in OND rainfall, while an excess rain when both are positive. The Walker circulation plays a key role via altering descending and ascending branches in two circumstances. Based on this analysis, it is possible to deliver an estimation of cumulative rain in terms of median value, range and distribution, one season in advance, at a point location or average over a region. Results are further verified for recent two years of 2022 and 2023, where drivers were of same sign, either both negative (2022) or positive (2023). Classifications based on two drivers, starting from JAS, are not only modulating cumulative rain but also influencing onset dates; excess (deficit) rain and early (late) onset are associated with positive (negative) phases of both drivers. Interestingly, regions of east Africa, south of that box region show a complete reverse pattern in OND and that pattern continues till Dec-Jan-Feb. In terms of mechanisms, apart from Walker circulation, ocean also plays a key part.      

            Some results of compositing are confirmed for longer records (1940-2021) too and further classification of drivers, based on a threshold value (+0.4) is tested. In the recent year 2023, as both drivers were strongly positive in JAS, more analyses in such cases are presented.  We note, if either of the drivers is weak positive and lies in the range of 0 to +.04, the signal in region A weakens substantially on the eastern side of the box. The strongest weakening happens when both the drivers are of low magnitude in JAS (i.e.,  between 0 to +0.4). Rainfall (OND) variability of region A, at intra-decadal, decadal and multi-decadal scales are studied by applying the method of centered moving averages of 5-year, 11-year and 21-year respectively. A decreasing trend is noted in all situations and major peak/trough years are identified. For multi-decadal analyses, a shift at around 1958 is identified when the trend of OND rain is reversed and switched from increasing to decreasing. Our results have implications for future planning in optimizing energy and agricultural outputs and the livelihood of millions of east Africans will be impacted.   

How to cite: Roy, I. and Troccoli, A.: Important drivers of October to December rainfall season in eastern Africa and relevant mechanisms, EGU General Assembly 2024, Vienna, Austria, 14–19 Apr 2024, EGU24-21764, https://doi.org/10.5194/egusphere-egu24-21764, 2024.

The latest assessment report (AR6) of the Intergovernmental Panel on Climate Change includes a new element to climate research, i.e. the Interactive Atlas (IA), which is very useful for users from different sectors. As the new CMIP6 global climate model simulations use the brand-new SSP-scenarios paired with the RCP-scenarios, the latest climate change projections should be evaluated in order to update the regional and national adaptation strategies. Keeping this in mind we focused on Europe, with a special emphasis on Hungary in our study.

Our aim was to analyse the potential future changes of different temperature indices for Europe, in order to recognize spatial patterns and trends that may shape our climate in the second half of the 21st century. For this purpose, multi-model mean simulation data provided by the IPCC AR6 WG1 IA were downloaded on a monthly base. We chose two climate indices beside the mean temperature values, which represent temperature extremes, namely, the number of days with maximum temperature above 35 °C and the number of frost days (i.e. when daily minimum temperature is below 0 °C). We focused on the end of the 21st century (2081–2100) with also briefly considering the medium-term changes of the 2041–2060 period (both compared to the last two decades of the historical simulation period, i.e. 1995–2014 as the reference period). For both future periods we used all scenarios provided in the IA, namely, SSP1-2.6, SSP2-4.5, SSP3-7.0 and SSP5-8.5.

Several zonal and meridional segments over the continent were defined, where we analysed the projected changes of the indices. The zonal segments provide an insight on two different effects that may induce spatial differences between future regional changes. (i) Continentality can be recognized as an increasing effect from the western parts of the segment towards the east. (ii) Topography also appears as the influence of mountains, plains, and basins emerge. The meridional segments provide information about the north-to-south differences as well, as the effects of sea cover. The changes in the indices are plotted on diagrams representing the different months, where the differences in the scenarios are also shown. These diagrams are compared to their respective landscape profiles, furthermore, statistical parameters were calculated. In addition, a monotony index was defined as the cumulative direction of differences between the neighbouring grid cells and analysed within the study.

Our results show that in the changes of mean temperature, both the zonal location and sea cover will play a key role in forming spatial differences within Europe. However, for the extreme temperature indices, topography and continentality are likely to become more dominant than sea cover, while the zonal location remains an important factor. 

Acknowledgements: This work was supported by the Hungarian National Research, Development and Innovation Fund [grant numbers PD138023, K-129162], and the National Multidisciplinary Laboratory for Climate Change [grant number RRF-2.3.1-21-2022-00014]. 

How to cite: Divinszki, F., Kis, A., and Pongrácz, R.: Analysing the projected monthly changes of temperature-related climate indices over Europe using zonal and meridional segments based on CMIP6 data, EGU General Assembly 2024, Vienna, Austria, 14–19 Apr 2024, EGU24-389, https://doi.org/10.5194/egusphere-egu24-389, 2024.

EGU24-868 | ECS | Posters on site | CL4.3

Relationship of the predictability of North Pacific Mode and ENSO with predictability of PDO 

Jivesh Dixit and Krishna M. AchutaRao

PDO and ENSO are most prominent variability modes in the Pacific Ocean at decadal and interannual timescales respectively. Mutual independence between ENSO and PDO is questionable (Chen & Wallace, 2016). Linear combination of the first two orthogonal modes of SST variability in our Study Region (SR; 70oN - 20oS, 110oE - 90oW) i.e. mode 1 (interannual mode, we call it, IAM; ENSO like variability) and mode 2 (North Pacific Mode (NPM; Deser & Blackmon (1995)); a decadal mode) produces a PDO like variability (Chen & Wallace, 2016). It suggests that PDO is not independently hosted in the Pacific Ocean and can be represented by two linearly independent variability modes.

To produce credible and skillful climate information at multi-year to decadal timescales, Decadal Climate Prediction Project (DCPP), led by the Working Group on Subseasonal to Interdecadal Prediction (WGSIP), focuses on both the scientific and practical elements of forecasting climate by employing predictability research and retrospective analyses within the Coupled Model Intercomparison Project Phase 6 (CMIP6). Component A under DCPP experiments concentrates on hindcast experiments to examine the prediction skill of participating models with respect to actual observations.

As linear combination of  IAM and NPM in SR produces PDO pattern and timescales efficiently, we compared the  ability of DCPP-A hindcasts to predict  IAM, NPM, and  PDO. In this analysis we use output from 9 models (a total of 128 ensemble members), initialised every year from 1960 to 2010. To produce the prediction skill estimates.

At lead year 1 from initialisation, the prediction of NPM,  IAM and PDO is quite skillful as the models are initialised with observations. In subsequent years, skill of either IAM or NPM or both drop significantly and that leads to drop in skill of predicted PDO index. Both the deterministic estimates and probabilistic estimates of prediction skill for DCPP hindcast experiments suggest that the ability of hindcast experiments to predict NPM governs the prediction skill to predict PDO index.

Keywords: PDO, ENSO, NPM, CMIP6, DCPP, hindcast

References

Chen, X., & Wallace, J. M. (2016). Orthogonal PDO and ENSO indices. Journal of Climate, 29(10), 3883–3892. https://doi.org/10.1175/jcli-d-15-0684.1

Deser, C., & Blackmon, M. L. (1995). On the Relationship between Tropical and North Pacific Sea Surface Temperature Variations. Journal of Climate, 8(6), 1677–1680. https://doi.org/10.1175/1520-0442(1995)008<1677:OTRBTA>2.0.CO;2

How to cite: Dixit, J. and AchutaRao, K. M.: Relationship of the predictability of North Pacific Mode and ENSO with predictability of PDO, EGU General Assembly 2024, Vienna, Austria, 14–19 Apr 2024, EGU24-868, https://doi.org/10.5194/egusphere-egu24-868, 2024.

EGU24-1757 | Posters on site | CL4.3

Is the NAO signal-to-noise paradox exacerbated by severe winter windstorms? 

Lisa Degenhardt, Gregor C. Leckebusch, Adam A. Scaife, Doug Smith, and Steve Hardiman

The signal-to-noise paradox is known to be a limitation in multiple seasonal and decadal forecast models where the model ensemble mean predicts observations better than individual ensemble members. This ‘paradox’ occurs for different parameters, like the NAO, temperature, wind speed or storm counts in multiple seasonal and decadal forecasts. However, investigations have not yet found the origin of the paradox. First hypotheses are that weak ocean – atmosphere coupling or a misrepresentation of eddy feedback in these models is responsible.

Our previous study found a stronger signal-to-noise error in windstorm frequency than for the NAO despite highly significant forecast skill. In combination with the underestimation of eddy feedback in multiple models, this led to the question: Might the signal-to-noise paradox over the North-Atlantic be driven by severe winter windstorms?

To assess this hypothesis, the signal-to-noise paradox is investigated in multiple seasonal forecast suites from the UK Met Office, ECMWF, DWD and CMCC. The NAO is used to investigate the changes in the paradox depending on the storminess of the season. The results show a significant increase of the NAO-signal-to-noise error in stormy seasons in GloSea5. Other individual models like the seasonal model of the DWD or CMCC do not show such a strong difference. A multi-model approach, on the other hand, shows the same tendency as GloSea5. Nevertheless, these model differences mean that more hindcasts are needed to conclusively demonstrate that the signal-to-noise error arises from Atlantic windstorms.

How to cite: Degenhardt, L., Leckebusch, G. C., Scaife, A. A., Smith, D., and Hardiman, S.: Is the NAO signal-to-noise paradox exacerbated by severe winter windstorms?, EGU General Assembly 2024, Vienna, Austria, 14–19 Apr 2024, EGU24-1757, https://doi.org/10.5194/egusphere-egu24-1757, 2024.

EGU24-1940 | ECS | Orals | CL4.3

Study of the Decadal Predictability of Mediterranean Sea Surface Temperature Based on Observations 

Xiaoqin Yan, Youmin Tang, and Dejian Yang

Sea surface temperature (SST) changes in the Mediterranean Sea have profound impacts on both the Mediterranean regions and remote areas. Previous studies show that the Mediterranean SST has significant decadal variability that is comparable with the Atlantic multidecadal variability (AMV). However, few studies have discussed the characteristics and sources of the decadal predictability of Mediterranean SST based on observations. Here for the first time we use observational datasets to reveal that the decadal predictability of Mediterranean SST is contributed by both external forcings and internal variability for both annual and seasonal means, except that the decadal predictability of the winter mean SST in the eastern Mediterranean is mostly contributed by only internal variability. Besides, the persistence of the Mediterranean SST is quite significant even in contrast with that in the subpolar North Atlantic, which is widely regarded to have the most predictable surface temperature on the decadal time scale. After the impacts of external forcings are removed, the average prediction time of internally generated Mediterranean SST variations is more than 10 years and closely associated with the multidecadal variability of the Mediterranean SST that is closely related to the accumulated North Atlantic Oscillation forcing.

How to cite: Yan, X., Tang, Y., and Yang, D.: Study of the Decadal Predictability of Mediterranean Sea Surface Temperature Based on Observations, EGU General Assembly 2024, Vienna, Austria, 14–19 Apr 2024, EGU24-1940, https://doi.org/10.5194/egusphere-egu24-1940, 2024.

EGU24-3190 | ECS | Orals | CL4.3

Seasonal forecasting of the European North-West shelf seas: limits of winter and summer sea surface temperature predictability 

Jamie Atkins, Jonathan Tinker, Jennifer Graham, Adam Scaife, and Paul Halloran

The European North-West shelf seas (NWS) support economic interests and provide environmental services to several adjacent populous countries. Skilful seasonal forecasts of the NWS would be useful to support decision making. Here, we quantify the skill of an operational large-ensemble ocean-atmosphere coupled dynamical forecasting system (GloSea), as well as a benchmark persistence forecasting system, for predictions of NWS sea surface temperature (SST) at 2-4 months lead time in winter and summer. We also identify sources of- and limits to NWS SST predictability with a view to what additional skill may be available in the future. We find that GloSea NWS SST skill is generally high in winter and low in summer. Persistence of anomalies in the initial conditions contributes substantially to predictability. GloSea outperforms simple persistence forecasts, by adding atmospheric variability information, but only to a modest extent. Where persistence is low – for example in seasonally stratified regions – both GloSea and persistence forecasts show lower skill. GloSea skill can be degradeded by model deficiencies in the relatively coarse global ocean component, which lacks a tidal regime and likely fails to properly fine-scale NWS physics. However, using “near perfect atmosphere” tests, we show potential for improving predictability of currently low performing regions if atmospheric circulation forecasts can be improved, underlining the importance of development of atmosphere-ocean coupled models for NWS seasonal forecasting applications.

How to cite: Atkins, J., Tinker, J., Graham, J., Scaife, A., and Halloran, P.: Seasonal forecasting of the European North-West shelf seas: limits of winter and summer sea surface temperature predictability, EGU General Assembly 2024, Vienna, Austria, 14–19 Apr 2024, EGU24-3190, https://doi.org/10.5194/egusphere-egu24-3190, 2024.

EGU24-4538 | ECS | Orals | CL4.3

Statistical downscaling of extremes in seasonal predictions - a case study on spring frosts for the viticultural sector 

Sebastiano Roncoroni, Panos Athanasiadis, and Silvio Gualdi

Spring frost events occurring after budburst of grapevines can damage new shoots, disrupt plant growth and cause large economic losses to the viticultural sector. Frost protection practices encompass a variety of vineyard management actions across timescales, from seasonal to decadal and beyond. The cost-effectiveness of such measures depends on the availability of accurate predictions of the relevant climate hazards at the appropriate timescales.

In this work, we present a statistical downscaling method which predicts variations in the frequency of occurrence of spring frost events in the important winemaking region of Catalunya at the seasonal timescale. The downscaling method exploits the seasonal predictability associated with the predictable components of the atmospheric variability over the Euro-Atlantic region, and produces local predictions of frost occurrence at a spatial scale relevant to vineyard management.

The downscaling method is designed to address the specific needs highlighted by a representative stakeholder in the local viticultural sector, and is expected to deliver an actionable prototype climate service. The statistical procedure is developed in perfect prognosis mode: the method is trained with large-scale reanalysis data against a high-resolution gridded observational reference, and validated against multi-model seasonal hindcast predictions.

Our work spotlights the potential benefits of transferring climate predictability across spatial scales for the design and provision of usable climate information, particularly regarding extremes.

How to cite: Roncoroni, S., Athanasiadis, P., and Gualdi, S.: Statistical downscaling of extremes in seasonal predictions - a case study on spring frosts for the viticultural sector, EGU General Assembly 2024, Vienna, Austria, 14–19 Apr 2024, EGU24-4538, https://doi.org/10.5194/egusphere-egu24-4538, 2024.

EGU24-4873 | ECS | Orals | CL4.3

Why does the Signal-to-Noise Paradox Exist in Seasonal Climate Predictability? 

Yashas Shivamurthy, Subodh Kumar Saha, Samir Pokhrel, Mahen Konwar, and Hemant Kumar Chaudhari

Skillful prediction of seasonal monsoons has been a challenging problem since the 1800s. However, significant progress has been made in Indian summer monsoon rainfall prediction in recent times, with skill scores reaching 0.6 and beyond, surpassing the estimated predictability limits. This phenomenon leads to what is known as the “Signal-to-noise Paradox.” To investigate this paradox, we utilized 52 ensemble member hindcast runs spanning 30 years.

Through the application of ANOVA and Mutual Information methods, we estimate the predictability limit globally. Notably, for the boreal summer rainfall season, the Indian subcontinent exhibited the paradox, among several other regions, while the Equatorial Pacific region, despite demonstrating high prediction skill, does not have the Signal-to-Noise paradox. We employed a novel approach to understand how sub-seasonal variability and their projection in association with predictors are linked to the paradoxical behavior of seasonal prediction skill.

We propose a new method to estimate predictability limits that is free from paradoxical phenomena and shows much higher seasonal predictability. This novel method provides valuable insights into the complex dynamics of monsoon prediction, thereby creating opportunities for expanded research and potential improvements in seasonal forecasting skill in the coming years.

How to cite: Shivamurthy, Y., Saha, S. K., Pokhrel, S., Konwar, M., and Chaudhari, H. K.: Why does the Signal-to-Noise Paradox Exist in Seasonal Climate Predictability?, EGU General Assembly 2024, Vienna, Austria, 14–19 Apr 2024, EGU24-4873, https://doi.org/10.5194/egusphere-egu24-4873, 2024.

EGU24-7134 | ECS | Orals | CL4.3

Towards the Predictability of Compound Dry and Hot Extremes through Complexity Science 

Ankit Agarwal and Ravikumar Guntu

Compound Dry and Hot Extremes (CDHE) have an adverse impact on socioeconomic factors during the Indian summer monsoon, and a future exacerbation is anticipated. The occurrence of CDHE is influenced by teleconnections, which play a crucial role in determining its likelihood on a seasonal scale. Despite the importance, there is a lack of studies unravelling the teleconnections of CDHE in India. Previous investigations specifically focused on teleconnections between precipitation, temperature, and climate indices. Hence, there is a need to unravel the teleconnections of CDHE. This study presents a framework combining event coincidence analysis (ECA) with complexity science. ECA evaluates the synchronization between CDHE and climate indices. Subsequently, complexity science is utilized to construct a driver-CDHE network to identify the critical drivers of CDHE. A logistic regression model is employed to evaluate the proposed drivers' effectiveness. The occurrence of CDHE exhibits distinct patterns from July to September when considering intra-seasonal variability. Our findings contribute to the identification of drivers associated with CDHE. The primary driver for Eastern, Western India and Central India is the indices in the Pacific Ocean and Atlantic Ocean, respectively, followed by the indices in the Indian Ocean. These identified drivers outperform the traditional Niño 3.4-based predictions. Overall, our results demonstrate the effectiveness of integrating ECA and complexity science to enhance the prediction of CDHE occurrences.

How to cite: Agarwal, A. and Guntu, R.: Towards the Predictability of Compound Dry and Hot Extremes through Complexity Science, EGU General Assembly 2024, Vienna, Austria, 14–19 Apr 2024, EGU24-7134, https://doi.org/10.5194/egusphere-egu24-7134, 2024.

EGU24-8028 | ECS | Orals | CL4.3

Constraining near to mid-term climate projections by combining observations with decadal predictions 

Rémy Bonnet, Julien Boé, and Emilia Sanchez

The implementation of adaptation policies requires seamless and relevant information on the evolution of the climate over the next decades. Decadal climate predictions are subject to drift because of intrinsic model errors and their skill may be limited after a few years or even months depending on the region. Non-initialized ensembles of climate projections have large uncertainties over the next decades, encompassing the full range of uncertainty attributed to internal climate variability. Providing the best climate information over the next decades is therefore challenging. Recent studies have started to address this challenge by constraining uninitialized projections of sea surface temperature using decadal predictions or using a storyline approach to constrain uninitialized projections of the Atlantic Meridional Overturning Circulation using observations. Here, using a hierarchical clustering method, we select a sub-ensemble of non-initialized climate simulations based on their similarity to observations. Then, we try to further refine this sub-ensemble of trajectories by selecting a subset based on its consistency with decadal predictions. This study presents a comparison of these different methods for constraining surface temperatures in the North-Atlantic / Europe region over the next decades, focusing on CMIP6 non-initialized simulations.

How to cite: Bonnet, R., Boé, J., and Sanchez, E.: Constraining near to mid-term climate projections by combining observations with decadal predictions, EGU General Assembly 2024, Vienna, Austria, 14–19 Apr 2024, EGU24-8028, https://doi.org/10.5194/egusphere-egu24-8028, 2024.

EGU24-9049 | Posters on site | CL4.3

Constraining internal variability in CMIP6 simulations to provide skillful near-term climate predictions 

Rashed Mahmood, Markus G. Donat, Pablo Ortega, and Francisco Doblas-Reyes

Adaptation to climate change requires accurate and reliable climate information on decadal and multi-decadal timescales. Such near-term climate information is obtained from future projection simulations, which are strongly affected by uncertainties related to, among other things, internal climate variability. Here we present an approach to constrain variability in future projection simulations of the coupled model intercomparison project phase 6 (CMIP6). The constraining approach involves phasing in the simulated with the observed climate state by evaluating the area-weighted spatial pattern correlations of sea surface temperature (SST) anomalies in individual members and observations. The constrained ensemble, based on the top ranked members in terms of pattern correlations with observed SST anomalies, shows significant added value over the unconstrained ensemble in predicting surface temperature 10 and also 20 years  after the synchronization with observations, thus extending the forecast range of the standard initialised predictions. We also find that while the prediction skill of the constrained ensemble for the first ten years is similar to the initialized decadal predictions, the added value against the unconstrained ensemble extends over more regions than the decadal predictions. In addition, the constraining approach can also be used to attribute predictability of regional and global climate variations to regional SST variability.

How to cite: Mahmood, R., G. Donat, M., Ortega, P., and Doblas-Reyes, F.: Constraining internal variability in CMIP6 simulations to provide skillful near-term climate predictions, EGU General Assembly 2024, Vienna, Austria, 14–19 Apr 2024, EGU24-9049, https://doi.org/10.5194/egusphere-egu24-9049, 2024.

There is an ongoing discussion about the contributions from forced and natural sources to the Atlantic Multi-decadal Variability (AMV).  As the AMV influences the general climate in large regions, this question has important consequences for climate predictions on decadal timescales and for a robust estimation of the influence of climate forcings.

Here, we investigate the Atlantic Multi-decadal Variability (AMV) in observations and in a large CMIP6 historical climate model ensemble. We compare three different definitions of the AMV aimed at extracting the variability intrinsic to the Atlantic region. These definitions are based on removing from the Atlantic temperature the non-linear trend, the part congruent to the global average, or the part congruent to the multi-model ensemble mean of the global average. The considered AMV definitions agree on the well-known low-frequency oscillatory variability in observations, but show larger differences for the models. In general, large differences between ensemble members are found.

We estimate the forced response in the AMV as the mean of the large multi-model ensemble.  The forced response resembles the observed low-frequency oscillatory variability for the detrended AMV definition, but this definition is also the most inefficient in removing the forced global mean signal. The forced response is very weak for the other definitions and only few of their individual ensemble members show oscillatory variability and, if they do, not with the observed phase.

The observed spatial temperature pattern related to the AMV is well captured for all three AMV definitions, but with some differences in the spatial extent. The observed instantaneous connection between NAO and AMV is well represented in the models for all AMV definitions. Only non-significant evidence of NAO leading the AMV on decadal timescales is found.

How to cite: Christiansen, B., Yang, S., and Drews, A.: The Atlantic Multi-decadal Variability in observations and in a large historical multi-model ensemble: Forced and internal variability, EGU General Assembly 2024, Vienna, Austria, 14–19 Apr 2024, EGU24-9100, https://doi.org/10.5194/egusphere-egu24-9100, 2024.

EGU24-9274 | ECS | Orals | CL4.3 | Highlight

The Role of the North Atlantic for Heat Wave Characteristics in Europe 

Sabine Bischof, Robin Pilch Kedzierski, Martje Hänsch, Sebastian Wahl, and Katja Matthes

The recent severe European summer heat waves of 2015 and 2018 co-occurred with cold subpolar North Atlantic (NA) sea surface temperatures (SSTs). However, a significant connection between this oceanic state and European heat waves was not yet established.

We investigate the effect of cold subpolar NA SSTs on European summer heat waves using two 100-year long AMIP-like model experiments: one that employs the observed global 2018 SST pattern as a boundary forcing and a counter experiment for which we removed the negative NA SST anomaly from the 2018 SST field, while preserving daily and small-scale SST variabilities. Comparing these experiments, we find that cold subpolar NA SSTs significantly increase heat wave duration and magnitude downstream over the European continent. Surface temperature and circulation anomalies are connected by the upper-tropospheric summer wave pattern of meridional winds over the North Atlantic European sector, which is enhanced with cold NA SSTs. Our results highlight the relevance of the subpolar NA region for European summer conditions, a region that is marked by large biases in current coupled climate model simulations.

How to cite: Bischof, S., Pilch Kedzierski, R., Hänsch, M., Wahl, S., and Matthes, K.: The Role of the North Atlantic for Heat Wave Characteristics in Europe, EGU General Assembly 2024, Vienna, Austria, 14–19 Apr 2024, EGU24-9274, https://doi.org/10.5194/egusphere-egu24-9274, 2024.

EGU24-9690 | ECS | Orals | CL4.3

Hybrid statistical-dynamical seasonal prediction of summer extreme temperatures over Europe 

Luca Famooss Paolini, Paolo Ruggieri, Salvatore Pascale, Erika Brattich, and Silvana Di Sabatino

Several studies show that the occurrence of summer extreme temperatures over Europe is increased since the middle of the twentieth century and is expected to further increase in the future due to global warming (Seneviratne et al., 2021). Thus, predicting heat extremes several months ahead is crucial given their impacts on socio-economic and environmental systems.

In this context, state-of-the-art dynamical seasonal prediction systems (SPSs) show low skills in predicting European heat extremes on seasonal timescale, especially in central and northern Europe (Prodhomme et al., 2022). However, recent studies have shown that our skills in predicting extratropical climate can be largely improved by subsampling the dynamical SPS ensemble with statistical post-processing techniques (Dobrynin et al., 2022).

This study assesses if the seasonal prediction skill of summer extreme temperatures in Europe in the state-of-the-art dynamical SPSs can be improved through subsampling. Specifically, we use a multi-model ensemble (MME) of SPSs contributing to the Copernicus Climate Change Service (C3S), analysing di hindcast period 1993—2016. The MME is subsampled by retaining a subset of members that predict the phase of the North Atlantic Oscillation (NAO) and the Eastern Atlantic (EA), typically linked to summer extreme temperatures in Europe. The subsampling relies on spring predictors of the weather regimes and thus allows us to retain only those ensemble members with a reasonable representation of summer heat extreme teleconnections.

Results show that by retaining only those ensemble members that accurately represent the NAO phase, it not only enhances the seasonal prediction skills for the summer European climate but also leads to improved predictions of summer extreme temperatures, especially in central and northern Europe. Differently, selecting only those ensemble members that accurately represent the EA phase does not improve either the predictions of summer European climate or the predictions of summer extreme temperatures. This can be explained by the fact that the C3S SPSs exhibits deficiencies in accurately representing the summer low-frequency atmospheric variability.

Bibliography

Dobrynin, M., and Coauthors, 2018: Improved Teleconnection-Based Dynamical Seasonal Predictions of Boreal Winter. Geophysical Research Letters, 45 (8), 3605—3614, https://doi.org/10.1002/2018GL07720

Prodhomme, C., S. Materia, C. Ardilouze, R. H. White, L. Batté, V. Guemas, G. Fragkoulidis, and J. Garcìa-Serrano, 2022: Seasonal prediction of European summer heatwaves. Climate Dynamics, 58 (7), 2149—2166, https://doi.org/10.1007/s00382-021-05828-3

Seneviratne, S., and Coauthors, 2021: Weather and Climate Extreme Events in a Changing Climate, chap. 11, 1513—1766. Cambridge University Press, https://doi.org/10.1017/9781009157896.013

How to cite: Famooss Paolini, L., Ruggieri, P., Pascale, S., Brattich, E., and Di Sabatino, S.: Hybrid statistical-dynamical seasonal prediction of summer extreme temperatures over Europe, EGU General Assembly 2024, Vienna, Austria, 14–19 Apr 2024, EGU24-9690, https://doi.org/10.5194/egusphere-egu24-9690, 2024.

EGU24-9905 | ECS | Orals | CL4.3

Optimization-based driver detection and prediction of seasonal heat extremes 

Ronan McAdam, César Peláez Rodríguez, Felicitas Hansen, Jorge Pérez Aracil, Antonello Squintu, Leone Cavicchia, Eduardo Zorita, Sancho Saldez-Sanz, and Enrico Scoccimarro

As a consequence of limited reliability of dynamical forecast systems, particularly over Europe, efforts in recent years have turned to exploiting the power of Machine Learning methods to extract information on drivers of extreme temperature from observations and reanalysis. Meanwhile, the diverse impacts of extreme heat have driven development of new indicators which take into account nightime temperatures and humidity. In the H2020 CLimate INTelligence (CLINT) project, a feature selection framework is being developed to find the combination of drivers which provides optimal seasonal forecast skill of European summer heatwave indicators. Here, we present the methodology, its application to a range of heatwave indicators and forecast skill compared to existing dynamical systems. First, a range of (reduced-dimensionality) drivers are defined, including k-means clusters of variables known to impact European summer (e.g. precipitation, sea ice content), and more complex indices like the NAO and weather regimes. Then, these drivers are used to train machine learning based prediction models, of varying complexity, to predict seasonal indicators of heatwave occurrence and intensity. A crucial and novel step in our framework is the use of the Coral Reef Optimisation algorithm, used to select the variables and their corresponding lag times and time periods which provide optimal forecast skill. To maximise training data, both ERA5 reanalysis and a 2000-year paleo-simulation are used; the representation of heatwaves and atmospheric conditions are validated with respect to ERA5. We present comparisons of forecast skill to the dynamical Copernicus Climate Change Service seasonal forecasts systems. The differences in timing, predictability and drivers of daytime and nighttime heatwaves across Europe are highlighted. Lastly, we discuss how the framework can easily be adapted to other extremes and timescales.


How to cite: McAdam, R., Peláez Rodríguez, C., Hansen, F., Pérez Aracil, J., Squintu, A., Cavicchia, L., Zorita, E., Saldez-Sanz, S., and Scoccimarro, E.: Optimization-based driver detection and prediction of seasonal heat extremes, EGU General Assembly 2024, Vienna, Austria, 14–19 Apr 2024, EGU24-9905, https://doi.org/10.5194/egusphere-egu24-9905, 2024.

EGU24-10539 | ECS | Orals | CL4.3

Exploring multiyear-to-decadal North Atlantic sea level predictability using machine learning and analog methods 

Qinxue Gu, Liwei Jia, Liping Zhang, Thomas Delworth, Xiaosong Yang, Fanrong Zeng, and Shouwei Li

Long-term sea level rise and multiyear-to-decadal sea level variations pose substantial risks of flooding and erosion in coastal communities. The North Atlantic Ocean and the U.S. East Coast are hotspots for sea level changes under current and future climates. Here, we employ a machine learning technique, a self-organizing map (SOM)-based framework, to systematically characterize the North Atlantic sea level variability, assess sea level predictability, and generate sea level predictions on multiyear-to-decadal timescales. Specifically, we classify 5000-year North Atlantic sea level anomalies from the Seamless System for Prediction and EArth System Research (SPEAR) model control simulations into generalized patterns using SOM. Preferred transitions among these patterns are further identified, revealing long-term predictability on multiyear-to-decadal timescales related to shifts in Atlantic meridional overturning circulation (AMOC) phases. By combining the SOM framework with “analog” techniques based on the simulations and observational/reanalysis data, we demonstrate prediction skill of large-scale sea level patterns comparable to that from initialized hindcasts. Moreover, additional source of short-term predictability is identified after the exclusion of low-frequency AMOC signals, which arises from the wind-driven North Atlantic tripole mode triggered by the North Atlantic Oscillation. This study highlights the potential of machine learning methods to assess sources of predictability and to enable efficient, long-term climate prediction.

How to cite: Gu, Q., Jia, L., Zhang, L., Delworth, T., Yang, X., Zeng, F., and Li, S.: Exploring multiyear-to-decadal North Atlantic sea level predictability using machine learning and analog methods, EGU General Assembly 2024, Vienna, Austria, 14–19 Apr 2024, EGU24-10539, https://doi.org/10.5194/egusphere-egu24-10539, 2024.

The inter-annual to multi-decadal variability of recurrent, synoptic-scale atmospheric circulation patterns in the Northern Hemisphere extratropics, as represented by the Jenkinson-Collison classification scheme, is explored in reanalysis data spanning the entire 20th century, and in global climate model (GCM) data from the historical, AMIP and DCPP experiments conducted within the framework of CMIP6. The aim of these efforts is to assess the effect of coupled vs. uncoupled and initialised vs. non-initialized GCM simulations in reproducing the observed low-frequency variability of the aforementioned circulation patterns.

Results reveal that the observed annual counts of typical recurrent weather patterns, such as cyclonic or anticyclonic conditions and also situations of pronounced advection, exhibit significant oscillations on multiple time-scales ranging between several years and several decades. The period of these oscillations, however, is subject to large regional variations. This is in line with earlier studies suggesting that the extratropical atmospheric circulation’s low frequency variability is essentially unforced, except in the Pacific-North American sector where the forced variability is enhanced due to ENSO teleconnections. Neither the periods obtained from historical nor those obtained from AMIP experiments align with observations. Likewise, not even the periods obtained from different runs of the same GCM and experiment correspond to each other. Thus, in an non-initialized model setup, ocean-atmosphere coupling or the lack thereof essentially leads to the same results. Whether initialization and/or augmenting the ensemble size can improve these findings, will also be discussed.

Acknowledgement: This work is part of project Impetus4Change, which has received funding from the European Union’s Horizon Europe research and innovation programme under grant agreement No 101081555.

How to cite: Brands, S., Cimadevilla, E., and Fernández, J.: Low-frequency variability of synoptic-scale atmospheric circulation patterns in the Northern Hemisphere extratropics and associated hindcast skill of decadal forecasting systems, EGU General Assembly 2024, Vienna, Austria, 14–19 Apr 2024, EGU24-10551, https://doi.org/10.5194/egusphere-egu24-10551, 2024.

EGU24-10574 | Orals | CL4.3 | Highlight

Will 2024 be the first year above 1.5 C? 

Nick Dunstone, Doug Smith, Adam Scaife, Leon Hermanson, Andrew Colman, and Chris Folland

Global mean surface temperature is the key metric by which our warming climate is monitored and for which international climate policy is set. At the end of each year the Met Office makes a global mean temperature forecast for the coming year. Following on from the new record 2023, we predict a high probability of another record year in 2024 and a 35% chance of exceeding 1.5 C above pre-industrial. Whilst a one-year temporary exceedance of 1.5 C would not constitute a breech of the Paris Agreement target, our forecast highlights how close we are now to breeching this target. We show that our 2024 forecast can be largely explained by the combination of the continuing warming trend of +0.2 C/decade and the lagged warming affect of a strong tropical Pacific El Nino event. We further highlight 2023 was significantly warmer than forecast and that much of this warming signal came from the southern hemisphere and requires further understanding.

How to cite: Dunstone, N., Smith, D., Scaife, A., Hermanson, L., Colman, A., and Folland, C.: Will 2024 be the first year above 1.5 C?, EGU General Assembly 2024, Vienna, Austria, 14–19 Apr 2024, EGU24-10574, https://doi.org/10.5194/egusphere-egu24-10574, 2024.

EGU24-11485 | ECS | Orals | CL4.3

Summer drought predictability in the Mediterranean region in seasonal forecasts 

Giada Cerato, Katinka Bellomo, and Jost von Hardenberg

The Mediterranean region has been identified as an important climate change hotspot, over the 21st century both air temperature and its extremes are projected to rise at a rate surpassing that of the global average and a significant decrease of average summer precipitation is projected, particularly for the western Mediterranean. On average, Mediterranean droughts have become more frequent and intense in recent years and are expected to become more widespread in many regions. These prolonged dry spells pose a substantial threat to agriculture and impact several socio-economic sectors. In this context, long-range weather forecasting has emerged as a promising tool for seasonal drought risk assessment. However, the interpretation of the forecasting products is not always straightforward due to their inherent probabilistic nature. Therefore, a rigorous evaluation process is needed to determine the extent to which these forecasts provide a fruitful advantage over much simpler forecasting systems, such as those based on climatology. 

In this study, we use the latest version of ECMWF’s seasonal prediction system (SEAS5) to understand its skill in predicting summer droughts. The Standardized Precipitation Evapotranspiration Index (SPEI) aggregated over different lead times is employed to mark below-normal dryness conditions in August. We use a comprehensive set of evaluation metrics to gain insight into the accuracy, systematic biases, association, discrimination and sharpness of the forecast system. Our findings reveal that up to 3 months lead time, seasonal forecasts show stronger association and discrimination skills than the climatological forecast, especially in the Southern Mediterranean, although the prediction quality in terms of accuracy and sharpness is limited. On the other hand, extending the forecast range up to 6 months lead time dramatically reduces its predictability skill, with the system mostly underperforming elementary climatological predictions. 

This approach is then extended to examine the full ensemble of seasonal forecasting systems provided by the Copernicus Climate Change Service (C3S) to test their skill in predicting droughts. Our findings can help an informed use of seasonal forecasts of droughts and the development of related climate services.

How to cite: Cerato, G., Bellomo, K., and von Hardenberg, J.: Summer drought predictability in the Mediterranean region in seasonal forecasts, EGU General Assembly 2024, Vienna, Austria, 14–19 Apr 2024, EGU24-11485, https://doi.org/10.5194/egusphere-egu24-11485, 2024.

EGU24-11930 | ECS | Posters on site | CL4.3

A global empirical system for probabilistic seasonal climate prediction based on generative AI and CMIP6 models  

Lluís Palma, Alejandro Peraza, Amanda Duarte, David Civantos, Stefano Materia, Arijit Nandi, Jesús Peña-Izquierdo, Mihnea Tufis, Gonzalo Vilella, Laia Romero, Albert Soret, and Markus Donat

Reliable probabilistic information at the seasonal time scale is essential across various societal sectors, such as agriculture, energy, or water management. Current applications of seasonal predictions rely on General Circulation Models (GCMs) that represent dynamical processes in the atmosphere, land surface, and ocean while capturing their linear and nonlinear interactions. However, GCMs come with an inherent high computational cost. In an operational setup, they are typically run once a month and at a lower temporal and spatial resolution than the ones needed for regional applications. Moreover, GCMs suffer from significant drifts and biases and can miss relevant teleconnections, resulting in low skill for particular regions or seasons. 

In this context, the use of generative AI methods that can model complex nonlinear relationships can be a viable alternative for producing probabilistic predictions with low computational demand. Such models have already demonstrated their effectiveness in different domains, i.e. computer vision, natural language processing, and weather prediction. However, although requiring less computational power, these techniques still rely on big datasets in order to be efficiently trained. Under this scenario, and with sufficiently high-quality global observational datasets spanning at most 70 years, the research trend has evolved into training these models using climate model output. 

In this work, we build upon the work presented by Pan et al., 2022, which introduced a conditional Variational Autoencoder (cVAE) to predict global temperature and precipitation fields for the October to March season starting from July initial conditions. We adopt several pre-processing changes to account for different biases and trends across the CMIP6 models. Additionally, we explore different architecture modifications to improve the model's performance and stability. We study the benefits of our model in predicting three-month anomalies on top of the climate change trend. Finally, we compare our results with a state-of-the-art GCM (SEAS5) and a simple empirical system based on the linear regression of classical seasonal indices based on Eden et al., 2015.


Pan, Baoxiang, Gemma J. Anderson, André Goncalves, Donald D. Lucas, Céline J.W. Bonfils, and Jiwoo Lee. 'Improving Seasonal Forecast Using Probabilistic Deep Learning'. Journal of Advances in Modeling Earth Systems 14, no. 3 (1 March 2022). https://doi.org/10.1029/2021MS002766.


Eden, J. M., G. J. van Oldenborgh, E. Hawkins, and E. B. Suckling. 'A Global Empirical System for Probabilistic Seasonal Climate Prediction'. Geoscientific Model Development 8, no. 12 (11 December 2015): 3947–73. https://doi.org/10.5194/gmd-8-3947-2015.

How to cite: Palma, L., Peraza, A., Duarte, A., Civantos, D., Materia, S., Nandi, A., Peña-Izquierdo, J., Tufis, M., Vilella, G., Romero, L., Soret, A., and Donat, M.: A global empirical system for probabilistic seasonal climate prediction based on generative AI and CMIP6 models , EGU General Assembly 2024, Vienna, Austria, 14–19 Apr 2024, EGU24-11930, https://doi.org/10.5194/egusphere-egu24-11930, 2024.

EGU24-12969 | ECS | Orals | CL4.3

How unusual is the recent decade-long pause in Arctic summer sea ice retreat? 

Patricia DeRepentigny, François Massonnet, Roberto Bilbao, and Stefano Materia

The Earth has warmed significantly over the past 40 years, and the fastest rate of warming has occurred in and around the Arctic. The warming of northern high latitudes at a rate of almost four times the global average (Rantanen et al., 2022), known as Arctic amplification, is associated with sea ice loss, glacier retreat, permafrost degradation, and expansion of the melting season. Since the mid-2000s, summer sea ice has exhibited a rapid decline, reaching record minima in September sea ice area in 2007 and 2012. However, after the early 2010s, the downward trend of minimum sea ice area appears to decelerate (Swart et al., 2015; Baxter et al., 2019). This apparent slowdown and the preceding acceleration in the rate of sea ice loss are puzzling in light of the steadily increasing rate of greenhouse gas emissions of about 4.5 ppm yr−1 over the past decade (Friedlingstein et al., 2023) that provides a constant climate forcing. Recent studies suggest that low-frequency internal climate variability may have been as important as anthropogenic influences on observed Arctic sea ice decline over the past four decades (Dörr et al., 2023; Karami et al., 2023). Here, we investigate how unusual this decade-long pause in Arctic summer sea ice decline is within the context of internal climate variability. To do so, we first assess how rare this is deceleration of Arctic sea ice loss is by comparing it to trends in CMIP6 historical simulations. We also use simulations from the Decadal Climate Prediction Project (DCPP) contribution to CMIP6 to determine if initializing decadal prediction systems from estimates of the observed climate state substantially improves their performance in predicting the slowdown in Arctic sea ice loss over the past decade. As the DCPP does not specify the data or the methods to be used to initialize forecasts or how to generate ensembles of initial conditions, we also assess how different formulations affect the skill of the forecasts by analyzing differences between models. This work provides an opportunity to attribute this pause in Arctic sea ice retreat to interannual internal variability or radiative external forcings, something that observation analysis alone cannot achieve.

How to cite: DeRepentigny, P., Massonnet, F., Bilbao, R., and Materia, S.: How unusual is the recent decade-long pause in Arctic summer sea ice retreat?, EGU General Assembly 2024, Vienna, Austria, 14–19 Apr 2024, EGU24-12969, https://doi.org/10.5194/egusphere-egu24-12969, 2024.

EGU24-14341 | Posters on site | CL4.3

Compound Heat and Dry Events Influenced by the Pacific–Japan Pattern over Taiwan in Summer 

Szu-Ying Lin, Wan-Ling Tseng, Yi-Chi Wang, and MinHui Lo

Compound dry and hot events, characterized by elevated temperatures and reduced precipitation, pose interconnected challenges to human social economics, necessitating comprehensive strategies for mitigation and adaptation. This study focuses on the Pacific-Japan (PJ) pattern, a significant climate variability influencing summer climates in East Asia. While previous research has explored its impact on Japan and Korea, our investigation delves into its effects on Taiwan, a mountainous subtropical island with a population of approximately 24 million. Utilizing long-term temperature and rainfall data, along with reanalysis dynamic downscaling datasets, we examine the interannual impacts of the PJ pattern on summer temperature and compound heat and dry events. Our findings reveal a significant temperature increase during the positive phase of the PJ pattern, characterized by anticyclonic anomalous circulation over Taiwan. Additionally, both the Standardized Precipitation Index and soil water exhibit a decline during this phase, reflecting meteorological and hydrological drought conditions. A robust negative correlation (-0.7) between drought indices and temperature emphasizes the compound effect of heat and dry events during the PJ positive phase. This study enhances the understanding of the PJ pattern as a climate driver, describing its role in hot and dry summers over Taiwan. The insights gained, when integrated into seasonal prediction and early warning systems, can aid vulnerable sectors in preparing for potential heat and dry stress hazards.

How to cite: Lin, S.-Y., Tseng, W.-L., Wang, Y.-C., and Lo, M.: Compound Heat and Dry Events Influenced by the Pacific–Japan Pattern over Taiwan in Summer, EGU General Assembly 2024, Vienna, Austria, 14–19 Apr 2024, EGU24-14341, https://doi.org/10.5194/egusphere-egu24-14341, 2024.

EGU24-14379 | Posters on site | CL4.3

Linkage between Temperature and Heatwaves in Summer Taiwan to the Pacific Meridional Mode 

Chieh-Ting Tsai, Wan-Ling Tseng, and Yi-Chi Wang

Over the past century, Taiwan has gradually recognized the hazards posed by extreme heat events (EHT), prompting the development of mid-term adaptation strategies to address challenges in the coming decades. However, our understanding of decadal-scale temperature variations remains insufficient, requiring further research into influencing factors. Our study reveals the crucial role of the Pacific Meridional Mode (PMM) in modulating decadal-scale variations in summer temperatures in Taiwan. During the positive phase of PMM, warm sea surface temperature anomalies trigger an eastward-moving wave train extending into East Asia. This leads to the development of high-pressure circulations near Southeast Asia and Taiwan, enhancing the temperature increase. This mechanism has been reproduced in experiments using the Taiwan Earth System Model. Moreover, our study utilizes the calendar day 90th percentile of maximum temperature (CTX) as the threshold for extreme high-temperature events (EHT), while also employing the heatwaves magnitude scale (HWMS) as the criterion for defining heatwaves. During the positive phase of PMM, the frequency and duration of EHT increase, with variations observed across different regions. The overall intensity of heatwave events also strengthens, primarily due to extended durations. Notably, in a single city, this results in exposure of up to 800,000 person-days to EHT, presenting a tenfold increase compared to the annual effect observed in the long-term warming trend. These findings on the decadal-scale relationship between summer temperatures in Taiwan and PMM contribute to a deeper understanding of EHT and heatwaves events impacts, providing more nuanced insights for future regional strategies in mitigating heatwave disasters.

How to cite: Tsai, C.-T., Tseng, W.-L., and Wang, Y.-C.: Linkage between Temperature and Heatwaves in Summer Taiwan to the Pacific Meridional Mode, EGU General Assembly 2024, Vienna, Austria, 14–19 Apr 2024, EGU24-14379, https://doi.org/10.5194/egusphere-egu24-14379, 2024.

EGU24-14688 | ECS | Orals | CL4.3

Exploring ML-based decadal predictions of the German Bight storm surge climate 

Daniel Krieger, Sebastian Brune, Johanna Baehr, and Ralf Weisse

Storm surges and elevated water levels regularly challenge coastal protection and inland water management along the low-lying coastline of the German Bight. Skillful seasonal-to-decadal (S2D) predictions of the local storm surge climate would be beneficial to stakeholders and decision makers in the region. While storm activity has recently been shown to be skillfully predictable on a decadal timescale with a global earth system model, surge modelling usually requires very fine spatial and temporal resolutions that are not yet present in current earth system models. We therefore propose an alternative approach to generating S2D predictions of the storm surge climate by training a neural network on observed water levels and large-scale atmospheric patterns, and apply the neural network to the available model output of a S2D prediction system. We show that the neural-network-based translation from large-scale atmospheric fields to local water levels at the coast works sufficiently well, and that several windows of predictability for the German Bight surge climate emerge on the S2D scale.

How to cite: Krieger, D., Brune, S., Baehr, J., and Weisse, R.: Exploring ML-based decadal predictions of the German Bight storm surge climate, EGU General Assembly 2024, Vienna, Austria, 14–19 Apr 2024, EGU24-14688, https://doi.org/10.5194/egusphere-egu24-14688, 2024.

Atlantic meridional overturning circulation (AMOC) is one of the mechanisms for climate predictability and one of the properties that decadal climate predictions are attempting to predict. The starting point for AMOC decadal predictions is sensitive to the underlying data assimilation and/or initialization procedure. This means that different choices during the data assimilation procedure (e.g., assimilation method, assimilation window, data sources, resolution, nudging terms and strength, full field vs anomaly initialization/assimilation, etc) can result in a different mean and even variability of reconstructed ocean circulation. How coherent the AMOC initial states should be among the CMIP-like decadal prediction experiments? How good in general should the initial AMOC be for decadal predictions? And do initialization issues of the ocean circulation influence the prediction skill of other variables that are of interest for application studies? These are the questions that we were attempting to address in our study, where we analyzed twelve decadal prediction systems from the World Meteorological Organization Lead Centre for Annual-to-Decadal Climate Prediction project. We identify that the AMOC initialization influences the quality of predictions of the subpolar gyre (SPG). When predictions show a large initial error in their AMOC, they usually have low skill for predicting the internal variability of the SPG five years after the initialization.

How to cite: Polkova, I. and the Co-Authors: Initialization shock in the ocean circulation reduces skill in decadal predictions of the North Atlantic subpolar gyre, EGU General Assembly 2024, Vienna, Austria, 14–19 Apr 2024, EGU24-15358, https://doi.org/10.5194/egusphere-egu24-15358, 2024.

EGU24-15476 | Posters on site | CL4.3

Statistics of sudden stratospheric warmings using a large model ensemble 

Sarah Ineson, Nick Dunstone, Adam Scaife, Martin Andrews, Julia Lockwood, and Bo Pang

Using a large ensemble of initialised retrospective forecasts (hindcasts) from a seasonal prediction system, we explore various statistics relating to sudden stratospheric warmings (SSWs). Observations show that SSWs occur at a similar frequency during both El Niño and La Niña northern hemisphere winters. This is contrary to expectation, as the stronger stratospheric polar vortex associated with La Niña years might be expected to result in fewer of these extreme breakdowns. We show that this similar frequency may have occurred by chance due to the limited sample of years in the observational record. We also show that in these hindcasts, winters with two SSWs, a rare event in the observational record, on average have an increased surface impact. Multiple SSW events occur at a lower rate than expected if events were independent but somewhat surprisingly, our analysis also indicates a risk, albeit small, of winters with three or more SSWs, as yet an unseen event.

How to cite: Ineson, S., Dunstone, N., Scaife, A., Andrews, M., Lockwood, J., and Pang, B.: Statistics of sudden stratospheric warmings using a large model ensemble, EGU General Assembly 2024, Vienna, Austria, 14–19 Apr 2024, EGU24-15476, https://doi.org/10.5194/egusphere-egu24-15476, 2024.

EGU24-15709 | ECS | Orals | CL4.3

Predicting Atlantic and Benguela Niño events with deep learning  

Marie-Lou Bachelery, Julien Brajard, Massimiliano Patacchiola, and Noel Keenlyside

Extreme Atlantic and Benguela Niño events continue to significantly impact the tropical Atlantic region, with far-reaching consequences for African climate and ecosystems. Despite attempts to forecast these events using traditional seasonal forecasting systems, success remains low, reinforcing the growing idea that these events are unpredictable. To overcome the limitations of dynamical prediction systems, we introduce a deep learning-based statistical prediction model for Atlantic and Benguela Niño events. Our convolutional neural network (CNN) model, trained on 90 years of reanalysis data incorporating surface and 100m-averaged temperature variables, demonstrates the capability to forecast the Atlantic and Benguela Niño indices with lead times of up to 3-4 months. Notably, the CNN model excels in forecasting peak-season events with remarkable accuracy extending up to 5 months ahead. Gradient sensitivity analysis reveals the ability of the CNN model to exploit known physical precursors, particularly the connection to equatorial dynamics and the South Atlantic Anticyclone, for accurate predictions of Benguela Niño events. This study challenges the perception of the Tropical Atlantic as inherently unpredictable, underscoring the potential of deep learning to enhance our understanding and forecasting of critical climate events. 

How to cite: Bachelery, M.-L., Brajard, J., Patacchiola, M., and Keenlyside, N.: Predicting Atlantic and Benguela Niño events with deep learning , EGU General Assembly 2024, Vienna, Austria, 14–19 Apr 2024, EGU24-15709, https://doi.org/10.5194/egusphere-egu24-15709, 2024.

EGU24-15974 | ECS | Posters virtual | CL4.3

Recalibrating DWD’s operational climate predictions: towards a user-oriented seamless climate service 

Alexander Pasternack, Birgit Mannig, Andreas Paxian, Amelie Hoff, Klaus Pankatz, Philip Lorenz, and Barbara Früh

The German Meteorological Service's (Deutscher Wetterdienst DWD) climate predictions website  (www.dwd.de/climatepredictions) offers a centralized platform for accessing post-processed climate predictions, including subseasonal forecasts from ECMWF's IFS and seasonal and decadal predictions from the German climate prediction system. The website design was developed in collaboration with various sectors to ensure uniformity across all time frames, and users can view maps, tables, and time series of ensemble mean and probabilistic predictions in combination with their skill. The available data covers weekly, 3-month, 1-year, and 5-year temperature means, precipitation sums and soil moisture for the world, Europe, Germany, and particular German regions. To achieve high spatial resolution, the DWD used the statistical downscaling method EPISODES. Moreover, within the BMBF project KIMoDIs (AI-based monitoring, data management and information system for coupled forecasting and early warning of low groundwater levels and salinisation) the DWD provides climate prediction data of further hydrological variables (e.g. relative humidity) with corresponding prediction skill on a regional scale.

However, all predictions on these time scales can suffer from inherent systematic errors, which can impact their usefulness. To address these issues, the recalibration method DeFoReSt was applied to decadal predictions, using a combination of 3rd order polynomials in lead and start time, along with a boosting model selection approach. This approach addresses lead-time dependent systematic errors, such as drift, as well as inaccuracies in representing long-term changes and variability.

This study highlights the improved accuracy of the recalibration approach on decadal predictions due to an increased polynomial order compared to the original approach, and its different impact on global and regional scales. It also explores the feasibility of transferring this approach to predictions with shorter time horizons of the provided variables.

How to cite: Pasternack, A., Mannig, B., Paxian, A., Hoff, A., Pankatz, K., Lorenz, P., and Früh, B.: Recalibrating DWD’s operational climate predictions: towards a user-oriented seamless climate service, EGU General Assembly 2024, Vienna, Austria, 14–19 Apr 2024, EGU24-15974, https://doi.org/10.5194/egusphere-egu24-15974, 2024.

EGU24-16366 | ECS | Orals | CL4.3

Decadal predictions outperform projections in forecasting winter precipitation over the Mediterranean region 

Dario Nicolì, Silvio Gualdi, and Panos Athanasiadis

The Mediterranean region is highly sensitive to climate change, having experienced an intense warming and drying trend in recent decades, primarily due to the increased concentrations of anthropogenic greenhouse gases. In the context of decision-making processes, there is a growing interest in understanding the near-term climate evolution of this region.

In this study, we explore the climatic fluctuations of the Mediterranean region in the near-term range (up to 10 years ahead) using two different products: projections and decadal predictions. The former are century-scale climate change simulations initialized from arbitrary model states to which were applied anthropogenic and natural forcings. A major limitation of climate projections is their limited information regarding the current state of the Earth’s climate system. Decadal climate predictions, obtained by constraining the initial conditions of an ensemble of model simulations through a best estimate of the observed climate state, provide a better understanding of the next-decade climate and thus represent an invaluable tool in assisting climate adaptation.

Using retrospective forecasts from eight decadal prediction systems contributing to the CMIP6 Decadal Climate Prediction Project (CMIP6 DCPP) and the corresponding ensemble of non-initialized projections, we compare the capabilities of the state-of-the-art climate models in predicting future climate changes of the Mediterranean region for some key quantities so as to assess the added value of initialization. 

Beyond the contribution of external forcings, the role of internal variability is also investigated since part of the detected predictability arises from internal climate variability patterns affecting the Mediterranean. The observed North Atlantic Oscillation, the dominant climate variability pattern in the Euro-Atlantic domain, as well as its  impact on wintertime precipitation over Europe are well reproduced by decadal predictions, especially over the Mediterranean, outperforming projections. We also apply a sub-sampling method to enhance the respective signal-to-noise ratio and consequently improve precipitation skill over the Mediterranean.

How to cite: Nicolì, D., Gualdi, S., and Athanasiadis, P.: Decadal predictions outperform projections in forecasting winter precipitation over the Mediterranean region, EGU General Assembly 2024, Vienna, Austria, 14–19 Apr 2024, EGU24-16366, https://doi.org/10.5194/egusphere-egu24-16366, 2024.

EGU24-16985 | Posters on site | CL4.3

Investigating signals in summer seasonal forecasts over the North Atlantic/European region 

Julia Lockwood, Nick Dunstone, Kristina Fröhlich, Ramón Fuentes Franco, Anna Maidens, Adam Scaife, Doug Smith, and Hazel Thornton

The current generation of seasonal forecast models struggle to skilfully predict dynamical circulation over the North Atlantic and European region in boreal summer.  Using two different state-of-the-art seasonal prediction systems, we show that tropical rainfall anomalies drive a circulation signal in the North Atlantic/Europe via the propagation of Rossby waves.  The wave, however, is shifted eastwards compared to observations, so the signal does not contribute positively to model skill.  Reasons for the eastward shift of the Rossby wave are investigated, as well as other drivers of the signal in this region.  Despite the errors in the waves, the fact that seasonal forecast models do predict dynamical signals over the North Atlantic/Europe signifies seasonal predictability over this region beyond the climate change trend, and understaning the cause of the errors could lead to skilful predictions.

How to cite: Lockwood, J., Dunstone, N., Fröhlich, K., Fuentes Franco, R., Maidens, A., Scaife, A., Smith, D., and Thornton, H.: Investigating signals in summer seasonal forecasts over the North Atlantic/European region, EGU General Assembly 2024, Vienna, Austria, 14–19 Apr 2024, EGU24-16985, https://doi.org/10.5194/egusphere-egu24-16985, 2024.

EGU24-17418 | Posters on site | CL4.3

Strengthening seasonal forecasting in the Middle East & North Africa (MENA) through the WISER Programme. 

Stefan Lines, Nicholas Savage, Rebecca Parfitt, Andrew Colman, Alex Chamberlain-Clay, Luke Norris, Heidi Howard, and Helen Ticehurst

In this presentation, we introduce the WISER MENA projects SeaFOAM (Seasonal Forecasting Across MENA) and SeaSCAPE (Seasonal Co-Production and Application in MENA). These projects explore both the improvement to the regional-level seasonal forecast in the MENA region, as well as how to tailor the information in ways useful to a range of climate information stakeholders. SeaFOAM works alongside Maroc Meteo, Morocco's National Meteorological and Hydrological Service (NMHS) and the Long Range Forecasting node of the Northern Africa WMO Regional Climate Centre (RCC), to develop a framework for objective seasonal forecasting. This approach will blend techniques such as bias correction via local linear regression and canonical correlation analysis (CCA), with skill-assessed sub-selected models, to improve forecasting accuracy. Multiple drivers of rainfall variability, including the North Atlantic Oscillation (NAO) and Mediterranean Oscillation (MO), are investigated for their calibration potential. SeaSCAPE works with the WMO and various partners across MENA to understand the use of seasonal information in multiple sectors, exploring existing gaps and needs. Through stakeholder engagement workshops, training and bespoke support for the Arab Climate Outlook Forum (ArabCOF), SeaSCAPE operates collaboratively to tailor regional and national-level climate information to improve accessibility and usability of climate information on seasonal timescales.

How to cite: Lines, S., Savage, N., Parfitt, R., Colman, A., Chamberlain-Clay, A., Norris, L., Howard, H., and Ticehurst, H.: Strengthening seasonal forecasting in the Middle East & North Africa (MENA) through the WISER Programme., EGU General Assembly 2024, Vienna, Austria, 14–19 Apr 2024, EGU24-17418, https://doi.org/10.5194/egusphere-egu24-17418, 2024.

EGU24-17585 | Orals | CL4.3

Skill of wind resource forecasts on the decadal time scale 

Kai Lochbihler, Ana Lopez, and Gil Lizcano

Accurate forecasts of the natural resources of renewable energy production have become not only a valuable but a crucial tool for managing the associated risks of specific events, such as wind droughts. Wind energy, alongside with solar power, now provide a substantial part to the renewable energy share of the global energy production and growth in this sector will most likely further increase. The naturally given fluctuations of wind resources, however, pose a challenge for maintaining a stable energy supply, which, at the end of the chain, can have an impact on the energy market prices.
Operational short-term forecasting products for the wind energy sector (multiple days) are already commonly available and seasonal to sub seasonal forecasting solutions (multiple months) can provide valuable skill and are gaining in popularity. On the other side of the spectrum, typically on a time scale of multiple decades, we find risk assessment based on climate change projections. In between the long and short term time scales, however, there is a gap that still needs to be filled to achieve seamless prediction of risks that are relevant for the energy sector: decadal predictions.

Here, we present the results of an evaluation study of a multi-model decadal prediction ensemble (DCPP) for a selection of wind development regions in Europe. The evaluation is based on multiple decades long hindcasts and carried out with a focus on the skill of predicting specific event types of wind resource availability in a probabilistic context, alongside with basic deterministic skill measures. We further investigate specific event constellations and their large-scale drivers that, in combination, can provide windows of opportunity with enhanced predictive skill. We conclude with a discussion on how this hybrid approach can be used to potentially increase not only forecast skill but also the trust of the end user.

How to cite: Lochbihler, K., Lopez, A., and Lizcano, G.: Skill of wind resource forecasts on the decadal time scale, EGU General Assembly 2024, Vienna, Austria, 14–19 Apr 2024, EGU24-17585, https://doi.org/10.5194/egusphere-egu24-17585, 2024.

EGU24-19229 | ECS | Orals | CL4.3

Comparing the seasonal predictability of Tropical Pacific variability in EC-Earth3 at two different horizontal resolutions 

Aude Carreric, Pablo Ortega, Vladimir Lapin, and Francisco Doblas-Reyes

Seasonal prediction is a field of research attracting growing interest beyond the scientific community due to its strong potential to guide decision-making in many sectors (e.g. agriculture and food security, health, energy production, water management, disaster risk reduction) in the face of the pressing dangers of climate change.

Among the various techniques being considered to improve the predictive skill of seasonal prediction systems, increasing the horizontal resolution of GCMs is a promising avenue. There are several indications that higher resolution versions of the current generation of climate models might improve key air-sea teleconnections, decreasing common biases of global models and improving the skill to predict certain regions at seasonal scales, e.g. in tropical sea surface temperature.

In this study, we analyze the differences in the predictive skill of two different seasonal prediction systems, based on the same climate model EC-Earth3 and initialized in the same way but using two different horizontal resolutions. The standard (SR) and high resolution (HR) configurations are based on an atmospheric component, IFS, of ~100 km and ~40 km of resolution respectively and on an ocean component, NEMO3.6, of ~100 km and ~25 km respectively. We focus in particular on the Tropical Pacific region where statistically significant improvements are found in HR with respect to SR for predicting ENSO and its associated climate teleconnections. We explore some processes that can explain these differences, such as the simulation of the tropical ocean mean state and atmospheric teleconnections between the Atlantic and Pacific tropical oceans. 

A weaker mean-state bias in the HR configuration, with less westward extension of ENSO-related SST anomalies, leads to better skill in ENSO regions, which can also be linked to better localization of the atmospheric teleconnection with the equatorial Atlantic Ocean. It remains to be assessed if similar improvements are consistently identified for HR versions in other forecast systems, which would prompt their routine use in seasonal climate prediction.

How to cite: Carreric, A., Ortega, P., Lapin, V., and Doblas-Reyes, F.: Comparing the seasonal predictability of Tropical Pacific variability in EC-Earth3 at two different horizontal resolutions, EGU General Assembly 2024, Vienna, Austria, 14–19 Apr 2024, EGU24-19229, https://doi.org/10.5194/egusphere-egu24-19229, 2024.

EGU24-19251 | Orals | CL4.3 | Highlight

The opportunities and challenges of near-term climate prediction 

Hazel Thornton

Accurate forecasts of the climate of the coming season and years are highly desired by many sectors of society. The skill of near-term climate prediction in winter in the North Atlantic and European region has improved over the last decade associated with larger ensembles, improving models and boosting of the prediction signal using intelligent post processing. International collaboration has improved the availability of forecasts and promoted the uptake of forecasts by different sectors. However, significant challenges remain, including summer prediction, understanding the risk of extremes within a season, multi-seasonal extremes and how best to post process the forecasts to aid decision making. This talk will summarise recent near-term climate prediction research activities at the UK Met Office and will detail our experience of providing such forecasts to the energy and water sectors.  

How to cite: Thornton, H.: The opportunities and challenges of near-term climate prediction, EGU General Assembly 2024, Vienna, Austria, 14–19 Apr 2024, EGU24-19251, https://doi.org/10.5194/egusphere-egu24-19251, 2024.

This study focuses on applying machine learning techniques to bias-correct the seasonal temperature forecasts provided by the Copernicus Climate Change Service (C3S) models. Specifically, we employ bias correction on forecasts from five major models: UK Meteorological Office (UKMO), Euro-Mediterranean Center on Climate Change (CMCC), Deutscher Wetterdienst (DWD), Environment and Climate Change Canada (ECCC), and Meteo-France. Our primary objective is to assess the performance of our bias correction model in comparison to the original forecast datasets. We utilise temperature-based indices recommended by the Expert Team on Climate Change Detection and Indices (ETCCDI) to evaluate the effectiveness of the bias-corrected seasonal forecasts. These indices served as valuable metrics to gauge the predictive capability of the models, especially in forecasting natural cascading hazards such as wildfires, droughts, and floods. The study involved an in-depth analysis of the bias-corrected forecasts, and the derived indices were crucial in understanding the models' ability to predict temperature-related extreme events. The results of this research contribute valuable information for decision-making and planning across various sectors, including disaster risk management and environmental protection. Through a comprehensive evaluation of machine learning-based bias correction techniques, we enhance the accuracy and applicability of seasonal temperature forecasts, thereby improving preparedness and resilience to climate-related challenges. 

How to cite: Mbuvha, R. and Nikraftar, Z.: Machine Learning Approaches to Improve Accuracy in Extreme Seasonal Temperature Forecasts: A Multi-Model Assessment , EGU General Assembly 2024, Vienna, Austria, 14–19 Apr 2024, EGU24-19297, https://doi.org/10.5194/egusphere-egu24-19297, 2024.

EGU24-19359 | ECS | Posters on site | CL4.3

Seasonal forecast of the late boreal winter temperature based on solar forcing and QBO 

Mikhail Vokhmianin, Antti Salminen, Kalevi Mursula, and Timo Asikainen

The ground temperature variability in the Northern Hemisphere winter is greatly influenced by the state of the polar vortex. When the vortex collapses during sudden stratospheric warmings (SSWs), rapid changes in stratospheric circulations propagate downward to the troposphere in the subsequent weeks. The ground effect following SSWs is typically manifested as the negative phase of the North Atlantic Oscillation. Our findings reveal a higher frequency of cold temperature anomalies in the Northern part of Eurasia during winters with SSWs, and conversely, warm anomalies in winters with a strong and stable vortex. This behavior is particularly evident when temperature anomalies are categorized into three equal subgroups, or terciles. Recently, we developed a statistical model that successfully predicts SSW occurrences with an 86% accuracy rate. The model utilizes the stratospheric Quasi-Biennial Oscillation (QBO) phase and two parameters associated with solar activity: the geomagnetic aa-index as a proxy for energetic particle precipitations and solar irradiance. In this study, we explore the model's potential to provide a seasonal forecast for ground temperatures. We assess the probabilities of regional temperature anomalies falling into the lowest or highest terciles based on the predicted weak or strong vortex state. Additionally, we demonstrate that the QBO phase further enhances the forecast quality. As the model provides SSW predictions as early as preceding August, our results carry significant societal relevance as well, e.g., for the energy sector, which is highly dependent on prevailing weather conditions.

How to cite: Vokhmianin, M., Salminen, A., Mursula, K., and Asikainen, T.: Seasonal forecast of the late boreal winter temperature based on solar forcing and QBO, EGU General Assembly 2024, Vienna, Austria, 14–19 Apr 2024, EGU24-19359, https://doi.org/10.5194/egusphere-egu24-19359, 2024.

It is expected that sea level rise and resulting coastal flooding will cost us over 1 trillion dollars annually by 2050. Therefore, understanding and monitoring coastal sea level rise is vital. Tide Gauges are in-situ instruments that have been providing sea level measurements since the 1800s, but they are sparse, and data availability is limited. Therefore, ocean altimetry has been the preferred observational tool for monitoring global sea levels.  

Satellite altimetry has been providing extensive and continuous global sea level data for more than three decades now. However, extracting reliable data close to the coast has been problematic due to signal contamination from land or calm water and lack of accurate geophysical corrections. Recently dedicated coastal altimetry products were proposed to provide better coastal sea level change product.   

In this study, we compare coastal altimetry products XTRACK-1Hz, XTRACK/ALES-20Hz in observing Sea Level Anomalies (SLA) with Tide Gauges (TG) along the global coastline from 2002-2019. 458 stations were selected for the study after applying several selection criteria that address data gaps, data availability from TG, altimetry, and correction products. The SLA signals from TG were decomposed into non-linear trend, seasonal, and residual components using Seasonal-Trend Decomposition using Loess (STL) method. The correlation coefficient, Root Mean Square Error (RMSE), and Index of Agreement (IOA) were computed for interannual and residual signals from TG and coastal altimetry products. Linear sea level trends at each station were also estimated from altimetry and TG observations after correcting for GPS-derived vertical land motion (VLM). 

When using altimetry for sea level signals near the coast, it is important to select point observations carefully instead of using a search radius that may take points from adjacent regions that could behave differently due to different coastal ocean processes. We developed a dynamically varying search radius for each TG, a function of the coastal shelf width near that station, to collate satellite observations as a representative of coastal sea level change. All the altimetry observations that fall within the search radius and are less than 25 km along the coast are used for comparison. In several cases, due to the sharp changes in the coastal morphology, the sea level signals seen by the adjacent TG stations are quite different, and thus, the reliability of altimetry suffered. 

With our analysis approach, we found good agreement between all altimetry products (XTRACK, XTRACK/ALES), and TG at residual and non-linear trend scales. A few stations near the fault lines and other tectonic regions disagree with altimetry trend estimates due to strong VLM signals that are not completely resolved by the VLM product used for correction. Around 70% of stations had a good agreement (r > 0.7) with trend and 55% with residual components. High-resolution (20Hz) XTRACK/ALES provided more observations near the coast. Nevertheless, both XTRACK/ALES-20Hz and XTRACK-1Hz performed well. This novel approach to select representative observation points from altimetry for a coastal zone will provide improved coastal sea level products from satellites, which can be considered at par with TG observations. 

How to cite: Sukumaran, V. and Vishwakarma, B. D.: Comparing altimetry-derived coastal sea level anomaly with tide gauge observations along the global coastline by accounting for shelf-width , EGU General Assembly 2024, Vienna, Austria, 14–19 Apr 2024, EGU24-1007, https://doi.org/10.5194/egusphere-egu24-1007, 2024.

Worldwide geological markers of former sea-level (SL), such as wave-cut benches (raised, drowned), reveal a ~3-metre(m) SL rise, loosely carbon-dated post-50AD/pre-600. This "Rottnest Transgression" is the youngest of several m-scale rises, interspersed with m-scale falls, on Fairbridge's (1961) global-compilation Holocene-interglacial SL curve.

Copious British archaeological evidence (email me for sources), far better-dated (pottery-sherds/dendrochronology/Roman coins), confirms the Rottnest ("Romano-British marine transgression" of Godwin 1955), verifies its amplitude (~3m), and shows it spanned only ~70 years(y), ~430-500AD (early Dark Ages; Romans abandoned Britain 410AD). (An equally fast global SL rise, ~3m in decades, is proven by last-interglacial reef-facies relationships in tectonically stable Yucatan.) The Rottnest explains 5th-Century(C) mass-migration, underway by 450AD (dendro/artefacts/skeletal-DNA), of Saxon- and Angle civilians to SE Britain ('pre-subjugated' by rebellious Saxon mercenaries by 441AD), their North-Sea-coastal-plain homelands intolerably 'squeezed' between west-advancing Huns and rapid eastward shore-retreat. Among other British evidence: (1) Pevensey sea-fort (Roman-built ~290AD) straddles a promontory pointing NE into Pevensey Levels (reclaimed former tidal-flat embayment, beside English Channel). Indicating that high-spring-tide-level (HSTL) rose >2m in the 5thC, a defensive-ditch fronting the fort's SW gate contains "tidal" mud, dated early-5thC (sherds), whose top is ~1m higher than the NW-wall foundation and <0.5m higher than the SE foundation. This explains wall-collapse in both sectors (outward-toppled slabs visible on GoogleEarth), undermined by waves/currents, no later than mid-or-late 5thC (age of Early-Saxon-style sherd in sediment draping excavated wall-stump). Subsequent HSTL fall enabled William the Conqueror's 1066AD disembarkation at Pevensey fort; (2) excavated remnant stumps of Londinium's Thames-estuary-side city-wall (~270-300AD), up to 2.5m tall, show their entire outer face eroded (wall thinned ~50%), implying HSTL rose 3+m post-construction. Confirming this rise and its likely 5thC timing, across the Thames (Southwark) a peat layer containing 4thC sherds is capped by 2.8m of barren "river clay", reaching 3.2m higher than Londinium's lowest-known Thames-side wall-foundation. Proving HSTL soon fell 2+m, 1km upstream, in Lundenwic (Saxon port founded late-5thC), a building-floor dated ~700-750AD (sherds) is 1.6m lower than Londinium's highest-known wall erosion, and 1.5m below the top of the river-clay.

Such a large/fast global SL rise implies a peri-Antarctic 'MICI' ice-cliff-collapse event (Greenland lacks requisite >1km-deep grounding-line). Regarding causation, the Rottnest rise began (~430AD) only ~25y after the ~405AD warmest Arctic temperature-spike of the period 1-2000AD. This spike followed ~100y after the Sun's 310AD strongest magnetic-grand-maximum (MGM) peak of the interval 1-1885AD. The ~100y lag is attributable to ocean-thermal-inertia. The additional ~25y lag in SL response (Rottnest start) may reflect AMOC 'conveyor-belt' oceanic-circulation, specifically the time needed for ocean-surface-water, 'overwarmed' by the MGM (Svensmark effect, reduced cloudiness), to down-well in the north-Atlantic (Arctic fringe), then travel south, then up-well and encircle Antarctica, unleashing ice-collapse. The resulting iceberg-armada would cool the ocean, hence the atmosphere, causing increased global snowfall (ice build-up), intrinsically lowering SL.

Due to anthropogenic warming, the Arctic's average-surface-air-temperature exceeds, since 2005, the 405AD peak. This portends another rapid, metre-scale SL rise, beginning ~2030 (25y lag, above). Before 2100 the time-lagged effect of the Sun's even-stronger 1991 MGM peak will exacerbate warming.

How to cite: Higgs, R.: British archaeology verifies 5th-Century rapid multi-metre sea-level rise and portends another before 2100, EGU General Assembly 2024, Vienna, Austria, 14–19 Apr 2024, EGU24-1322, https://doi.org/10.5194/egusphere-egu24-1322, 2024.

Sea level in the Southeast Asia (SEA) seas is driven by various phenomena at global,  regional and local scales. The latest tide gauge and satellite data revealed its most recent spatial and temporal patterns. The trend of global sea level rise in Singapore region is hindered by dominant variability of El Niño-Southern Oscillation (ENSO), Pacific Decadal Oscillation (PDO), and Indian Ocean Dipole (IOD), as well as associated modulation of Asian Monsoon. It was confirmed that positive sea-level anomalies in the southern and western areas of Southeast Asia seas were significantly high (~10 cm) during the northeast monsoon, especially in the Gulf of Thailand (~25 cm). The sea level trends for these regions were basically reversed during the southwest monsoon but with a smaller magnitude of negative sea-level anomalies. The regional sea-level trend in the Sunda Shelf differed from region to region, with the rates varied greatly from 1.4 to more than 4.8 mm/year. Interestingly, the rates on the east-western side of the region were roughly 3.0-4.5 mm/year, which were higher than the ones at other regions, being 2.5-3.5 mm/year. The presentation discuss the causes and consequences of sea level rise and variability in SEA and Singapore region in particular.

This Research is supported by Singapore’s National Research Foundation and National Environment Agency under the National Sea Level Programme Funding Initiative (Award No. USS-IF-2020-4).

How to cite: Tkalich, P. and Luu, Q.-H.: Recent Sea Level Rise and Variability in Singapore Region Derived from Tide Gauges and Satellite Altimetry, EGU General Assembly 2024, Vienna, Austria, 14–19 Apr 2024, EGU24-2288, https://doi.org/10.5194/egusphere-egu24-2288, 2024.

Dynamical downscaling employing high-resolution ocean models is widely considered as an efficient approach for modelling of regional ocean dynamics and sea-level changes using output of original coarse-resolution global general circulation models (GCMs). In this study, the historical dynamic variability and trends of sea level in the South China Sea (SCS) and the Southeast Asia Seas (SEAS) are investigated using the high-resolution regional ocean model (NEMO). Two hindcast ocean modelling experiments are conducted for the period 1960-2014. One is driven by global reanalysis data (ERA5 and ORAS5) forcings at the lateral and surface boundaries. The other is driven by global modelling oceanic data (EC-EARTH3) at the lateral boundary and by WRF-based downscaled atmospheric fields from the same parent model (EC-Earth3) at the surface boundary. Using the hindcast model runs, variability and trends of low-frequency sea-levels, as well as the driving mechanisms and the related processes are discussed, and the model performance and biases are analysed.

This Research is supported by Singapore’s National Research Foundation and National Environment Agency under the National Sea Level Programme Funding Initiative (Award No. USS-IF-2020-4).

How to cite: Ma, P., Gangadharan, N., and Tkalich, P.: Modelling of Low Frequency Sea Level Variability Over the Maritime Continent: Historical Dynamic Variability and Changes, EGU General Assembly 2024, Vienna, Austria, 14–19 Apr 2024, EGU24-2405, https://doi.org/10.5194/egusphere-egu24-2405, 2024.

EGU24-3440 | ECS | Orals | CL4.9

Quantifying the impact of near-surface winds on the occurrence of extreme sea level rises along the Swedish Baltic coastline: A statistical analysis 

Lorenzo Minola, Alice Re, Shalenys Bedoya-Valestt, Corrado Motta, Cesar Azorin-Molina, Alessandro Pezzoli, and Deliang Chen

Sea level rises pose significant risks to densely populated coastal regions, threatening human lives and vital infrastructures. Coastal societies, economies, and properties face acute vulnerability from saltwater intrusion, coastal erosion, and flooding resulting from extreme sea level variations. These occurrences are a confluence of factors, including local sea level rises, tidal changes, storm surges, waves, and shifts in coastal morphology.

In the Baltic Sea basin, where tides and North Atlantic storm surges are mitigated by the Danish Straits due to its semi-enclosed nature, coastal extreme sea levels are primarily driven by storm surges propelled by atmospheric pressure and surface winds from extratropical cyclones. Consequently, the surge in extreme sea levels here is predominantly wind-induced, regulated by meteorological processes.

This research focuses on the meteorological conditions, specifically wind patterns, that contribute to sudden sea level rises along the Swedish Baltic coastline. By integrating observations and model data like the ERA5 reanalysis, the study correlates the rapid increase in relative sea levels across 14 tide-gauge stations with wind and wave data. The aim is to exclusively utilize meteorological information for identifying extreme sea level occurrences, thereby enhancing the prediction of such events through weather forecasting.

How to cite: Minola, L., Re, A., Bedoya-Valestt, S., Motta, C., Azorin-Molina, C., Pezzoli, A., and Chen, D.: Quantifying the impact of near-surface winds on the occurrence of extreme sea level rises along the Swedish Baltic coastline: A statistical analysis, EGU General Assembly 2024, Vienna, Austria, 14–19 Apr 2024, EGU24-3440, https://doi.org/10.5194/egusphere-egu24-3440, 2024.

EGU24-3445 | ECS | Posters on site | CL4.9

Are multi-decadal sea-level oscillations augmenting rates of mean sea level? 

Erin Robson, Luke Jackson, and Sophie Williams

There is evidence to show sea-level change is accelerating, with a departure from Holocene rates in the late-19th century, to more than a doubling of the rate of global mean sea-level change over the past 25-years. Although the effect of anthropogenic forcing on sea level is certain, the influence of natural internal variability on augmenting rates of change remains an important area of research. This is especially significant at ocean-climate response timescales (>30-years). Using tide-gauge data, we apply empirical mode decomposition (EMD) to separate both the global and regional sea-level records into a series of intrinsic mode functions (IMFs) that are quasi-periodic in character. From them, we identify the dominant modes of variability that are common to each ocean basin, and compare these to recognised modes of climate variability to determine the causal factors of sea-level oscillations. We also conduct a sensitivity analysis with sub-sampled tide-gauge data to test the feasibility of this approach with high-resolution proxy-based sea-level reconstructions.

How to cite: Robson, E., Jackson, L., and Williams, S.: Are multi-decadal sea-level oscillations augmenting rates of mean sea level?, EGU General Assembly 2024, Vienna, Austria, 14–19 Apr 2024, EGU24-3445, https://doi.org/10.5194/egusphere-egu24-3445, 2024.

EGU24-3503 | Orals | CL4.9 | Highlight

Improving, evaluating and sharing projections of global mean sea level rise 

Tamsin Edwards, Fiona Turner, and Victor Malagon Santos and the EU PROTECT project
Projections of the ice sheet and glacier contributions to sea level rise to 2100 in the Intergovernmental Panel on Climate Change (IPCC) Sixth Assessment Report were made by representing physical models with statistical "emulators" or machine learning techniqes (Edwards et al., 2021). This allowed estimation of the impacts of several kinds of model uncertainty on sea level projections: multiple models for the ice sheets and glaciers, multiple settings determining ice sheet sensitivity to climate change, and multiple estimates of global warming, as well as uncertainty from the emulators themselves.
 
However, there were some limitations, including: predicting each year of the century independently (i.e. not providing smooth timeseries or the possibility to assess rates of change), beginning physical model simulations in 2015 (not allowing evaluation with observations), and exploring a small number of possible model settings. Projections beyond 2100 also had to be estimated for the IPCC with other methods. These limitations presented difficulties for users.
 
We improve on these projections here in their usefulness and robustness for coastal impacts communities and decision-makers. Usefulness: by predicting ice sheet and glacier changes to 2300, not 2100; providing smooth timeseries; and incorporating the emulators into the community FACTS sea level calculation framework (Kopp et al., 2023) for use by others. Robustness: by systematically exploring many more model settings than before (including, for the first time, those for glacier models), and beginning in the past to allow calibration of the projections with observations. The result is more meaningful trajectories of sea level contribution from each land ice source, in which we have greater confidence. We combine these in FACTS with estimates of thermal expansion and land water changes to show new projections of global mean sea level rise. This work was carried out by the EU Horizon 2020 project PROTECT.
 
References:
 
Edwards et al. (2021) Projected land ice contributions to twenty-first-century sea level rise, Nature, 593, 74–82.
 
Kopp et al. (2023) The Framework for Assessing Changes To Sea-level (FACTS) v1.0: a platform for characterizing parametric and structural uncertainty in future global, relative, and extreme sea-level change, Geosci. Model Dev., 16, 7461–7489. 
 

How to cite: Edwards, T., Turner, F., and Malagon Santos, V. and the EU PROTECT project: Improving, evaluating and sharing projections of global mean sea level rise, EGU General Assembly 2024, Vienna, Austria, 14–19 Apr 2024, EGU24-3503, https://doi.org/10.5194/egusphere-egu24-3503, 2024.

EGU24-4335 | ECS | Orals | CL4.9

Uncertainties in the projection of dynamic sea level in CMIP6 and FGOALS-g3 large ensemble 

Chenyang Jin, Hailong Liu, Pengfei Lin, and Yiwen Li

Decision-makers need reliable projections of future sea level change for risk assessment. Untangling the sources of uncertainty in sea level projections will help narrow the projection uncertainty. Here, we separate and quantify the contributions of internal variability, intermodel uncertainty, and scenario uncertainty to the ensemble spread of dynamic sea level (DSL) at both the basin and regional scales using Coupled Model Intercomparison Project Phase 6 (CMIP6) and FGOALS-g3 large ensemble (LEN) data. For basin-mean DSL projections, intermodel uncertainty is the dominant contributor (>55%) in the near- (2021-2040), mid- (2041-2060), and long-term (2081-2100) relative to the climatology of 1995-2014.  Internal variability is of secondary importance in the near- and mid-term until scenario uncertainty exceeds it in all basins except the Indian Ocean in the long-term. For regional-scale DSL projections, internal variability is the dominant contributor (60~100%) in the Pacific Ocean, Indian Ocean and western boundary of the Atlantic Ocean, while intermodel uncertainty is more important in other regions in the near-term. The contribution of internal variability (intermodel uncertainty) decreases (increases) in most regions from mid-term to long-term. Scenario uncertainty becomes important after emerging in the Southern, Pacific, and Atlantic oceans. The signal-to-noise (S/N) ratio maps for regional DSL projections show that anthropogenic DSL signals can only emerge from a few regions. Assuming that model differences are eliminated, the perfect CMIP6 ensemble can capture more anthropogenic regional DSL signals in advance. These findings will help establish future constraints on DSL projections and further improve the next generation of climate models.

How to cite: Jin, C., Liu, H., Lin, P., and Li, Y.: Uncertainties in the projection of dynamic sea level in CMIP6 and FGOALS-g3 large ensemble, EGU General Assembly 2024, Vienna, Austria, 14–19 Apr 2024, EGU24-4335, https://doi.org/10.5194/egusphere-egu24-4335, 2024.

EGU24-5010 | ECS | Orals | CL4.9

Mid Holocene relative sea-level changes from coral microatolls of Pulau Biola, Singapore  

Jennifer Quye-Sawyer, Jing Ying Yeo, Wan Lin Neo, Zihan Aw, Lin Thu Aung, Nurul Syafiqah Tan, Junki Komori, Ke Lin, Xianfeng Wang, and Aron J. Meltzner

Coral microatolls are precise proxies of relative sea-level (RSL) change in low-latitude coastal regions. These coral colonies live in the intertidal zone where partial mortality due to low-water events produces a characteristic planform ring structure. Since ring elevations reflect changes in local RSL during a coral’s lifetime, we can use the surface profiles of microatolls to quantify short-term (decadal) rates of RSL change. Therefore, Holocene fossil microatolls can produce sea-level index points (SLIPs) with relatively high spatial and temporal resolution. In this study, we present preliminary sea-level reconstructions from Pulau Biola (Violin Island), Singapore, based upon several Porites sp. and Diploastrea heliopora fossil microatolls. We calculated the difference in elevation between the fossils and local living microatolls of the same genus to quantify the magnitude of past water level. We also combined U-Th ages, structure-from-motion photogrammetry and LiDAR 3D models, and survey data to generate a RSL history spanning more than two centuries in the mid Holocene. The highest-elevation fossil microatolls at Pulau Biola are consistent with an overall rise in sea level, from 0.2 to 0.7 m above present, between 7.7 and 7.4 kyr BP. In addition, decimetre-scale sea-level fluctuations during this period are inferred from decreasing and increasing ring elevations within corals. These fluctuations indicate a more complex sea-level history than resolved by other proxies or glacial isostatic adjustment models, and ongoing work aims to reconcile conflicting Holocene sea-level models and datasets in the Singapore region.

How to cite: Quye-Sawyer, J., Yeo, J. Y., Neo, W. L., Aw, Z., Aung, L. T., Tan, N. S., Komori, J., Lin, K., Wang, X., and Meltzner, A. J.: Mid Holocene relative sea-level changes from coral microatolls of Pulau Biola, Singapore , EGU General Assembly 2024, Vienna, Austria, 14–19 Apr 2024, EGU24-5010, https://doi.org/10.5194/egusphere-egu24-5010, 2024.

Southern Hemisphere observational records of sea-level change are rare prior to ~1950, making it difficult to close historical regional sea-level budgets and quantify individual contributions to sea level (e.g. barystatic, thermosteric). Recent work generated four microfossil-based high-resolution sea-level reconstructions from southeastern Australia, all of which indicated rapid regional rates of 20th century sea-level rise compared to the global average. However, unlike analogous work in the North Atlantic (for which there is a high-density network of high-resolution reconstructions), there remains a paucity of proxy data from the Southern Hemisphere, hindering a probabilistic estimate of regional drivers of relative sea level using a spatio-temporal model.

We generate two new reconstructions using salt-marsh foraminifera from King Island, Tasmania, and Venus Bay, Victoria, to add to a growing database of Common Era sea-level reconstructions from southeastern Australia (and indeed wider Australasia). Fossil foraminifera indicate a rising palaeomarsh over the last ~150 years of ~0.15-0.25 m (average); this is interpreted as relative sea-level rise consistent with patterns observed in recent reconstructions. A chronology for the core is developed using both 14C and lead isotopes. Ongoing efforts to supplement the regional database will allow us to determine local and regional drivers of relative sea-level change in the region.

How to cite: Williams, S., Carvalho, R., Perry, P., Reef, R., and Sefton, J.: Drivers of Common Era sea-level change in southeastern Australia: extending tide-gauge records and developing a network of high-resolution reconstructions for regional analyses., EGU General Assembly 2024, Vienna, Austria, 14–19 Apr 2024, EGU24-5258, https://doi.org/10.5194/egusphere-egu24-5258, 2024.

EGU24-6564 | Orals | CL4.9

Emulating Thermosteric Sea-Level Rise Using a Three-Layer Energy Balance Model 

Víctor Malagón-Santos, Aimée Slangen, Tim Hermans, Tamsin Edwards, and Fiona Turner

Although the mass loss of land ice is projected to be the largest contribution to sea-level rise in the coming centuries, thermal expansion will also be an important contributor and its accurate projection is primordial to understanding sea-level change over (multi-)centennial timescales. Earth System Models (ESMs) are the main tools for projecting thermosteric sea-level rise. ESMs, however, are computationally demanding and therefore long, multi-centennial simulations are challenging. In this study, we use a physical-based emulator that simplifies the climate system by using three vertically stacked layers, allowing us to mimic the energy balance response of ESMs to reproduce their thermal expansion simulations. We use this emulator to extrapolate simulations from the Coupled Model Intercomparison Project Phase 6 (CMIP6) from 2100 to 2300 and validate our method with CMIP6 runs that are available over that time scale. Overall, the three-layer emulator outperforms its two-layer predecessor in simulating thermal expansion up to 2300, providing a reduction of up to 78% in cumulative error for the projection period covering 2100 to 2300. Finally, we demonstrate how using temperature output from the three-layer model can help us capture non-linearities in dynamic sea-level change better than its two-layer counterpart. The latter is a first step towards building more reliable emulation approaches for oceanic processes affecting regional sea-level change.

How to cite: Malagón-Santos, V., Slangen, A., Hermans, T., Edwards, T., and Turner, F.: Emulating Thermosteric Sea-Level Rise Using a Three-Layer Energy Balance Model, EGU General Assembly 2024, Vienna, Austria, 14–19 Apr 2024, EGU24-6564, https://doi.org/10.5194/egusphere-egu24-6564, 2024.

EGU24-6921 | Posters on site | CL4.9

Modelling dependence between the ice-sheet components of sea-level rise 

Benjamin S. Grandey, Justin Dauwels, Svetlana Jevrejeva, Antony J. Payne, Zhi Yang Koh, Benjamin P. Horton, and Lock Yue Chew

Sea-level projections are sensitive to statistical dependence between the East Antarctic, West Antarctic, and Greenland ice-sheet components.  The dependence is produced by climate uncertainty and ice-sheet process uncertainty.  To investigate this dependence, we model the dependence using copulas.  We use a vine copula to couple the ice-sheet components of projected sea level in 2100 under the SSP5-8.5 scenario.  Assumptions about rank correlation and copula family influence both the centre and the tails of the total ice-sheet contribution.  For example, rank correlation can influence the 95th percentile by approximately 50%.  We explore three alternative approaches for specifying the dependence: shared dependence on global-mean surface temperature, dependence derived from ice-sheet model ensembles, and dependence derived from expert judgement.  Shared dependence on global-mean surface temperature produces little dependence between the ice-sheet components.  In contrast, ice-sheet model ensembles suggest that the dependence between the East and West Antarctic ice-sheet components may be strong, amplifying the uncertainty in future sea-level rise.

How to cite: Grandey, B. S., Dauwels, J., Jevrejeva, S., Payne, A. J., Koh, Z. Y., Horton, B. P., and Chew, L. Y.: Modelling dependence between the ice-sheet components of sea-level rise, EGU General Assembly 2024, Vienna, Austria, 14–19 Apr 2024, EGU24-6921, https://doi.org/10.5194/egusphere-egu24-6921, 2024.

EGU24-7891 | Orals | CL4.9

Revisiting the relation between ocean heat storage and thermal expansion from a water mass perspective 

Robin Waldman, Benoît Meyssignac, Sébastien Fourest, Robin Guillaume-Castel, Karina von Schuckmann, and Jean-Baptiste Sallée

The excess anthropogenic ocean heat is causing thermal expansion, which has driven approximately 40% of the industrial-era global mean sea level rise. This relation between ocean heat uptake H and thermosteric sea level rise hθ is mediated by the so-called expansion efficiency of heat (EEH=hθ/H, in m/YJ) which characterises the expansion of a water-mass under a unit increase of its enthalpy. The EEH of a water-mass depends on its temperature, salinity and pressure. At global scale the EEH has been characterized in both historical observations and climate simulations, but the the role of regional EEH and of individual water-mass layers in the formation of this global expansion efficiency remains undocumented. Here we propose a new approach where the EEH is decomposed in temperature coordinate into a temperature plus a pressure contribution to seawater thermal expansion. We show that the temperature contribution largely dominates the global signal. We also show that the global EEH can be interpreted as a weighted global average thermal expansion coefficient.

We make use of the global EEH decomposition in temperature coordinate to estimate the contribution of individual water-mass layers to global thermal expansion in both historical reference observational datasets and Climate Model Intercomparison Project (CMIP5-6) historical and scenario simulations. Results show a contrasting picture of water mass contributions to global thermal expansion and sea level rise. Whereas ocean warming is distributed between mode, intermediate and deep waters, a disproportionate share of global ocean expansion occurs within tropical waters and subtropical mode waters. Regionally, tropical Pacific waters and subtropical north Atlantic mode waters appear as key contributors to global thermal expansion. These results show that the regional distribution of ocean heat uptake is a key driver of thermal expansion and sea level rise not only at regional scale but also at global scale. We also show that projections of future sea level rise at global scale critically depend on the ability of climate models to simulate both the regional water mass properties and their heat uptake.

How to cite: Waldman, R., Meyssignac, B., Fourest, S., Guillaume-Castel, R., von Schuckmann, K., and Sallée, J.-B.: Revisiting the relation between ocean heat storage and thermal expansion from a water mass perspective, EGU General Assembly 2024, Vienna, Austria, 14–19 Apr 2024, EGU24-7891, https://doi.org/10.5194/egusphere-egu24-7891, 2024.

EGU24-8462 | ECS | Posters on site | CL4.9

Eddy variability contribution to decadal regional sea level trends 

Benoit Laurent, William Llovel, Anne-Marie Treguier, and Antoine Hochet

Sea level rise is one of the most direct consequences of the actual global warming. Over the 20th century, global mean sea level rises at a rate of 1.5-2 mm. yr-1. Since the beginning of the 1990s, satellite altimetry measure the changes of sea level with a near global coverage (from 66oS to 75oN). The use of satellite altimetry has, for the first time, highlighted large regional variability in sea level trends that significantly differ from the global mean estimate. If global ocean warming and land ice melting (mountain glaciers and ice sheets from Greenland and Antarctica) are the main processes explaining the observed global mean sea level rise, at regional scales, other processes are involved, such as changes in salinity or temperature associated with ocean circulation or air-sea fluxes at the ocean surface.


Sea level projections used in IPCC reports are based primarily on coarse-resolution coupled climate models. Current projections are based on climate models in which ocean-eddy variabilities are parameterized and results deviate from observations especially in the Southern Ocean. Mesoscale processes transport heat/freshwater over very large distances in the ocean (both horizontally and vertically). They also regulate energy, moisture and carbon exchanges between the oceans and the atmosphere via coupling. Understanding these processes and how they might change in the future is critical for portraying robust regional sea level change.


Recently, new generations of climate models have been integrated at spatial resolutions of ¼° and 1/12°, which is sufficient to partially resolve the mesoscale eddy variability. These higher resolutions enable the study of the impact of mesoscale eddies on regional sea level changes and how these processes may change in the future.


In this work, we will take advantage of a suite of climate model simulations based on HadGEM3-GC3.1 at different spatial resolution (1°, ¼° and 1/12°) to assess the contribution of eddy-variability on regional sea level trends. We first present the ability of such climate models to reproduce regional sea level trends observed by satellite altimetry over decadal to multi-decadal time periods. Second, temperature and salt budget will be presented to quantify the contribution of eddy variability on these regional sea level trends.

How to cite: Laurent, B., Llovel, W., Treguier, A.-M., and Hochet, A.: Eddy variability contribution to decadal regional sea level trends, EGU General Assembly 2024, Vienna, Austria, 14–19 Apr 2024, EGU24-8462, https://doi.org/10.5194/egusphere-egu24-8462, 2024.

EGU24-9008 | Posters on site | CL4.9

Sea-level projections in recent IPCC reports: how we got here, where we are and where we’re going  

Aimée Slangen, Matthew Palmer, Carolina Camargo, John Church, Tamsin Edwards, Tim Hermans, Helene Hewitt, Gregory Garner, Jonathan Gregory, Robert Kopp, Victor Malagon Santos, and Roderik van de Wal

Sea-level science has seen many recent developments in observations and modelling of the different contributions and the total mean sea-level change. Here, we focus on sea-level projections in the recent IPCC reports, and discuss (1) the evolution in IPCC projections (“how we got here”), (2) how the projections compare to observations (“where we are”) and (3) the outlook for further improving projections (“where we’re going”). We start by discussing how the model projections of 21st century sea-level change have changed from the IPCC AR5 report (2013) to SROCC (2019) and AR6 (2021), highlighting similarities and differences in the methodologies and comparing the global mean and regional projections. This shows that there is good agreement in the median values, but also highlights some differences. In addition, we discuss how the different reports included high-end projections. We then show how the AR5 projections (from 2007 onwards) compare against the observations, and find that they are highly consistent with each other. Finally, we discuss how to further improve sea-level projections in future studies.

How to cite: Slangen, A., Palmer, M., Camargo, C., Church, J., Edwards, T., Hermans, T., Hewitt, H., Garner, G., Gregory, J., Kopp, R., Malagon Santos, V., and van de Wal, R.: Sea-level projections in recent IPCC reports: how we got here, where we are and where we’re going , EGU General Assembly 2024, Vienna, Austria, 14–19 Apr 2024, EGU24-9008, https://doi.org/10.5194/egusphere-egu24-9008, 2024.

EGU24-9762 | ECS | Orals | CL4.9

The interannual and decadal sea level variabilities over the Indo-Pacific Oceans in the Reanalysis and CMIP6 Historical Simulations and Projections 

Ponni Maya, José Antonio Álvarez Antolínez, Deepa Js, and Chellappan Gnanaseelan

In climatological research, understanding past and accurately simulating future sea level variability is paramount due to the considerable risk that sea level changes pose to low-lying regions, coupled with their significant influence on the occurrence and severity of extreme meteorological events  . This research insights are vital in evaluating the potential impact on renewable energy sources, particularly offshore wind, wave, and tidal energy, where changes in sea level can significantly alter the efficiency and viability of these energy converters. This study comprehensively analyses sea level variability on interannual and decadal scales in the Indo-Pacific region, integrating data from the Ocean Reanalysis System 5 (ORAS5), CMIP6 historical simulations spanning from 1850-2014, and future projections under the CMIP6 future intermediate emission scenario (rcp245/ssp245) for the period 2015 to 2100. Our investigation spans key areas such as the Northwest Central Pacific Ocean (NWCPO), the Eastern Equatorial Pacific Ocean (EEPO), and the Thermocline Ridge of the Indian Ocean (TRIO), among others.
We report findings on interannual and decadal Sea Level Anomaly (SLA) variability, especially highlighting the TRIO region and various Pacific Ocean zones such as the SWPO, NWCPO, EEPO, and NWNPO. Our study identifies a substantial increase in interannual variability in the NWNPO. We also observe consistent sea-level variability patterns across these regions, extending into future projections under moderate emission scenarios.
We find that the El Niño Southern Oscillation (ENSO), the Indian Ocean Dipole, and the Pacific Decadal Oscillation are key drivers of these variabilities. Our study reveals a strong connection between sea levels in the Equatorial Pacific and the Niño 3.4 index, suggesting its potential as a sea level-based indicator for El Niño and La Niña events.
Our research highlights the critical role of atmospheric forcing in driving sea level variability. We link high sea-level variability regions to significant wind stress curl anomalies, with distinct differences between hemispheres. We explore the mechanics of equatorial variability, emphasizing the role of equatorial Kelvin waves and local and remote Rossby waves in different oceanic regions.
Our study concludes that most CMIP6 models, despite large model uncertainty, predict an increase in sea level variability for the upcoming century, particularly in the Pacific Ocean, emphasizing the need for heightened attention to this dynamic region in the context of global climate change .

How to cite: Maya, P., Álvarez Antolínez, J. A., Js, D., and Gnanaseelan, C.: The interannual and decadal sea level variabilities over the Indo-Pacific Oceans in the Reanalysis and CMIP6 Historical Simulations and Projections, EGU General Assembly 2024, Vienna, Austria, 14–19 Apr 2024, EGU24-9762, https://doi.org/10.5194/egusphere-egu24-9762, 2024.

EGU24-9936 | ECS | Posters on site | CL4.9

Linking the Permanent Service for Mean Sea Level’s (PSMSL) global mean sea level dataset to the ellipsoid  

Chanmi Kim, Andrew Matthews, and Elizabeth Bradshaw

The Permanent Service for Mean Sea Level (PSMSL) is the internationally recognised global sea level data bank for long term sea level change information from tide gauges, responsible for the collection, publication, analysis and interpretation of sea level data. The PSMSL was founded 90 years ago, and today operates from the Liverpool site of the UK’s National Oceanography Centre. 

The PSMSL’s main product, a dataset of monthly and annual means from over 2000 locations worldwide aggregated from over 200 suppliers, is a cornerstone in our understanding of changes in sea level over the two centuries. For our highest quality Revised Local Reference (RLR) dataset, we ensure the data can all be referred to a fixed point on land, ensuring a consistent vertical reference frame is used throughout the record. Also, we provide GNSS solutions near the guage to estimate the ellipsoidal height and rate of movement of the site in our website.

Here we introduce the PSMSL mean sea level dataset, and explain how we present these ellipsoidal ties on our website. We also discuss ongoing efforts to improve the breadth of metadata we supply, and attempts to ensure they meet FAIR data practices (Findable, Accessible, Interoperable and Reusable). 


How to cite: Kim, C., Matthews, A., and Bradshaw, E.: Linking the Permanent Service for Mean Sea Level’s (PSMSL) global mean sea level dataset to the ellipsoid , EGU General Assembly 2024, Vienna, Austria, 14–19 Apr 2024, EGU24-9936, https://doi.org/10.5194/egusphere-egu24-9936, 2024.

EGU24-10137 | ECS | Posters on site | CL4.9

Reconstruction of the global ocean heat content and thermosteric sea-level rise with an improved configuration of the ISAS interpolation tool 

Rémy Asselot, Nicolas Kolodziejczyk, William Llovel, Kevin Balem, and Annaïg Prigent-Mazella

Anthropogenic greenhouse gas emissions have caused an imbalance in the energy content of the Earth's system, warming the atmosphere, the land surface, the cryosphere and the ocean. On a global scale, over the last five decades, the ocean has stored more than 90% of the heat excess associated with the Earth energy imbalance. This absorption of heat by the ocean leads to an increased Oceanic Heat Content (OHC). As the OHC rises, the global mean sea-level increases due to thermal expansion, a mechanism known as the global mean thermosteric sea-level (TSL) rise. In order to monitor accurately the global OHC and global mean TSL, one of the main sources of data is in situ Temperature and Salinity profiles. These profiles need to be interpolated on a regular grid to prevent any bias due to regional over or under-sampling. However, to date, OHC and TSL estimates and their associated uncertainties are sensitive to the parameterization and a priori assumption of the interpolation tools. To address this issue in a controlled framework, we run sensitive experiments where we adjust the configuration of the In Situ Analysis System (ISAS) interpolation tool. To do so, we extracted “synthetic profiles” of Temperature and Salinity from NEMO simulations, integrated over the 1980-2020 period.  We interpolated these profiles with ISAS and compared them with the original model outputs. This comparison allows us to improve the parameterization and a priori assumption of ISAS in order to, ultimately, provide a better understanding of the sensitivity of the global and regional OHC and TSL estimates. Here we present the first results of this work.

How to cite: Asselot, R., Kolodziejczyk, N., Llovel, W., Balem, K., and Prigent-Mazella, A.: Reconstruction of the global ocean heat content and thermosteric sea-level rise with an improved configuration of the ISAS interpolation tool, EGU General Assembly 2024, Vienna, Austria, 14–19 Apr 2024, EGU24-10137, https://doi.org/10.5194/egusphere-egu24-10137, 2024.

EGU24-10576 | ECS | Orals | CL4.9 | Highlight

Extreme sea-level projections along European coasts for climate adaptation services  

Maialen Irazoqui Apecechea, Angelique Melet, Guillaume Reffray, and Goneri Le Cozannet

Sea-level rise is one of the most hazardous climate-change impacts and is projected to trigger dramatic increases of coastal flooding frequency in Europe in the current century and beyond.  As such, adaptation-related effective decision making relies on the availability of authoritative and locally relevant information on future coastal sea-levels and their extremes, which include uncertainty quantification. However, current available sea-level projections are typically limited by either too low spatial resolution and therefore missing physical processes relevant at the coast, they account for only part of the sea-level signal (e.g. storm surges), and/or are typically limited to the downscaling of a single atmospheric model and therefore offer no quantification of the potentially significant inter-model uncertainty.   

In response to this knowledge gap, we present a novel extreme sea-level (ESL) projection dataset which focuses on the North-east Atlantic region. The dataset consists of a CMIP6-forced multi-model ensemble of downscaled projections until the end of the century, generated with a regional 3-dimensional ocean model at ~7km resolution. As such, the model captures not only storm-surge and tide induced ESLs, typically captured in barotropic 2-dimensional models, but also accounts for the contribution of circulation and density-driven modulations to extremes. Therefore, the ensemble dataset offers an excellent opportunity to explore ESL drivers at different spatio-temporal scales, their projected future changes, and associated uncertainties.

This dataset will help to advance scientific knowledge on climate-change induced coastal flood risk changes, but also to increase confidence in quantitative assessments of impacts of sea-level rise through its contribution to the Coastal Climate Core Service (CoCliCo), a decision-oriented platform which will inform users on present-day and future coastal risks, and which is currently under development as part of a European Union’s Horizon 2020 project.

The CoCliCo project has received funding from the European Union’s Horizon 2020 research and innovation programme under grant agreement No 101003598

How to cite: Irazoqui Apecechea, M., Melet, A., Reffray, G., and Le Cozannet, G.: Extreme sea-level projections along European coasts for climate adaptation services , EGU General Assembly 2024, Vienna, Austria, 14–19 Apr 2024, EGU24-10576, https://doi.org/10.5194/egusphere-egu24-10576, 2024.

EGU24-10716 | Posters on site | CL4.9 | Highlight

Exploring multi-century sea level rise commitments from 21st century cumulative emissions to inform minimum coastal adaptation needs 

Alexander Nauels, Zebedee Nicholls, Uta Klönne, Tim Hermans, Matthias Mengel, Christopher J. Smith, and Matthew D. Palmer

It is crucial to explore multi-century sea level responses under different emissions scenarios despite underlying physical uncertainties that rapidly increase over time, because resulting coastal risks fully manifest only on these longer timescales. Here, we use a set of climate and sea level emulators to investigate sea level rise commitments out to 2300 for cumulative emission levels at the start of every remaining 21st century decade under the five illustrative SSP-RCP scenarios. Our results indicate that emissions until 2030 “lock in” around 1.0 m (66% model range: 0.8 to 1.3 m) of global mean sea level rise in 2300 relative to 1995-2014. Under an intermediate emissions scenario roughly in line with current climate policies (SSP2-4.5), median 2300 global mean sea level commitments for cumulative emissions in 2050 (1.2 m) and 2100 (1.7 m) would be around 0.1 m and 0.6 m higher than under a very low emissions scenario (SSP1-1.9). Global results are also downscaled to selected regional sites and highlight that particularly vulnerable regions like low-lying Pacific Islands will experience higher local committed sea level rise than the global average. By attributing projected sea level rise commitments in 2300 to different cumulative emission levels in the 21st century, the study aims to more clearly link mitigation efforts in the near term to longer term coastal risk and to inform minimum adaptation requirements under different climate futures.

How to cite: Nauels, A., Nicholls, Z., Klönne, U., Hermans, T., Mengel, M., Smith, C. J., and Palmer, M. D.: Exploring multi-century sea level rise commitments from 21st century cumulative emissions to inform minimum coastal adaptation needs, EGU General Assembly 2024, Vienna, Austria, 14–19 Apr 2024, EGU24-10716, https://doi.org/10.5194/egusphere-egu24-10716, 2024.

EGU24-11869 | Orals | CL4.9

Relative sea level rise trends and projections up to 2150 along the Italian coasts: implications for coastal flooding 

Marco Anzidei, Antonio Vecchio, Tommaso Alberti, Enrico Serpelloni, and Anita Grezio

We focus on the current and future sea level (SL) trends along the Italian coasts which are affected by spatially variable rates of Vertical Land Movements (VLM) in response to tectonics and anthropic activities. Since VLM play a crucial role in local sea level rise along the coasts, they need to be estimated and incorporated in the analysis for more affordable sea level rise projections.

To estimate the current VLM rates we used geodetic data from about 27 years of continuous GNSS observations at a set of stations belonging to Euro-Mediterranean networks located within 5 km from the coast. Revised SL projections up to the year 2150 are provided at a set of points on a geographical grid and at the location of some tide gauges belonging to the PSMSL network, by including the estimated VLM in the SL projections released by the IPCC in the AR6 Report. Our results show that the current IPCC projections are not representative of the expected future sea levels since they do not properly consider the effects of tectonics and other local factors. Here we show that revised multi-temporal sea level projections at 2030-2050-2100 and 2150 show significant differences with respect to those of the IPCC for different Shared Socio-economic Pathways and global warming levels. Finally, our results indicate that about 1600 km of length and 10.000 km2 of the considered Italian coasts are yet exposed to flooding risk, with enhanced impacts on the environment, human activities and coastal infrastructures, in particular in 39 coastal plains. With the above scenarios, and especially in case of eventual instabilities of the Greenland and west Antarctica ice sheets, the effects of extreme meteorological events and tsunamis, will soon amplified along the Italian coasts, with serious concerns for main and small islands. Therefore, actions are needed to support vulnerable populations to adapt to the expected relative sea level rise by the end of this century and beyond.

How to cite: Anzidei, M., Vecchio, A., Alberti, T., Serpelloni, E., and Grezio, A.: Relative sea level rise trends and projections up to 2150 along the Italian coasts: implications for coastal flooding, EGU General Assembly 2024, Vienna, Austria, 14–19 Apr 2024, EGU24-11869, https://doi.org/10.5194/egusphere-egu24-11869, 2024.

EGU24-13354 | ECS | Posters on site | CL4.9

GravIS Portal: User-friendly Ocean Bottom Pressure data from GRACE and GRACE-FO 

Christoph Dahle, Eva Boergens, Henryk Dobslaw, Ingo Sasgen, Thorben Döhne, Sven Reißland, and Frank Flechtner

The German Research Centre for Geosciences (GFZ), together with the Alfred-Wegener-Institute (AWI) and the Technische Universität Dresden, maintains the ‘Gravity Information Service’ portal (GravIS, gravis.gfz-potsdam.de). GravIS facilitates the dissemination of user-friendly data of mass variations in the Earth system, based on observations of the US-German satellite missions GRACE (Gravity Recovery and Climate Experiment, 2002-2017) and its successor GRACE-FO (GRACE Follow-On, since 2018).

The portal provides ocean bottom pressure (OBP) data on a global 1° grid. Two versions of the product are provided, based on spherical harmonic coefficients taken from either the most recent GRACE/GRACE-FO release from GFZ or from the International Combination Service for Time-variable Gravity Fields (COST-G). Corrections applied to the data include the insertion of estimates of the geocentre motion, replacement of the C20 and C30 coefficients, corrections of the co- and postseismic deformations after the three megathrust earthquakes (Sumatra-Andaman 2004, Chile 2010, Japan-Tohoku 2011), and the correction for glacial isostatic adjustment with the ICE-6G model.

The data product consists of barystatic sea-level pressures calculated from the gravity data using the sea-level equation. Residual ocean circulation is provided as well. Besides the gridded products, regional average time series are also available for predefined ocean regions.

In addition to the OBP data, GravIS provides terrestrial water storage (TWS) variations over the continents and ice mass variations over Greenland and Antarctica. These data sets are also provided either as grids or regional averages.

The data sets of all Earth system domains can be interactively displayed within the portal and are freely available for download. This contribution aims to show the features of the GravIS portal and its potential benefit to sea-level and ocean science applications.

How to cite: Dahle, C., Boergens, E., Dobslaw, H., Sasgen, I., Döhne, T., Reißland, S., and Flechtner, F.: GravIS Portal: User-friendly Ocean Bottom Pressure data from GRACE and GRACE-FO, EGU General Assembly 2024, Vienna, Austria, 14–19 Apr 2024, EGU24-13354, https://doi.org/10.5194/egusphere-egu24-13354, 2024.

EGU24-14249 | ECS | Posters on site | CL4.9

Mid-Holocene relative sea-level reconstruction from digital surface models of coral microatolls at Pulau Semakau, southwestern Singapore  

Lin Thu Aung, Nural Syafiqah Tan, Jennifer Susan Quye-Sawyer, Fangyi Tab, Junki Komori, Zihan Aw, Jing Ying Yeo, Wan Lin Neo, Maya Baltz, and Aron Maltzner

Coral microatolls are coral colonies that grow with distinct morphologies consisting of living polyps on their outer perimeters and dead upper surfaces with concentric rings in planform. Their upward growth is limited by the lowest tides, allowing them to be used as precise indicators of relative sea-level (RSL) change. Therefore, detailed morphological investigation of fossil microatolls provides an important proxy for the reconstruction of past RSL. We present a preliminary RSL reconstruction from Pulau Semakau (Semakau Island), southwestern Singapore, based on digital surface models (DSMs) of fossil corals captured by portable iPhone LiDAR integrated with field survey data and radiocarbon analysis. Pulau Semakau is the largest field site in Singapore, with an intertidal flat extending more than 2 km long by 0.4 km wide, on which we observed 79 living and 65 fossil microatolls containing well preserved, concentric rings. In this study, we reconstruct mid-Holocene RSL using seven fossil, Diploastrea heliopora microatolls, relative to living counterparts on the island. DSMs indicate that three of these fossil corals are lower in elevation at the center with higher outer rings, indicating gradual RSL rise between ~7700 and 7500 cal yr BP. Conversely, three fossil corals are observed to decrease in elevation from the innermost to outermost rings, indicative of RSL fall between ~7350 and 7200 cal yr BP. These observations are consistent with but more well constrained than the existing sea-level curve of Singapore based on sea-level index points (SLIPs) and limiting dates from intertidal mangrove and shallow marine sediments. RSL records between ~7500 and 7350 cal yr BP are largely uncertain due to erosion of a fossil coral, and this remains as future work. The initial results reflect mid-Holocene RSL fluctuations at Pulau Semakau, from ~7700 to 7200 cal yr BP.

How to cite: Aung, L. T., Tan, N. S., Quye-Sawyer, J. S., Tab, F., Komori, J., Aw, Z., Yeo, J. Y., Neo, W. L., Baltz, M., and Maltzner, A.: Mid-Holocene relative sea-level reconstruction from digital surface models of coral microatolls at Pulau Semakau, southwestern Singapore , EGU General Assembly 2024, Vienna, Austria, 14–19 Apr 2024, EGU24-14249, https://doi.org/10.5194/egusphere-egu24-14249, 2024.

EGU24-14926 | ECS | Posters on site | CL4.9

Sea level projections for the German Coast 

Corinna Jensen, Frank Janssen, Jens Möller, and Tim Kruschke

Sea level rise is a certain consequence and one of the most important threats associated with climate change. It increases the risk of flooding of low-lying land at the German Coast.

In cooperation of the “Network of Experts” of the German Federal Ministry for Digital and Transport and the DAS core service “climate and water”, we aim to provide high-quality projections of relative sea level change for the German coastal areas, both in terms of spatial data as well as time series for specific stations. Most of the drivers for sea level change must be considered on a continental or global scale. The main exception for this in northern Europe is land uplift as its impacts are regional and dependent on glacial isostatic adjustment as well as local processes. We therefore created a new set of sea level projections for the North Sea and Baltic Region. This dataset is based on the IPCC 6th Assessment Report (AR6) projections of absolute sea level change, which we combine with a new and high-resolution land elevation model over Fennoscandia (instead of the coarse land elevation model for this region used in the IPCC AR6). The data will eventually be published via the “DAS core service”.


How to cite: Jensen, C., Janssen, F., Möller, J., and Kruschke, T.: Sea level projections for the German Coast, EGU General Assembly 2024, Vienna, Austria, 14–19 Apr 2024, EGU24-14926, https://doi.org/10.5194/egusphere-egu24-14926, 2024.

EGU24-15877 | ECS | Posters on site | CL4.9 | Highlight

Regional variations in relative sea level changes influenced by non-linear vertical land motion  

Julius Oelsmann, Marta Marcos, Marcello Passaro, Laura Sanchez, Denise Dettmering, Sönke Dangendorf, and Florian Seitz

Vertical land movements can cause regional relative sea level changes to differ substantially from climate-driven absolute sea level changes. While absolute sea level has been accurately monitored by satellite altimetry since 1992, there are limited observations of vertical land motion. Vertical land motion is generally modeled as a linear process, despite some evidence of non-linear motion associated with tectonic activity, changes in surface loading, or groundwater extraction. As a result, the temporal evolution of vertical land motion, and its contribution to projected sea level rise and its uncertainty, remains unresolved. Here, we present a probabilistic vertical land motion reconstruction from 1995-2020 and determine the impact of regional scale and non-linear vertical land motion on relative sea level projections up to 2150. We show that regional variations in projected coastal sea level changes are equally influenced by vertical land motion and climate-driven processes, with vertical land motion causing relative sea level changes of up to 50 cm by 2150. Accounting for non-linear vertical land motion increases the uncertainty in projections by up to 1 m on a regional scale. Our results highlight the uncertainty in future coastal impacts and demonstrate the importance of including non-linear vertical land motions in sea level change projections. In addition to its application to regional sea level projections, the vertical land motion estimate is an important source of information for various sea level studies focusing on the analysis of tide gauge or satellite altimetry observations in coastal areas.

How to cite: Oelsmann, J., Marcos, M., Passaro, M., Sanchez, L., Dettmering, D., Dangendorf, S., and Seitz, F.: Regional variations in relative sea level changes influenced by non-linear vertical land motion , EGU General Assembly 2024, Vienna, Austria, 14–19 Apr 2024, EGU24-15877, https://doi.org/10.5194/egusphere-egu24-15877, 2024.

EGU24-15948 | ECS | Posters on site | CL4.9

Drivers of Late Holocene relative sea-level change in the Sunda Shelf: new insights from coral microatolls in Singapore 

Fangyi Tan, Benjamin Horton, Ke Lin, Tanghua Li, Maeve Upton, Yucheng Lin, Jennifer Walker, Trina Ng, Jennifer Quye-Sawyer, Joanne TY Lim, Shi Jun Wee, Nurul Syafiqah Tan, and Aron Meltzner

Existing Late Holocene relative sea-level (RSL) records from the Sunda Shelf suffer from spatial and temporal discontinuities and/or a lack of precision, hindering an understanding of the drivers of RSL change. Here, we present the first RSL record from fossil coral microatolls in Singapore, which has high vertical (<± 0.20 m, 2𝜎) and temporal (<± 26 yrs, 95% highest density region) precision.

We applied a novel approach to produce sea-level index points and infer sea-level tendencies by combining (1) the use of photogrammetry with traditional levelling techniques; (2) 230Th dating; and (3) surface morphologies of the fossil coral microatolls. The fossil corals reveal a gradual, 0.31 ± 0.18 m (2𝜎) fall in RSL between 2.8 kyrs BP and 0.6 kyrs BP, with rates averaging 0.15 ± 0.10 mm/yr (2𝜎). Our coral record lies within uncertainty of some of the published RSL records from the region but disagrees with others, suggesting that local to regional processes may be driving spatial variability in RSL in the region. Misfits of the data with glacial isostatic adjustment (GIA) models may be explained by the influence of non-GIA processes, such as vertical land motion, and/or the need to fine-tune GIA model parameters. Work is ongoing to decompose the drivers of relative sea-level change within the region.

How to cite: Tan, F., Horton, B., Lin, K., Li, T., Upton, M., Lin, Y., Walker, J., Ng, T., Quye-Sawyer, J., Lim, J. T., Wee, S. J., Tan, N. S., and Meltzner, A.: Drivers of Late Holocene relative sea-level change in the Sunda Shelf: new insights from coral microatolls in Singapore, EGU General Assembly 2024, Vienna, Austria, 14–19 Apr 2024, EGU24-15948, https://doi.org/10.5194/egusphere-egu24-15948, 2024.

EGU24-16146 | Posters on site | CL4.9

Spatially variable sea level response to erosion and deposition in Aotearoa New Zealand 

Gregory Ruetenik, John D. Jansen, and Ken L. Ferrier

Surface processes alter sea level by warping Earth’s surface and modifying the gravitational field. Recent studies show that paleo-sea level indicators are depressed by sedimentation near major depocenters, such as the Mississippi and Indus deltas, and raised by the erosion of rock in rapidly eroding coastal regions such as Taiwan. The South Island of Aotearoa New Zealand poses an interesting combination of these endmembers because the Southern Alps are eroding rapidly on the west coast, while high sediment loads are deposited along the eastern margin. Here, we use a global, gravitationally self-consistent sea-level model to demonstrate that sediment redistribution on the South Island drastically alters interpretations of sea level change since the Last Interglacial (Marine Isotope Stage 5e) by as much as +100 m on the west coast and –30 m on the east coast. The influence of sediment redistribution on sea level is highly sensitive to geodynamic properties such as effective elastic thickness, which we reconcile using the abundance of paleo-shoreline markers available.

How to cite: Ruetenik, G., Jansen, J. D., and Ferrier, K. L.: Spatially variable sea level response to erosion and deposition in Aotearoa New Zealand, EGU General Assembly 2024, Vienna, Austria, 14–19 Apr 2024, EGU24-16146, https://doi.org/10.5194/egusphere-egu24-16146, 2024.

EGU24-16387 | Posters on site | CL4.9

Sea-level scenarios for coastal adaptation: the example of France 

Rémi Thiéblemont and Gonéri Le Cozannet

Climate change scenarios are a typical request of adaptation practioners. Within its third national adaptation plan, France is developing a consistent set of climate scenarios based on global warming levels. The scenario currently under consideration would lead to a global mean temperature increase of 3°C with respect to the preindustrial period, which is consistent with the current climate policies to 2100. Later on, these scenarios would be integrated in the regulation, for example in order to update risk assessment guidance.

Here, we present how sea-level rise scenarios aligned with this global warming level were produced. We selected emulated simulations for each component of future sea-level rise consistently, including ocean and ice components, following a method similar to that of the 6th assessment report of the IPCC, yet with specific attention to the consistency of uncertainty treatment before and after 2100. This responds to the needs to consider impacts of sea-level rise over hundred years, that is, to 2125 within coastal risk prevention plans. Furthermore, we added simulations considering a potential collapse of ice-sheets at 3°C of global warming levels in 2100. We consider only vertical land motions related to the Glacial Isostatic Adjustment as new observations from the Copernicus Land Motion service are now available for local stakeholder’s use.

The results show that the 87th percentile of projections is close to 80cm in 2100 with respect to 1995-2014 for the majority of mainland and overseas French regions, whether ice-sheets collapse is considered or not. Conversely, median values display differences of about 10cm depending whether ice sheet collapse is hypothesized or not. In the context of the development of these new scenarios, simplicity was considered a key criterion of success to ensure that all users - and not only those with high climate literacy - can effectively use scenarios. Hence, we propose to use one single scenario corresponding to the 87th percentile of the projections. This corresponds to a cautious approach consistent with the risk prevention policy in France. This does not preclude advanced users considering additional scenarios such as low-likelihood/high-impact scenarios voluntarily.

This work was performed within a project supported by the ministry in charge of Environment. We thank the steering and scientific committees of this project for useful comments and inputs.

How to cite: Thiéblemont, R. and Le Cozannet, G.: Sea-level scenarios for coastal adaptation: the example of France, EGU General Assembly 2024, Vienna, Austria, 14–19 Apr 2024, EGU24-16387, https://doi.org/10.5194/egusphere-egu24-16387, 2024.

EGU24-16743 | ECS | Posters on site | CL4.9

Inferring climatic sea-level variations from microatolls in tectonically active regions 

Sophie Debaecker, Mikhail Karpytchev, Mélanie Becker, Nathalie Feuillet, and Kenji Satake

Coral microatolls are often used to reconstruct the relative sea-level (RSL) along tropical coastlines. They grow at a constant rate, developing each year a growth band that can be observed in their internal stratigraphy. As their development is limited by the water height, they record annual variations of the relative sea-level once they have reached the sea surface. These changes are related to both climate and tectonic, and several criteria are used to decipher both signals. For example, it is commonly accepted that a local signal would rather correspond to a tectonic event, and inversely. However, majority of the criteria such as regrowth of the coral, amplitude of the RSL anomaly or matches with seismic or climatic events catalogs are mainly qualitative and most of the time, incomplete. In our study, we seek to develop a mathematically sound method to separate the climatic signal recorded by a series of microatolls. We focused on the region of the Ryukyus islands in south-west Japan, where the Philippine sea plate plunges under the Eurasia plate. In this area, up to 15 modern and living corals have been collected previously; and their RSL records extend from 1762 to 2018. They extend over 900 km along the subduction zone. Despite the seismic activity of the area, it is possible to infer that any signal common to all microatolls can be considered as climatic. We used a statistical method over the corals dataset to extract a common-mode RSL signal over the island arc. We found a long term sea-level rise for the last 200 years. We further analyze shorter time trends and annual anomalies, and compare our results from the RSL records that include years where only minimum RSL was recorded. Additionally, to refine our method we aim to compare sea level changes recorded by tide gauge in the Ryukyus with the estimates from inferred from the coral microatolls from seismically stable regions in the Pacific Ocean.

How to cite: Debaecker, S., Karpytchev, M., Becker, M., Feuillet, N., and Satake, K.: Inferring climatic sea-level variations from microatolls in tectonically active regions, EGU General Assembly 2024, Vienna, Austria, 14–19 Apr 2024, EGU24-16743, https://doi.org/10.5194/egusphere-egu24-16743, 2024.

EGU24-17955 | ECS | Posters on site | CL4.9

Sea-level storylines to inform coastal adaptation planning and decision-making for the UK, South Africa and Southeast Asia 

Jennifer Weeks, Matthew D. Palmer, Benjamin P. Horton, Trina Ng, Susan M. Parnell, and Antony Payne

Implementing responses to sea-level rise requires accessible, credible and relevant sea-level information to facilitate effective use by practitioners and decision-makers. However, recent consultations have highlighted the need to better translate sea-level information to meet the physical and cultural diversity of decision-making and planning across the world. This includes communicating sea-level rise across a range of timescales, providing information tailored to different risk tolerances and better linking sea-level rise to impacts analysis to provide useful and usable metrics (e.g., Weeks et al., 2023, Environ. Res. Commun.). 


The presence of ambiguity in sea-level projections means there are limitations in the use of probabilistic approaches in coastal planning and decision-making (Kopp et al., 2023, Nature Climate Change). Storylines (physically consistent and plausible pathways of future climate events) are increasingly being used as a distillation tool presented alongside probabilistic sea level projections, for example to address the challenge of “deep uncertainty” associated with the future response of the ice sheets. Here, we focus on the regionalisation of sea-level projections into a set of discrete, actionable future pathways, to meet the needs of coastal adaptation planners and decision-makers. Building on the work of Palmer et al., (2020) (Earth’s Future), we generate a set of sea-level storylines for coastal city locations in the UK, South Africa and Southeast Asia, constrained by different emissions scenarios and high-end sea-level rise estimates. Locations are chosen based on their population density and geographical spread, whilst the regions allow consideration of the different risk profiles and contexts for decision-making. This work explores a range of decision-making contexts and how the storyline framework can be tailored to different user needs. 

How to cite: Weeks, J., Palmer, M. D., Horton, B. P., Ng, T., Parnell, S. M., and Payne, A.: Sea-level storylines to inform coastal adaptation planning and decision-making for the UK, South Africa and Southeast Asia, EGU General Assembly 2024, Vienna, Austria, 14–19 Apr 2024, EGU24-17955, https://doi.org/10.5194/egusphere-egu24-17955, 2024.

EGU24-18361 | Orals | CL4.9

New sea level scenarios for the Netherlands 

Sybren S. Drijfhout, Dewi Le Bars, and Iris Keizer

We present the framework used to develop a new set of sea level scenarios for the Dutch coast published by KNMI in October 2023, to help the Netherlands adapt to sea level rise. Based on interactions with stakeholders, the development of the scenarios focused on two main areas: the connection between observations and projections and the development of low-likelihood high-impact scenarios up to 2300. We developed a local sea level budget for the period 1993-2021 to better understand past observations and to constrain the scenarios. In particular, the contribution of Ocean Dynamic Sea Level was important in the benchmark period 1993-2021, and observational evidence was used to select CMIP6 models that were close to the observations. For the low-likelihood high-impact scenarios three lines of evidence were used: structured expert judgement, a numerical model including Marine Ice Cliff Instability, and a physical evidence discussion. We also discuss some practical applications of these scenarios.

How to cite: Drijfhout, S. S., Le Bars, D., and Keizer, I.: New sea level scenarios for the Netherlands, EGU General Assembly 2024, Vienna, Austria, 14–19 Apr 2024, EGU24-18361, https://doi.org/10.5194/egusphere-egu24-18361, 2024.

EGU24-18660 | ECS | Orals | CL4.9

Understanding the Regional Disparity of the Sea Level Rise during Altimetry Era 

Rong Deng and Wenjie Dong

The application of satellite altimetry allows us to acquire global sea level height data with higher spatial and temporal resolution, enabling a systematic understanding of spatial differences in sea level rise. In our study, we reconstructed the barystatic sea level and steric sea level change during the altimetry era (1993-2022). This involved utilizing mass change data and ocean heat content data from various sources. Notably, we incorporated the latest observation and model-simulation data, ensuring coverage of the entire altimetry era compared with previous reconstructions. Based on altimetry-observed relative sea level change, the global sea level rise rate is 3.38 [3.09 3.68] mm/yr, the global barystatic and steric sea level change is 1.80 [1.45 2.15] mm/my, and 1.02 [0.67 1.37] mm/yr, respectively. Subsequently, we further analyzed the regional characteristics of these sea level rises.

Over the past three decades, sea levels have exhibited a faster rate of increase in the western basins, as well as in the equatorial and mid-latitude region, surpassing the global average. Conversely, sea level rise at higher latitudes has been relatively slower than the global average. In the mid-low latitude regions, the higher rate of sea level rise is primarily dominated by the expansion of ocean water due to its heating. In high-latitude regions, the lower sea level rise rate is primarily attributed to the far-field effects of the melting of land ice. The distribution of halosteric sea level changes is nearly uniform across latitudes. However, in the western Atlantic, a significant counteracting effect against the rise in thermosteric sea level is observed. This is linked to the weakening Atlantic Meridional Overturning Circulation (AMOC).

Furthermore, we selected 8 regions, North Pacific (NP), South China Sea (SCS), Western Tropical Pacific (WTP), Bay of Bengal (BOB), Tropical Indian Ocean (TIO), Southwest Pacific (SWP), Gulf of Mexico (GOM), and North Atlantic (NA), with sea level rise rates faster than the global average. We analyzed the contributions of different components to the sea level rise in these areas. These regions are all adjacent to land or have a significant number of islands, the faster sea level rise poses a greater threat to the corresponding coastal areas. The contributions of barystatic and steric sea level components are approximately equal in most of these regions. However, in SCS and GOM, the contributions of the barystatic component exceed 60%. The halosteric sea level has a significant negative contribution to the sea level rise in the GOM and NA. The Antarctic Ice Sheet and Greenland Ice Sheet melting contribute to sea level rise in these regions by less than 15%, and more than 15%, respectively. The highest contribution of glacier melting is in the SCS, approximately 23%. Compared to the melting of land ice, changes in land water contribute limitedly to sea level rise in these regions. The contribution is less than 10%, except for in NA.

How to cite: Deng, R. and Dong, W.: Understanding the Regional Disparity of the Sea Level Rise during Altimetry Era, EGU General Assembly 2024, Vienna, Austria, 14–19 Apr 2024, EGU24-18660, https://doi.org/10.5194/egusphere-egu24-18660, 2024.

EGU24-18693 | ECS | Posters on site | CL4.9

Loss of safe land on atolls highlights need for immediate emissions reductions to support coastal adaptation 

Tessa Möller, Rosanne Martyr-Koller, Scott Kulp, Tabea Lissner, Benjamin H Strauss, Zebedee Nicholls, and Alexander Nauels

The impacts of climate change and sea level rise are posing substantial threats to the long-term habitability of low-lying atolls. As of today, the sparse data coverage of these islands limits the ability to assess and respond to climate change related risks.

Advances in coastal digital elevation models provide data for very remote coastal regions with low vertical bias. Here, we combine the Intergovernmental Panel on Climate Change regional sea level rise projections under its illustrative emissions scenarios, with the coastal digital elevation model CoastalDEM and COAST-RP, a dataset of storm tide return periods to assess the exposure to rising sea levels and coastal flooding of 166 atolls. Our results show that in 2050 and under a very low emissions scenario (SSP1-1.9), atoll area exposure to SLR and coastal flooding will amount to 35% [34-36%] and that only 64% of atoll area can still be considered safe. By the end of century and under the same scenario, only 61% can be considered safe. Under an intermediate emissions scenario (SSP2-4.5), a scenario roughly capturing projected warming under current policies and actions, the share of safe land further reduces to 58% by 2100. By 2150, only 58% or 51% of the land can still be considered safe under the very low and intermediate emissions scenario respectively. Our results show that the habitability of atolls is already threatened in the near future, but that near-term mitigation can limit the pace at which atolls are flooded in particular beyond 2100. Our results imply that in addition to immediate and rapid emission reductions in line with the Paris Agreement, remaining adaptation options must be enabled and implemented today to reduce the future exposure of atolls.

How to cite: Möller, T., Martyr-Koller, R., Kulp, S., Lissner, T., Strauss, B. H., Nicholls, Z., and Nauels, A.: Loss of safe land on atolls highlights need for immediate emissions reductions to support coastal adaptation, EGU General Assembly 2024, Vienna, Austria, 14–19 Apr 2024, EGU24-18693, https://doi.org/10.5194/egusphere-egu24-18693, 2024.

Future sea-level rise on shallow continental shelves differs in one important aspect from open ocean sea-level rise: the local steric effect, that is the change in the water column height due to changes in sea water density, plays a minor role compared to the much deeper open ocean. Instead, the bulk of oceanic sea-level rise on continental shelves arises from an increase in ocean water mass that is being imported from the open ocean – the so-called shelf mass loading (SML). This redistribution is mainly driven by thermal expansion of water masses below shelf depth and magnifies as the subsurface ocean layers continue to warm.


Few studies have tried to detect SML as the signal is only expected to become dominant over decadal to multidecadal periods given the large natural variability in shallow regions.

Here, we combine hydrographic data from a section crossing the Norwegian shelf, with observations of total sea-level change from altimetry and estimates of mass changes from GRACE gravity missions to estimate the strength of SML over the past decades. We compare the residual of total sea level (from altimetry) and steric height (from hydrography) with GRACE estimates from three different solutions. Over the common period (2002 -2020), both estimates show a consistently higher trend over the shallow shelf area compared to the deep ocean. We estimate the shelf mass contribution in the order of 0.5 – 1.0 mm/yr, depending on the GRACE solution selected.

How to cite: Richter, K., Mangini, F., Bonaduce, A., and Raj, R.: Estimating the long-term sea-level contribution from shelf mass loading on the Norwegian shelf using hydrographic in-situ data, satellite altimetry and GRACE, EGU General Assembly 2024, Vienna, Austria, 14–19 Apr 2024, EGU24-19016, https://doi.org/10.5194/egusphere-egu24-19016, 2024.

EGU24-19452 | Posters on site | CL4.9

The barystatic contribution to multi-decadal sea-level change in the 19th century. 

Luke Jackson, Sophie Williams, Fiona Hibbert, Sönke Dangendorf, Ed Garrett, Andrew Sole, and Roland Gehrels

Understanding long-term trends in mass loss is vital for assessing the (in)stability of ice sheets and glaciers and their subsequent contribution to global mean sea level. Observational estimates of mass loss from the Greenland and Antarctic Ice Sheets are scarce before the satellite era (i.e., 1990s), and from glaciers before the 1950s. A variety of modelling techniques (process-driven and statistical) have been employed to synthesise and extend observational estimates, so that much of the 20th century sea-level budget is closed within uncertainty. Despite this work, uncertainty remains, particularly for contributions prior to ~1940 and the 19th century. 

Sea-level fingerprinting exploits the fact that the geometry of land-based water masses (i.e., ice sheets, glaciers, hydrological storage) and any changes (via loss or gain) will generate a unique gravitational equipotential surface (fingerprint). We apply this technique in a Monte-Carlo-based linear inversion model to isolate the globally averaged barystatic contribution from Greenland, Antarctica and glaciers over pentadal periods since 1813. We use a selection of long-duration tide gauges and high-resolution proxy-based sea-level reconstructions, with model-based glacio-isostatic adjustment (GIA), stero-dynamic, and terrestrial water storage corrections. 

Our initial findings confirm the validity of the approach when comparing barystatic contributions to observed estimates for the last 50 years. Whilst uncertainty is significant for the 19th century, the barystatic contribution deviates from zero in different pentads. We also conduct a sensitivity analysis to evaluate the idealised locations/corrections required to enhance confidence in the inversion procedure.

How to cite: Jackson, L., Williams, S., Hibbert, F., Dangendorf, S., Garrett, E., Sole, A., and Gehrels, R.: The barystatic contribution to multi-decadal sea-level change in the 19th century., EGU General Assembly 2024, Vienna, Austria, 14–19 Apr 2024, EGU24-19452, https://doi.org/10.5194/egusphere-egu24-19452, 2024.

EGU24-19505 | Orals | CL4.9

Progress in the Global Sea Level Fingerprints since the 20th century 

Yuxin Liu, Shanshan Deng, Wenxi Zhang, and Ange Hu

Ocean mass change is the primary driver of sea level rise. Understanding the mechanisms of mass sea level change can help coastal areas scientifically respond to climate change. Under combined the self-attraction and loading effect and the Earth's rotational feedback, land-source freshwater input leads to global spatiotemporal heterogeneity of mass sea level, known as Sea Level Fingerprints. In this study, Sea Level Fingerprints were simulated under three different scenarios, covering periods from January 1901 to July 2019, January 1981 to June 2020, and July 1979 to June 2020. These scenarios encompassed: (1) consideration of climate variability alone; (2) consideration of both climate variability and actual glacial mass balance; and (3) alignment with recent climate change trends. The study aimed to analyze the contribution of Sea Level Fingerprints to satellite-derived mass sea level across these three scenarios. Results showed that in all three scenarios, the significant seasonal amplitude regions include the South China Sea and the Bay of Bengal, with peak values ranging from 42.60 to 45.20 mm. Changes in mass sea level are primarily caused by climate variability. Sea Level Fingerprints, which considered only precipitation and temperature as key indicators of climate variability, best reproduced the variation signal of the GRACE-derived data and the Altimetry-derived mass component. The spatial similarity coefficient derived between their global change range distributions were 0.67 and 0.87, respectively. Sea Level Fingerprints, which additionally considered glacial mass balance, provided a more accurate depiction of the spatial distribution and long-term trend of mass sea level derived from Altimetry satellites and Argo systems. This was demonstrated by the similarity between the sea-level fingerprints and altimetry-derived mass components across global long-term trend distribution patterns, with a spatial similarity coefficient of 0.75. The main contributing regions to these patterns include the Greenland Ice Sheet, Alaska, the Southern Andes, the Caucasus, the Middle East, and West Antarctica.

How to cite: Liu, Y., Deng, S., Zhang, W., and Hu, A.: Progress in the Global Sea Level Fingerprints since the 20th century, EGU General Assembly 2024, Vienna, Austria, 14–19 Apr 2024, EGU24-19505, https://doi.org/10.5194/egusphere-egu24-19505, 2024.

EGU24-20096 | ECS | Orals | CL4.9

Attributing low-frequency variations in ocean water mass redistribution during 2002-2020 

Shanshan Deng, Yuxin Liu, Wenxi Zhang, and Ange Hu

Studying how ocean water mass is redistributed can help with a better understanding of the regional sea level change. This study investigates the roles of the different physical processes involved in low-frequency ocean water mass, including the sea level fingerprint and the dynamic ocean mass change, from regional to global scales over the period 2004-2021. Global water mass redistribution data from the GRACE and GRACE-FO satellites were used, as well as surface wind and sea surface temperature data from the ERA5 reanalysis. The sea-level equation is used to simulate the sea level fingerprint, and the maximum covariance analysis is used to extract possible signals of the wind-forcing and temperature-gradient-forcing ocean mass redistribution. The results show that the low-frequency ocean water mass is dominated by the long-term trend and the decadal-like fluctuation. Sea level fingerprint significantly contributes to the open ocean. Compared with temperature gradients, wind forcing plays a more important role in dynamic ocean mass redistribution. The wind-forcing dynamic processes significantly drive the anomalies near the North Indian Ocean, North Atlantic Ocean, South Pacific Ocean, and some marginal seas. After removing the sea level fingerprint and ocean dynamics, some non-negligible noise, located in seismic zones, was also found, suggesting the misestimation of seafloor deformation resulting from earthquakes in the GRACE/GRACE-FO data processing. These findings may improve our understanding of the long-term anomalies in regional and global sea levels.

How to cite: Deng, S., Liu, Y., Zhang, W., and Hu, A.: Attributing low-frequency variations in ocean water mass redistribution during 2002-2020, EGU General Assembly 2024, Vienna, Austria, 14–19 Apr 2024, EGU24-20096, https://doi.org/10.5194/egusphere-egu24-20096, 2024.

EGU24-21090 | ECS | Orals | CL4.9

Fast recovery of North Atlantic sea level in response to atmospheric CO2 removal 

Sunhee Wang, Yechul Shin, Ji-Hoon Oh, and Jong-Seong Kug

Human-induced increases in atmospheric carbon dioxide (CO2) cause global warming, which leads global mean sea level rise. Previous research has shown that even with the reduction or removal of atmospheric CO2, the global mean sea level will not return to its initial level. However, the regional effects of reducing or removing atmospheric CO2 on sea level change have not been extensively studied. In this study, we analyzed global and regional sea level changes over a 560-year period, including 140 years of a linear increase in atmospheric CO2 of 1% per year, followed by 140 years of a linear decrease, and finally 280 years of maintenance at pre-industrial CO2 levels. Our analysis showed that the sea level in the North Atlantic region increased rapidly relative to the global mean, and then recovered rapidly. We attribute these variations to fluctuations in the Atlantic Meridional Overturning Circulation (AMOC). As the AMOC weakened, heat and salt were trapped in the lower latitudes of the North Atlantic region, resulting in a slower transfer of these elements to higher latitudes. As the AMOC recovered and overshoot, the accumulated heat and salt were rapidly transferred to higher latitudes, resulting in changes in sea level. Our results suggest that the North Atlantic region is more sensitive to changes in atmospheric CO2 compared to the global mean. The North Atlantic region has a high population density and is expected to suffer significant damage as a result of sea level change. Therefore, continuous research on sea level change in this region is needed, and our study could help improve the ability to predict future sea level change in this area.

How to cite: Wang, S., Shin, Y., Oh, J.-H., and Kug, J.-S.: Fast recovery of North Atlantic sea level in response to atmospheric CO2 removal, EGU General Assembly 2024, Vienna, Austria, 14–19 Apr 2024, EGU24-21090, https://doi.org/10.5194/egusphere-egu24-21090, 2024.

EGU24-21107 | ECS | Orals | CL4.9

The defining roles of sterodynamic sea level in future climate projections 

Jan-Erik Tesdal, John Krasting, Robert Kopp, Praveen Kumar, Stephen Griffies, and William Sweet

Our ability to characterize and quantify the complex uncertainties surrounding future sea-level changes is crucial for coastal risk assessments and adaptation strategies. This study focuses on the role of steric and dynamic changes (i.e., sterodynamics) in sea level projections, particularly regarding their contribution to the uncertainty of global and regional sea level changes in relation to other components such as ice sheet dynamics. A probabilistic framework is used to estimate probability distributions of sea-level change for each component. Through variance decomposition, the total uncertainty in sea-level change is dissected into its constituent sources. Subsequently, the relative contribution of sterodynamics uncertainty is quantified across various regions, time frames, emission scenarios, and projection methodologies utilized to estimate future sea-level distributions. The contribution of sterodynamics to overall uncertainty reduces over time as the contribution from ice sheets becomes more pronounced. The spatiotemporal pattern of sterodynamic significance is not strongly dependent on future greenhouse gas emissions, yet its overall role is highly dependent on the representation (e.g., emulation) of ice sheets. When high-end, low-probability estimates of future Antarctic ice sheet contributions are excluded, sterodynamics remain a dominant source of regional sea-level uncertainty at the end of this century, particularly along the US East Coast and European coast. These regions are also identified as hotspots for future sea-level rise, indicating that sterodynamic processes will play a significant role in assessing coastal vulnerabilities there. This study suggests that ocean model development can most effectively reduce the overall uncertainty in future sea-level projections by focusing on these areas.

How to cite: Tesdal, J.-E., Krasting, J., Kopp, R., Kumar, P., Griffies, S., and Sweet, W.: The defining roles of sterodynamic sea level in future climate projections, EGU General Assembly 2024, Vienna, Austria, 14–19 Apr 2024, EGU24-21107, https://doi.org/10.5194/egusphere-egu24-21107, 2024.

EGU24-995 | ECS | Posters on site | CL4.10 | Highlight

Assessing the predictability of Euro-Mediterranean droughts through seasonal forecasts 

Thomas Dal Monte, Andrea Alessandri, Annalisa Cherchi, and Marco Gaetani

Droughts are characterized by prolonged and severe deficits in precipitation that can extend in time, over a season, a year or more. They are confined to specific climatic zones but can manifest in both high and low rainfall regions. Contributing factors include temperatures, strong winds, low relative humidity, and the characteristics of rainfall. Drought events are characterized through indices that can be categorized based on the specific impacts they are associated with, such as meteorological, agricultural, or hydrological effects. Using such indices for drought characterization serves multiple purposes, including detection, assessment, and representation of drought conditions within a particular region. Seasonal precipitatio is essential for social and economic development and activities, hence. Reliable seasonal forecasts, especially regarding extreme precipitation events, become crucial for sectors like agriculture and insurance. Europe, and in particular the Mediterranean region, is expected to be considerably affected under climate change. The northern regions are anticipated to exhibit higher variability, increasing the risk of floods, while the southern areas may face decreased rainfall, prolonged dry spells, and intensified evaporation, potentially leading to more frequent drought occurrences.

This research aims to evaluate the prediction skill for extreme drought events at the seasonal time-scale using the SPI and SPEI indices over the EURO-Mediterranean area. The use of SPEI also takes into account the effect of temperature on the water balance, given by the calculation of potential evapotranspiration within it, which can be crucial in a context of global warming. We consider the seasonal forecasts provided by the Copernicus multi-system and we use the Brier Skill Score metric for the assessment of the performance. The objective is to understand potential predictability factors of these indices within the study area. The results show a positive performance for most of the areas examined, between 60 and 80 percent of the entire area for both indices. This led us to investigate possible optimization strategies to increase the skill in the area.

Using the multi-model approach we optimize the prediction skill obtaining considerable performance in forecasting drought conditions. Different multi-model strategies are compared, including the selection or aggregation of available forecasts to achieve the best overall performance in the area. We show that multi-model optimization can indeed provide valuable probabilistic predictions of seasonal drought events in many areas of the Euro-Mediterranean that could be useful for the decision-making process of the affected end users.

How to cite: Dal Monte, T., Alessandri, A., Cherchi, A., and Gaetani, M.: Assessing the predictability of Euro-Mediterranean droughts through seasonal forecasts, EGU General Assembly 2024, Vienna, Austria, 14–19 Apr 2024, EGU24-995, https://doi.org/10.5194/egusphere-egu24-995, 2024.

EGU24-1120 | ECS | Orals | CL4.10

Effects of the realistic vegetation cover representation on the large-scale circulation and predictions at decadal time scale. 

Emanuele Di Carlo, Andrea Alessandri, Fransje van Oorschot, Annalisa Cherchi, Susanna Corti, Giampaolo Balsamo, Souhail Boussetta, and Timothy Stockdale

Vegetation is a highly dynamic component of the Earth System. Vegetation plays a significant role in influencing the general circulation of the atmosphere through various processes. It controls land surface roughness, albedo, evapotranspiration and sensible heat exchanges among other effects. Understanding the interactions between vegetation and the atmosphere is crucial for predicting climate and weather patterns. This study explores how better representation of vegetation dynamics affects climate predictions at decadal timescale and how surface characteristics linked to vegetation affect the general circulation at local, regional and global scales. We used the latest satellite datasets of vegetation characteristics and developed a new and improved parameterization for effective vegetation cover. We implemented the new parameterization in the land surface scheme Hydrology Tiled ECMWF Scheme for Surface Exchanges over Land (HTESSEL), which is embedded in the EC-Earth model. 

The enhancement of the model's vegetation variability significantly improves the prediction skill of the model for several parameters, encompassing both surface and upper-level elements such as 2-metre temperature, zonal wind at 850 hPa and mean sea level pressure. The improvement is particularly evident over Euro-Asian Boreal forests. In particular, a large-scale effect on circulation emerges from the region with the most 2-metre temperature improvement, over Eastern Europe. 

The incorporation of an effective vegetation cover also introduces heightened realism in surface roughness and albedo variability. This, in turn, leads to a more accurate representation of the land-atmosphere interactions. The regression analysis of surface roughness and albedo with 2-metre temperature, mean sea level pressure and wind (both at surface and 850 hPa) reveals a robust relationship across the entire northern hemisphere. This relation between the surface and the atmosphere is notably absent in the standard configuration model, where the vegetation is prescribed by a dynamical vegetation module.

These findings underscore the substantial impact of vegetation cover on the general circulation, particularly in the northern hemisphere, and emphasise its crucial role in improving prediction skills. Furthermore, they highlight the challenges faced by modern earth system models in accurately representing several processes connecting the land surface and the atmosphere.

How to cite: Di Carlo, E., Alessandri, A., van Oorschot, F., Cherchi, A., Corti, S., Balsamo, G., Boussetta, S., and Stockdale, T.: Effects of the realistic vegetation cover representation on the large-scale circulation and predictions at decadal time scale., EGU General Assembly 2024, Vienna, Austria, 14–19 Apr 2024, EGU24-1120, https://doi.org/10.5194/egusphere-egu24-1120, 2024.

EGU24-1407 | ECS | Posters on site | CL4.10 | Highlight

Time Lag and Cumulative Effects of Extreme Climate on Coastal Vegetation in China 

Dong Tong and Dahai Liu

Rapid global changes are altering regional hydrothermal conditions, especially in ecologically vulnerable regions such as coastal areas of China. The response of vegetation growth to extreme climates and the time lag-accumulation relationship still require further exploration. We characterize the vegetation growth status by solar-induced chlorophyll fluorescence (SIF), analyzed the vegetation dynamic in coastal areas of China from 2000 to 2019, also explored the spatiotemporal pattern of vegetation, and assessed the response of vegetation to extreme climate in term of time lag-accumulation by combines gradual analysis and abrupt analysis. The results showed that (1) Coastal areas of China were sensitive to global climate change, with extreme high temperatures and extreme precipitation increasing from 2000 to 2019, and the warming in high latitudes was greater than in low latitudes, while the increase in precipitation was concentrated in the southern regions, which are already water-rich. (2) The vegetation in coastal areas of China improved significantly, with gradual analysis showed that the vegetation improvement area accounts for 94.12% of the study area, and the abrupt analysis showed that the majority (69.78%) of the vegetation change types were "monotonic increase", with 11.77% showing "increase with negative break" and 9.48% "increases to decreases." (3) Significant lag-accumulation relationships were observed between vegetation and extreme climate in coastal areas of China, and the time-accumulation effects was stronger than time-lag effects. The accumulation time of extreme temperatures was typically less than one month, and the accumulation time of extreme precipitation was 2-3 months. These findings contribute to filling gaps in understanding the time lag-accumulation effects of extreme climates on vegetation in sensitive coastal regions. It provides a foundational basis for predicting the growth trend of coastal vegetation, environmental changes and ecosystem evolution, which is essential for a comprehensive assessment of coastal ecological security.

How to cite: Tong, D. and Liu, D.: Time Lag and Cumulative Effects of Extreme Climate on Coastal Vegetation in China, EGU General Assembly 2024, Vienna, Austria, 14–19 Apr 2024, EGU24-1407, https://doi.org/10.5194/egusphere-egu24-1407, 2024.

EGU24-3134 | Orals | CL4.10

Decadal predictability of seasonal temperature distriubutions 

André Düsterhus and Sebastian Brune

Climate predictions focus regularly on the predictability of single values, like means or extremes. While these information offer important insight into the quality of a prediction system, some stakeholders might be interested in the predictability of the full underlying distribution. These allow beside evaluating the amplitude of an extreme also to estimate their frequency. Especially on decadal time scales, where we verify multiple lead years at a time, the prediction quality of full distributions may offer in some applications important additional value.

In this study we investigate the predictability of the seasonal daily 2m-temperature on time scales of up to ten lead years within the MPI-ESM decadal prediction system. We compare yearly initialised hindcast simulations from 1960 onwards against estimates for climatology and uninitialised historical simulations. To verify the predictions we demonstrate a novel approach based on the non-parametric comparison of distributions with the integrated quadratic distance (IQD).

We show that the initialised prediction system has advantages in particular in the North Atlantic area and allow so to make reliable predictions for the whole temperature distribution for two to ten years ahead. It also demonstrates that the capability of initialised climate predictions to predict the temperature distribution depends on the season. Finally, we will also discuss potential opportunities and pitfalls of such approaches.

How to cite: Düsterhus, A. and Brune, S.: Decadal predictability of seasonal temperature distriubutions, EGU General Assembly 2024, Vienna, Austria, 14–19 Apr 2024, EGU24-3134, https://doi.org/10.5194/egusphere-egu24-3134, 2024.

EGU24-3274 | ECS | Orals | CL4.10

 A Multi-year Climate Prediction System Based on CESM2 

Yong-Yub Kim, June-Yi Lee, Axel Timmermann, Yoshimitsu Chikamoto, Sun-Seon Lee, Eun Young Kwon, Wonsun Park, Nahid A. Hasan, Ingo Bethke, Filippa Fransner, Alexia Karwat, and Abhinav R.Subrahmanian

Here we present a new seasonal-to-multiyear earth system prediction system which is based on the Community Earth System Model version 2 (CESM2) in 1° horizontal resolution. A 20- member ensemble of temperature and salinity anomaly assimilation runs serves as the initial condition for 5-year forecasts. Initialized on January 1st of every year, the CESM2 predictions exhibit only weak climate drift and coupling shocks, allowing us to identify sources of multiyear predictability. To differentiate the effects of external forcing and natural climate variability on longer-term predictability, we analyze anomalies calculated relative to the 50-member ensemble mean of the CESM2 large ensemble. In this presentation we will quantify the extent to which marine biogeochemical variables are constrained by physical conditions. This analysis provides crucial insights into error growth of phytoplankton and the resulting limitations for multiyear predictability.

How to cite: Kim, Y.-Y., Lee, J.-Y., Timmermann, A., Chikamoto, Y., Lee, S.-S., Kwon, E. Y., Park, W., A. Hasan, N., Bethke, I., Fransner, F., Karwat, A., and R.Subrahmanian, A.:  A Multi-year Climate Prediction System Based on CESM2, EGU General Assembly 2024, Vienna, Austria, 14–19 Apr 2024, EGU24-3274, https://doi.org/10.5194/egusphere-egu24-3274, 2024.

EGU24-4083 | Posters virtual | CL4.10 | Highlight

Enhancing Subseasonal Climate Predictions through Dynamical Downscaling: A Case Study in the Southern Plains of the United States 

Yoshimitsu Chikamoto, Hsin-I Chang, Simon Wang, Christopher Castro, Matthew LaPlante, Bayu Risanto, Xingying Huang, and Patrick Bunn

Predicting extreme precipitation events at subseasonal timescales is a critical challenge in Earth system science. This study advances climate predictability by employing dynamical downscaling, specifically focusing on convection-permitting modeling in the Southern Plains of the United States. Two contrasting extreme precipitation periods in Texas, the extremely dry May of 2011 and the abnormally wet May of 2015, were selected for analysis. To enhance subseasonal climate forecasting, we integrated the Weather Research and Forecasting (WRF) model with the decadal climate prediction system based on the Community Earth System Model (CESM). Evaluating the impact of dynamical downscaling on the prediction of extreme precipitation events, our study demonstrates how high-resolution downscaling enhances model skill in capturing these events. The findings hold the potential to significantly contribute to improving climate predictions and assessing regional climate-related risks, aligning with the session's goals.

How to cite: Chikamoto, Y., Chang, H.-I., Wang, S., Castro, C., LaPlante, M., Risanto, B., Huang, X., and Bunn, P.: Enhancing Subseasonal Climate Predictions through Dynamical Downscaling: A Case Study in the Southern Plains of the United States, EGU General Assembly 2024, Vienna, Austria, 14–19 Apr 2024, EGU24-4083, https://doi.org/10.5194/egusphere-egu24-4083, 2024.

Accurate seasonal streamflow forecasts (SSF) are crucial for disaster prevention, water management, agriculture, and hydropower generation. A global approach becomes imperative in regions lacking forecast systems. The Météo-France seasonal prediction system (MF System 8 - SYS8), contributing to Copernicus Climate Change Services (C3S), employs a fully coupled Atmosphere-Ocean General Circulation Model (AOGCM) with an advanced river routing component (CTRIP) interacting with the ISBA land-surface scheme. This study evaluates the skill of the SYS8 global SSF through hindcast river discharges. This work is part of the European project CERISE, which aims to enhance the C3S seasonal forecast portfolio by improving land initialisation methodologies.

SYS8 derives land initial conditions from a historical initialisation run where land (such as soil moisture and river discharges) is weakly constrained, contrasting with the atmosphere and ocean counterparts, which are nudged to the ERA5 and GLORYS re-analysis. This study improves the initialisation run by relaxing soil moisture to fields reconstructed from an offline land simulation.  Daily streamflow ensemble hindcasts of 25 members are generated in a  0.5° grid, with a lead time of up to 4 months initialised on the first day of May and August between 1993-2017. May and August initialisations allow forecasting of summer (JJA) and fall (SON) seasons. Actual forecast skill is assessed against streamflow observations in 1608 monitored basins worldwide (with areas > 3000 km2) using deterministic and probabilistic metrics. The classical Ensemble Streamflow Prediction approach (ESP) serves as a benchmark to evaluate the control SYS8 SSF skill and the additional skill of soil moisture nudging.

Globally, hindcast skill improves with enhanced land-surface initial conditions, especially during summer. Lower latitudes (<50°N) exhibit increased skill, while higher and cooler latitudes may lead to overestimated streamflow magnitude and oscillation amplitude due to soil moisture constraints. Local skill degradation will be discussed. Still, positive results support ongoing efforts to enhance land initialisation through a global land data assimilation system.

How to cite: Narváez, G. and Ardilouze, C.: Global Streamflow Seasonal Forecasts: Impact of soil moisture initialization in a novel two-way AOGCM-River Routing coupling approach, EGU General Assembly 2024, Vienna, Austria, 14–19 Apr 2024, EGU24-5484, https://doi.org/10.5194/egusphere-egu24-5484, 2024.

EGU24-6494 | Posters virtual | CL4.10 | Highlight

Seasonal predictions of summer humid heat extremes in the southeastern United States driven by sea surface temperatures 

Liwei Jia, Thomas Delworth, and Xiaosong Yang

Humid heat extreme (HHE) is a type of compound extreme weather event that poses severe risks to human health. Skillful forecasts of humid heat extremes months in advance are essential for developing strategies to help communities build more resilience to the risks associated with extreme events. This study demonstrates that the frequency of summertime HHE in the southeastern United States (SEUS) can be skillfully predicted 0-1 months in advance in the SPEAR (Seamless system for Prediction and EArth system Research) seasonal forecast system. The sea surface temperature (SST) at the tropical North Atlantic (TNA) basin is found as the primary driver of the prediction skill. The responses of large-scale atmospheric circulation and winds to anomalous warm SSTs in TNA favor the heat and moisture flux transported from the gulf of Mexico to the SEUS. This research demonstrates the role of slowly-varying sea surface conditions in modifying large-scale environments that contribute to the predictions of HHE in SEUS. The results are potentially applicable for developing early warning systems of HHE. 

How to cite: Jia, L., Delworth, T., and Yang, X.: Seasonal predictions of summer humid heat extremes in the southeastern United States driven by sea surface temperatures, EGU General Assembly 2024, Vienna, Austria, 14–19 Apr 2024, EGU24-6494, https://doi.org/10.5194/egusphere-egu24-6494, 2024.

“Synergistic Observing Network for Ocean Prediction (SynObs)” is a project of the United Nations Decade of Ocean Science for Sustainable Development. SynObs aims to find the way to extract maximum benefits from the combination among various ocean observation platforms, including satellite and in situ observations. A major ongoing effort led by SynObs is the international multi-system OSEs/OSSEs. In this activity, various operational centers and research institutes participating will conduct Observing System Experiments (OSEs) and Observing System Simulation Experiments (OSSEs) using a variety of ocean or coupled ocean-atmosphere prediction systems with the common setting to evaluate ocean observation impacts which are robust for most ocean prediction systems. More than 10 ocean prediction systems with various model resolutions and diverse data assimilation methods are used in this activity, and impacts of various observation data, including satellite sea surface temperature and height, Argo floats, and tropical mooring buoys, will be evaluated.

The activity is divided into two parts. The first part is the ocean prediction OSEs. In this part, we run several ocean reanalysis runs assimilating different observation datasets at least for 2020 (preferably extended to 2022), and conduct 10-day ocean predictions from the reanalysis fields of every 5 days. Three-dimensional oceanic temperature, salinity, and velocity fields with the 1/10-degree resolution, and several two-dimensional diagnostics with the 1/4-degree resolution will be analyzed. The second part is the subseasonal-to-seasonal (S2S) OSEs. Here, we run several ocean reanalysis runs for 2003-2022, and conduct 1-month (4-month) coupled predictions from the reanalysis fields of every month (twice a year). We will evaluate the impacts of ocean observation data on the long-term reanalysis and S2S predictions using the coupled prediction systems. We also plan to conduct OSSEs using multiple ocean prediction systems in order to assess newly emerging or future observing systems, such as SWOT, ocean gliders, etc. 

We are currently conducting the S2S OSEs using a Japanese operational global ocean data assimilation and coupled prediction system for S2S forecasts. We are now conducting OSEs assimilating no in situ observations and withholding temperature and salinity profiles observed by Argo floats. In the presentation, we will introduce the results and the perspective of the collaborative activities.

How to cite: Fujii, Y., Ishikawa, I., and Hirahara, S.: Early results of OSEs conducted for the SynObs international multi-system OSE effort using an Japanese operational system, EGU General Assembly 2024, Vienna, Austria, 14–19 Apr 2024, EGU24-6970, https://doi.org/10.5194/egusphere-egu24-6970, 2024.

EGU24-7918 | ECS | Orals | CL4.10

Generation of sea ice initial conditions for the next Météo-France seasonal forecasting system 

Fousiya Thottuvilampil Shahulhameed, Jonathan Beuvier, and Damien Specq

Research and development activities around the current Météo-France operational seasonal forecasting system (System 8) are underway to upgrade it to the next version (System 9), along with efforts to improve the initialization of its components. Among these components, sea ice is particularly challenging to initialize. At present, a coupled-nudged initialisation strategy, based on a high-resolution configuration of the CNRM-CM6 climate model, is employed to initialise the System 8, except for the sea-ice. In order to get initial states of sea ice that are consistent with the forecasting model, our procedure consists in making a preliminary continuous run where the ocean and sea ice models are integrated in stand-alone mode, with forcing at the surface from an atmosphere reanalysis.

However, in the current operational System 8 – based on the NEMO 3.6 ocean model and the GELATO sea ice model – the initial states of sea ice generated with this procedure are not fully realistic. Results show that the sea ice thickness over the Arctic region in the System 8 initial states is underestimated compared to the reference data. Numerous sensitivity experiments were carried out with the current NEMOv3.6-GELATO system, leading to some minor improvements. Thus, an upgraded version of the ocean model (NEMO version 4.2) coupled to a new sea-ice component (SI3) has been tested (in stand-alone mode, not coupled to the atmosphere) to see if the use of more recent versions of ocean and sea-ice models leads to some improvements in the Arctic sea ice representation. The results are encouraging as the representation of sea ice variables in the Arctic is improved compared to the old version.

This incites our team to foresee that System 9 will indeed incorporate the NEMO4.2 and SI3 models, and that the same initialization procedure as before (using these new models) will provide sea-ice initial states closer to those observed.


How to cite: Thottuvilampil Shahulhameed, F., Beuvier, J., and Specq, D.: Generation of sea ice initial conditions for the next Météo-France seasonal forecasting system, EGU General Assembly 2024, Vienna, Austria, 14–19 Apr 2024, EGU24-7918, https://doi.org/10.5194/egusphere-egu24-7918, 2024.

EGU24-11927 | Posters virtual | CL4.10 | Highlight

Seasonal prediction of solar energy resources in the United States 

Xiaosong Yang, Thomas Delworth, Liwei Jia, Nathaniel Johnson, Feiyu Lu, and Colleen McHugh

Solar energy plays a crucial role in the transition towards a sustainable and resilient energy future. One challenge that remains is the considerable year-to-year variation in solar energy resources. As a result, precise seasonal solar energy predictions become pivotal for effective energy system planning and operation.  This study employs GFDL’s GFDL’s Seamless System for Prediction and Earth System (SPEAR) to evaluate seasonal solar irradiance prediction across the United States.  Notably, SPEAR demonstrates high skill in predicting solar irradiance particularly in the western United States. Furthermore, we conduct an advanced predictability analysis to pinpoint the underlying physical drivers contributing to this skillful solar energy prediction.  The outcomes of this research offer substantial potential benefits to stakeholders within the energy sector by providing predictable information regarding year-to-year fluctuations in solar energy resources.

How to cite: Yang, X., Delworth, T., Jia, L., Johnson, N., Lu, F., and McHugh, C.: Seasonal prediction of solar energy resources in the United States, EGU General Assembly 2024, Vienna, Austria, 14–19 Apr 2024, EGU24-11927, https://doi.org/10.5194/egusphere-egu24-11927, 2024.

EGU24-11948 | Posters on site | CL4.10

What is the Target for Multi-Model and Perturbed-Physics Ensembles? 

David Stainforth

Much effort goes into studying the causes of systematic errors in Earth System Models (ESMs). Reducing them is often seen as a high priority. Indeed, the development of Digital Twin approaches in climate research is founded on the idea that a sufficiently good model would be able to provide reliable and robust, conditional predictions of climate change (predictions conditioned on scenarios of future greenhouse gas emissions). Here, “reliable” encapsulates the idea that the predictions are suitable for use by society in anticipating and planning for future climate change, and “robust” encapsulates the idea that they are unlikely to change as the models are improved and developed.

Such an approach, however, begs the question, when is a model sufficiently realistic to be able to provide reliable, detailed predictions? A physical processes view of current ESMs suggests that they are not close to this level of realism while a nonlinear dynamical systems perspective raises questions over whether it will ever be possible to achieve such reliability for the types of regionally-specific, extrapolatory, climate change predictions that we may think society seeks.

Given this context, multi-model and perturbed-physics ensembles are often seen as a means to quantify uncertainty in conditional, climate change predictions (commonly referred to as “projections” in the scientific community). In the IPCC atlas (https://interactive-atlas.ipcc.ch/) the most easily accessible output is the multi-model median with the 10th, 25th, 75th and 90th percentiles of the multi-model distribution also prominent. This presentation in terms of probabilities implies that the probabilities themselves have meaning to the users of the data - most users are likely to take them as probabilities of different outcomes in reality. Unfortunately multi-model ensembles cannot be interpreted that way because we have no metric for the shape of model space nor any idea of how to explore it, so the ensemble members cannot be taken as independent samples of possible models. Perturbed-parameter ensembles work in a more defined space of possible model-versions but the shape of that space is also undefined and as a result the ensemble-based probabilities are again arbitrary.

When seeking the best possible information for society, multi-model and perturbed physics ensembles would benefit from targeting diversity: the greatest possible range of responses given a particular model structure. Model emulators could be used to systematise this process. Such an approach would provide more reliable information. It changes the question, however, from “when is a model sufficiently realistic” to “how unrealistic does a model have to be to be uninformative about extrapolatory future climatic behaviour?”

In this presentation I will discuss and elaborate on these issues.


References:

Stainforth, D., “What we do with what we’ve got”, Chapter 21 in “Predicting Our Climate Future: What we know, what we don’t know and what we can’t know”, Oxford University Press, 2023.

Stainforth, D.A. et al., Confidence, uncertainty and decision-support relevance in climate predictions, Phil.Trans.Roy.Soc., 2007.

Stainforth, D.A. et al., Issues in the interpretation of climate model ensembles to inform decisions, Phil.Trans.Roy.Soc., 2007.

How to cite: Stainforth, D.: What is the Target for Multi-Model and Perturbed-Physics Ensembles?, EGU General Assembly 2024, Vienna, Austria, 14–19 Apr 2024, EGU24-11948, https://doi.org/10.5194/egusphere-egu24-11948, 2024.

EGU24-12988 | ECS | Posters on site | CL4.10

A CNN-based Downscaling Method of C3S Seasonal Forecast: Temperature and Precipitation 

Qing Lin, Yanet Díaz Esteban, Fatemeh Heidari, Edgar Fabián Espitia Sarmiento, and Elena Xoplaki

Copernicus Climate Change Service provides seasonal forecasts for meteorological outlooks several months in advance and can provide indications of future climate risks on a global scale. Using downscaling techniques, global variables can be transferred to the high-resolution regional scale, allowing the information to be elaborated for extreme events detection and further implementing and coupling with hydrological models for regional hazard prediction, thus serving agriculture and energy, improving planning for tourism and other sectors.

In this study, we applied a new CNN-based architecture for temperature and precipitation downscaling. Both variables are downscaled from 1 degree to 1 arcminute to fulfill the requirements as an input to the hydrological models. The architecture implements an auto-encoder/decoder structure to extract the data relations. The system is trained with seasonal forecast inputs and observation data to establish the relation between both scales. The model is then evaluated with the validation period from the observation data to achieve the best performance, changing network structures and tuning different network hyper-parameters. The results show a good fit for the observation data on the monthly scale, providing enough details in the downscaling product. Finally, the best-performing networks for downscaling temperature and precipitation are selected and could be extended for further utilization.

How to cite: Lin, Q., Díaz Esteban, Y., Heidari, F., Espitia Sarmiento, E. F., and Xoplaki, E.: A CNN-based Downscaling Method of C3S Seasonal Forecast: Temperature and Precipitation, EGU General Assembly 2024, Vienna, Austria, 14–19 Apr 2024, EGU24-12988, https://doi.org/10.5194/egusphere-egu24-12988, 2024.

EGU24-13811 | ECS | Posters on site | CL4.10

Estimating Seasonal to Multi-year Predictability of Statistics of Climate Extremes using the CESM2-based Climate Prediction System 

Alexia Karwat, June-Yi Lee, Christian Franzke, and Yong-Yub Kim

Climate extremes, such as heat waves, heavy precipitation, intense storms, droughts, and wildfires, have become more frequent and severe in recent years as a consequence of human-induced climate change. Estimating the predictability and improving prediction of the frequency, duration, and intensity of these extremes on seasonal to multi-year timescales are crucial for proactive planning and adaptation. However, climate prediction at regional scales remains challenging due to the complexity of the climate system and limitations in model accuracy. Here we use a large ensemble of simulations, assimilations, and reforecasts using Community Earth System Model version 2 (CESM2) to assess the predictability of statistics of climate extremes with lead times of up to 5 years. We show that the frequency and duration of heat waves during local summer in specific regions are predictable up to several months to years. Sources of long-term predictability include not only external forcings but also modes of climate variability across time scales such as El Niño and Southern Oscillation, Pacific Decadal Variability, and Atlantic Multidecadal Variability. This study implies opportunities to deepen our scientific understanding of sources for long-term prediction of statistics of climate extremes and the potential for the associated disaster management.

How to cite: Karwat, A., Lee, J.-Y., Franzke, C., and Kim, Y.-Y.: Estimating Seasonal to Multi-year Predictability of Statistics of Climate Extremes using the CESM2-based Climate Prediction System, EGU General Assembly 2024, Vienna, Austria, 14–19 Apr 2024, EGU24-13811, https://doi.org/10.5194/egusphere-egu24-13811, 2024.

EGU24-15488 | ECS | Orals | CL4.10

Phytoplankton predictability in the Tropical Atlantic - triggered by nutrient pulses from the South 

Filippa Fransner, Marie-Lou Bachèlery, Shunya Koseki, David Rivas, Noel Keenlyside, Nicolas Barrier, Matthieu Lengaigne, and Olivier Maury

The variability and predictability of the Tropical Atlantic primary productivity remains little explored on interannual-to-decadal time scales. Here, we  present the results of two studies, in which find a decadal scale variability in phytoplankton abundance that can be predicted three years ahead. The predictions are made with NorCPM, which is a fully coupled climate prediction model with ocean biogeochemistry that assimilates temperature and salinity to reconstruct past variability. From these reconstructions, predictions are initialized that are run freely ten years ahead. We find that the predictability is a result of nutrient pulses that are advected with the southern branch of the South Equatorial Current from the most southern part of the Atlantic, and that then get caught in the Equatorial undercurrent before they reach the surface in the Tropical Atlantic Ocean. A more detailed analysis is being done in order to pinpoint the underlying mechanisms in a forced ocean model, where we find a link to the Pan-Atlantic decadal oscillation.

How to cite: Fransner, F., Bachèlery, M.-L., Koseki, S., Rivas, D., Keenlyside, N., Barrier, N., Lengaigne, M., and Maury, O.: Phytoplankton predictability in the Tropical Atlantic - triggered by nutrient pulses from the South, EGU General Assembly 2024, Vienna, Austria, 14–19 Apr 2024, EGU24-15488, https://doi.org/10.5194/egusphere-egu24-15488, 2024.

EGU24-15829 | Posters on site | CL4.10

The role of realistic vegetation variability in climate predictability and prediction 

Andrea Alessandri, Emanuele Di Carlo, Franco Catalano, Bart van den Hurk, Magdalena Alonso Balmaseda, Gianpaolo Balsamo, Souhail Boussetta, and Tim Stockdale

Vegetation is a relevant and highly dynamic component of the Earth system and its variability – at seasonal, interannual, decadal and longer timescales – modulates the coupling with the atmosphere by affecting surface variables such as roughness, albedo and evapotranspiration. In this study, we investigate the effects of improved representation of vegetation dynamics on climate predictability and prediction at the seasonal timescale. To this aim, the observational constraints from the latest generation satellite dataset of vegetation Leaf Area Index (LAI) have been integrated in the modeling, including a parameterization of the effective vegetation cover as a function of LAI. The improved vegetation representation is implemented in HTESSEL, which is the land surface model included in the seasonal forecasting (ECMWF SEAS5) systems used in this work.

Our results show that the realistic representation of vegetation variability has significant effects on both potential predictability and actual prediction skill at the seasonal time scale. It is shown a significant improvement of the skill in predicting boreal winter (December-January-February; DJF) 2m Temperature (T2M) at 1-month lead time especially over Euro-Asian boreal forests; the improvement is at least in part due to the more realistic representation of the interannual albedo variability that is related to the changes in vegetation shading over snow. Remarkably, from the region with the most considerable T2M improvement originates a large-scale ameliorating effect on circulation encompassing Northern Hemisphere middle-to-high latitudes from Siberia to the North Atlantic. The results indicate that the coupling with the improved vegetation might operate by amplifying locally the signal originating from the North Atlantic sector, therefore improving both potential predictability and actual skill over the region. Concurrently, the improved predictability and skill over the Euro-Asian forests appears to feedback to the large-scale circulation enhancing the representation of the circulation pattern and associated interannual anomalies.

How to cite: Alessandri, A., Di Carlo, E., Catalano, F., van den Hurk, B., Balmaseda, M. A., Balsamo, G., Boussetta, S., and Stockdale, T.: The role of realistic vegetation variability in climate predictability and prediction, EGU General Assembly 2024, Vienna, Austria, 14–19 Apr 2024, EGU24-15829, https://doi.org/10.5194/egusphere-egu24-15829, 2024.

EGU24-16402 | Orals | CL4.10

On the stationarity of the global spatial dependency of heat risk on drought. 

Matteo Zampieri, Karumuri Ashok, Andrea Toreti, Davide Bavera, and Ibrahim Hoteit

Compound climate anomalies pose escalating risks in the context of climate change, with anomalous heat and drought presenting significant stressors to both ecosystems and society. The simultaneous occurrence of these events can be influenced by land surface processes such as the soil moisture – air temperature coupling. However, the long-term variability of this coupling remains unexplored. Here, using a combination of observations and multi-model ensemble forecasts dating back to the 1980s, we examine the global land exposure to higher than normal probabilities of concurrent hot temperature anomalies and drought on a monthly scale. Our findings confirm that drought substantially shapes the spatial distribution of heat-related risks on a global scale, offering a crucial predictive factor for these combined events. Traditionally, defining heat anomalies for non-adaptive systems involves fixed reference temperature thresholds. Using this method, our analysis reveals that the portion of global land experiencing drought-conditioned hot temperature anomalies has tripled in less than three decades. Surprisingly, the global level of spatial coupling appears to be declining. However, this outcome heavily depends on the specific definition of heat risk employed. By employing a time-dependent temperature threshold that considers changes in the climate's mean state due to both global warming and natural variability, a different picture emerges. Using the latter method, the level of spatial coupling demonstrates persistence and stability. Importantly, this method is better suited to assessing risks for adaptive systems and is more consistent with our current understanding of the underlying processes. Our study strongly advocates for tailoring hazard definitions to the specific processes and systems under investigation. Additionally, it underscores the pivotal role of operational sub-seasonal and seasonal forecasts in early warning systems, crucial for societal adaptation in the face of global warming.

How to cite: Zampieri, M., Ashok, K., Toreti, A., Bavera, D., and Hoteit, I.: On the stationarity of the global spatial dependency of heat risk on drought., EGU General Assembly 2024, Vienna, Austria, 14–19 Apr 2024, EGU24-16402, https://doi.org/10.5194/egusphere-egu24-16402, 2024.

EGU24-16456 | Orals | CL4.10

Advancements and Challenges in Assessing and Predicting the Global Carbon Cycle Variations Using Earth System Models 

Hongmei Li, Tatiana Ilyina, István Dunkl, Aaron Spring, Sebastian Brune, Wolfgang A. Müller, Raffaele Bernardello, Laurent Bopp, Pierre Friedlingstein, William J. Merryfield, Juliette Mignot, Michael O'Sullivan, Reinel Sospedra-Alfonso, Etienne Tourigny, and Michio Watanabe

The imperative to comprehend and forecast global carbon cycle variations in response to climate variability and change over recent decades and in the near future underscores its critical role in informing the global stocktaking process. Our study investigates CO2 fluxes and atmospheric CO2 growth through ensemble decadal prediction simulations using Earth System Models (ESMs) driven by CO2 emissions with an interactive carbon cycle. These prediction systems provide valuable insights into the global carbon cycle and, therefore, the variations in atmospheric CO2. Assimilative ESMs with interactive carbon cycles effectively reconstruct and predict atmospheric CO2 and carbon sink evolution. The emission-driven prediction systems maintain comparable skills to conventional concentration-driven methods, predicting 2-year accuracy for air-land CO2 fluxes and atmospheric CO2 growth, with air-sea CO2 fluxes exhibiting higher skill for up to 5 years. Our multi-model predictions for the next year, along with assimilation reconstructions, for the first time contribute to the Global Carbon Budget 2023 assessment. We plan regular updates and the involvement of more ESMs in future assessments. Ongoing efforts include implementing seasonal-scale predictions for skill improvement. Furthermore, we assess uncertainty contributions to CO2 flux and growth predictions, revealing the comparable impacts of internal climate variability and diverse model responses, particularly at a lead time of 1-2 years. Notably, the effect of CO2 emission forcing rivals internal variability at a 1-year lead time. Large uncertainties in CO2 responses to initial states of ENSO are observed, stemming from both model responses and internal variability. The challenge lies in addressing the scarcity and uncertainty of data for initialization and obtaining precise external forcings to enhance the reliability of predictions. The further advancements involve not only addressing comprehensive bias correction but also implementing statistical methods to enhance dynamical predictions.

How to cite: Li, H., Ilyina, T., Dunkl, I., Spring, A., Brune, S., Müller, W. A., Bernardello, R., Bopp, L., Friedlingstein, P., Merryfield, W. J., Mignot, J., O'Sullivan, M., Sospedra-Alfonso, R., Tourigny, E., and Watanabe, M.: Advancements and Challenges in Assessing and Predicting the Global Carbon Cycle Variations Using Earth System Models, EGU General Assembly 2024, Vienna, Austria, 14–19 Apr 2024, EGU24-16456, https://doi.org/10.5194/egusphere-egu24-16456, 2024.

EGU24-16842 | Posters on site | CL4.10 | Highlight

Exploring Sources of Multi-year Predictability of Terrestrial Ecosystem 

June-Yi Lee, Yong-Yub Kim, and Jeongeun Yun

The demand for decision-relevant and evidence-based near-term climate information is increasing. This includes understanding and explaining the variability and changes in ecosystems to support disaster management and adaptation choices. As climate prediction from seasonal to decadal (S2D) expands to encompass Earth system dimensions, including terrestrial and marine ecosystems, it is crucial to deepen our scientific understanding of the long-term predictability sources for ecosystem variability and change. Here we explore to what extent terrestrial ecosystem variables are driven by large-scale - potentially predictable -climate modes of variability and external forcings or whether regional random environmental factors are dominant. To address these issues, we utilize a multi-year prediction system based on Community Earth System Model version 2 (CESM2).  The system consists of 50-member uninitialized historical simulations, 20-member ocean assimilations, and 20-member hindcast initiated from every January 1st integrating for 5 years from 1961 to 2021. The key variables assessed are surface temperature, precipitation, soil moisture, wildfire occurrence, and Gross Primary Productivity. Our results suggest that land surface processes and ecosystem variables over many parts of the globe can be potentially predictable 1 to 3 years ahead originating from anthropogenic forced signals and modes of climate variability, particularly El Nino and Southern Oscillation and Atlantic Multi-decadal variability. These global modes of climate variability shift regional temperature and precipitation patterns, leading to changes in soil moisture, wildfire occurrence, and terrestrial productivity.  

How to cite: Lee, J.-Y., Kim, Y.-Y., and Yun, J.: Exploring Sources of Multi-year Predictability of Terrestrial Ecosystem, EGU General Assembly 2024, Vienna, Austria, 14–19 Apr 2024, EGU24-16842, https://doi.org/10.5194/egusphere-egu24-16842, 2024.

EGU24-18766 | Orals | CL4.10

Deciphering Prediction Windows of Opportunity: A Cross Time-Scale Causality Framework   

Stefano Materia, Constantin Ardilouze, and Ángel G. Muñoz

While subseasonal forecasts often exhibit limited skill across mid-latitudes, occasional improvements are observed in specific locations during certain periods, known as "windows of opportunity." Understanding the causal factors behind these windows is complex due to the diverse and interdependent nature of predictors, their spatial and temporal variability, and the challenges in establishing causality relationships. 

Traditional lagged-correlations methods provide only a partial view, lacking insights into causality. Based on previous work on the role of land surface processes, multi-model subseasonal model skill assessment and the use of causality metrics in predictions across timescales (e.g. Ardilouze et al., 2020, 2021; Materia et al 2020, 2022; Muñoz et al., 2023), here we propose an approach based on the Liang-Kleeman information flow, allowing the assessment of statistically significant causal links across various lead times.

Applied to reforecast and reanalysis data, our framework successfully identifies significant predictability drivers -involving sea-surface temperatures, atmospheric circulation and remote and local land-surface processes-, revealing their interference (interplay), evolving patterns and prevalence from seasonal to subseasonal scales. 

Furthermore, the comparison between reanalysis and reforecast results aids in assessing the capability of models to capture these causality features, suggesting additional ways to conduct model diagnostics. We illustrate here the theoretical background by showcasing the causal factors influencing a window of opportunity identified from a multimodel subseasonal reforecast.


References

Ardilouze, C., Materia, S., Batté, L., Benassi, M., & Prodhomme, C. (2020). Precipitation response to extreme soil moisture conditions over the Mediterranean. Climate Dynamics, 1, 1–16. https://doi.org/10.1007/S00382-020-05519-5/TABLES/2

Ardilouze, C., Specq, D., Batté, L., & Cassou, C. (2021). Flow dependence of wintertime subseasonal prediction skill over Europe. Weather and Climate Dynamics, 2(4), 1033-1049. https://doi.org/10.5194/wcd-2-1033-2021 

Materia, S., Muñoz, Á. G., Álvarez-Castro, M. C., Mason, S. J., Vitart, F., & Gualdi, S. (2020). Multi-model subseasonal forecasts of spring cold spells: potential value for the hazelnut agribusiness. Weather and Forecasting. https://doi.org/10.1175/waf-d-19-0086.1 

Materia, S., Ardilouze, C., Prodhomme, C., & et al. (2022). Summer temperature response to extreme soil water conditions in the Mediterranean transitional climate regime. Climate Dynamics, 58, 1943–1963. https://doi.org/10.1007/s00382-021-05815-8

Muñoz, Á. G., Doblas-Reyes, F., DiSera, L., Donat, M., González-Reviriego, N., Soret, A., Terrado, M., & Torralba, V. (2023). Hunting for “Windows of Opportunity” in Forecasts Across Timescales? Cross it. EGUGA, EGU-15594. https://doi.org/10.5194/EGUSPHERE-EGU23-15594 

How to cite: Materia, S., Ardilouze, C., and Muñoz, Á. G.: Deciphering Prediction Windows of Opportunity: A Cross Time-Scale Causality Framework  , EGU General Assembly 2024, Vienna, Austria, 14–19 Apr 2024, EGU24-18766, https://doi.org/10.5194/egusphere-egu24-18766, 2024.

OS2 – Coastal Oceans, Semi-enclosed and Marginal Seas

EGU24-38 * | ECS | Orals | OS2.1 | Highlight

Warm saltwater inflows strengthen oxygen depletion in the western Baltic Sea 

Leonie Barghorn, H. E. Markus Meier, Hagen Radtke, and Thomas Neumann

The Baltic Sea is one of the coastal seas worldwide that suffer most strongly from hypoxia. With its pronounced haline stratification, the Baltic Sea is naturally prone to oxygen deficiency, but the strong growth of hypoxic and anoxic regions since the middle of the 20th century was mainly driven by eutrophication due to large nutrient inputs from anthropogenic sources. Since the oxygen solubility is lower in warmer water and oxygen consumption rates are higher, increasing water temperatures due to climate change are expected to worsen oxygen conditions in the future. Today, the effects of warming are still considered minor compared to those of the high nutrient loads. However, we show, by analyzing 159-years long hindcast simulations of the Baltic Sea with three different models, that exceptionally high temperatures in certain parts of the western Baltic Sea additionally deteriorated the oxygen conditions during the course of the 20th century on an interannual scale. These high temperatures were not mainly caused by global warming but by a shift in the seasonality of saltwater inflows from the North Sea, namely an increase in warm summer and early autumn inflows and a decrease in colder winter inflows. This we can conclude from comparing the reference simulations with a sensitivity experiment that excludes global warming. Hence, we identify a new driver of hypoxia in the western Baltic Sea.

How to cite: Barghorn, L., Meier, H. E. M., Radtke, H., and Neumann, T.: Warm saltwater inflows strengthen oxygen depletion in the western Baltic Sea, EGU General Assembly 2024, Vienna, Austria, 14–19 Apr 2024, EGU24-38, https://doi.org/10.5194/egusphere-egu24-38, 2024.

EGU24-688 * | ECS | Orals | OS2.1 | Highlight

Satellite and High-Spatio-Temporal Resolution Data Collected by Southern Elephant Seals Allow an Unprecedented 3D View of the Argentine Continental Shelf 

Melina M. Martinez, Laura A. Ruiz-Etcheverry, Martin Saraceno, Anatole Gros-Martial, Julieta Campagna, Baptiste Picard, and Christophe Guinet

High spatial and temporal resolution hydrographic data collected by Southern Elephant Seals (Mirounga leonina, SESs) and satellite remote sensing data allow a detailed oceanographic description of the Argentine Continental Shelf (ACS). In-situ data were obtained from the CTD (Conductivity, Temperature, and Depth), accelerometer, and hydrophone sensors attached to five SESs that crossed the ACS between the 17th and 31st of October 2019. The analysis of the temperature (T) and salinity (S) along the trajectories allowed us to identify two different regions: north and south of 42°S. Satellite Sea Surface Temperature (SST) data suggests that north of 42°S, warm waters are coming from the San Matias Gulf (SMG). The high spatio-temporal resolution of the in-situ data shows regions with intense gradients along the T and S sections that were associated with a seasonal front that develops north of Península Valdés in winter due to the entrance of cold and fresh water to the SMG. The speed of the SESs is correlated with tidal currents in the coastal portion of the northern region, which is in good agreement with the macrotidal regime observed. A large number of Prey Catch Attempts (PCA), a measure obtained from the accelerometer sensor, indicates that SESs also feed in this region, contradicting suggestions from previous works. The analysis of wind intensity estimated from acoustic sensors allowed us to rule out the local wind as the cause of fast thermocline breakups observed along the SESs trajectories. Finally, we show that the maximum depth reached by the elephant seals can be used to detect errors in the bathymetry charts. Results presented have been accepted for publication in Remote Sensing

How to cite: Martinez, M. M., Ruiz-Etcheverry, L. A., Saraceno, M., Gros-Martial, A., Campagna, J., Picard, B., and Guinet, C.: Satellite and High-Spatio-Temporal Resolution Data Collected by Southern Elephant Seals Allow an Unprecedented 3D View of the Argentine Continental Shelf, EGU General Assembly 2024, Vienna, Austria, 14–19 Apr 2024, EGU24-688, https://doi.org/10.5194/egusphere-egu24-688, 2024.

EGU24-1931 | ECS | Orals | OS2.1

Resuspended sediment exchange between the north and south Yellow Sea in the north of Chengshantou 

Bowen Li, Xiongxue Jun, Baichuan Duan, Daolong Wang, and Long Yu

Due to the regional differences between the North and South Yellow Sea, and under the influence of winter winds, the relative changes of the coastal current and the Yellow Sea warm current will lead to the instability of the front, which will lead to the cross-front transport of sediment. Therefore, the study of sediment exchange between the North and South Yellow Sea has become an indispensable part of the study of the Yellow Sea environment. In this paper, the current field and sediment concentration in the sorthern part of Chengshantou, a representative area of the Yellow Sea, were observed in winter in order to analyze the sediment exchange process between the North Yellow Sea and the South Yellow Sea in winter. The results show that in the north of Chengshantou sea area in winter, the current velocity does not change with the water depth when the water depth is more than 20 m, and the variation range is less than 5 cm/s, and the tides are regular semi-diurnal tides. The resuspension of sediments in the sea area is not controlled by the current velocity, but the sediment transport per unit width is mainly affected by the current velocity. Under the Shandong peninsula coastal current effect, suspended sediment is mainly transported from the north Yellow Sea to the South Yellow Sea, and the total difference between the southward and northward sediment is 442500 NTU×m2 during the observation period of about one month. The largest two-day transport volume accounted for 41.2% of the total transport flux.

How to cite: Li, B., Jun, X., Duan, B., Wang, D., and Yu, L.: Resuspended sediment exchange between the north and south Yellow Sea in the north of Chengshantou, EGU General Assembly 2024, Vienna, Austria, 14–19 Apr 2024, EGU24-1931, https://doi.org/10.5194/egusphere-egu24-1931, 2024.

EGU24-2244 | Posters on site | OS2.1

Characteristics of Offshore Currents at Taiwan Ocean Energy Test Site 

Chung-Ru Ho, Yi-Chung Yang, and Kai-Ho Cheng

There is an offshore ocean energy test site in the northeastern waters of Taiwan. To understand the local ocean currents, a bottom-mount acoustic Doppler current profile (ADCP) was set up at a water depth of about 30 meters near the coast to measure the nearshore ocean current profiles. This ADCP also contains temperature and pressure sensors. The first measurement period was made from June 6, 2023 to July 18, 2023. After the data was downloaded, the ADCP was deployed back to the same location and is still being measured. Measurements were ensembled using 50 pings every 10 minutes, outputting one layer per meter of depth. The measurement data were analyzed by the harmonic method. The result shows that although the sea level in this area is dominated by the M2 tide, the tidal current is led by the M4 tide, followed by the M2 tide. M4 tides are caused by non-linear effects in shallow waters. The tidal ellipse shows that the semi-major axis and the inclination are 10.04 cm s-1 and 89.98°, respectively for the M4 tide and 5.35 cm s-1 and 86.18° for the M2 tide on the surface layer. Therefore, the main direction of the tidal current is north-south. However, sea surface current statistics show that most of the flow direction is north-northwest, which is different from the main direction of the tidal current. After checking the wind data from nearby weather stations, the wind direction during the measurement period was mainly easterly, with an average wind speed of about 3 m s-1. The effect of wind on surface current velocity at this latitude is approximately 1% of the wind speed, resulting in a westward surface velocity of approximately 3 cm s-1. Combining M4 and M2 tidal currents with wind-driven current, the results are in good agreement with the observations.

How to cite: Ho, C.-R., Yang, Y.-C., and Cheng, K.-H.: Characteristics of Offshore Currents at Taiwan Ocean Energy Test Site, EGU General Assembly 2024, Vienna, Austria, 14–19 Apr 2024, EGU24-2244, https://doi.org/10.5194/egusphere-egu24-2244, 2024.

EGU24-2424 | ECS | Orals | OS2.1

Three-dimensional Structures of Internal Solitary Waves in the Northern South China Sea Revealed by Mooring Array Observations 

Yunchao Yang, Xiaodong Huang, Chun Zhou, Zhiwei Zhang, Wei Zhao, and Jiwei Tian

The data collected from an array of five subsurface moorings, which are deployed along the direction of internal solitary wave (ISW) crests in the northern South China Sea (SCS) from October 2013 to June 2014, are used to investigate the three-dimensional structures of ISWs and their temporal variabilities. The measurements reveal that the ISWs are asymmetric along their crests, with the average amplitude in the southern portion being 70% larger than that in the northern portion. The observed three-dimensionally integrated energy and flux of ISWs are accurately calculated for the first time, reaching 53 TJ and 0.82 GW, respectively, on average. Over the whole observation period, the pattern of ISW crests was dominantly convex, accounting for 76.2% of all observed episodes. However, due to the changes in propagation speeds along the direction of ISW crests caused by either single or combined effects of mesoscale eddies and intruded Kuroshio, the ISW crests could deform into S-shaped and concave patterns, which accounted for 19.6% and 4.2%, respectively. Moreover, during November and December, the positions of the largest amplitude along ISW crests mostly shifted from the southern portion to the northern portion due to the energy refraction caused by mesoscale eddies, leading to the increase/decrease in wave intensity in the northern/southern portion. In early February, the intruded Kuroshio remarkably shifted ISW energy southward, which increased the wave amplitude in the southern portion by as much as 96%. These results clearly demonstrate that the intensities of three-dimensional ISWs could temporally vary out of phase between the northern and southern portions of crests due to the remarkable modulations by intense background processes.

How to cite: Yang, Y., Huang, X., Zhou, C., Zhang, Z., Zhao, W., and Tian, J.: Three-dimensional Structures of Internal Solitary Waves in the Northern South China Sea Revealed by Mooring Array Observations, EGU General Assembly 2024, Vienna, Austria, 14–19 Apr 2024, EGU24-2424, https://doi.org/10.5194/egusphere-egu24-2424, 2024.

EGU24-3946 | ECS | Orals | OS2.1

Characteristics of salinity-controlled submesoscale fronts in the Bay of Bengal and their impact on the upper ocean 

Wei Duan, Xuhua Cheng, Yifei Zhou, and Jonathan Gula

This study investigates the characteristics of salinity-controlled submesoscale fronts in the Bay of Bengal (BoB), based on a high resolution model output (MITgcm LLC4320). Large horizontal gradients of temperature, salinity, and density are found in the northern bay, with salinity and density gradients being notably more pronounced than those of temperature. Density fronts in this region are controlled by salinity rather than temperature due to the amount of freshwater input. Salinity fronts are most often compensated by temperature in the upper ocean of the BoB, especially at small scales. Fronts are classified into 4 types based on the value of the Turner angle. Among them, the salinity-controlled fronts compensated by temperature play a leading role in the northern BoB from October to March, while salinity-controlled fronts reinforced by temperature become equally numerous during the rest of the year. Heat fluxes significantly affect the temporal variations of temperature compensated versus reinforced fronts, while freshwater fluxes only play a minor role. When compensated fronts get arrested, warm water sinks beneath the cool water, favoring the formation of a temperature inversion layer and a barrier layer.

How to cite: Duan, W., Cheng, X., Zhou, Y., and Gula, J.: Characteristics of salinity-controlled submesoscale fronts in the Bay of Bengal and their impact on the upper ocean, EGU General Assembly 2024, Vienna, Austria, 14–19 Apr 2024, EGU24-3946, https://doi.org/10.5194/egusphere-egu24-3946, 2024.

EGU24-4119 | ECS | Orals | OS2.1 | Highlight

Ocean boundary pressures: Its significance and sensitivities 

Andrew Styles, Emma Boland, and Chris Hughes

The measurement and theoretical interpretation of circulations is often complicated by the abundance of eddies in the global ocean. However, when considering ocean pressure on the continental boundaries, the system of large-scale circulations can simplify drastically. As part of the OceanBound project, we demonstrate how this deliberately narrow view on the ocean can describe the fundamental aspects of ocean dynamics. Once the interpretative power of boundary pressures is established, we will present early results from an adjoint model (ECCO) to determine the remote and local physical processes which influence the boundary pressure signals. Adjoint models effectively run “backwards” as they relate ocean behaviours to physical causes in the past via automatic differentiation. If the final adjoint study can identify a manageable number of “control points” where specific forcing determines boundary pressures (therefore constraining global circulation) then this will help simplify conceptual models of the global ocean. Such a result would highlight the essential ocean processes for climate projections and produce a core vocabulary for interpreting ocean dynamics.

How to cite: Styles, A., Boland, E., and Hughes, C.: Ocean boundary pressures: Its significance and sensitivities, EGU General Assembly 2024, Vienna, Austria, 14–19 Apr 2024, EGU24-4119, https://doi.org/10.5194/egusphere-egu24-4119, 2024.

EGU24-5127 | ECS | Orals | OS2.1

Sensitivity of salt intrusion in estuarine networks to geometry using an idealised model  

Bouke Biemond, Huib E. de Swart, and Henk A. Dijkstra

 Salt intrusion in estuaries threatens freshwater availability and agriculture in coastal regions. The geometries of most estuaries are heavily anthropogenically modified, for instance for shipping, land reclamation and flood protection. The response of the salt intrusion to modifications of the geometry is thoroughly studied for single channel estuaries. However, a significant fraction of earths estuaries consists of a network of channels, in which the dynamics are more complex, because it includes the distribution of water and salt at branching points. We aim to identify, quantify, and understand the differences in response to changes in the geometry occurring in estuarine networks compared to salt intrusion in single channel estuaries. To achieve this, we have developed an idealized width-averaged model, which solves for hydrodynamics and salt intrusion in an estuarine network. The advantages of this model are that it is flexible in its geometry and has a short runtime. The Rhine-Meuse Delta (the Netherlands) is taken as a reference case. A set of simulations using different geometries is performed with the calibrated model. An example of a result which we obtained is that channel deepening increases salt intrusion locally, but decreases salt intrusion elsewhere in the channel network. These results give insights in the vulnerability of salt intrusion in estuarine channel networks.

How to cite: Biemond, B., de Swart, H. E., and Dijkstra, H. A.: Sensitivity of salt intrusion in estuarine networks to geometry using an idealised model , EGU General Assembly 2024, Vienna, Austria, 14–19 Apr 2024, EGU24-5127, https://doi.org/10.5194/egusphere-egu24-5127, 2024.

EGU24-5505 | ECS | Posters on site | OS2.1

Blade dynamics and wave dissipation in orthogonal wave-current conditions 

Zichen Xu and Jiarui Lei

Introduction

Aquatic vegetation has drawn attention as a promising nature-based solution for coastal protection due to its diverse functions, such as sequestrating carbon and reducing coastal erosion by attenuating incoming waves. Evaluating the effectiveness of and understanding the physics behind nature-based solutions requires knowledge of the dynamics of aquatic vegetation under coastal flows. Wave dissipation over rigid vegetation has long been noted and investigated. Flexible vegetation will reconfigure with flows and behave differently from rigid vegetation, thus leading to different wave-damping models. The motion of flexible vegetation will reduce frontal area and the relative velocity between vegetation and flows, thus leading to the decrease of drag force that acts on flows. Effective blade length, le, defined as the length of a rigid blade that experiences the same drag force as a flexible blade of length, has been applied to describe the dynamics of flexible blades in currents and waves (Luhar and Nepf, 2011; Luhar and Nepf, 2016). The ratio between le and l was found to scale with the dimensionless parameter Cauchy number (Ca), the ratio of hydrodynamic drag to the restoring force due to blade stiffness, and blade length ratio (L), the ratio of l to wave excursion, Aw. The framework of le was then extended to co-directional wave-current studies (Beth Schaefer and Nepf, 2022; Lei and Nepf, 2019; Schaefer, 2024). To date, vegetation dynamics under orthogonal wave-current conditions (i.e., the current is perpendicular to the direction of wave propagation), which usually correspond to wave-induced longshore currents near the coast, have not yet emerged.

Objectives and scopes

The focus of this study is to address the scientific challenge of understanding the behavior of flexible vegetation, considering orthogonal wave-current conditions. Our research enhances the existing body of work through several novel contributions.

  • Direct measurement of the drag force of a single flexible blade will be conducted to understand the scaling law of le under orthogonal wave-current conditions.
  • A numerical model of the dynamics of a single flexible blade will be extended to orthogonal wave-current conditions.
  • An analytical model of wave dissipation by vegetation under orthogonal wave-current conditions is developed by incorporating the current-to-wave velocity ratio into the existing model.
  • Wave damping over a meadow of vegetation experiments under orthogonal wave-current conditions will be conducted to validate the analytical wave decay model.

Experimental methods

Laboratory experiments will be conducted in a wave basin that can generate orthogonal wave-current flows. the EPDM rubber rods will be used as the representative of flexible vegetation. Two individual vegetation shoots will be attached to two submersible force transducers which are fixed at a customized pyramid in directions that are perpendicular to each other. The drag force at wave propagation and current direction will be measured. The normalized effective length (le/l) is determined by comparing the measured drag force with the force measured on a rigid reference shoot of identical geometry to the original length. The relationship between le/l and the dimensionless parameters, Ca, L, and uc/uw (current-to-wave velocity ratio) will then be analyzed.

How to cite: Xu, Z. and Lei, J.: Blade dynamics and wave dissipation in orthogonal wave-current conditions, EGU General Assembly 2024, Vienna, Austria, 14–19 Apr 2024, EGU24-5505, https://doi.org/10.5194/egusphere-egu24-5505, 2024.

EGU24-6847 | Posters on site | OS2.1

Circulation in the Guafo Mouth: the gateway to northern Patagonia 

Lauren Ross, Ivan Perez-Santos, Pamela Linford, and Patricio Diaz

Circulation and exchange are important factors governing material transport in all coastal areas. One  such area is Northern Chilean Patagonia, a region that boasts one of the largest aquaculture industries (salmon and mussel farming) in the world and provides habitat for several protected marine mammal species. Linkages between coastline shape and forces of hydraulic conditions are thereby important considerations when understanding constituent concentrations related to water quality issues such as harmful algal blooms (HABs), which threaten aquaculture activities and endanger wildlife and humans. The research presented here characterizes circulation patterns and variability in the Guafo Mouth, the primary connection between the Pacific Ocean and the fjords and channels of Northern Chilean Patagonia, to help inform ocean-fjord circulation in this ecologically and economically important area. In situ measurements of current velocities, salinity, temperature, dissolved oxygen, and nutrients have been collected for over two years at point measurements in the channel. These data, along with companion numerical model output and reanalysis data, provide parallel evidence of subtidal flows driven by a combination of barotropic and baroclinic pressure gradients and Coriolis, indicating a geostrophic balance. Depending on the sign of the barotropic pressure gradient, the barotropic flow either augmented (when positive) or opposed (when negative) the gravitational circulation produced by horizontal gradients in density and, in certain cases, produced subtidal outflow throughout the water column. Temporal variability of the current velocities was driven by changes in sea level gradients at ~35 d and ~50 d, linked to coastal trapped waves forced by the Madden Julian Oscillation. This variability has implications for the ocean-fjord exchange of dissolved oxygen and nutrients, which are critical to the health of the Chilean Inland Seas. Near-bottom waters with high nutrient content and low dissolved oxygen are advected in-channel when the crest of a coastal trapped wave is at the coast of Northern Patagonia due to enhanced subtidal inflows. These results highlight the importance of understanding the periodicity and amplitude of remotely forced coastal trapped waves to estimate ocean-fjord exchange through the gateway to northern Patagonia.

How to cite: Ross, L., Perez-Santos, I., Linford, P., and Diaz, P.: Circulation in the Guafo Mouth: the gateway to northern Patagonia, EGU General Assembly 2024, Vienna, Austria, 14–19 Apr 2024, EGU24-6847, https://doi.org/10.5194/egusphere-egu24-6847, 2024.

Typhoon is a synoptic phenomenon that has significant impact on ocean. Mooring observations of nearly the full water column on the continental slope in the South China Sea revealed the ocean's response to Typhoon Mangkhut (2018). Mangkhut induced sea surface cooling ∼4°C that was biased to the right side of its track, which recovered with an e-folding time after approximately 1 week.  Mangkhut was a relatively fast-moving typhoon and caused a fast near-inertial response throughout the entire depth in its lee. The typhoon-induced upper ocean (deep-water) near-inertial current velocities were >1.5 m/s (∼0.08 m/s), with an e-folding time of approximately a week (2 weeks) and frequency of 1.04f (1.08f, where f is the local inertial frequency). The near-inertial currents were near-circular polarized in the upper ocean and near-rectilinear polarized with the main axis in the across-slope direction in deep water. The deep-water near-inertial waves amplified the vertical excursions of isotherms from ∼120 to ∼200 m, reduced the stratification, elevated vertical current shears, and enhanced turbulent dissipation rate, especially during 14–17 September when the effects of near-inertial waves and diurnal spring tides overlapped. A net cooling ∼0.15°C and salinity increase ∼0.05 psu were observed in the deep ocean after Mangkhut. Typhoon-induced near-inertial waves correspond to the intensification of southwestward along-slope mean near-bottom currents. This study indicates the immediate influence of typhoon in deep-water and contribute to the bottom mixing on the continental slope.

How to cite: Zhang, H.: Ocean Response to Typhoon Mangkhut (2018) on a Continental Slope in the South China Sea, EGU General Assembly 2024, Vienna, Austria, 14–19 Apr 2024, EGU24-6909, https://doi.org/10.5194/egusphere-egu24-6909, 2024.

EGU24-7482 | Posters on site | OS2.1

Simulating dissolved oxygen in the oceans – perspectives for the Baltic Sea 

Ulrike Löptien, Heiner Dietze, Birgit Schneider, Matthias Renz, and Rolf Karez
An increasing number of dead zones characterised by toxically-low levels of dissolved oxygen has been reported in coastal oceans all over the globe. Efforts towards respective quantitative descriptions are ongoing but numerical simulations and predictions of hypoxia remain challenging. In this study, we present a suite of generic approaches towards more reliable simulations.
Along a test-case we showcase the coalescence of a suite of ultra-high (~ 100m horizontal) resolution general ocean circulation model of Eckernförde Bight (Baltic Sea) with machine learning approaches. The ocean model includes an elementary representation of the biogeochemical dynamics of dissolved oxygen. In addition, we integrate artificial “clocks” that measure the residence time of the water in Eckernförde Bight and the timescales of (surface) ventilation. Our approach starts with an ensemble of hindcast model simulations (covering the period from 2000 to 2018) designed to envelop a range of poorly known model parameters for vertical background mixing (diffusivity) and local oxygen consumption within Eckernförde Bight. In a subsequent step, feed-forward artificial neural networks trained with output from the model ensemble are put to work to identify predictors of hypoxia deep in Eckernförde Bight based on data at a monitoring site at the entrance of the bight. Our approach disentangles the relative importance of subduction and vertical mixing versus local oxygen consumption and the inflow of low-oxygenated waters from the Kiel Bight.

How to cite: Löptien, U., Dietze, H., Schneider, B., Renz, M., and Karez, R.: Simulating dissolved oxygen in the oceans – perspectives for the Baltic Sea, EGU General Assembly 2024, Vienna, Austria, 14–19 Apr 2024, EGU24-7482, https://doi.org/10.5194/egusphere-egu24-7482, 2024.

EGU24-7695 | Posters on site | OS2.1

Persistent Carbon Sink at the Ieodo Ocean Research Station in the East China Sea 

Kitack Lee, Ja-Myung Kim, Gyeong-Seok Lee, Kwang-Young Jeong, and Hyun-Ju Oh

 Unlike major ocean basins, the role of coastal and marginal seas as an anthropogenic CO2 reservoir has been less studied. Using discrete surface measurements between Ieodo and Jeju Island (2015–2023) and continuous measurements at Ieodo (seasonal coverage for 2017–2019 and the year-round coverage for 2020–2023), we concluded that an increase in phytoplankton biomass from April to mid-August equalized much of the temperature-driven increase in the surface pCO2 and thus made the Ieodo Ocean Research Station a moderate sink of CO2. From November to March, both a large pCO2 reduction driven by a temperature reduction and a high air–sea CO2 exchange rate because of high windspeeds transformed the basin into a substantial CO2 sink, yielding an annual net C uptake of 61.7 g C m–2 yr–1. The present study provides observational evidence for confirming a mechanism in the shallow waters of the continental shelves accumulating a significant amount of CO2, via reinforced cooling and promoted biological CO2 uptake, to be transported from surface waters of the basin to the interior of the adjacent East Sea deep ocean.

How to cite: Lee, K., Kim, J.-M., Lee, G.-S., Jeong, K.-Y., and Oh, H.-J.: Persistent Carbon Sink at the Ieodo Ocean Research Station in the East China Sea, EGU General Assembly 2024, Vienna, Austria, 14–19 Apr 2024, EGU24-7695, https://doi.org/10.5194/egusphere-egu24-7695, 2024.

EGU24-7736 | Posters on site | OS2.1

Water temperature dynamics and influencing factor analysis in Yangtze Estuary, China 

Leihua Zhao and Pei Xin

Estuaries are located at the interface between terrestrial and marine environments, and they are valuable aquatic ecosystems. Water temperature is an important environmental factor affecting estuarine ecosystems. Atmospheric, riverine, and marine forcings govern water temperature dynamics in estuaries. Given the complex hydrodynamic conditions (e.g., tides, waves, and runoff) in estuarine environments, it is still a challenge to well understand estuarine water temperature distributions and variations at different spatial and temporal scales. Recently, many methods (e.g., numerical modeling, remote sensing, and field observation) have been applied in studies of estuarine water temperature dynamics. The main objective of this study is to investigate water temperature dynamics and associated influencing factors in the Yangtze Estuary. The used methods are introduced in detail, including the data collection and model setup (i.e., the Delft3D model). Then, the distributions of estuarine water temperature, variations in heat flux, and contributions of influencing factors to estuarine water temperature variations are analyzed. In addition, the roles of influencing factors in estuarine water temperature, implications for estuarine ecosystems, and limitations of this study are discussed. We hope this study can advance understanding of estuarine water temperature dynamics and provide implications for management of estuarine ecosystems.

How to cite: Zhao, L. and Xin, P.: Water temperature dynamics and influencing factor analysis in Yangtze Estuary, China, EGU General Assembly 2024, Vienna, Austria, 14–19 Apr 2024, EGU24-7736, https://doi.org/10.5194/egusphere-egu24-7736, 2024.

EGU24-8206 | Posters on site | OS2.1

Towards an operational global coastal altimetry product: AltiCAP (ALTimetry Innovative Coastal Approach Product) 

Fabien Léger, Florence Birol, François Bignalet-Cazalet, Mathilde Cancet, Quentin Dagneaux, Jean-Alexis Daguze, Yannice Faugère, Ramiro Ferrari, Wassim Fkaier, Ergane Fouchet, Claire Maraldi, Fernando Niño, Marie-Isabelle Pujol, Ngan Tran, Pierre Thibaut, and Léna Tolu

Although spatial altimetry was originally developed for measurements on the open sea, it can be used in a coastal context, even though this type of use is far more complex. Part of the problem lies in the land contamination of radar observation in the last few kilometers from the coast. In the last few dozen kilometers approaching the coastline, this problem is further aggravated by the poor quality of some of the geophysical corrections applied. In view of the large number of altimetry applications, the international community and space agencies have been trying to resolve this issue for more than 15 years. Following extensive work and studies, a number of processing algorithms have been developed and a few experimental products have proposed.

In order to move towards the routine use of sea level altimetry measurements along the coastal strip on a global scale, we have conducted a Round Robin study aimed at comparing 25 algorithms used to calculate sea level anomalies (SLA) from altimetry in low resolution mode (LRM) and targeting the ocean region between 0 and 200 km from the coast. For each one, a significant number of diagnostics was carried out at global and regional levels. The most immediate outcome of this study is the new global AltiCAP altimetry product available on the AVISO+ portal since January 2024.

Note that the processing solution which was adopted is a compromise between:

  • The capability of each algorithm (correction or parameter) to provide the best SLA dataset over the entire strip between 0 and 200 km from the coast (and not necessarily in the most coastal zone) in order to guarantee continuity with the open ocean.

  • The availability of the correction or parameter on several altimetry missions.

  • A guarantee of product continuity in the future.

Integrated with the Jason-3 mission in the first instance, this high resolution (20Hz) altimetry product will rapidly include other missions in order to extend the use of the product in time and space, and ensure a long-term implementation. It is provided with different case studies in the form of Python notebooks. Its distribution will also be supported by training workshops for the international community (virtual schools).

How to cite: Léger, F., Birol, F., Bignalet-Cazalet, F., Cancet, M., Dagneaux, Q., Daguze, J.-A., Faugère, Y., Ferrari, R., Fkaier, W., Fouchet, E., Maraldi, C., Niño, F., Pujol, M.-I., Tran, N., Thibaut, P., and Tolu, L.: Towards an operational global coastal altimetry product: AltiCAP (ALTimetry Innovative Coastal Approach Product), EGU General Assembly 2024, Vienna, Austria, 14–19 Apr 2024, EGU24-8206, https://doi.org/10.5194/egusphere-egu24-8206, 2024.

Despite much academic progress and groundbreaking changes in thinking, research results on how sandy terrain forms its current profile shape and how it evolves in the short term based on the equilibrium profile state are minimal. In this study, based on the concept of wave phase potential, which was devised based on the equation of equilibrium beach profile in the surf zone, it is shown which type of beach profile is in equilibrium in the inflow of flat waves. In order to interpret the erosion problem caused by sea level rise on the basis of this concept, we will show how the beach profile responds to sea level rise. As a representative result, the beach retreat width due to sea level rise is given as a function of the dominant wave period and the beach scale factor (a factor obtainable from the sand grain size) as well as the sea level rise. This equation is compared to Bruun's proposal and also discusses the constraints in applying Bruun formula. The results of this study can provide a scientific basis for predicting how a seabed topography composed of sand can be formed or to reverse estimate the wave incident condition from the current landform and seabed conditions, as long as the inflow wave data and the sampled sand grain size data are available. Moreover, it shows how devastating the inundation erosion caused by sea level rise can be. It is time to judge how urgent it is to secure a coastal buffer zone behind this, and to hasten technical and policy responses to mitigate the damage caused by it. As an example of application, the sea level rise trend for the coast of the Korean Peninsula and the inundation erosion predicted for 2050, 2070 and 2100 for 350 beaches of the Korean Peninsula will be presented.

How to cite: Lee, J. L.: On the Equilibrium State of the Beach Profile Based on the Concept of Wave Phase Potential and Its Changes due to Sea Level Rise, EGU General Assembly 2024, Vienna, Austria, 14–19 Apr 2024, EGU24-9040, https://doi.org/10.5194/egusphere-egu24-9040, 2024.

EGU24-10528 | ECS | Orals | OS2.1

Wave-current interactions in a high-flow tidal channel 

Maricarmen Guerra, Alex E Hay, Nicolás Sagredo, and Aaron Acuña

High-flow tidal channels (Re~O(108)) are characterized by strong bidirectional currents (3 m/s) and high turbulence intensities. As in most coastal environments, these strong flows are affected by wind and waves, especially during severe weather events. The combined occurrence of strong currents and wind-generated surface gravity waves is a nonlinear coupled process in which both the currents and the incident wave field are modified. In this work, the evolution of mean wave parameters in a high-flow tidal channel is evaluated for various wave and tidal flow conditions. Synchronous current, turbulence, and surface altimeter data measured by a bottom-mounted acoustic Doppler current profiler (ADCP) deployed in Grand Passage, a tidal channel within the Bay of Fundy in eastern Canada, are analyzed. Results indicate that wave growth and wave propagation are coupled with the magnitude and relative direction of the current. During each measured high-wind event, the significant wave height consistently increased, and the wavelength decreased, as the current magnitude increased when locally generated waves opposed the currents. To the contrary, the significant wave height was drastically reduced when the waves follow the currents even for a small current magnitude. In addition, elevated turbulence kinetic energy and vertical plumes of elevated acoustic backscatter amplitude were observed in the upper water column during high-wind events, likely bubbles injected into the free surface by breaking waves (whitecaps) and transported through the water column by the turbulence generated by tidal currents. Obtained results allow to identify when and where wave-current interactions are significant, what their implications are for the complex dynamics of tidal channels, and suggest that currents must be incorporated into forecast wave models to improve local sea state predictions and consequently navigation safety.


How to cite: Guerra, M., Hay, A. E., Sagredo, N., and Acuña, A.: Wave-current interactions in a high-flow tidal channel, EGU General Assembly 2024, Vienna, Austria, 14–19 Apr 2024, EGU24-10528, https://doi.org/10.5194/egusphere-egu24-10528, 2024.

EGU24-11397 | ECS | Posters on site | OS2.1 | Highlight

Marine munition in coastal seas: High-resolution numerical simulations of munition-related contaminants 

Evridiki Chrysagi and Ulf Gräwe

After the Second World War, vast quantities of munitions were dumped in the world’s oceans. Over the years, the metal casings of these munitions have been corroded to the point where toxic substances such as TNT are continuously released into the seawater. The munition dumpsites are, therefore, hotspots of chemical pollution. However, predicting the distribution and spread of munition-related chemicals is challenging since (i) the associated dynamical processes are not well understood yet and (ii) some dumpsites are still unknown or poorly sampled. This study focuses on the Baltic Sea, which is estimated to contain more than 400,000 tons of conventional munitions, and particularly on the western Baltic Sea, a region with numerous documented or suspected dumpsites. We use high-resolution numerical simulations complemented by field measurements collected during several dedicated research campaigns to study the distribution and spread of munition-related contaminants. More than 45 virtual tracers have been released in the model to simulate the release of TNT from each contaminant source. Since the TNT release rates are unknown, we use inverse modeling and optimization techniques by combining the model results with the available observations. Thus, the simulated TNT is constrained, and we can obtain better estimates. Consistent with the observations, the simulated TNT distribution maps show elevated levels of TNT in the vicinity of the dumpsites. However, depending on the winds, the waves, and the ocean circulation, relatively high TNT levels are found throughout the western Baltic Sea. This indicates that this is not just a localized problem and that clearance operations are necessary to protect the marine environment. To further test the clearance strategies and prioritize the contaminant sources, we perform sensitivity experiments and construct risk maps.

How to cite: Chrysagi, E. and Gräwe, U.: Marine munition in coastal seas: High-resolution numerical simulations of munition-related contaminants, EGU General Assembly 2024, Vienna, Austria, 14–19 Apr 2024, EGU24-11397, https://doi.org/10.5194/egusphere-egu24-11397, 2024.

EGU24-12125 | ECS | Orals | OS2.1 | Highlight

The effects of a storm surge event on salt intrusion: Insights from the Rhine-Meuse Delta 

Avelon Gerritsma, Martin Verlaan, and Julie Pietrzak

The Rhine-Meuse Delta is a low-lying delta in the Netherlands that is subject to both significant salt intrusion events and storm surges. Typically, these events do not co-occur. Salt intrusion occurs in the summer months (June, July, August) during droughts, while the storm season runs from October till April. The increased sea water level during a storm surge can temporarily cause increased salt intrusion. Because of the short time scales and higher discharges, storm surges generally do not cause problems with freshwater availability, in contrast to summer droughts.  However, on December 5th 2013, a storm surge event caused a significant amount of salt water to intrude into the Rhine-Meuse Delta. This was followed by weeks of increased salinity in parts of the delta. We simulated the event using a 3D numerical model of the Rhine-Meuse Delta, to capture the dynamics of the system and to improve our understanding of salt intrusion during storm surges. The Rhine-Meuse Delta is a mixed wave tide dominated delta with two main branches. One of the branches, the New Waterway, has an open connection with the North Sea and is the main outlet of the River Rhine. The other branch, the Haringvliet, is closed off at low water by the Haringvliet Gates. The Haringvliet Gates were built as a storm surge barrier to protect against storm surges after the 1953 flood. In addition, they are routinely used to maintain stable water levels in the river branches for shipping and fresh water supply. During the 2013 storm surge event, the Haringvliet Gates were closed. However, sea water entered the Rhine-Meuse Delta via the Rotterdam Waterway, which effectively acted as a backdoor for salt intrusion into the Haringvliet. Consequently the Haringvliet basin stored the saltwater and delivered it to connected parts of the system in the weeks following. We will refer to this phenomenon as “basin salt reflux”. Uniquely our model captured the salinity dynamics of the system during the 2013 event. Both the modelled salinity peaks during the storm, as well as the higher salinities after the storm agreed with available observationsWe present new insights on the dynamics of a salt intrusion event triggered by a storm surge in a semi-enclosed coastal system. With climate change and sea level rise, these events will most likely occur more frequently in the future. This highlights the importance of fundamental understanding and advanced 3D modelling of salt intrusion in complex deltas during storm surges.

How to cite: Gerritsma, A., Verlaan, M., and Pietrzak, J.: The effects of a storm surge event on salt intrusion: Insights from the Rhine-Meuse Delta, EGU General Assembly 2024, Vienna, Austria, 14–19 Apr 2024, EGU24-12125, https://doi.org/10.5194/egusphere-egu24-12125, 2024.

EGU24-12222 | ECS | Orals | OS2.1

Total Exchange Flow and Mixing in a Tidally Driven Estuary 

Cristian Rojas, Lauren Ross, and Aldo Sottolichio

The exchange flow in estuaries is typically characterized by an inflow of salty water near the bottom and a surface outflow of brackish water, resulting from the mixing of river and ocean water. The exchange flow has been found to be a major driver of residence times and water quality conditions in estuarine systems and has also been found to influence biogeochemical processes such as hypoxia, nutrient fluxes, and the transport of contaminants. 
This study focuses on the spatial and temporal variability of exchange flow in a highly turbid and tidally-driven estuary located on the southwest coast of France, The Gironde. Stratification in the Gironde varies from well-mixed to partially stratified during low to high river flow conditions, respectively. Using validated numerical simulations, the exchange flow was calculated using the Total Exchange Flow (TEF) methodology under various river regimes. A mixing ratio was also quantified to assess the relative contribution of shear production to the salinity variance dissipation. Results show that the exchange flow in the Gironde is characterized by up to four salinity layers at the mouth reducing to two layers upstream. In addition, TEF outflow transport (Qout) increases slightly with river discharge, while the most substantial variability in Qout is due to along-channel variability in bathymetry and estuary width. The mixing ratio indicates that salinity variance dissipation was more influenced by the shear production than buoyancy near both the mouth and head of the estuary during spring tide. Towards the middle of the estuary, the ratio shows a weak contribution from the shear production whereas the mixing of salinity was high. During neap tide, the contribution of shear production to the salinity variance was elevated only downstream and mixing of salinity dominated. The next steps of this work will be to assess the impact of sediments on TEF and to compare the magnitude of the exchange flow in the Gironde to other systems globally.

How to cite: Rojas, C., Ross, L., and Sottolichio, A.: Total Exchange Flow and Mixing in a Tidally Driven Estuary, EGU General Assembly 2024, Vienna, Austria, 14–19 Apr 2024, EGU24-12222, https://doi.org/10.5194/egusphere-egu24-12222, 2024.

EGU24-12817 | Posters on site | OS2.1

Lagrangian transport in a multiple-inlet coastal system: the difference between using 3D and depth-averaged currents  

Matias Duran-Matute, Jeancarlo M. Fajardo-Urbina, Mart Giesbergen, Ulf Gräwe, Herman J.H. Clercx, and Theo Gerkema

Transport time scales in estuaries quantify the flushing of the system and are relevant quantities that help to monitor their local and system-wide functioning. Here, we elucidate and quantify the main differences on transport time scales and other related statistics when using passive particles advected by either 3D or depth-averaged currents in an estuarine system. We further relate these differences to the forcing, in particular, wind and freshwater discharge. The analysis is made in the Dutch Wadden Sea: an estuarine system of intertidal basins. Due to computational constraints when using high-resolution 3D currents, we consider two years with contrasting forcing conditions, which were selected after analysis of results based on depth-averaged currents over 36 years (1980-2015). During periods with strong southwesterly winds, mainly related to the stormy seasons (autumn-winter), similar values for the system-wide residence time are found when using 3D or depth-averaged currents. During periods with weak winds, mainly occurring during spring-summer, the residence time computed from depth-averaged currents overestimates the values from 3D currents up to 5-10 days. This was also the case for the anomalous winter of 1996, which is a famous period in the North Sea region due to its low temperatures and lack of strong southwesterly winds. During these weak-wind periods, the difference in the residence is positively correlated to the freshwater discharge. However, despite these observed differences, the temporal variability of the system-wide residence time in the Dutch Wadden Sea is well captured when using depth-averaged currents, i.e., larger residence time during weak wind conditions and smaller during strong wind conditions are observed when using either 3D or depth-averaged currents.

How to cite: Duran-Matute, M., Fajardo-Urbina, J. M., Giesbergen, M., Gräwe, U., Clercx, H. J. H., and Gerkema, T.: Lagrangian transport in a multiple-inlet coastal system: the difference between using 3D and depth-averaged currents , EGU General Assembly 2024, Vienna, Austria, 14–19 Apr 2024, EGU24-12817, https://doi.org/10.5194/egusphere-egu24-12817, 2024.

EGU24-12989 | Posters on site | OS2.1 | Highlight

 Observation of large volume change in the western Baltic Sea between September 2022 and February 2023 

Kaveh Purkiani, Kerstin Jochumsen, Jens-George Fischer, Kai Herklotz, and Tim Kruschke

Hydrographic data collected in the western Baltic Sea was used to study the hydrodynamics of the region between September 2022 and February 2023. The amount of volume change and salt transported into the Baltic Sea were quantified directly from observations and estimated using an operational model. Salinity, temperature, dissolved oxygen concentration, and current velocities were measured at several stations: Fehmarn Belt, Darss Sill, Arkona Basin, and Bornholm Basin. Using sea level height data, two large volume change events were identified. The events, characterized by saline (S>20 psu) and warm near-bottom water (up to 2°C warmer than the sea surface) with high dissolved oxygen concentration (> 6 ml l-1), were identified between 14 September and 10 October 2022, and 5 December 2022 and 15 January 2023. From September to October 2022, the first event transported 126 km3 of water into the Baltic Sea. Based on the salinity of the inflowing water, this corresponds to an estimated salt transport of about 0.55 Gt. The second event in December 2022-January 2023 transported approximately 140 km3 of water and carried 1.1 Gt of salt into the Baltic Sea. Both instances have exhibited remarkable warm water, categorizing them as significant warm water inflows into the western Baltic Sea. While the properties of the water column at the Darss Sill station did not show the typical characteristics of a major Baltic inflow (MBI) during either of the two events, the amount of salt transport, especially during the second inflow event, is equivalent to that of a weak MBI.

How to cite: Purkiani, K., Jochumsen, K., Fischer, J.-G., Herklotz, K., and Kruschke, T.:  Observation of large volume change in the western Baltic Sea between September 2022 and February 2023, EGU General Assembly 2024, Vienna, Austria, 14–19 Apr 2024, EGU24-12989, https://doi.org/10.5194/egusphere-egu24-12989, 2024.

EGU24-13538 | Posters on site | OS2.1

Large-scale climate variability behind the wave energy extremes in the Yellow Sea during an unusual season 

Dong Eun Lee, Hye-Ji Kim, Jeseon Yoo, and Haedo Baek

The Yellow Sea (YS) is exposed to various weather systems, such as typhoons, monsoon activities, and extratropical cyclones, which can pose  a major threat to the adjacent coastal regions through the development of powerful oceanic surface waves. Unusually severe surface wave events in the YS occur with considerable frequency during the boreal spring (March-April-May), but have received less attention compared to winter and summer. This study focuses on the characteristics of spring extreme wave events in the YS, based on observational and long-term reanalysis datasets. Our analysis shows that the extreme waves, defined as waves with a daily maximum height in the upper 5% of all springs, start to build up about 12 hours before the peak waves and continue for a longer period after the peak have been reached. During the extreme events, the Siberian High is found to extend anomalously eastward compared to spring climatology. Such an anomalous extension contributes to the increase of the sea level pressure gradient and the intensification of the surface wind speed in the YS. Meanwhile, in the range of 6~24 hours following the peaks of the extreme wave events in the YS, swells propagating from the far western North Pacific arrive in the YS. These swells from the western North Pacific, possibly generated by the same mesoscale system that has caused the extreme wave heights in the YS a few days in advance and has traveled northeastward, contribute to maintaining higher wave energy levels in the YS for longer after the atmospheric source has been removed. The large-scale environmental conditions can provide the predictability of extreme waves in the basin developed by these findings. Our analysis further reveals that more intense events tend to occur with eastward shift of the Siberian High, while the events occur more frequently with El Niños.  This study presents implications for assessing the risks associated with extreme waves in coastal regions and improving coastal management strategies in the YS.

How to cite: Lee, D. E., Kim, H.-J., Yoo, J., and Baek, H.: Large-scale climate variability behind the wave energy extremes in the Yellow Sea during an unusual season, EGU General Assembly 2024, Vienna, Austria, 14–19 Apr 2024, EGU24-13538, https://doi.org/10.5194/egusphere-egu24-13538, 2024.

EGU24-14102 | ECS | Orals | OS2.1

Variability of advection and dispersion due to tides and wind forcing in a multiple-inlet coastal system 

Jeancarlo Manuel Fajardo-Urbina, Matias Duran-Matute, Mart Giesbergen, Gert Vankan, Ulf Gräwe, J.H. Herman Clercx, and Theo Gerkema

We present results on the Lagrangian transport of water parcels in a multiple-inlet coastal system: the Dutch Wadden Sea. We performed realistic hydrodynamic numerical simulations spanning 36 years, which are coupled to a Lagrangian module. The aim is to relate the characteristics of Lagrangian transport to the forcing. For this, the displacement of clouds of passive Lagrangian particles representing water columns is split into its advective and dispersive components, with the latter mainly due to chaotic tidal stirring. Advection is defined as the displacement vector of the center of mass of patches of passive particles, and the dispersion is quantified by the covariance matrix of their positions. Both quantities are determined for each tidal cycle spanning the duration of the simulations. Maps of advection reveal mostly large-scale features (basin-scale), whereas the spatial distribution of dispersion shows the predominance of localized structures covering mostly the regions around the inlets and strong bathymetric gradients. A strong correlation is found between the wind and the system-wide advection, showing a marked annual periodicity attributed to the seasonality of the wind forcing, which is stronger during winter and autumn. On the other hand, the magnitude of the tides (especially, due to the spring-neap cycle) governs the magnitude of the dispersion, i.e. mixing in the system. However, an enhancement in dispersion is observed during a few storms.  

How to cite: Fajardo-Urbina, J. M., Duran-Matute, M., Giesbergen, M., Vankan, G., Gräwe, U., Clercx, J. H. H., and Gerkema, T.: Variability of advection and dispersion due to tides and wind forcing in a multiple-inlet coastal system, EGU General Assembly 2024, Vienna, Austria, 14–19 Apr 2024, EGU24-14102, https://doi.org/10.5194/egusphere-egu24-14102, 2024.

EGU24-15980 * | ECS | Posters on site | OS2.1 | Highlight

Sea bird foraging in a changing seascape 

Sophie-Berenice Wilmes, Peter Robins, Stephanie Harris, Charles Bishop, James Waggitt, Paul Fernandes, and Line Cordes

Sea birds in the Irish Sea are known to target tidal mixing fronts (the interfaces between seasonally stratified and mixed waters) as foraging grounds as these tend to be areas high in nutrients and primary productivity and thus, prey availability. However, little is known about the inter- and intraannual variability of the areas selected as foraging grounds by the sea birds. Here, using foraging locations derived from GPS tags on Manx shearwaters (Puffinus puffinus) and reanalysis oceanographic data and observational data collected from cruises, we evaluate which oceanographic features are targeted by the shearwaters on their foraging trips into the Irish Sea and how the characteristics of these frontal areas vary seasonally and interannually. Comparing a range of different physical measures to describe front locations, we show that the birds generally select interannually persistent marginally stratified (as defined by the potential energy anomaly) areas. Furthermore, we demonstrate that the features which are selected by the birds as foraging grounds vary over the course of summer months. Next, we use projections of future changes in shelf sea oceanography to highlight and discuss the consequences changing shelf sea stratification and physical features in the Irish Sea.

How to cite: Wilmes, S.-B., Robins, P., Harris, S., Bishop, C., Waggitt, J., Fernandes, P., and Cordes, L.: Sea bird foraging in a changing seascape, EGU General Assembly 2024, Vienna, Austria, 14–19 Apr 2024, EGU24-15980, https://doi.org/10.5194/egusphere-egu24-15980, 2024.

EGU24-16435 | Posters on site | OS2.1

Salt Intrusion in a salt wedge estuary under extreme drought conditions 

Julie Pietrzak, Marlein Geraeds, Tess Wegman, Avelon Gerritsma, Martin Verlaan, Caroline Katsman, Alex Horner Devine, Dave Ralston, Wouter Kranenburg, and Henk Dijkstra

Deltas are home to billions of people and are often highly developed and engineered systems. Extreme weather events such as droughts are a threat to deltas worldwide. During droughts salt can intrude far inland and threaten the drinking, agricultural and industrial water supply of many people. Under climate change the frequency of extreme events is expected to increase and the threat of salt intrusion may intensify. Here we use data and models to explore salt intrusion in the Rhine-Meuse Delta (RMD) during the severe European drought in the summer of 2022. The RMD is one of the most highly managed deltas in the world, with numerous interconnected waterways and an open connection to the sea at the mouth of the Rotterdam Waterway. The outflow of the Rhine River through the Rotterdam Waterway generates the strongly stratified Rhine River plume. Under normal conditions a salt wedge intrudes about 16-18 km inland on every tide. In contrast, under drought conditions in summer 2022, observations show salt intruding over 42 km inland and the Rhine River plume diminished in size. We explore the changes in estuarine dynamics during the drought using velocity, salinity and temperature data from various field campaigns near the mouth of the Rotterdam Waterway and within the delta, together with numerical models. We also compare drought condition observations with data from prior field campaigns during normal discharge conditions. Shifts in the relative strength of the dominant mechanisms of landward salt flux throughout the drought are explored and linked to the changes in estuarine response.

How to cite: Pietrzak, J., Geraeds, M., Wegman, T., Gerritsma, A., Verlaan, M., Katsman, C., Horner Devine, A., Ralston, D., Kranenburg, W., and Dijkstra, H.: Salt Intrusion in a salt wedge estuary under extreme drought conditions, EGU General Assembly 2024, Vienna, Austria, 14–19 Apr 2024, EGU24-16435, https://doi.org/10.5194/egusphere-egu24-16435, 2024.

EGU24-16835 | Orals | OS2.1 | Highlight

Interdisciplinary Insights into the Island Mass Effect of the Cape Verde Archipelago 

Florian Schuette, Anna Christina Hans, Marco Schulz, Peter Brandt, Rebecca Hummels, Arne Körtzinger, Björn Fiedler, Tim Fischer, Henk Jan Hoving, and Helena Hauss

The Cape Verde Archipelago (CVA) stands out with exceptional biological productivity sustaining a highly diverse ecosystem. Higher primary productivity in the proximity of islands, known as the Island Mass Effect (IME), has been systematically observed on global scale but the details of the interplay between physical and biogeochemical processes remain not fully understood. Within this study, a comprehensive analysis of the IME within the CVA based on 20 years of physical, chemical, and biological observational data sets is presented for the first time. Three main physical processes are identified to be responsible for the IME of the CVA and are investigated in detail: I. The interactions of tidal flows/internal waves with topography: Internal wave breaking at critical slopes leads to elevated mixing rates of a factor 100 larger than at reference points. II. The generation of island wakes in lee of Santo Antãoand Fogo: wind interactions with the island’s topography cause local wind shear in lee, which can generate productive vortex patterns extending for several island diameters downstream. III. The interaction of remotely-generated mesoscale eddies with the CVA itself: After central collision of open ocean eddies with islands or seamounts or when the eddy passes by very closely, we observe submesoscale frontal dynamics driven by mesoscale flow brought out of geostrophic balance, thereby enabling vertical mixing hotspots. Our observations particularly show the interactions between eddies and the internal wave field (modified by vertical shear of the mesoscale eddy, tides, bathymetry, or a combination of all these factors).
All these mechanisms (I., II., and III.), albeit diverse, uniformly augment vertical exchange by turbulent motions with strongly enhanced diapycnal mixing rates and/or vertical velocities and thereby promote elevated nutrient flux into the euphotic layer. This flux ultimately results in significantly higher phytoplankton concentrations in areas where these physical processes occur, thus providing the basis of the local pelagic food web consisting of mesozooplankton and micronecton up to larger predators.

How to cite: Schuette, F., Hans, A. C., Schulz, M., Brandt, P., Hummels, R., Körtzinger, A., Fiedler, B., Fischer, T., Hoving, H. J., and Hauss, H.: Interdisciplinary Insights into the Island Mass Effect of the Cape Verde Archipelago, EGU General Assembly 2024, Vienna, Austria, 14–19 Apr 2024, EGU24-16835, https://doi.org/10.5194/egusphere-egu24-16835, 2024.

EGU24-16889 | ECS | Orals | OS2.1

Turbulent oxygen transport across the halocline of the central Baltic Sea: Identification of key physical processes 

Oliver Thiele, Peter Holtermann, and Lars Umlauf

Anoxia in the central Baltic Sea is caused by the disproportion of the oxygen demand below the Baltic Sea halocline and the capability to transport sufficient amounts of oxygen from the well oxygenated upper water column through the halocline into the deeper Baltic Sea. Despite the fact of anoxia below the halocline, there is a growing evidence for a considerable oxygen transport through the halocline by turbulent mixing at the basin boundaries, i.e. the location where the halocline gets in the vicinity of the seafloor.

We used velocity data from moorings and ship based velocity shear microstructure measurements using a MSS profiler. The data was acquired during three different cruises/seasons in the Eastern Gotland Basin to identify key processes responsible for oxygen mixing events across the strong halocline. The MSS was equipped with a fast oxygen sensor allowing to quantify the vertical oxygen flux.

We focused on specific events with inertial waves, mean currents, and topographic waves as major dominating processes. During these events properties such as vertical shear, stratification and oxygen fluxes were analysed. With this information we were able to estimate the potential of the processes for the diapycnal oxygen transport. We found that inertial waves do not contribute much to the overall oxygen flux across the halocline, whereas topographic waves increase the oxygen flux considerably. Also the mean current lead to significant oxygen fluxes under certain shear and stratification conditions, suggesting that further attention should be turned to those.

How to cite: Thiele, O., Holtermann, P., and Umlauf, L.: Turbulent oxygen transport across the halocline of the central Baltic Sea: Identification of key physical processes, EGU General Assembly 2024, Vienna, Austria, 14–19 Apr 2024, EGU24-16889, https://doi.org/10.5194/egusphere-egu24-16889, 2024.

EGU24-17258 | ECS | Posters on site | OS2.1

Hydrodynamical and biogeochemical simulation of the Storm Gloria including major and minor river contributions 

Savitri Galiana, Joaquim Ballabrera, Justino Martínez, Eva Flo, Elisa Berdalet, and Xavier García

Extreme weather events and their associated storm surges are expected to become more frequent and intense in the Mediterranean Sea due to climate change and sea-level rise. Storm Gloria (January 19–24, 2020) hit the NW Mediterranean Sea with heavy rainfall, strong easterly winds, increase of sea-level rise and unprecedented wave height and wave periods. Many Catalan and French rivers increased their discharges by hundreds of times. The storm caused severe erosion, flooding, and destruction along the Catalan and Balearic coasts, marking the most devastating climate event in recent regional history. Understanding these occurrences and their impacts is crucial for safeguarding the densely populated coastal areas and their ecosystems.

The AquaInfra project (https://aquainfra.eu/) goal is to provide a digital infrastructure to properly study the role of continental water input into the near-coastal ocean to assess the risks and hazards to marine ecosystems. Within this framework, we are running a set of hydrodynamic and biogeochemical simulations using the BFMcoupler software, to investigate the impact of Storm Gloria on ocean dynamics and water quality. 

The BFMcoupler is a taylored interface coupling the hydrodynamic MITgcm and the biogeochemical BFM models. The model resolution is 1/128° and its domain extends from the Gulf of Lions in the north-east to the Gulf of Valencia in the south-west, including the Balearic Islands. Input data for the model is taken through AquaInfra’s EOSC digital infrastructure (https://eosc-portal.eu/), with MedSea Copernicus data for initial and boundary conditions, and ERA5 reanalysis hourly data for atmospheric forcing. The model also accounts for 17 Spanish and French rivers, including the Ebro and the Rhone. Rivers are modeled as small channels reproducing the depth of the riverbed close to the sea and velocity; salinity and temperature are imposed as open boundary conditions at river springs. River data are taken from local water agencies. We are currently working to include in the model: riverine, coastal discharge points and submarine groundwater discharges.

The experiments described here intend to determine the separated effects of fresh-water discharges from rivers and precipitation separately, and the combined effect. This will be done by a set of experiments in which daily values of riverine output and precipitation are replaced by their corresponding climatologies.

Preliminary results show, first, a decrease in temperature, salinity and chlorophyll in all river mouths when including real river discharge data compared to when using climate data. This effect propagated along the Catalan coast for the last days of the Gloria storm. An expected result caused by the increment of freshwater by rivers during the storm. We also observe how the regional characteristic north-south current, which evolves along the continental slope, is intensified by the strong winds, confining river effects to a few kilometers from the coast. Second, the effects of the Gloria heavy rainfall are observed all around the domain as a result of the positive buoyancy flux driven by the storm.

------------------------------------

(This work has received funding from the European Commission’s Horizon Europe Research and Innovation programme under grant agreement No 101094434.)

How to cite: Galiana, S., Ballabrera, J., Martínez, J., Flo, E., Berdalet, E., and García, X.: Hydrodynamical and biogeochemical simulation of the Storm Gloria including major and minor river contributions, EGU General Assembly 2024, Vienna, Austria, 14–19 Apr 2024, EGU24-17258, https://doi.org/10.5194/egusphere-egu24-17258, 2024.

EGU24-17317 | Posters on site | OS2.1

Numerical investigation of the December 2019 seiche event in the Adriatic Sea 

Marco Bajo, Luca Arpaia, Christian Ferrarin, and Mirko Orlić

In this work, we present the preliminary results of a study of a series of seiches, which occurred during the month of December 2019 in the Adriatic. A  peculiar aspect of this event is that it was not preceded by any significant storm surge, which usually triggers the normal modes of the Adriatic Sea. With the aim of investigating the dynamics of the event, we used the sea levels observed at some coastal locations and a hydrodynamic finite element model. The model, already used in numerous studies of the area, was applied in a diagnostic way, by varying the forcing to demonstrate its importance for the event. We hypothesise that the first normal mode was excited by a variable wind forcing having a period close to the one of the main normal mode (about 21 hours). Consequently, the excitation of the normal mode was nearly resonant.

How to cite: Bajo, M., Arpaia, L., Ferrarin, C., and Orlić, M.: Numerical investigation of the December 2019 seiche event in the Adriatic Sea, EGU General Assembly 2024, Vienna, Austria, 14–19 Apr 2024, EGU24-17317, https://doi.org/10.5194/egusphere-egu24-17317, 2024.

EGU24-17374 | ECS | Orals | OS2.1

Biological processes and wind contributions to 3-D fine-scale dynamics in a coastal area 

Maxime Arnaud, Anne Petrenko, Jean-Luc Fuda, Caroline Comby, Anthony Bosse, Yann Ourmières, and Stéphanie Barrillon

Ocean fine-scale dynamics such as submesoscale processes constitute one of the key points in understanding current velocities with a tridimensional approach. Their in situ observation remains challenging due to their short space and time extent and duration. The Northern Current in the Western Mediterranean Sea, corresponding to the Northern branch of the basin cyclonic circulation, can be influenced by wind events, inducing intrusions on the continental shelf and associated fine-scale dynamics. In order to detect these phenomena, the JULIO mooring (JUdicious Location for Intrusion Observation) located on the Eastern side of the Gulf of Lion’s shelf on the 100m isobath, measures tridimensional current velocities since 2012 using an acoustic Doppler current profiler (ADCP) at 300kHz. In addition, vertical velocities have been episodically measured with other methods such as the FreeFall-ADCP (FF-ADCP), and an autonomous Vertical Velocity Profiler (VVP) both developed at MIO. First, the JULIO time-series has shown a significant contribution of biology to vertical motions, with systematic negative vertical velocities measured at night time. This effect was particularly strong in the subsurface layer at 15 to 25 meters depth and enhanced during spring. Second, strong observed 3D-currents, coinciding with wind events, induce current shears and intrusions as well as vertical velocities in this dynamical coastal region with complex bathymetric constraints. Furthermore, the SWOT satellite mission launched in 2022 constitutes a powerful ally by providing a new tool to detect fine-scale features from the surface dynamics near JULIO, and especially during the daily fast sampling phase from April to July 2023. Given the impact of wind forcing on current dynamics in this region, the question arises to what extent the Northern Current and its intrusions on the continental shelf might be affected by climate change.

How to cite: Arnaud, M., Petrenko, A., Fuda, J.-L., Comby, C., Bosse, A., Ourmières, Y., and Barrillon, S.: Biological processes and wind contributions to 3-D fine-scale dynamics in a coastal area, EGU General Assembly 2024, Vienna, Austria, 14–19 Apr 2024, EGU24-17374, https://doi.org/10.5194/egusphere-egu24-17374, 2024.

EGU24-17541 | ECS | Orals | OS2.1

The impact of increased shellfish cultivation in the North Sea on the carbon cycle: a what-if scenario for the European Digital Twin Ocean.  

felix dols, Romain lavaud, Brecht Stechele, Tineke Troost, Loreta Cornacchia, Luca van Duren, Lauriane Vilmin, Lorinc Meszaros, Ghada El Serafy, Joanna Staneva, and Yann Drillet

For the European Commission, the EDITO consortium is creating the European Digital Twin Ocean, a platform that integrates coastal and oceanic modelling tools with ocean observation databases and computing infrastructure. Building on EMODnet and CMEMS, EDITO Model Lab will contribute by making the next generation of ocean models more accessible.

This work demonstrates one of the capabilities of the Digital Twin Ocean, focussing on human exploitation impacts on carbon fluxes. More specifically this what-if scenario is about the impact of upscaling the cultivation of shellfish in the North Sea on the carbon cycle. Upscaling the cultivation of shellfish is part of the envisioned “blue economy” and a promising option for multi-use of offshore wind parks. As shellfish are respiring organisms, they are a carbon source. At the same time shells are a carbon storage as they are built through biocalcification, a process that turns dissolved carbon and calcium into calcium carbonate.

The research aims to quantify the effects of upscaling shellfish cultivation in the North Sea on the carbon cycle. This is done by implementing a biocalcification module (Stechele & Lavaud, manuscript submitted for publication in 2024), in the Dynamic Energy Budget (DEB) module integrated in Delft3D-FM’s water quality process library (Troost et al., 2010; Deltares, 2023). Our work includes assumptions about how harvesting accounts for calcium carbonate leaving the sea and is therefore sequestrated.

How to cite: dols, F., lavaud, R., Stechele, B., Troost, T., Cornacchia, L., van Duren, L., Vilmin, L., Meszaros, L., El Serafy, G., Staneva, J., and Drillet, Y.: The impact of increased shellfish cultivation in the North Sea on the carbon cycle: a what-if scenario for the European Digital Twin Ocean. , EGU General Assembly 2024, Vienna, Austria, 14–19 Apr 2024, EGU24-17541, https://doi.org/10.5194/egusphere-egu24-17541, 2024.

EGU24-18136 | Orals | OS2.1 | Highlight

 Identification of primary productivity hotspots and their association with oceanographic phenomena in the coastal region off Central Norway 

Ingrid Helene Ellingsen, Ole Jacob Broch, and Glaucia Moreira Fragoso

The coastal waters of Central Norway showcase a great biodiversity. The Froan archipelago and the coral reefs of the Sula rise are highly productive, with several species of fish, clams and crab. Results from the ocean model system SINMOD show a high primary production in the area as a result of internal waves at the shelf break in combination with strong tidal mixing at the bank area of the Froan archipelago. Oceanographic conditions strongly impact on the phytoplankton community structure and succession in this region (Fragoso et al., 2019, Fragoso et al. 2021). Spring bloom dynamics is further sensitive to rapid changes in weather in the region (Fragoso et al, in revision).

In this study, we use the coupled biophysical SINMOD model to explore spatiotemporal variations in primary production. We aim to correlate these variations with internal waves, tidal mixing, and eddies across different regions of the complex shelf area. The observations from previous studies will be used to assess the model prediction skill. We will further investigate the fate of carbon in the system and use the model results to locate potential hot spots of biodiversity by investigating vertical transport of carbon as well as recycling of carbon in the water column. This work is part of an ongoing interdisciplinary project AMBIOS that aims to develop a fully autonomous system for the discovery of, and navigation to, marine microbial biodiversity hotspots.

How to cite: Ellingsen, I. H., Broch, O. J., and Moreira Fragoso, G.:  Identification of primary productivity hotspots and their association with oceanographic phenomena in the coastal region off Central Norway, EGU General Assembly 2024, Vienna, Austria, 14–19 Apr 2024, EGU24-18136, https://doi.org/10.5194/egusphere-egu24-18136, 2024.

EGU24-18962 | ECS | Posters on site | OS2.1

Understanding flows and sediment dynamics in the Norwegian Trench: Insights from the RV Pelagia Expedition 2023 

Anna Enge, Julie D. Pietrzak, Furu Mienis, Peter Kraal, and Bram C. van Prooijen

The Norwegian Trench and Skagerrak form a major canyon that cuts through the Northern North Sea towards the Kattegat. The Norwegian Trench and Skagerrak influence the inflow of Atlantic Water into the northern North Sea and the outflow of fresher waters from the Baltic and the many river plumes around the North Sea that flow towards the Atlantic Ocean through the Norwegian Coastal Current (NCC). The Norwegian Trench and Skagerrak have a key role to play in the circulation, transport and exchange of freshwater and sediment, having a strong control on the circulation, water mass transformations and sediment dynamics in the northern North Sea. When the NCC interacts with the saline waters of the North Atlantic large mesoscale eddies from and dominate the circulation. We explore how these eddies interact with the flow around the canyon, and influence the exchange between the North Sea and the Atlantic Ocean. To do this we use unique observations from the Norwegian Trench taken aboard the research vessel Pelagia between May 26th and June 14th 2023 together with numerical models of the region. Uniquely the data include Conductivity Temperature Depth (CTD) measurements, velocities, box core samples and multicore samples from stations in the Norwegian Trench. It also includes results from onboard erosion experiments. Additionally, Argo float data highlight the large-scale circulation in the northern North Sea. We explore whether the high current velocities at the seafloor could be induced by eddies and topographically steered currents and their impact on sediment dynamics. 

How to cite: Enge, A., Pietrzak, J. D., Mienis, F., Kraal, P., and van Prooijen, B. C.: Understanding flows and sediment dynamics in the Norwegian Trench: Insights from the RV Pelagia Expedition 2023, EGU General Assembly 2024, Vienna, Austria, 14–19 Apr 2024, EGU24-18962, https://doi.org/10.5194/egusphere-egu24-18962, 2024.

Both, the overturning circulation in the ocean and the exchange flow in an estuary are directly linked to the transformation of water masses caused by small-scale mixing. The integral Water Mass Transformation (WMT) framework formulates how diffusive fluxes between water masses of different tracer concentrations are associated with mass fluxes across iso-tracer surfaces. Relations between local dia-surface fluxes and small-scale mixing in terms of local tracer variance dissipation have been derived by Klingbeil and Henell (2023). In my talk I will explain and demonstrate these relations between local diahaline fluxes, small-scale salinity variance dissipation and the large-scale circulation in estuaries. Klingbeil, K. and E. Henell (2023) A Rigorous Derivation of the Water Mass Transformation Framework, the Relation between Mixing and Diasurface Exchange Flow, and Links to Recent Theories in Estuarine Research. JPO. https://doi.org/10.1175/JPO-D-23-0130.1

How to cite: Klingbeil, K.: Linking small-scale salinity mixing and large-scale estuarine circulation, EGU General Assembly 2024, Vienna, Austria, 14–19 Apr 2024, EGU24-22359, https://doi.org/10.5194/egusphere-egu24-22359, 2024.

EGU24-173 | Posters on site | OS2.2

Modeling hydrosedimentary transport in the eastern English Channel under extreme weather conditions 

Elena Alekseenko and Alexei Sentchev

The eastern English Channel (EEC) experiences a dynamic interplay of extreme events, including powerful winds, tides, and complex bottom relief features, collectively shaping the region's hydrosedimentary transport dynamics. Extreme winds, frequently observed in the EEC, play a pivotal role in influencing surface currents and wave patterns. Coupled with strong tidal forcing, these events lead to intricate interactions with the seafloor topography, creating a complex hydrodynamic environment. The resulting effects on sediment transport are significant, with the potential for altered erosion and deposition patterns along the coastal areas of the EEC. Understanding this multiscale interaction is crucial for predicting and managing the impact of extreme events on hydrosedimentary transport, contributing to effective management of coastal ocean environment. In order to study all these processes, we used a 3D hydrodynamic model (MARS3D, IFREMER) coupled with a sediment transport model (MUSTANG, IFREMER) and calibrated it for the English Channel. This model employs nested grids of different extents and resolutions: (i) the northwest European continental shelf area with a 5 km resolution, (ii) the English Channel area with a 1 km resolution, and (iii) local zones along the eastern coast of the English Channel with a 100m resolution. The larger model transfers boundary conditions to the higher-resolution model. Such a cascade of resolutions allows for the consideration of both large-scale hydrodynamic processes and the replication of smaller-scale processes (eddies, turbulent current oscillations). Four fractions of suspended matter, including two size classes of mud and two size classes of fine sand, were specifically chosen for modeling based on in-situ data. The model then has been validated using the data collected in 2020-2021. The model can be employed to replicate the dynamics and sedimentary processes over a multi-year period. This enabled the estimation of the quantity and flux of suspended matter, as well as potential changes in the sediment transport regime induced by extreme weather conditions. The modeling outcomes highlighted tides as the primary driving force behind hydrosedimentary transport, surpassing the influence of wind. This effect is evident in the formation of eddies near capes, emerging for a few hours after the onset of the tide phase. These eddies create a counterflow of matter along the French coasts, opposing the general current direction that moves toward the North Sea. In the regions characterized by the highest velocities in offshore areas, larger particles (sands) prevail within the eddies, while the slower sections closer to the coast are predominantly composed of finer mud particles. Additionally, the wind introduces instabilities in the current structure, leading to an increased resuspension of fine sediments.

How to cite: Alekseenko, E. and Sentchev, A.: Modeling hydrosedimentary transport in the eastern English Channel under extreme weather conditions, EGU General Assembly 2024, Vienna, Austria, 14–19 Apr 2024, EGU24-173, https://doi.org/10.5194/egusphere-egu24-173, 2024.

EGU24-865 | ECS | Orals | OS2.2

Analysis of Antropogenic effects on the tidal dynamics and salt transport along the Guadalquivir river estuary. 

Sara Sirviente Alonso, Juan Jeús Gomiz Pascual, Marina Bolado Penagos, and Miguel Bruno Mejías

This study presents an analysis of the impacts of changes in bottom depth along the Guadalquivir Estuary on tidal dynamics. A realistic non-linear 1D numerical model, incorporating alterations in both breadth and bottom depth, was employed to investigate the associated effects.The 1D numerical model consists of a hydrodynamical model and a transport and dispersion module,which successfully reproduce the hydrodynamics of the saline intrusion from the continental shelf.The results show a significant amplification of the M2 tidal wave towards theheadof the Estuary,which seems to be caused bythe gradual bottom deepening caused by multiple dredging activities. The Estuary exhibits a pronounced tendency towards resonance, which is further enhanced by this deepening which reduces bottom friction and produces a smaller decrease in tidal wave amplitude as it propagates through the Estuary. The alterations in depth, particularly in breadth, along the Estuary play a crucial role in determining the magnitude of the resonant response of the M2 tidal wave.Modelsimulations demonstrate how changes in the geometric configuration of the channel, as well as the river waterwithdraw different agricultural activities, lead to significant alterations in the salt wedgedynamics. These changes in the tidal and associated salt exchange dynamics may also have a significant impact in thebiogeochemical exchanges between the river and the continental shelf, with potential harmful effect on the primary productionin the mouth of the estuary and adjacent coastal areas.


How to cite: Sirviente Alonso, S., Gomiz Pascual, J. J., Bolado Penagos, M., and Bruno Mejías, M.: Analysis of Antropogenic effects on the tidal dynamics and salt transport along the Guadalquivir river estuary., EGU General Assembly 2024, Vienna, Austria, 14–19 Apr 2024, EGU24-865, https://doi.org/10.5194/egusphere-egu24-865, 2024.

EGU24-1612 | ECS | Posters on site | OS2.2

A high-resolution 3-D circulation model in a complex archipelago on the coastal Scotian Shelf 

Tao Feng, Ryan Stanley, Yongsheng Wu, and Ellen Kenchington

A high-resolution coastal Finite-Volume Community Ocean Model (FVCOM) has been configured to simulate the water circulation in the Eastern Shore Islands (ESI) archipelago on the coastal Scotian Shelf. Circulation in this area is characterized by complex interactions between the irregular coastline, a dense archipelago, tides, wind, and subtidal currents.  Model outputs show close agreement with the tides, subtidal current and hydrographic observations. Two circulation regimes within the study area were identified ‘inshore’ and ‘offshore’ of the 60-m isobath. The balance between pressure gradient and Coriolis effect controls the dominant southwestward current (Nova Scotia Current) in the offshore. Rotary spectra and numerical experiments showed that the tidal current was an important component to the circulation in the inshore. Within the study area there are several clockwise and counter-clockwise gyres related to the Coriolis effect, surface wind stress, pressure gradient and the interaction between the irregular topography and current. The combined effects of topography, wind, tide and Nova Scotia Current regulate the inshore circulation. The topographic features complex the cross-shore transport. The increased bathymetric slope and strengthened relative vorticity contribute to the inshore cross-shore current. Here, we found that the joint effect of baroclinicity and bottom relief drives the cross-isobath transport. The ability of our model to resolve complex coastal circulation patterns provides an important basis on which to better understand how physical oceanography influences the unique ecological processes of this coastal archipelago and ultimately will help to evaluate dispersal and connectivity of coastal species in this area.

How to cite: Feng, T., Stanley, R., Wu, Y., and Kenchington, E.: A high-resolution 3-D circulation model in a complex archipelago on the coastal Scotian Shelf, EGU General Assembly 2024, Vienna, Austria, 14–19 Apr 2024, EGU24-1612, https://doi.org/10.5194/egusphere-egu24-1612, 2024.

The Kuroshio often intrudes into the South China Sea (SCS) in the form of a loop through the Luzon Strait in winter, accompanied by eddy shedding, significantly impacting the circulation and thermodynamic state in the northern SCS. The eddy shedding of the Kuroshio loop into the SCS is influenced not only by local winds but also modulated by the western Pacific (WP) circulation. Given the uncertainties in simulating the WP circulation, accurately forecasting the process of the Kuroshio loop and eddy shedding into the SCS poses a considerable challenge. Ensemble forecast based on Ensemble Kalman Filter (EnKF) assimilation represents an advanced forecasting methodology. Compared to deterministic forecast from a single model, ensemble forecast effectively considers model error uncertainties throughout the forecasting process. Utilizing the high-resolution SCS-WP EnKF assimilation forecast system, our study focuses on the predictability of a strong Kuroshio loop and subsequent eddy shedding into the SCS during the winter of 2016-2017. The findings indicate that the successful forecast of this strong Kuroshio loop and eddy shedding primarily attributed to the assimilation of ocean observations in the Subtropical Countercurrent (STCC) region, partially supported by the assimilation of observations in the North Equatorial Current (NEC) region. Specifically, assimilating observations in the STCC region reproduced observed westward-propagating cyclonic eddies, which, upon collision with the Kuroshio in the Luzon Strait, intensified its intrusion into the SCS and led to eddy shedding. Meanwhile, assimilation in the NEC region represented the weak background current of the Kuroshio, further promoting the formation of a strong Kuroshio background loop and the occurrence of eddy shedding in the Luzon Strait according to the teapot effect.

How to cite: Liu, D. and Shu, Y.: The predictability of eddy shedding from Kuroshio loop in the Luzon Strait: insights from ensemble forecast, EGU General Assembly 2024, Vienna, Austria, 14–19 Apr 2024, EGU24-2238, https://doi.org/10.5194/egusphere-egu24-2238, 2024.

EGU24-2838 | ECS | Posters on site | OS2.2

Observations of destratification events in a highly stratified bay in the Ebro Delta 

Raquel Peñas-Torramilans, Manel Grifoll, Manuel Espino, Margarita Fernández, Marta Balsells F-Pedrera, Yang Chen, Joaquim Sospedra, and Agustín Sánchez-Arcilla

Coastal environments are regions characterized by complex hydrodynamics with high temporal variability in water circulation due to environmental drivers such as local wind, freshwater inflow, or tidal variations. This research investigates the hydrodynamics of destratification events in a highly stratified micro-tidal coastal estuary, such as is the Fangar Bay (Ebro Delta, NW Mediterranean). The bay's hydrodynamics are mainly driven by local wind events and modulated by water column stratification, which is dominant and controlled by freshwater inputs and oscillatory motions. The study here presented is based on the time-series analysis of two ADV (Acoustic Doppler Velocimeter), combined with temperature and salinity profiles, deployed within the bay during the Spring of 2023. Results show a clear destratification of the water column after intense wind episodes, mostly from the northwest, which alter the response of the velocity field and re-distribute the constituents of the water column through mixing and dispersion. The high-frequency analysis of the recorded velocities suggests a differential pattern between upper (fresher) and lower (saline) layers of the water column, with significant implications for aquaculture and water quality.

Keywords: destratification, estuary, hydrodynamics, mixing, measurements

Funding: This work has been funded by the R+D+I project ECO-BAYS (PID2020-115924RB-I00) financed by MCIN/AEI/10.13039/501100011033.  

Acknowledgements: To project REST-COAST (H2020-101037097-REST-COAST) from the European Union’s Horizon 2020 program.

How to cite: Peñas-Torramilans, R., Grifoll, M., Espino, M., Fernández, M., Balsells F-Pedrera, M., Chen, Y., Sospedra, J., and Sánchez-Arcilla, A.: Observations of destratification events in a highly stratified bay in the Ebro Delta, EGU General Assembly 2024, Vienna, Austria, 14–19 Apr 2024, EGU24-2838, https://doi.org/10.5194/egusphere-egu24-2838, 2024.

EGU24-3556 | Posters on site | OS2.2

Evaluation of seagrass as a nature-based solution for coastal protection in the German Wadden Sea 

Benjamin Jacob, Tobias Dolch, Andreas Wurpts, and Joanna Staneva

Global climate change increases the overall risks for coastal flooding and erosion. Meanwhile, nature-based solutions (NbS) are increasingly becoming a focus of coastal protection measures to improve the climate adaptability. In this study, the present and potential future role of seagrass in coastal risk reduction strategies were explored for the highly energetic Wadden Sea area of the German Bight. The methodology in this study combined seagrass coverage data (Zostera marina and Zostera noltei) obtained by field surveys and what-if scenario simulations using the SCHISM unstructured grid model framework, coupling hydrodynamics, waves, sediments, and a seagrass module. The results suggest that the introduction of seagrass meadows locally can reduce both current velocities and significant wave heights in the order of up to 30% in the deeper areas and above 90% in the shallow areas. Reduction in bottom shear stress of a similar relative magnitude significantly reduced sediment mobilisation on the order of 2 g/L in the 95th quantile of bottom layer sediment concentrations. Effectively altering hydromorphodynamic conditions favouring sediment accumulation, seagrass expansion could help tidal flats height growths to keep up with SLR, thus further maintaining the bathymetry-induced tidal dampening and lowering flooding and erosion risks as well the amount of energy at dike infrastructure. The accumulated effect of seagrass under calm weather conditions is considered more important than the increased attenuation in absolute values it provides during extreme conditions. The overall conclusion is that seagrass expansion could be a useful addition to engineered coastal protection measures.

How to cite: Jacob, B., Dolch, T., Wurpts, A., and Staneva, J.: Evaluation of seagrass as a nature-based solution for coastal protection in the German Wadden Sea, EGU General Assembly 2024, Vienna, Austria, 14–19 Apr 2024, EGU24-3556, https://doi.org/10.5194/egusphere-egu24-3556, 2024.

This study investigates the integration of seawater temperature data acquired through in-situ and remote sensing methods, aiming to enhance the accuracy of hydrodynamic models. Our focus is on a shallow bay influenced by semidiurnal tides, where continuous thermal discharges from a coastal power plant significantly impact the local temperature field. The investigation addresses the model's uncertainty in capturing the variability of thermal effluents, particularly regarding the input descriptions for the discharge rate (Q) and excess temperature (ΔT) added to the ambient waters. These parameters display seasonal variations that reflect the energy consumption trends of the local population, introducing complexity into seawater temperature modeling. We aim to assess the effectiveness of using different data types in two key application areas: (A) generating better initial conditions through data assimilation with the Ensemble Kalman Filter (EnKF) technique, and (B) automating the calibration of the model parameters for the description of the thermal discharge. To explore these applications, we conduct a twin experiment that replicates the bay's real-world conditions, allowing for a comprehensive evaluation of the impact of integrating temperature data of varying resolutions on the assimilation and calibration processes. Our goal is to determine the most effective spatiotemporal scales for these applications, and to provide recommendations for modeling approaches in similar tidal environments.

How to cite: Alsulaiman, N., Van Reeuwijk, M., and Piggott, M.: Applications of Data Assimilation and Parameter Calibration with Multi-Resolution Measurements of Seawater Temperature for Hydrodynamic Modeling of Shallow, Tidal Environments, EGU General Assembly 2024, Vienna, Austria, 14–19 Apr 2024, EGU24-4085, https://doi.org/10.5194/egusphere-egu24-4085, 2024.

EGU24-4717 | ECS | Posters virtual | OS2.2

Processes controlling the dispersion and beaching of floating marine debris in the Barcelona coastal region  

Ivan Hernandez, Leidy Maricela Castro-Rosero, Manuel Espino Infantes, and Jose María Alsina Torrent

Coastal zones are considered one of the main sinks for floating marine litter (FML) in the marine environment although transport mechanisms in coastal zones are poorly understood. The Barcelona coastline is considered one of the main hot-spots in the Mediterranean Sea, with high flux rates reported between land and coastal waters and FML concentrations of the order of magnitude of subtropical oceanic garbage patches. A case study was conducted on the Barcelona coastline using observational data of debris output from two rivers within the metropolitan area (Llobregat River to the south and Besòs River to the north) and a Lagrangian numerical model specifically adapted for use in coastal areas (LOCATE) using high-resolution hydrodynamic data and a beaching module based on high-resolution shoreline data that calculated real-time particle distance to the shore to detect the land-water boundary. The coastline was divided into 16 zones based on geographical structures and high-interest areas allowing for the differentiation of the level of impact of different zones.  High levels of beaching in the area (>91.5%) with relatively short residence times (<6.4 days) were observed.

Coastline areas adjacent to the debris release points were observed to be more prone to receive particles. To separate the likelihood of a particle being deposited close to the point of origin from the effects of the transport mechanisms, a measurement of potential beaching likelihood was introduced based on the comparison of modelled sustained displacement of particles to an area with the minimum time and distance required for particles to be deposited in an area with the hydrodynamic conditions during the simulation. The Llobregat River mouth was overwhelmingly affected by debris flowing out of the river, confirming that proximity to the source is the main driver for particle beaching at smaller scales, followed by the influence of geometric structures on hydrodynamic conditions. Statistical analyses revealed that significant wave height and wave energy flux correlated positively with the amount of particle beaching with a strong association between the variables. Current velocity, however, had a weak negative correlation indicating that a strong prevailing Northern Current has an inverse effect on particle deposition. The relationship between wave direction and coastline orientation was also seen to have a strong influence on the levels of beaching, with vertically oriented sections of the coastline having a greater predisposition to receive particles.

Mass was calculated for the modelled particles based on their composition and compared to the amount of debris recorded in beach cleaning data, revealing that only 4.9% of debris reaching beaches in the Barcelona metropolitan area can be attributed to river outflow. Other sources of debris such as discharges from sewage and wastewater overflows, or land-based waste generated by beach use must be considered for more accurate representations as well as more precise beaching parameterisations to account for land-water fluxes.

How to cite: Hernandez, I., Castro-Rosero, L. M., Espino Infantes, M., and Alsina Torrent, J. M.: Processes controlling the dispersion and beaching of floating marine debris in the Barcelona coastal region , EGU General Assembly 2024, Vienna, Austria, 14–19 Apr 2024, EGU24-4717, https://doi.org/10.5194/egusphere-egu24-4717, 2024.

EGU24-4866 | ECS | Posters on site | OS2.2

Tidal force increasing the upwelling intensity off the northeastern coast of Taiwan 

Chia-Ying Ho and Hung-Jen Lee

Most historical research and observations have revealed the presence of a cold dome associated with a cyclonic eddy off the northeastern coast of Taiwan. The phenomenon could be derived from the interaction between the Kuroshio and the complex terrain of the local continental slopes. Also, the monthly average SST (sea surface temperature) of satellite image data indicates the prominent features of this cold water mass in the region during the summer. In spite of experiencing long-term investigations, some specific factors contributing to the formation of this cold eddy still need to be clarified. Consequently, a three-dimensional general circulation model (MITgcm) was employed to explore the underlying physical mechanisms of the cold dome formation. In considering some particular factors, the model results at a depth of 50 m reveal that as the Kuroshio passes over the North Mian-Hwa Canyon, it generates a cold water mass with temperatures approximately 4-5 oC lower than that of the Kuroshio water. However, the temperature decrease in the model's surface layer deviates from observational data, such as satellite image information, showing a modest decrease of around 1 oC. The subsequent inclusion of wind effects imposed on the model indicates that the summer monsoon enhances the strength of the cold water mass. However, the impact on surface temperature drop is insignificant, decreasing by only 0.2 oC compared with the no-wind model case. Finally, the tidal force imposition in the model leads to a substantial temperature reduction, dropping from 1 oC (without tides ) to 5-6 oC (with tides), more closely aligning with field observations and satellite mages. Additionally, temperature time-series analysis reveals the periodic oscillations, including daily and longer 15-day tidal cycles.

Key words: Cold dome; Kuroshio; MITgcm; Tide

How to cite: Ho, C.-Y. and Lee, H.-J.: Tidal force increasing the upwelling intensity off the northeastern coast of Taiwan, EGU General Assembly 2024, Vienna, Austria, 14–19 Apr 2024, EGU24-4866, https://doi.org/10.5194/egusphere-egu24-4866, 2024.

The goal of the study around the Hoping Sea is to explore the causes of the southward mean current formation along the Hoping Coast, Hualien, using a three-dimensional general circulation model (MITgcm). Hoping Township is situated on the northeast coast of Taiwan, the offshore region by which the Kuroshio Current passes. Two current meter sites were deployed around this region, named CS (121.76507˚E, 24.29757˚N) to the south and CN (121.77197˚E, 24.32964˚N) to the north. A long-term observation analysis finds that the ocean current at CS usually flows northeastward, aligning with the direction or, at least, with the northeast component of the Kuroshio; on the contrary, a southward countercurrent along the Hoping coast appears at CN. In order to explore the cause of the characteristic flow field, the MITgcm model was used to simulate six different scenarios. The first two simulations of the MITgcm model were conducted solely with Kuroshio as a driving force and a realistic topographic, in which the model was executed under the Kuroshio mainstream nearshore and offshore cases, respectively. The results showed that the countercurrent exists in Yilan Bay but does not reach the Hoping Sea when the Kuroshio is the only driving force of the model. Subsequently, simulations were conducted based on the previous work, with a tidal generating force imposed on the model. Combining the Kuroshio and tides in the model, the southward countercurrent was not prominent when the mainstream of the Kuroshio was set to close the Hoping coast. However, when we moved the Kuroshio offshore, the simulated results showed that the model flow field was in good agreement with the in-situ data in all simulated cases. Further, to explore the influence of tides and topographic effects on the flow field, two ideal water-tank basins were designed to simplify the topography. One was a straight coastline, while the other was a coastline with a protruding headland in the model. The results showed that the currents during the ebb tides flow southward and adhere to the alongshore coast. The mean flow north of the headland flowed southward increasingly, but the northeastward mean flow south of the headland weakened slightly.

How to cite: Tsai, Y.-C. and Lee, H.-J.: Marginal currents induced by the interaction between Kuroshio, tide, and coastal topography off the northeastern coast of Taiwan, EGU General Assembly 2024, Vienna, Austria, 14–19 Apr 2024, EGU24-4903, https://doi.org/10.5194/egusphere-egu24-4903, 2024.

EGU24-5147 | Posters on site | OS2.2

Enhanced cross-shelf exchange by the eddies associated with plume front 

Tingting Zu, Zhiqiang Liu, Zhongya Cai, and Lixin Qu

Broadened width of high chlorophyll concentration band with wavy structures, patches and filaments are often observed along the western coastal next to the Pearl River Estuary over the northern South China Sea shelf during the transition period from winter to summer monsoon. Whereas, there is no such wide band in other seasons. By using a high resolution numerical model, we reveal that the complex structure and wider band of high coastal chlorophyll concentration results from the smaller scale eddies (about 20-50km in diameter) associated with buoyant plume and thermal fronts, which are roughly along the 30m and 50m isobaths, respectively. Two trains of eddies are formed along the fronts by the baroclinic instability triggered by frequently alternating wind over the fronts during the monsoon transition period. The influences of these two trains of eddies are extended in the cross-shelf direction by their interactions, and they temporally enhance the cross-shelf flow and material exchange. They serve as an efficient pathway to link the inner shelf towards the slope.

How to cite: Zu, T., Liu, Z., Cai, Z., and Qu, L.: Enhanced cross-shelf exchange by the eddies associated with plume front, EGU General Assembly 2024, Vienna, Austria, 14–19 Apr 2024, EGU24-5147, https://doi.org/10.5194/egusphere-egu24-5147, 2024.

Coastal water quality in Hong Kong faces challenges from nutrient pollution, contaminant discharge, algal blooms, land-derived sedimentation, and climate change effects. To assess water quality in coastal regions, researchers have utilized varying in-situ monitoring data and remote sensing techniques to quantitatively estimate chlorophyll-a concentrations. Despite these efforts, there remains a lack of fine-scale characterization of the spatial and temporal patterns of chlorophyll-a in Hong Kong’s coastal waters, due to the limited resolutions and cloudy covers. Our study seeks to bridge this gap by fusing multisource satellite observations. Existing spatiotemporal image fusion models are primarily designed for land surface reflectance. In this study, we propose using Generative Adversarial Networks (GANs)-based deep learning techniques to improve the fusion of multisource satellite images specifically for watercolor remote sensing. A spatiotemporal fusion deep learning framework based on GANs has been developed to generate daily surface reflectance and temperature at 300 m spatial resolution using data from Sentinel-3 and Himawari-8 satellites. Furthermore, we have devised a random forest-based chlorophyll-a concentration estimation model  that employs the blended high-resolution data derived from multi-source satellite observations and extensive in-situ monitoring data obtained from 76 marine water quality monitoring stations administered by the Hong Kong Environmental Protection Department (HKEPD). These independent in-situ monitoring datasets also serve as valuable resources for evaluating the performance of satellite-derived chlorophyll-a concentrations. Consequently, we conducted a fine-scale mapping of chlorophyll-a distribution in Hong Kong's coastal waters to analyze spatiotemporal characterization of water quality. This approach holds promise for real-time, fine-scale water quality monitoring using high-frequency satellite observations in the future.

How to cite: Jiang, X. and Huang, B.: Fine-scale spatiotemporal characterization of chlorophyll-a in Hong Kong’s coastal waters through the fusion of multisource satellite imagery , EGU General Assembly 2024, Vienna, Austria, 14–19 Apr 2024, EGU24-5192, https://doi.org/10.5194/egusphere-egu24-5192, 2024.

EGU24-5831 | Posters on site | OS2.2

Developing High-Resolution Models for Forecasting Sea Surface Currents and Marine Effluent Dispersion 

Boris Petelin, Matjaž Ličer, Martin Vodopivec, and Branko Čermelj

The Gulf of Trieste is the northernmost part of the Mediterranean and the Adriatic Sea. It is home to lively shipping traffic, tourism, and fishing. The Gulf of Trieste is home to two of the most important ports on the Adriatic coast - Trieste and Koper. We have developed high-resolution operational numerical models for the operational prediction of the distribution of sea surface currents and the dispersion of wastewater from the sewage treatment plant into the sea:

(1) Prediction of the distribution of surface currents in the Gulf of Trieste (northern Adriatic Sea) to complement measurements from four HF radars stationed in the Gulf of Trieste. The radar provides current measurements at 30-minute intervals, except during maintenance work and occasional technical faults. In some areas, there are also occasional outages and unreliable current measurements, so high-resolution current models are of additional benefit. The two-day hourly forecast of sea currents provided by our model is displayed on the website along with the HF radar measurements. The most typical user of the HF radar measurements is the Slovenian Maritime Administration, which is responsible for the safety of navigation, management of maritime traffic and maintenance of safety facilities and waterways. The results of our numerical model can provide reliable information on the direction and strength of sea currents, which helps ship operators to plan their routes more efficiently, reduce fuel consumption and emissions, increase shipping safety, and enable better control of oil spills.

(2) Predicting the dispersion of wastewater from a wastewater treatment plant into the coastal sea. The Rižana wastewater treatment plant is located in the Gulf of Trieste, just upstream of the mouth of the Rižana river into the port of Koper. The results of the numerical model show whether the wastewater from the treatment plant enters protected areas or bathing waters. The results can help the relevant authorities to predict and prepare for potential pollution events, contribute to a better understanding of the processes in the coastal sea that control the transport, mixing and fate of pollutants, and show which marine areas are particularly vulnerable to pollution.

The high-resolution numerical models for predicting surface currents and the dispersion of sewage in the Gulf of Trieste represent a significant advance in maritime safety and environmental management. This underlines the valuable role of advanced modeling in promoting sustainable maritime practices and protecting the fragile ecosystem of the northern Adriatic.

How to cite: Petelin, B., Ličer, M., Vodopivec, M., and Čermelj, B.: Developing High-Resolution Models for Forecasting Sea Surface Currents and Marine Effluent Dispersion, EGU General Assembly 2024, Vienna, Austria, 14–19 Apr 2024, EGU24-5831, https://doi.org/10.5194/egusphere-egu24-5831, 2024.

EGU24-5863 | ECS | Posters on site | OS2.2

The Role of Tropical Cyclone on Changjiang RiverSubaqueous Delta Geomorphology: A Numerical Investigationof Tropical Cyclone Danas (2019) 

Bixuan Tang, Fan Zhang, Jianjun Jia, Zhixuan Feng, Jieping Tang, Fei Xing, and Yaping Wang

Subaqueous deltas are facing growing threats of erosion. Tropical cyclones (TCs), which are
predicted to affect mid-latitude estuaries more frequently with higher intensity in the future, can play an
important role in subaqueous delta geomorphology change. Nevertheless, direct in situ measurement of
TC-induced bed elevation change (BEC) was rarely reported before. In this study, four tripods were deployed
at different parts of the Changjiang River subaqueous delta (CRSD) to capture BEC during TCs in July
2019. Rapid erosion (20 mm day −1 ) during TC Danas (2019) was observed by high precision bed elevation
measurement, over 10 times faster than that during calm weather conditions. Moreover, the recorded rates of
BEC varied substantially among these stations. A coupled three-dimensional wave-current-sediment model was
then developed for the CRSD to help understand the spatial variability of observed BEC. The model results
showed two striking features of BEC during TC Danas: (a) enhanced sediment accretion near the sharp bottom
salinity front offshore of the north channel; (b) marked erosion near the front of CRSD. Further analysis showed
that the converging bottom currents in concert with enhanced sediment resuspension during TC Danas led to
significant convergence of sediment flux near the bottom salinity front. In addition, the diverging isobaths along
the front of the CRSD resulted in the onshore deviation of bottom current and diverging sediment flux under
the downwelling-favorable winds of Danas. Many TCs in the CRSD generate similar downwelling-favorable
winds and currents, growing TC threats in the future may therefore exacerbate erosion in this region.

How to cite: Tang, B., Zhang, F., Jia, J., Feng, Z., Tang, J., Xing, F., and Wang, Y.: The Role of Tropical Cyclone on Changjiang RiverSubaqueous Delta Geomorphology: A Numerical Investigationof Tropical Cyclone Danas (2019), EGU General Assembly 2024, Vienna, Austria, 14–19 Apr 2024, EGU24-5863, https://doi.org/10.5194/egusphere-egu24-5863, 2024.

EGU24-6193 | Orals | OS2.2

Physical, biological, and chemical inter-processes in fjords. 

Iván Pérez-Santos, Patricio A. Díaz, Lauren Ross, Ramiro Riquelme-Bugueño, Carlos Lara, Facundo Barrera, Macarena Díaz-Astudillo, Richard Muñoz, Mauricio Ladaeta, Pamela Linford, Camila Schwerter, Sara Arenas-Uribe, Pilar Navarro, Guido Mancilla-Gutiérrez Guido Mancilla-Gutiérrez, Erika Jorquera, and Gonzalo S. Saldías

Physical, chemical, and biological processes in fjord ecosystems are inherently intertwined and their interactions cultivate environments ideal for primary production and ecological diversity. Yet, due to the vast range of space and time scales important in fjords, defining specific inter-process outcomes, such as conditions that trigger harmful algal blooms (HABs), has proven to be a challenging task. To identify repeatable inter-process patterns this study will focus on time scales over which plankton are known to depend on and vary, such as the change from day to night, or the diurnal cycle. Therefore, in December 2021, a field experiment was conducted in a fjord of northern Chilean Patagonia (41.6º S) to capture the interaction of physical, chemical, and biological processes for a complete diurnal cycle (24 h). The measurements collected included hydrographic, atmospheric, tidal, and nutrient data as well as phytoplankton and zooplankton samples to elucidate how specifically these processes interact. Results detected thin, near-surface phytoplankton and zooplankton layers during the daytime, located just below a layer of fresh water, acting as a barrier. During the night the thin layers were dissipated and dispersed. Predator-prey interactions were one of the factors contributing to phytoplankton dissipation at nighttime, due to the diel vertical migration of macrozooplankton species. The physical measurements showed reduced stratification and enhanced vertical mixing homogenizing the upper layers of the water column at night, which is thought to be enhanced by the presence of swimming macrozooplankton. Diatoms dominated the phytoplankton composition, but HABs species were observed, showing changes in abundance and species composition from day to nighttime. This study reinforces the need to carry out interdisciplinary experiments to understand how physical, biological, and chemical processes in fjords interact, to forecast and mitigate the effects of water quality issues such as harmful algal blooms.

How to cite: Pérez-Santos, I., A. Díaz, P., Ross, L., Riquelme-Bugueño, R., Lara, C., Barrera, F., Díaz-Astudillo, M., Muñoz, R., Ladaeta, M., Linford, P., Schwerter, C., Arenas-Uribe, S., Navarro, P., Guido Mancilla-Gutiérrez, G. M.-G., Jorquera, E., and Saldías, G. S.: Physical, biological, and chemical inter-processes in fjords., EGU General Assembly 2024, Vienna, Austria, 14–19 Apr 2024, EGU24-6193, https://doi.org/10.5194/egusphere-egu24-6193, 2024.

EGU24-7890 | ECS | Posters on site | OS2.2

Coastal Currents from Observations, an integrated multi-source approach to analyse surface currents. 

Juan Manuel Lopez Contreras and Alexander Barth

The ocean surface is a key area where processes driven by the atmosphere take place, with important phenomena happening at small scales of turbulence in the surface layer. The analysis and extraction of surface currents in different basins have been carried on by different methods. However, there are still gaps and elements to improve to obtain high-quality maps with increased resolution. These small-scale variations in surface currents are key to understanding phenomena affecting elements like commercial shipping to biological and chemical impacts. To improve the quality of the surface currents products, a novel approach is intended to be used in the Mediterranean basin, a key economic area for 3 continents and several countries. By using Data Interpolating Variational Analysis in n-Dimensions (DIVAnd), a method that interpolates observations on a regular grid using a variational inverse method including dynamic constraints related to coastal currents, three different datasets are set to be applied, altimetry data from satellites, drifter data and high-frequency radar data, the latter has already been used for the reconstruction of surface currents in areas of the Mediterranean as the Balearic islands. By modifying the interpolation method initially designed for HF radar data, we look forward to interpolating and obtaining ocean surface currents maps from the three different datasets. Partial results for the available dates (from 1992 to 2022) have been obtained with outputs and maps that match the circulation of the Mediterranean Sea and show high detail of elements such as gyres and strong signals currents as the Algerian, selected outputs also show the strong seasonality of some of these features. This work is part of the BlueCloud2026 project.

How to cite: Lopez Contreras, J. M. and Barth, A.: Coastal Currents from Observations, an integrated multi-source approach to analyse surface currents., EGU General Assembly 2024, Vienna, Austria, 14–19 Apr 2024, EGU24-7890, https://doi.org/10.5194/egusphere-egu24-7890, 2024.

EGU24-8246 | ECS | Posters on site | OS2.2

Satellite derived bathymetries through high space-time resolution videos 

Candela Marco-Peretó, Gonzalo Simarro, Daniel Calvete, Nicola Palombo-Blascetta, Ruth Durán, and Jorge Guillén

Coastal bathymetric datasets are critical to improve our understanding of morphodynamic processes in the coastal area, as well as for decision-making on future adaptation measures. Originally designed for analyzing snapshots and time-exposure images from coastal video monitoring stations installed on buildings near the coastline, video techniques have enormously evolved over the last three decades. Recent advancements, e.g., extend their application to derive bathymetry estimations from ∼10-minutes videos captured at few frames per seconds (fps), allowing for more frequent and cost effective bathymetric estimations.

New algorithms, such as cBathy (Holman et al., 2013) or uBathy (Simarro and Calvete, 2022), depart from the linear dispersion relation and different signal processing tools to infer bathymetry from the propagation of surface water waves (which is considered as a footprint of the bed shape). They have already been tested and applied not only to videos from coastal monitoring stations, but also to videos from UAVs (unmanned aerial vehicles, commonly known as drones).  In this work we explore the potential use of these techniques to 45-seconds satellite videos captured at 10 fps and with a spatial resolution of 1 pixel per meter.

For this purpose, departing from uBathy, the nearshore bathymetry at Castelldefels beach has been estimated over a 6-months period using three satellite videos. The results are compared against those obtained from drones (ten 10-minutes videos over the same period) and from the fixed video monitoring station at Castelldefels beach (coo.icm.csic.es), recording 10-minutes videos three times daily. Furthermore, an echo-sounder bathymetric survey is used as Ground Truth for validation purposes.

The proposed approach presents a promising alternative to existing techniques for satellite imagery which are based on the analysis of single multior hyper-spectral snapshots (color-based techniques). On the one hand, from previous experience, the expected errors are smaller than those typically obtained with color-based techniques for snapshots and, on the other hand, they eliminate well-known problems of color-based techniques when water turbidity is high.

  • Holman, R., Bergsma, E. W. (2021). Updates to and performance of the cbathy algorithm for estimating nearshore bathymetry from remote sensing imagery. Remote Sensing, 3996.
  • Simarro, G., Calvete, D. (2022). UBathy (v2.0): a software to obtain the bathymetry from video imagery. Remote Sensing, 14(23), 6139.

Keywords: Remote sensing, Video imagery, Bathymetry inversion, UAV, Satellite.

How to cite: Marco-Peretó, C., Simarro, G., Calvete, D., Palombo-Blascetta, N., Durán, R., and Guillén, J.: Satellite derived bathymetries through high space-time resolution videos, EGU General Assembly 2024, Vienna, Austria, 14–19 Apr 2024, EGU24-8246, https://doi.org/10.5194/egusphere-egu24-8246, 2024.

EGU24-8384 | ECS | Posters on site | OS2.2

Short-term high-resolution physical-chemical-biological coupled observations on the inner shelf of the Northern Margin of the Gulf of Cadiz 

Françoise Meyer, Paulo Relvas, Alexandra Cravo, and Carlos de Sousa

Coastal systems are productive zones where the understanding of coupled physical-chemical and biological processes is of utmost relevance. Deployments of high-resolution observational systems in these zones, preferentially for long periods, play a key role contributing to bridging the knowledge gaps of the processes involved. In this context, the relationship between currents shifts at an artificial reef in shallow inner-shelf waters at the Northern Margin of the Gulf of Cadiz (NMGoC) and the impact on phytoplankton development was examined through a high-intensity observational experiment lasting for 12 days during April 2022. A wave-powered vertical profiler continuously logged an average of ~120 high-resolution profiles (2 Hz) every hour through the ~20 m deep water column, achieving an unprecedented description of the changing water column properties (temperature, salinity, dissolved oxygen, turbidity, and chlorophyll-a, Chl-a). Additionally, hourly current and local wind velocities were respectively retrieved from an Acoustic Doppler Current Profiler (ADCP) moored nearby and from the ERA 5 Reanalysis database.

During these 12 days of observation, three different periods were identified with direct changes in phytoplankton activity. Phytoplankton concentration varied greatly depending on the physical forcing, which included current velocity and direction, wind, which also comprised local land breeze, cross-shelf transport, and tidal conditions. While a 6-day upwelling event was observed, with a colder and less saline water signature, the intensity of the surface current was the highest (0.4 m s-1), with a mixed water column, and the phytoplankton concentration was at its lowest (< 1.5 mg m-3). High spring seasonal levels of Chl-a (3-4 mg m-3) were observed during a 4-day event of Coastal Counter Current (CCC) and a 20h current inversion to a westward alongshore flow, both driven by wind relaxation. The CCC setup was synonym of a reduction of the dominant eastward alongshore flow (0.2 m s-1 at surface), when an intermittent thermal stratification was found. This corresponded to a vertical thermal gradient of up to 2.5 °C along the water column, which partially resulted in the localised increase in phytoplankton biomass underneath the warmer strata, along with afternoon land-breezes enhancing cross-shelf mixing. Strong midday irradiance inhibited phytoplankton development, that systematically dropped at midday and increased only after 3 pm. The Chl-a concentration appeared homogenously mixed in the water column only when the alongshore current reversed to a westward flow, suggesting the westward advection of phytoplankton-rich waters from the retention “shadow” area in the vicinity of the Guadiana River.

While upwelling may be an important source of nutrients enabling phytoplankton development, rapid dynamic changes in biomass leave open speculation on the importance of current relaxation and longer residence time. Both enhanced thermal stratification and water column stability, favouring phytoplankton growth. Furthermore, diurnal local wind shifts played a role in cross-shelf mixing and the advection of near-shore and mid-shelf communities. These data demonstrate the importance of high-resolution observational systems in productive coastal areas, contributing to better understanding the processes involved.

How to cite: Meyer, F., Relvas, P., Cravo, A., and de Sousa, C.: Short-term high-resolution physical-chemical-biological coupled observations on the inner shelf of the Northern Margin of the Gulf of Cadiz, EGU General Assembly 2024, Vienna, Austria, 14–19 Apr 2024, EGU24-8384, https://doi.org/10.5194/egusphere-egu24-8384, 2024.

As tidal turbines are to be implemented in the highly energetic sea of Alderney Race (France), the aim of the study is to define a way to simulate its turbulent water regime and that of the similar site of Gregory sound (Ireland), in interaction with the ocean waves.  

The goal is to include a compatible 3D turbulence model in the existing formulations to develop a unified model for wave-current-turbulence interactions that is realistic in terms of numerical resources. This will be achieved by integrating the original LES turbulence model of Leray-α to sets of equations modeling wave-current interactions in 3D. 

This is being done using the CROCO numerical modeling system (https://www.croco-ocean.org) applied to the coastal ocean, in which the algorithms for the turbulence filtering procedures are to be implemented. The conclusions until now are the following: i) the Leray-α filtering procedure gives accurate results when applied for the three-dimensional mixing, ii) the Leray-α filtering procedure re-energizes the flow, iii) the model allows the coarser resolution to simulate the finer one, with a relevant reduction of the computational costs.  

For the next steps, Leray-α will be used to simulate the real locations of Alderney Race and Gregory sound, and waves interactions will be included in the study through the coupling of CROCO with the model Wavewatch III. 

How to cite: Calo, L. G., Bennis, A.-C., Boutet, M., and Dias, F.: Τοwards a unified mοdelling οf wave-current-turbulence interactiοns in three dimensiοns: applicatiοn tο Alderney Race (France) and Gregοry Sound (Ιreland) , EGU General Assembly 2024, Vienna, Austria, 14–19 Apr 2024, EGU24-9107, https://doi.org/10.5194/egusphere-egu24-9107, 2024.

EGU24-9111 | ECS | Orals | OS2.2

Wave Climate Analysis near the Irish Coast: SWAN-WAM Modeling from Present to the Future. 

Ashly Kalayil Uthaman, Tomasz Dabrowski, Gerard McCarthy, Sebastian Brune, and André Düsterhus

Coastal regions are dynamic environments influenced by various atmospheric and oceanic processes. Understanding the complex interplay of these forces is crucial for coastal management, navigation, and impact assessments. This becomes especially crucial when investigating climatological scale dynamics.

In this study, two state-of-the-art third-generation wave models, WAM-Cycle 6 (Wave Action Model) and SWAN 41.45 (Simulating Waves Nearshore – Version 41.45) are utilized for numerical wave projection. The methodology involves nested modeling approach by configuring SWAN within WAM to simulate waves at finer resolution near the Irish coast. This setup involves WAM operating on a coarser grid (1.0 degree), an intermediate WAM grid with a resolution of 0.5 degree, and SWAN running on a finer grid (0.025 degree). Wind forcing (10 m wind speed) from climate reanalysis produced by ECMWF (ERA5) is used to drive the wave model. A comparison with wave buoys at different locations around Ireland showed that models agreed on the significant wave height with bias and RMSE differing at most 0.6m.

Statistical techniques are utilized to connect the Max Planck Institute Earth System Model to ERA5 wind data, which is employed as forcing for the wave models to predict waves on climatological scales. The current model setup not only focuses on the present wave conditions but extends to provide future predictions and projections utilizing input data from climate models. By combining the insights from the present with the predictions and projections for the future, the current study aims to provide valuable information for decision-makers in the near and long-term future.

How to cite: Kalayil Uthaman, A., Dabrowski, T., McCarthy, G., Brune, S., and Düsterhus, A.: Wave Climate Analysis near the Irish Coast: SWAN-WAM Modeling from Present to the Future., EGU General Assembly 2024, Vienna, Austria, 14–19 Apr 2024, EGU24-9111, https://doi.org/10.5194/egusphere-egu24-9111, 2024.

EGU24-10385 | ECS | Orals | OS2.2

Coastal erosion mitigation by the use of an optimized 3D printed Triply Periodic Minimal Surface Floating Porous Breakwater 

Amirhosein Hasanabadi, Jacob Stolle, Damien Pham Van Bang, and Abdelkader Hammouti

Coastal regions are confronted with an escalating threat posed by the intensification of wave-induced erosion through rising sea levels and increased storm intensities, underscoring the critical need for innovative solutions to ensure effective coastal protection. Floating breakwaters as a possible optimal solution play a crucial role in land reclamation by facilitating the creation of recreational spaces, such as promenades, and enhancing aesthetical landscapes through tree plantations. Their significance lies in their ease of maintenance and the ability to be swiftly removed during stormy seasons, providing adaptable and sustainable solutions for coastal development. This study explores the potential of the Triply Periodic Minimal Surface (TPMS) floating porous breakwaters as an optimal approach, due to their intricate geometry and structural integrity which enhances the dissipation and dispersion of wave energy, to mitigate the impact of waves on vulnerable shorelines. TPMS structures offer a sustainable solution by being printable with re-use materials, promoting recycling, and aligning with the principles of a circular economy, thus contributing to eco-friendly coastal protection. Conducted in a controlled environment within a small-scale wave flume, our comprehensive laboratory-scale experiment focuses on assessing the performance of various TPMS structures under diverse conditions of wave and current generation. Systematically varying parameters, including TPMS architecture, unit cell size, relative density of porous structures, buoyancy depth (draft), and altering wave parameters and current rates, aims to elucidate the influence of these variables on the breakwater’s ability to dissipate, reflect, and transmit wave energy. The experiments involved exposure to various regular wave conditions generated by a plunger-type wavemaker, combined with different constant current rates to mimic realistic coastal scenarios. The controlled environment enables a nuanced understanding of how TPMS floating breakwaters respond to diverse wave dynamics, providing valuable insights into optimal design parameters. The performance evaluation is conducted using three widely known parameters: reflection coefficient (Cr), transmission coefficient (Ct), and dissipation coefficient (Cd) as they quantify the efficiency of wave energy absorption, transmission through the structure, and dissipation, providing key insights into the breakwater's ability to mitigate wave impact and protect coastal areas. To determine these parameters, wave separation analysis methods have been employed, including the method developed by Suh et al (2001), which considers the presence of simultaneous waves and currents, and the method developed by Zelt and Skjelbreia (1993), utilizing an arbitrary number of wave gauges. Anticipating that the outcomes of this study will contribute to the development of a novel coastal protection solution, we strive to strike a balance between environmental sustainability and effective wave attenuation. Furthermore, our research opens avenues for integrating optimal floating breakwaters with wave energy conversion systems, enhancing functionality and addressing both environmental and energy challenges associated with coastal protection.

How to cite: Hasanabadi, A., Stolle, J., Pham Van Bang, D., and Hammouti, A.: Coastal erosion mitigation by the use of an optimized 3D printed Triply Periodic Minimal Surface Floating Porous Breakwater, EGU General Assembly 2024, Vienna, Austria, 14–19 Apr 2024, EGU24-10385, https://doi.org/10.5194/egusphere-egu24-10385, 2024.

EGU24-11220 | ECS | Posters on site | OS2.2

The e3HOPE service: a high-resolution forecasting system for the hydrodynamics in Fangar Bay (Ebro Delta, NW Mediterranean Sea) 

Tania López Pérez, Marta Balsells Fernández-Pedrera, Margarita Fernández Tejedor, Jose María García-Valdecasas, Manel Grifoll, Óscar Ballesteros, Ernesto Bielsa, Marc Mestres, Manuel García-León, Manuel Espino, and Marcos G Sotillo

The Ebro Delta (EU Natura 2000 site and Natural Park and Biosphere Reserve (UNESCO)) is a complex area that faces a set of challenges mainly due to anthropogenic pressure and climate change related risks. The two Ebro embayments (i.e. Fangar and Alfacs) are natural protected areas of value for the survival of many species, such as the critically endangered Pinna nobilis. Likewise, these bays are two of the most productive aquaculture areas along the NW Mediterranean Sea.

The e3HOPE Service, led by NOW Systems (Nologin), provides a coastal operational forecast for the Ebro Delta. The system is based on a coastal downscaling of the Copernicus Marine Mediterranean regional solution, generating daily forecasts at 350 m resolution for the whole Ebro Delta and products at even higher resolution (around 70 m) for the Fangar Bay. A high-resolution ROMS model application, developed and tested by the LIM/UPC and integrated into the NOW operational framework, contributes to a seamless modelling in the area, filling the gap between the existing Copernicus regional forecast products and the local needs for a higher resolution model prediction.

The e3HOPE coastal service is completed with a tailor-made visualization service layer co-designed with IRTA. The new NAUI web service deployed by NOW for the Delta and Fangar Bay is a highly customizable tool that allows visualization of both met-ocean observations (including additional local monitoring routinely performed at specific fixed CTD stations) and the e3HOPE model forecasts at selected locations. This new NAUI deployment at the Ebro Delta certainly eases, and enhances, the IRTA uses of (new and existing) operational forecasting capabilities, making coastal data more actionable and transferred into fit-for-purpose applications for management, supporting sustainable aquaculture activities and biodiversity conservation.

This contribution is mainly focused on the skill of the current e3HOPE model release, being the model solution validated along 1 year with available in-situ observations (for temperature, salinity, sea level and surface and bottom water currents). Some insights into the operational forecast products delivered by the e3HOPE service, as well as into the planned service evolution (for 2024) is provided. Next e3HOPE operational release will include: (i) upgrade of the model system (to a wave-current coupled system, using COAWST), (ii)  improvement of the fresh water forcing (substituting climatological approaches by predicted data for the Ebro river, and some local channels discharges), and (iii) improvement in the initialization (using CTD data), in the Fangar Bay domain.

How to cite: López Pérez, T., Balsells Fernández-Pedrera, M., Fernández Tejedor, M., García-Valdecasas, J. M., Grifoll, M., Ballesteros, Ó., Bielsa, E., Mestres, M., García-León, M., Espino, M., and G Sotillo, M.: The e3HOPE service: a high-resolution forecasting system for the hydrodynamics in Fangar Bay (Ebro Delta, NW Mediterranean Sea), EGU General Assembly 2024, Vienna, Austria, 14–19 Apr 2024, EGU24-11220, https://doi.org/10.5194/egusphere-egu24-11220, 2024.

EGU24-11402 | ECS | Orals | OS2.2

Investigating Seagrass as a Nature-Based Solution for Coastal Protection: toward a Digital Twin Modelling Framework 

Jacopo Alessandri, Ivan Federico, Nicolás Biocca, Salvatore Causio, Simone Bonamano, Viviana Piermattei, Lorenzo Mentaschi, Giovanni Coppini, Marco Marcelli, Andrea Valentini, and Nadia Pinardi

The large presence of human infrastructure, protected natural environments, cultural heritage and major economic activities makes the coast one of the most vulnerable areas to climate change-related problems such as sea level rise and an increasing number of extreme events. Storm surges are the main cause of flooding and coastal erosion due to the combined effects of waves and currents that resuspend and transport sediments. In addition to the classic "gray" solutions, including engineered structures such as seawalls and groins, nature-based solutions have emerged in the last decade, based on the idea of finding solutions that are both effective and environmentally sustainable. It is well known that seagrass meadows can provide critical ecosystem services. Among them, coastal protection is one of the most important. The aim of this work is to investigate the effects of seagrass meadows on physical ocean variables relevant for sediment transport and sea level using a digital twin of the ocean. The seagrass is implemented in a three-dimensional unstructured grid ocean model (SHYFEM-MPI) as a form drag in the momentum equations, considering the flexibility of the plants. The implementation was verified with idealized test cases and three focus areas were selected along the Italian coast. The three areas are the Venice lagoon, the Emilia-Romagna coast (northern Adriatic Sea) and the Civitavecchia coast (Tyrrhenian Sea) and differ in morphology and seagrass species (Zostera marina, Posidonia oceanica). These areas are representative of a wide range of coastal environments. Interestingly, the results show different behavior depending on the geomorphology of the area. The lagoon environment, when exposed to extreme storm surge events, shows an alternating pattern of sea level variation with a reduction that can reach 5-10%, while in the other focus area the effect of seagrass on sea level is negligible. In all three areas, seagrass is very effective in reducing bottom current velocity by up to 50-60%, suggesting a possible important role against coastal erosion.

How to cite: Alessandri, J., Federico, I., Biocca, N., Causio, S., Bonamano, S., Piermattei, V., Mentaschi, L., Coppini, G., Marcelli, M., Valentini, A., and Pinardi, N.: Investigating Seagrass as a Nature-Based Solution for Coastal Protection: toward a Digital Twin Modelling Framework, EGU General Assembly 2024, Vienna, Austria, 14–19 Apr 2024, EGU24-11402, https://doi.org/10.5194/egusphere-egu24-11402, 2024.

We present a Lagrangian modelling study focusing on the loss of phytoplankton observed in the Elbe estuary, where an estimated 95% of the upstream population is lost in the dredged harbour channel before reaching the North Sea. The collapse has often been attributed to factors such as light limitation and zooplankton grazing; however these explanations lack evidence. Current Eulerian models, while producing reasonable results in predicting phytoplankton population dynamics, fall short in explaining the causes of the loss by tuning the mortality parameters to fit the observed data.

A recent study by Walter et al. (2017) suggests that light limitation alone does not fully explain the phytoplankton collapse. Our study explores an alternative hypothesis. We propose that high turbidity in the estuary may increase the coagulation rate of phytoplankton with inorganic sediments. Our approach involves modelling these coagulation interactions from a Lagrangian perspective. We combine schism hydrodynamics from Pein et al (2021), suspended particle concentrations based on the SediMorph model with the Lagrangian model OceanTracker to calculate collision and coagulation frequencies based on Burd (2013). This allows us to track changes in buoyancy and investigate their effects on light availability, providing a new approach to estimate phytoplankton losses due to sinking.

The poster presents our methodology and preliminary results on the potential influence of aggregation-induced sinking on phytoplankton light availability and its subsequent impact on population dynamics. This research aims to contribute to a more nuanced understanding of the factors driving phytoplankton loss in turbid estuarine systems and to refine the modelling approaches used in such ecological studies.

How to cite: Steidle, L. and Pein, J.: Modelling phytoplankton light availability under aggregation-induced buoyancy changes in the Elbe estuary from a Lagrangian Perspective, EGU General Assembly 2024, Vienna, Austria, 14–19 Apr 2024, EGU24-11922, https://doi.org/10.5194/egusphere-egu24-11922, 2024.

EGU24-11975 | ECS | Orals | OS2.2

 Impact of Climate Change on the Thermohaline Properties in the Ria de Vigo (NW Iberian Peninsula)  

Clara Ribeiro, Magda Catarina Sousa, Américo Ribeiro, Humberto Pereira, Inés Álvarez, and João Miguel Dias

Climate change will have far-reaching consequences on the environment, primary production, the economy, and society as a whole. Changes in hydrodynamic patterns pose a significant threat to low-lying coastal areas that often present high economic and biological value. The Ria de Vigo is part of the Rias Baixas, which are located in the NW of the Iberian Peninsula. This system, as well as the rest of the Galician coast, is an area of high primary production that is vulnerable to changes in hydrodynamics induced by climate change. These changes could have a detrimental effect on the system and the local communities as they strongly depend on the income brought by aquaculture, and therefore this study aims to understand how climate change will affect the thermohaline properties in the Ria de Vigo.

To better understand these impacts, a hydrodynamic model of the Rias Baixas was implemented to analyse the effect of climate change on the Ria de Vigo’s thermohaline properties. The methodology followed consisted of the application of the Delft3D three-dimensional numerical model in the Rias Baixas and the adjacent ocean with variables obtained from global and regional climate models, in future scenarios provided by CMIP6. This was done for the summer season and for two scenarios, the present-day and CMIP6’s SSP5-8.5 future scenario.

The results show that the water temperature in the Ria will increase in the future due to climate change, and it tended to be higher at the surface and lower at the bottom due to the intrusion of oceanic water from the Eastern North Atlantic Central Water (ENAWC). The salinity is expected to decrease and will be highest in the bottom layer near the connection with the ocean, and lowest in the surface layers and near the river, in the latter case, due to freshwater discharges. The density presented similar patterns, also decreasing in the future, and showing the expected stratification associated with the upwelling season.

How to cite: Ribeiro, C., Sousa, M. C., Ribeiro, A., Pereira, H., Álvarez, I., and Dias, J. M.:  Impact of Climate Change on the Thermohaline Properties in the Ria de Vigo (NW Iberian Peninsula) , EGU General Assembly 2024, Vienna, Austria, 14–19 Apr 2024, EGU24-11975, https://doi.org/10.5194/egusphere-egu24-11975, 2024.

EGU24-12829 | ECS | Orals | OS2.2

The influence of a submarine canyon on the wind-driven downwelling circulation over the continental shelf 

Gonzalo Saldías, Pedro Figueroa, and Susan Allen

The response of a coastal ocean model, simulating a typical Eastern Boundary system, to downwelling-favorable winds with and without the presence of a submarine canyon is studied. Three contrasting bathymetric configurations, considering different slopes and depth shelves, are evaluated. Experiments without a submarine canyon represent the well-known downwelling circulation and cross-shore structure with a downwelling front and the development of frontal instabilities generating density anomalies from the bottom up to 50 meters. The presence of the submarine canyon drives important changes in cross-shore flows, with opposing velocities on either side of the canyon. Onshore (offshore) and downward (upward) velocities develop in the upstream side of the canyon in the time-dependent and advective phases. Instabilities developed and are modified principally downstream of the canyon. Overall, the net impact of the canyon is to enhance offshore and downward transport into the canyon. However, particle tracking experiments reveal that particles can become trapped inside the canyon in an anticyclonic circulation when the particles pass the canyon over the continental slope. This particles stay inside the canyon up to 15 days.

How to cite: Saldías, G., Figueroa, P., and Allen, S.: The influence of a submarine canyon on the wind-driven downwelling circulation over the continental shelf, EGU General Assembly 2024, Vienna, Austria, 14–19 Apr 2024, EGU24-12829, https://doi.org/10.5194/egusphere-egu24-12829, 2024.

EGU24-13577 | Posters on site | OS2.2

Multi-phase simulation of gravel beach morphodynamics 

Cheng-Hsien Lee and Hao-Yu Cheng

This study applies an Eulerian–Eulerian multi-phase model to investigate sediment transport dynamics across a gravel beach subjected to regular waves. We numerically replicated a previously conducted full-scale experiment, achieving consistency between simulated and measured wave deformation, flow velocity, pore pressure, and morphological changes. The multi-phase model successfully reproduced observed phenomena, demonstrating berm formation for smaller waves and beach erosion for larger waves, aligning with findings from prior field studies. A sensitivity analysis reveals the substantial influence of the nonlinear drag component on berm formation, primarily through infiltration and exfiltration processes. Two dominant forces acting on sediment, namely drag and buoyancy, are studied. Drag emerges as the primary force governing sediment transport, exhibiting a strong correlation with depth-averaged flow velocity. The buoyancy, generated by plunging flow impacting the beach face, propels sediment landward in the bore front, coinciding with peak flow acceleration. Previous sediment transport models have empirically considered flow acceleration for gravel beach morphological evolution under waves. This study establishes a linkage between buoyancy, flow acceleration, and sediment transport rate in the bore front, offering valuable insights into the intricate interactions governing gravel beach dynamics. The findings contribute to our understanding of sediment transport mechanisms and hold implications for coastal engineering.

How to cite: Lee, C.-H. and Cheng, H.-Y.: Multi-phase simulation of gravel beach morphodynamics, EGU General Assembly 2024, Vienna, Austria, 14–19 Apr 2024, EGU24-13577, https://doi.org/10.5194/egusphere-egu24-13577, 2024.

EGU24-14463 | ECS | Posters on site | OS2.2

RANS simulations of surf zone hydrodynamics using Reynolds stress transport equations 

Yi-Hsuan Kuan, Chi-Hung Wang, and Cheng-Hsien Lee

The surf zone, situated at the beach where waves break, hosts various hydrodynamic phenomena, including waves, surface rollers (recirculating flow on the wave's front), and undertows. These phenomena have a substantial impact on beach evolution.  In this study, a Reynolds-averaged Navier-Stokes numerical model with Reynolds stress equations is applied to simulate the hydrodynamics of the surf zone. The air-water interface is captured using the volume of fluid method. To validate the numerical model, comparisons are made between the simulated results and measured ones from prototype experiments. The study extends to the analysis of wave energy, surface roller energy, and undertow dynamics. Furthermore, the numerical results are used to assess the effectiveness of a surf zone model based on the wave action equation, roller energy equation, and shallow water equation. This comprehensive approach enhances our understanding of the complex interactions within the surf zone and provides valuable insights for coastal engineering.

How to cite: Kuan, Y.-H., Wang, C.-H., and Lee, C.-H.: RANS simulations of surf zone hydrodynamics using Reynolds stress transport equations, EGU General Assembly 2024, Vienna, Austria, 14–19 Apr 2024, EGU24-14463, https://doi.org/10.5194/egusphere-egu24-14463, 2024.

EGU24-14844 | Orals | OS2.2

The Enigma of Claviaster libycus Survival Rate: Numerical Simulations Revealing its Superiority Post-Mass Extinction 

Tso-Ren Wu, Pin-Jie Lin, Jih-Pai Lin, Mei-Hui Chuang, Yi-Xuan Huang, and Jia-Jie Chu

Previous research indicates that the survival rate of Claviaster libycus following mass extinction events surpasses that of regular echinoids. This investigation seeks to assess the flow dynamics and scour patterns resulting from the distinctive distorted morphology of Claviaster libycus using numerical modeling. In addition, this study examines the localized scour that occurs around tsunami stones.

The numerical model employed in this investigation, Splash3D, has been adapted from the open-source code Truchas, originally developed by the National Laboratory of the United States. Splash3D is designed for solving the three-dimensional, incompressible Navier-Stokes equations. The Volume of Fluid Method (VOF) is utilized to characterize the kinematics of the water and sand surfaces.

As Claviaster libycus partially submerges in the sand, the rheological behavior of the bottom sand is characterized using the Discontinuous Bi-Viscous Model (DBM), derived from the conventional Bingham Model (BM). Unlike the BM model, the DBM model employs the yield strain rate instead of the yield stress to differentiate the plug from the liquefied zone. In the Plug zone, high viscosity signifies solid characteristics, with the plug-zone viscosity significantly surpassing that of the liquified zone. The liquified zones represent sand disturbed by local currents around irregular echinoids, while the plug zones depict undisturbed sand. The yield strain rate dictates the stiffness of the bottom sand, and the DBM model is employed to describe local scour around obstacles.

According to numerical simulations and experimental results, when the gonopore of Claviaster libycus is directed downstream, it can reduce the generation of horseshoe vortices. Therefore, compared to the gonopore pointing upstream, having the gonopore directed downstream can decrease the local scour around the sea urchin. Furthermore, in the event of a tsunami, intense local scouring occurs around large stones, leading to structural instability in the rock formations. Due to the tsunami's characteristic long wavelength, as the powerful water flow passes through, it eventually transports the large stones to the shoreline, forming what is known as tsunami stones. Detailed analysis results are presented at the conference.

How to cite: Wu, T.-R., Lin, P.-J., Lin, J.-P., Chuang, M.-H., Huang, Y.-X., and Chu, J.-J.: The Enigma of Claviaster libycus Survival Rate: Numerical Simulations Revealing its Superiority Post-Mass Extinction, EGU General Assembly 2024, Vienna, Austria, 14–19 Apr 2024, EGU24-14844, https://doi.org/10.5194/egusphere-egu24-14844, 2024.

EGU24-15734 | ECS | Posters on site | OS2.2

Space-time wave extreme analysis during typhoon event in the surrounding waters of South Korea 

Faizal Ade Rahmahuddin Abdullah and Jeseon Yoo

South Korea typically experiences one or two typhoons per year in the surrounding waters of the Yellow Sea and East China Sea. The intensification of typhoons often leads to significant coastal disasters caused by extreme waves in the region. This study presents an analysis of space-time wave extreme parameters, including maximum crest and wave height, using the spectral wave model WAVEWATCH III (WWIII) in the typhoon event. Wind data from ERA-5 reanalysis has been employed as the forcing field in the model. To assess the model's performance, simulations were compared with observational data during Typhoon Hinnamnor on September 4-6, 2022, using a stereo camera system installed on the Gageocho Ocean Research Station, an offshore platform in the Yellow Sea, southwest of South Korea. The results indicate that the spectral shapes and simulated space-time wave extremes have been found in fair agreement with observed data. However, some discrepancies primarily arise from inaccuracies in the wind forcing during the experiment.

How to cite: Abdullah, F. A. R. and Yoo, J.: Space-time wave extreme analysis during typhoon event in the surrounding waters of South Korea, EGU General Assembly 2024, Vienna, Austria, 14–19 Apr 2024, EGU24-15734, https://doi.org/10.5194/egusphere-egu24-15734, 2024.

EGU24-17790 | ECS | Orals | OS2.2

Lakes act as slow integrators of atmospheric disturbance like oceans: Evidence from a deep perialpline lake 

Marina Amadori, Mariano Bresciani, Claudia Giardino, and Henk A. Dijkstra

Slow and long-term variations of sea surface temperature anomalies have been interpreted as a red-noise response of the ocean surface mixed layer to fast and random atmospheric perturbations. How fast the atmospheric noise is damped depends on the mixed layer depth.

In this contribution we provide first evidence that lakes are integrators of noisy atmospheric variability just like oceans are. Based on a stochastic approach inspired by the stochastic climate models theory by the 2021 Nobel Physics laureate Hasselmann, we determine estimates of surface mixed layer depth from satellite measurements of Lake Surface Water Temperature (LSWT). The proposed approach is showcased for Lake Garda, Italy. We demonstrate that LSWT anomalies have a red noise spectrum resulting from the integration of higher frequency atmospheric forcing. By connecting the decorrelation time scale of LSWT anomalies to net heat fluxes, we obtain a spatially varying estimate of mixed layer depth. The basin-scale variability of our estimate is consistent with in-situ measurements and connects to the dominant modes of LSWT and chlorophyll-a concentrations obtained via empirical orthogonal functions. We thus show that (i) remotely-sensed quantities also carry information on the relevant spatial and temporal scales of mixed-layer processes and (ii) there is a limit to the persistence, hence the predictability, of the anomalies of LSWT, which poses a physical constraint to temporal gap-filling procedures.

The lessons learnt from ocean modelling is that such first-order picture necessarily overlooks finer scale dynamics, e.g. the effect of intense currents advecting water temperature vertically and horizontally, seasonal modulations and higher order modes of variability, which can be well described by more complex deterministic models. For such a reason, applications to spatial scales different than single points or small portions of the ocean are not common in marine literature. That kind of dynamics also affect lakes surface mixed layer, where spatial and temporal scales of thermal inertia shrink. Our study demonstrates that such a stochastic approach, rather classical in ocean literature, can be applied to the entire surface of enclosed basin and provides useful insights on the thermal and ecological heterogeneity beneath surface.

How to cite: Amadori, M., Bresciani, M., Giardino, C., and Dijkstra, H. A.: Lakes act as slow integrators of atmospheric disturbance like oceans: Evidence from a deep perialpline lake, EGU General Assembly 2024, Vienna, Austria, 14–19 Apr 2024, EGU24-17790, https://doi.org/10.5194/egusphere-egu24-17790, 2024.

EGU24-18024 | Orals | OS2.2

The BOxHy Project – Preparing a Pilot Site Study to Remediate Low Oxygen Conditions in Coastal Seas 

Patricia Handmann, Jakob Walve, Szilvia Haide, David Austin, and Lee Bryant

Low oxygen conditions increasingly threaten marine ecosystems by reducing habitat and biodiversity. Low oxygen also influences biogeochemical processes in water and sediment, greenhouse gas emissions, and contributes to toxic algae blooms by increased phosphorus recycling. As a result, this can have significant impact on regional economies, affecting thousands of jobs and billions of dollars. Deoxygenation of marine environments has been linked to human activities since the 1950s. Low-oxygen zones exist in the open ocean, over continental shelves, and in coastal seas, and are expected to expand especially in the coastal marine space in the future due to warming and increasing nutrient pollution.

Despite these on-going threats, current conservation measures do not effectively address the impacts of reduced oxygen or feature large time lags in implementation or projected outcomes.

While small-scale artificial oxygen injection (AO) has been used in lakes and marine aquaculture, larger-scale efforts are rare. The use of marine renewable energy for green hydrogen production presents a new, exciting opportunity for sea-based mitigation through anthropogenic oxygenation. The oxygen produced during hydrogen generation (e.g., 0.5 GW electrolyzer: ~210 t H2 d-1; ~1700 t O2 d-1) could be used to mitigate anoxia, restore benthic habitat, reduce phosphorus loading, and suppress algal blooms. Constant AO could also help combat increasing hypoxia caused by circulation shifts, decreased deep mixing in autumn and winter and climate change.

AO technologies that can scale up to marine applications are now common in USA reservoirs. The largest is 350 tonnes O2/d. Although there is evident potential, AO for the marine environment has received little attention, likely due to the current cost of oxygen and/or lack of infrastructure and awareness. Here, we want to present the BOxHy project, funded by the BSAP fund; this innovative project focuses on preparing a pilot study site for AO in the Baltic Sea environment with the perspective of upscaling the technology and science to basin wide scales. Offshore wind farms are planned in the Baltic Sea as the decarbonization of energy systems is advancing. Cost-efficient green hydrogen production strengthens the bankability of the concept, combining CO2 reductions through the hydrogen economy and a decrease in anoxia. Coupled to the production of offshore hydrogen, the injection of the electrolysis by-product oxygen is a novel innovative technique that could be adapted to other anoxia-prone coastal environments with similar environmental challenges after successful research and demonstration, closing major knowledge gaps and exploring the risks for unintended consequences.

With the BOxHy project we contribute to challenges 1 and 2 and 4 of the UN Decade of Ocean Science and Sustainable Development. Given the current threats to coastal marine ecosystems, exploring AO as a mitigation measure directly aligns with the principles of "prevention of harm” and the “precautionary approach” outlined in the “Declaration of Ethical Principles in Relation to Climate Change”.

How to cite: Handmann, P., Walve, J., Haide, S., Austin, D., and Bryant, L.: The BOxHy Project – Preparing a Pilot Site Study to Remediate Low Oxygen Conditions in Coastal Seas, EGU General Assembly 2024, Vienna, Austria, 14–19 Apr 2024, EGU24-18024, https://doi.org/10.5194/egusphere-egu24-18024, 2024.

EGU24-18602 | ECS | Posters on site | OS2.2

Quantifying the effect of urban agglomerations on coastal sea surface temperatures 

Alexander Plakias, Galina Churkina, and Sebastian Schubert

Effects of urban agglomerations on the land surface and atmospheric temperatures have been highly studied topics in recent decades. However, their effect on the temperature of adjacent water bodies has been poorly addressed. On the other hand, severe ecological and socio-economic consequences of rising water temperatures, especially in coastal ecosystems, such as harmful algal blooms, coral bleaching and fish mortality, are well-documented and huge efforts are being made to reduce negative impacts.
This study aims to improve understanding of spatio-temporal heat transfer from urban agglomerations into coastal ecosystems. We analyse coastal sea surface temperature anomalies around multiple cities in different climate zones using the Global Ocean OSTIA Sea Surface Temperature and Sea Ice Reprocessed dataset and additionally high resolution thermal infrared data acquired form Landsat 8/9. Cities are selected for comprehensive analysis based on varying latitudes and climate zones, with an additional requirement of present quantitative studies on the UHI. A quantification of the UHI propagation into coastal waters and comparison of magnitude of such localised coastal warming would not only be valuable for coastal modelling, but also enable impact evaluation of city designs on coastal warming to provide actionable knowledge for decision-makers to mitigate rising temperatures in urban coastal ecosystems.


How to cite: Plakias, A., Churkina, G., and Schubert, S.: Quantifying the effect of urban agglomerations on coastal sea surface temperatures, EGU General Assembly 2024, Vienna, Austria, 14–19 Apr 2024, EGU24-18602, https://doi.org/10.5194/egusphere-egu24-18602, 2024.

EGU24-19224 | Orals | OS2.2

Measuring Marine Hydrodynamics from Space Using Planet Satellite Imagery  

James Tlhomole, Matthew Piggott, and Graham Hughes

The inference of coastal ocean dynamics from consecutive remote sensing images plays a central role in a diverse range of domains such as marine conservation, spatial planning, as well as flood risk. We present a methodology for systematically identifying spatially overlapping image pairs in coastal regions from the PlanetScope archive, with minute-scale time lags and the potential for velocity field inference using classical algorithms. This ability is demonstrated through the novel estimation of submesoscale eddies from PlanetScope image pairs across a range of contexts. These include sea ice floes in the Siberian Sea of Okhotsk, a cyanobacterial bloom in the Baltic Sea, and suspended sediment in the Port of Al-Fao located in the Arabian Gulf. Additionally, comparison of the latter with coinciding velocity fields from a Delft3D model shows good quantitative agreement in regions with high suspended sediment concentration. We successfully develop a workflow pipeline for identifying and processing image pairs from these opportunistic overlaps, unlocking a new large-scale data source of coastal ocean surface velocities to be used alongside modelling frameworks. 

How to cite: Tlhomole, J., Piggott, M., and Hughes, G.: Measuring Marine Hydrodynamics from Space Using Planet Satellite Imagery , EGU General Assembly 2024, Vienna, Austria, 14–19 Apr 2024, EGU24-19224, https://doi.org/10.5194/egusphere-egu24-19224, 2024.

EGU24-19672 | ECS | Posters on site | OS2.2

Tide of change: understanding hydrodynamic responses to sea level rise in intertidal environments. Case Study of the Sylt-Rømø Bight, the Wadden Sea 

Gaziza Konyssova, Vera Sidorenko, Alexey Androsov, Sara Rubinetti, Lasse Sander, and Karen Helen Wiltshire

Sea-level rise (SLR) significantly modifies the hydro- and morphodynamics of the tidal flat systems, such as the Wadden Sea (south-eastern North Sea). The current research aims to investigate changes in intertidal dynamics in response to future sea level rise scenarios and their implications for local Wadden Sea habitats, with a focus on the Sylt-Rømø Bight as a case study.

With the help of the coastal hydrodynamic model FESOM-C, we simulated a series of SLR scenarios based on the Sixth Assessment Report of the IPCC and morphodynamical projections and analyzed the resulting changes in tidal inundation, local circulation patterns and tidal asymmetry. The simulations were performed on the unstructured mesh with a resolution of up to 2 m in the wetting-drying zone. The results reveal that the intertidal flat areas remain rather resilient to the projected scenarios by 2050. Despite an increasing wetting probability, only 2.2% and 3.4% (13 and 21 km2) of their area are expected to submerge for low and high emissions scenarios (RCP 2.6 and RCP 8.5), respectively. By the end of the century, these percentages increase two and four times, reaching 4.8% and 13.9% (29 and 84 km2) for low and high-emission scenarios. Although an evolution of the peak current velocities is also rather negligible by 2050, a shift in the tidal asymmetry is apparent which points to a gradual transition from a tidal to a lagoon-like system in the future as sea-level rise accelerates. As the projected changes are spatially very diverse, we provide maps of tidal asymmetry in terms of flood/ebb duration, mean and max velocities and discuss the implications for the local habitats.

How to cite: Konyssova, G., Sidorenko, V., Androsov, A., Rubinetti, S., Sander, L., and Wiltshire, K. H.: Tide of change: understanding hydrodynamic responses to sea level rise in intertidal environments. Case Study of the Sylt-Rømø Bight, the Wadden Sea, EGU General Assembly 2024, Vienna, Austria, 14–19 Apr 2024, EGU24-19672, https://doi.org/10.5194/egusphere-egu24-19672, 2024.

EGU24-20248 | Orals | OS2.2

Use of an urban fjord as a living laboratory for understanding impacts of hypoxia on nitrous oxide production and iodine cycling, and for testing of mitigation strategies. 

Douglas Wallace, Qiang Shi, Julie LaRoche, Martha Segura Guzman, Subhadeep Rakshit, Chris Algar, Ludovic Pascal, and Gwenaëlle Chaillou

The Bedford Basin is a a 70 m deep, seasonally stratified and hypoxic semi-enclosed fjord on the West Atlantic coast (Nova Scotia, Canada). The basin is connected to the Atlantic Ocean (Scotian Shelf) via a narrow 20 m deep sill that restricts exchange and mixing of surface and bottom waters. Bedford Basin is located in an urban setting (Halifax) and receives considerable wastewater input. The Basin has benefitted from a weekly multidisiciplinary time-series of physical, chemical and microbiological data over several decades. Over the past decade, the intensity of hypoxia has increased due to warmer winters and reduced convective renewal of the deeper water. The presentation will highlight understanding of physical-microbiological-chemical interactions, and sediment-water exchanges, that affect the concentration and speciation of nitrogen and iodine species in relation to variable levels of oxygen. A focus will be on interannual and short-term variability in production of nitrous oxide and iodide in relation to variations in oxygen, microbial diversity and sediment-water exchange. The potential of coastal basins to act as living laboratories for  studying complex, redox-dependent processes through comprehensive, multidisciplinary, time-series study will be demonstrated. The closely related potential of urban fjords to act as testbeds for evaluation of emerging approaches to the mitigation of coastal hypoxia will be emphasized.

How to cite: Wallace, D., Shi, Q., LaRoche, J., Segura Guzman, M., Rakshit, S., Algar, C., Pascal, L., and Chaillou, G.: Use of an urban fjord as a living laboratory for understanding impacts of hypoxia on nitrous oxide production and iodine cycling, and for testing of mitigation strategies., EGU General Assembly 2024, Vienna, Austria, 14–19 Apr 2024, EGU24-20248, https://doi.org/10.5194/egusphere-egu24-20248, 2024.

EGU24-21449 | Posters on site | OS2.2

Laboratory experiments and numerical modeling of infragravity wave refraction and convergence on a reef platform 

Shih-Feng Su, Chia-Hsuan She, I-An Chen, and Wen-Kai Weng

Infragravity waves, characterized by water surface fluctuations between 25s and 250s, are generated from the release of long waves bound to short-wave group envelopes and temporal variations of breaking locations of these envelopes. On coral reefs, infragravity waves can dominate over short waves and control the processes of sediment transport and stability of reef islands/cay, particularly in combination with high tides and large wave events. A number of studies have investigated the development of infragravity waves in relation to a cross-section of reef shape, but few studies have attempted to address two-dimensional planar reefs, considering spatial and temporal variations in wave energy for sediment deposits on reefs. The study aims to characterize the variability of infragravity waves on a reef platform through a laboratory experiment and numerical modeling. The experiment was conducted in a 50m × 50m wave basin with a 1:200 scale reef platform model. The experiment was to quantify wave refraction, propagation from opposite directions through wave diffraction, and wave convergence on the reef platform under varying high swell energy. A wave-resolving wave model FUNWAVE-TVD, is employed to simulate swell and infragravity waves on the reef and the detailed wave hydrodynamics around the location of sediment deposits. Furthermore, the effects of wind stress on the development of infragravity waves on the reef platform are studied by the model incorporating a wind stress term. We also conduct a sensitivity study of wind drag parameterization to evaluate the effects of wind on the development of infragravity waves. These findings will provide crucial insights into accurate wave dynamics for predicting sedimentary processes and morphodynamics of reef platform islands.

How to cite: Su, S.-F., She, C.-H., Chen, I.-A., and Weng, W.-K.: Laboratory experiments and numerical modeling of infragravity wave refraction and convergence on a reef platform, EGU General Assembly 2024, Vienna, Austria, 14–19 Apr 2024, EGU24-21449, https://doi.org/10.5194/egusphere-egu24-21449, 2024.

EGU24-22314 | Orals | OS2.2

Estimating the Distribution of Land-based Marine Debris and Risk Assessment to Sensitive Resources in an Estuarine Ecosystems with high river discharge in South Korea 

Choong-Ki Kim, Gang Sun kim, Junsung Kim, Hyunjung Hong, Ki-Young Bang, and Seung-Hyun Lee

Marine debris can be classified as either land or marine origin, with more than 8 million tons of land-based debris entering the ocean globally each year. Land-based debris enters estuaries and coasts in large quantities through river systems, which may cause water pollution, damage to aquatic and coastal ecosystems, and marine safety accidents. We applied an integrated approach linking watersheds, rivers, estuaries and oceans to investigate the transport processes of land-based debris into an estuarine ecosystem, and assessed their risk to sensitive resources in South Korea, a country with a monsoonal climate.

Based on the time-series trash data collected at major dams, a model was developed to estimate the amount of land-based debris generated in the watershed. We found that land cover, hydrological characteristics, and socioeconomic factors of the watershed played an important role in the generation of land-based debris. Most of the land-based debris is vegetation wastes and plastics, which tends to be discharged through rivers during the monsoon season when rainfall intensity is high. A particle transport modeling was used to estimate the spread of land-based debris through rivers to the Geum-River estuarine system. The results showed a good agreement with the distribution of marine debris monitoring data. The Integrated Valuation of Ecosystem Services and Tradeoffs (InVEST)-Habitat Risk Assessment model was used to assess marine debris risk to sensitive resources in the estuarine ecosystems. The spatially explicit results of risk assessment provide key information to support marine debris management policies at the national and regional levels.

Acknowledge: This research was a part of the project titled “Development of Smart Technology to Support the Collection and Management of Marine Debris” (grant number 20200594), funded by the Ministry of Ocean and Fisheries (Korea), supported by Korea Institute of Marine Science & Technology Promotion. Also, this research was a part of the project titled “Establishing a smart response platform for marine accidents” (grant number 20220463), funded by the Korea Coast Guard, supported by Korea Institute of Marine Science & Technology Promotion. The project was implemented by the Korea Environment Institute (project 2024-007(R), project 2024-008(R)).


How to cite: Kim, C.-K., kim, G. S., Kim, J., Hong, H., Bang, K.-Y., and Lee, S.-H.: Estimating the Distribution of Land-based Marine Debris and Risk Assessment to Sensitive Resources in an Estuarine Ecosystems with high river discharge in South Korea, EGU General Assembly 2024, Vienna, Austria, 14–19 Apr 2024, EGU24-22314, https://doi.org/10.5194/egusphere-egu24-22314, 2024.

EGU24-320 | ECS | Posters on site | OS2.3

New vision on the Ionian Sea abyssal variability through integrated approaches. 

Beatrice Giambenedetti, Nadia Lo Bue, and Vincenzo Artale

The processes involved in abyssal variability, their connections to the water column above, and their vulnerability to climate change are still unknown. This is due to a dearth of long-term observations below 2 km of depth. To fill these gaps, our approach leverages existing datasets using different methodologies. The Ionian Sea in the eastern Mediterranean is a unique location to investigate abyssal dynamics considering that it serves as a gateway between two major deep-water formation zones i.e., the Adriatic and Aegean seas. Moreover, the observed severe thermohaline variations experienced by the bottom layers of the Ionian Sea during the last decades, had dramatic effects on the deep circulation, leaving their signature on the whole Mediterranean Sea. The variation of the deep stratification, the causes that generate it, and the impact it produces are still under debate. The mechanisms involved in such variability, as well as the connection with the abyss and the above layers of the water column, are not fully understood. Through tidal and fine-scale mixing analysis, seafloor observations, and a tailored semi-analytical model we depicted the critical role of stratification, morphology, and tides in enhancing local diffusivity in the abyssal layer. Stratification, in particular, influences stability and the rotation of vorticity among different density layers, linking deep-sea variability to the entire water column. We achieved these results by combining different indirect methodologies exploiting all available resources at best with a synergic approach, getting a possible representation of what happens at depths.

How to cite: Giambenedetti, B., Lo Bue, N., and Artale, V.: New vision on the Ionian Sea abyssal variability through integrated approaches., EGU General Assembly 2024, Vienna, Austria, 14–19 Apr 2024, EGU24-320, https://doi.org/10.5194/egusphere-egu24-320, 2024.

EGU24-5828 | ECS | Posters on site | OS2.3

The Dynamics of Levantine Intermediate Water in the Mediterranean Sea: A Comprehensive Study of Spatial and Temporal Evolution, Climate Change Signals, and Ecosystem Impact. 

Batoul Geara, Pierre Testor, Pascal Conan, Xavier Durrieu De Madron, Milad Fakhri, and Anthony Bosse

The Levantine Intermediate Water (LIW) plays a crucial role in the Mediterranean thermohaline circulation, significantly influencing the regional climate and ecosystems through mixing with under- and above-lying waters.  Our study aims to explore the spatial and temporal evolution of LIW, tracing the journey of this water mass from its formation in the Levantine Basin to its arrival in the western Mediterranean Sea. While previous studies have confirmed some aspects of the evolution of the LIW along its trajectory, our approach stand out by using an extensive in situ database composed by a compilation of different data sets, extending on the entire Mediterranean Sea. This dataset incorporates CTD profiles from ship cruises, gliders, floats, and XBT measurements during 2018-2023 period. This data will be used to map LIW pathways and dispersion patterns, to offer insights into its interactions with neighboring water masses. Furthermore, our investigation focuses on LIW's evolution over years, with a specific emphasis on identifying signals of climate change in particular areas. Preliminary findings indicate notable shifts in LIW properties, encompassing temperature, salinity, and nutrient content, hinting at potential climate-induced alterations.  These observations contribute significantly to our understanding of the broader implications of climate change on Mediterranean water masses and ecosystems.

How to cite: Geara, B., Testor, P., Conan, P., Durrieu De Madron, X., Fakhri, M., and Bosse, A.: The Dynamics of Levantine Intermediate Water in the Mediterranean Sea: A Comprehensive Study of Spatial and Temporal Evolution, Climate Change Signals, and Ecosystem Impact., EGU General Assembly 2024, Vienna, Austria, 14–19 Apr 2024, EGU24-5828, https://doi.org/10.5194/egusphere-egu24-5828, 2024.

EGU24-5839 | ECS | Orals | OS2.3

Dynamic response of the Mediterranean Sea surface circulation at various global warming levels: A multi-model approach 

Iván Manuel Parras-Berrocal, Robin Waldman, Florence Sevault, Nicolas Gonzalez, and Samuel Somot

Changes in the Mediterranean circulation patterns due to global warming may have strong socio-economic and environmental impacts. Here, we analyze the future evolution of the Mediterranean surface circulation under different levels of global warming (from 1°C to 4ºC) with respect to the preindustrial period. To this end, we use a set of 18 multi-decadal simulations (7 historical and 11 scenario projections) from a set of seven coupled regional climate system models of the Med-CORDEX initiative. For the first time, global warming levels are used to assess impacts of climate change on the Mediterranean Sea, allowing us to combine CMIP5 (RCP2.6, RCP4.5 and RCP8.5) and CMIP6 (SSP5-8.5) scenarios in a multi-model and ensemble approach. Most of the models show an accurate representation of the surface circulation in the historical period, although biases in the mean SSH and wind stress are observed. In terms of variability, we show that a minimum horizontal resolution of ~11 km is necessary to reproduce the dominant eddy-driven dynamics. The circulation is mainly driven by geostrophic currents, while Ekman currents are about one order of magnitude smaller than the mass-driven circulation. We find a linear relationship between the mean absolute dynamical response and the global warming level. The mean surface circulation shows the strongest response in the Balearic Sea, the Gulf of Lions, the southern Adriatic and along the Mid-Mediterranean Jet. Furthermore, our results suggest that future changes in the Mediterranean circulation variability will be primarily associated with a general increase of high-frequency processes (eddies), while the seasonal cycle and interannual variability will play a secondary role.

How to cite: Parras-Berrocal, I. M., Waldman, R., Sevault, F., Gonzalez, N., and Somot, S.: Dynamic response of the Mediterranean Sea surface circulation at various global warming levels: A multi-model approach, EGU General Assembly 2024, Vienna, Austria, 14–19 Apr 2024, EGU24-5839, https://doi.org/10.5194/egusphere-egu24-5839, 2024.

EGU24-5973 | Posters on site | OS2.3

Disentangling local processes at the Strait of Gibraltar and their climatic influence on Mediterranean hydrography 

Nicolas Gonzalez, Robin Waldman, Samuel Somot, Florence Sevault, Jérôme Chanut, and Hervé Giordani

The Mediterranean Sea is a semi-enclosed basin losing heat and freshwater to the atmosphere. As such, Mediterranean volume, heat, and salt budgets are strongly constrained by water mass exchanges with the global Ocean. Most of these exchanges take place through a shallow and narrow channel: the Strait of Gibraltar (SoG), making local processes at stake in its vicinity impact on a larger scale. Among these, tidal and fine-scale dynamics are known to influence Mediterranean hydrography, but their combined effects remain unclear.

In this study, we address this question by comparing a set of four 30 year-long fully-coupled hindcast simulations of the Mediterranean region (CNRM-RCSM6 regional climate model, ~ 7km ocean horizontal resolution) differing only by the inclusion or omission of explicit tidal forcing and refined resolution (~ 1.5km) at the SoG. We show that tidal and fine-scale processes are equally relevant to Mediterranean hydrography and that their interplay is essential over climatic scales. On the one hand, tides drive the water mass transformations across the strait and the zonal slope of the interface between the exchanged flows. On the other hand, fine-scale dynamics, shaped by the abrupt topography of the strait, drive the Atlantic layer thickness and the magnitude of its inflow. 

These results highlight that kilometric-scale and tidal dynamics at the SoG are essential components of the physical system shaping the Mediterranean mean state and climatic trends. As such, they should be explicitly included in numerical models or parameterized when this is numerically unaffordable.

How to cite: Gonzalez, N., Waldman, R., Somot, S., Sevault, F., Chanut, J., and Giordani, H.: Disentangling local processes at the Strait of Gibraltar and their climatic influence on Mediterranean hydrography, EGU General Assembly 2024, Vienna, Austria, 14–19 Apr 2024, EGU24-5973, https://doi.org/10.5194/egusphere-egu24-5973, 2024.

EGU24-6224 | Orals | OS2.3

The skeleton of the Mediterranean Sea 

Angelo Rubino, Stefano Pierini, Sara Rubinetti, Michele Gnesotto, and Davide Zanchettin

The atmosphere forces oceanic motions. However, direct atmospheric forcing is not able to explain several observed features of the mean Mediterranean circulation like, for instance, the large-scale meridional sea level inclination, a strong and persistent feature of the Mediterranean oceanography. Low-frequency changes in the Mediterranean Sea have also been observed that cannot be explained by a mere response of the ocean to atmospheric changes. However, model studies of the intrinsic mean state and variability of the Mediterranean Sea appear to be lacking.

Here, we start filling this gap of knowledge. We demonstrate [1] that a conspicuous part of the observed Mediterranean mean state and variability belongs to a skeleton captured for the first time by a multi-centennial ocean simulation without atmospheric forcing. An eddy-permitting nonlinear, shallow-water multilayer numerical model was only forced by steady transports of Atlantic Water and Levantine Intermediate Water at its western and eastern open boundaries located along meridional sections crossing the strait of Gibraltar and the Levantine basin, respectively. The lack of any atmospheric forcing is very peculiar of our approach and is crucial for revealing the intrinsic mean state.

Comparison of the simulated annual mean surface displacement with the corresponding absolute dynamic topography altimetric data for the period 1993–2020 provided by the Copernicus Climate Data Store, yields large patterns of coherent correlation -including a large-scale meridional sea level inclination- that are clearly all of intrinsic origin. This result paves the way to the recognition of a noticeable contribution exerted by intrinsic oceanic mechanisms to the sea level rise observed in recent years over the Mediterranean Sea. In addition, a strong and previously unknown intrinsic oceanic variability appears, which contributes to explaining a conspicuous part of the poorly understood observed interior low-frequency oceanic variability.

[1] Rubino A, S. Pierini, S. Rubinetti, M. Gnesotto and D. Zanchettin, 2023: The skeleton of the Mediterranean Sea. J. Mar. Sci. Eng., 11, 2098; https://doi.org/10.3390/jmse11112098.

How to cite: Rubino, A., Pierini, S., Rubinetti, S., Gnesotto, M., and Zanchettin, D.: The skeleton of the Mediterranean Sea, EGU General Assembly 2024, Vienna, Austria, 14–19 Apr 2024, EGU24-6224, https://doi.org/10.5194/egusphere-egu24-6224, 2024.

EGU24-6292 | ECS | Posters on site | OS2.3

Exploring seasonal to interannual variability of the carbonate system in the southern Adriatic 

Carlotta Dentico, Giuseppe Civitarese, Michele Giani, Angelo Rubino, and Vanessa Cardin

Since the beginning of the industrial revolution, about 30% of total anthropogenic CO2 emissions have been absorbed by the world’s oceans, resulting in a global reduction in ocean pH. This process, commonly referred to as ocean acidification, is considered one of the greatest threats to marine ecosystems. Recently, it has been recognised that the regulation of oceanic CO2 uptake is controlled by the oceanic overturning circulation. Accordingly, the site of dense water formation in the Southern Adriatic (SAd), where the Eastern Mediterranean deep thermohaline circulation originates, could play an important role in CO2 sequestration and acidification of the Mediterranean Sea. The Southern Adriatic is characterised by a quasi-permanent cyclonic circulation and it is known that deep water forms in the centre of the gyre through winter open-ocean convection. In this contribution, we used data from several oceanographic cruises between 2008 and 2023 to investigate the spatial and temporal variability of the carbonate system properties in the Southern Adriatic. The vertical distributions of total alkalinity (AT), pH, inorganic nutrients, dissolved inorganic carbon (DIC) as well as CO2 partial pressure (pCO2), calculated with the CO2Sys software, are analysed. Time series of high-frequency pCO2 data from an automatic sampling system set up on the surface buoy of the E2M3A facility, operated by the Italian National Institute of Oceanography and Applied Geophysics (OGS), are also presented. E2M3A is moored in the centre of the southern Adriatic Pit (SAP) and has been collecting pCO2 data since 2015. We discuss the seasonal and interannual variations of the carbonate system variables and the influence of physical and biological processes on this variability. These results contribute to the understanding of the role of the Southern Adriatic in transporting and storing CO2 to the deeper layers and in inducing ocean pH changes. Furthermore, we emphasise the importance of an integrated oceanographic approach that combines fixed-point observations with hydrographic surveys to comprehensively investigate the response of the Adriatic Sea to climate change. 

How to cite: Dentico, C., Civitarese, G., Giani, M., Rubino, A., and Cardin, V.: Exploring seasonal to interannual variability of the carbonate system in the southern Adriatic, EGU General Assembly 2024, Vienna, Austria, 14–19 Apr 2024, EGU24-6292, https://doi.org/10.5194/egusphere-egu24-6292, 2024.

EGU24-7406 | Posters on site | OS2.3

Ten years of continuous monitoring of the EMSO shelf-slope observatory on the western margin of the Southern Adriatic 

Francesco Paladini de Mendoza, Claudio Pellegrini, Stefano Miserocchi, Katrin Schroeder, Jacopo Chiggiato, Irene Sammartino, Patrizia Giordano, and Leonardo Langone

Since 2012, the shelf-slope observing site of the EMSO regional facility (European Multidisciplinary Seafloor and water column Observatory) along the western margin of the Southern Adriatic has been monitoring the dynamics of the near-bottom water, focusing on two distinct regions – the open slope and the Bari canyon.  Two moorings have been placed at these sites with the aim to investigate the dynamics associated with episodic dense shelf water (DSW) cascading down the slope. The consequential impact on deep-sea morphodynamics, biogeochemical cycles and food webs underscores the critical importance of this investigation. This process is linked to preconditioning processes that occur in the northern Adriatic Sea. The recurrence of cascading events has not been constant over the last decade and their impact has been determined by a detailed analysis of sedimentary processes triggered by the passage of the dense water flow. In the context of the PRIN-PASS project that integrates for the first-time high-resolution sequence stratigraphy with a quantitative assessment of modern sedimentary processes the sediment flux toward the deep Adriatic Pit was quantified by analysing the turbidity signal and the analysis of ADCP backscatter near the sea bottom during the flow pulses providing direct evidence for the active role of density current in bottom reshaping. The different response of the ADCP backscatter gives a qualitative indication of the transported particles. On the open slope, well-defined backscatter signals during flow peaks indicate prevalent resuspension processes that also impact fine sandy sediments. Conversely, in the canyon, lower agreement is attributed to the greater textural heterogeneity of particles. The data analysis has shown that the canyon is the dominant pathway of sediment transfer to the deep basin. Furthermore, it highlights that the hydrodynamic event predominantly responsible for the particle transfer to the deep basin is the DSW cascading, which, although only constituting a mere 1% of the total dataset, is responsible for more than 80% of the total down-slope sediment transfer. X-ray fluorescence (XRF) data from discrete seafloor samples further corroborated these findings highlighting a sediment transport along the Adriatic shelf with a sediment provenance from the Apennines. Moreover, the canyon appears the only sector showing seafloor sediment provenance from the Western Alps suggesting sediment transport up to 1000 km. DSW cascading, which is represented by short-lived current pulses, also contributes to the injection of oxygenated water into the 500-1000 m layer fostering the ventilation of the deep southern Adriatic basin. The activities carried out at the regional EMSO facility provide high-resolution observations of dynamic processes along the continental margin and the moorings represent a unique long-term observatory for assessing the impact of climate change.

How to cite: Paladini de Mendoza, F., Pellegrini, C., Miserocchi, S., Schroeder, K., Chiggiato, J., Sammartino, I., Giordano, P., and Langone, L.: Ten years of continuous monitoring of the EMSO shelf-slope observatory on the western margin of the Southern Adriatic, EGU General Assembly 2024, Vienna, Austria, 14–19 Apr 2024, EGU24-7406, https://doi.org/10.5194/egusphere-egu24-7406, 2024.

In the ocean, bioluminescent organisms are ubiquitous (e.g. Martini and Haddock 2017) and
deeply related to the ocean dynamics at multiple-scale (e.g. Piontkovski et al 2023).
Bioluminescent organisms range from bacteria (bioluminescent bacteria have ecological
importance in the biological carbon pump, e.g. Tanet et al 2020) to fishes, not forgetting in
particular many zooplankton species and most dinoflagellates (these bioluminescent organisms
emit light through mechanical stimulation allowing in situ sensing of these biological tracers).
BIOLUMOPS (“BIOLUminescence Marine, Observations spatio-temporelles in situ par Planeur
Sous-marin”) is a project running for 3 years from January 2024 to December 2026. The study
focuses on the Gulf of Lion, in the Mediterranean Sea, which is known to be an area where winter
deep convection occurs recurrently, in correlation with bioluminescence signals (Martini et al 2014).
The project aims at observing the bioluminescence and their related physical and biogeochemical
variables at multiscale: from the fine scale vertical sawtooth paths sampling of an ocean glider to
the large scale surface ocean colour sampling of satellite remote sensors, not mentioning the
discreet sampling of the ship measurements. The four main tasks of this project are
multidisciplinary: 1. integrating two (reference and innovative) bioluminescence sensors on a same
glider; 2. deploying ship and glider in the Gulf of Lion over three surveys; 3. data processing using
classification of organisms, in relation with biochemical and hydrodynamic variables; 4. validating
ocean colour satellite image of dinoflagellates in the highly dynamic waters of the Gulf of Lion.
References
Martini, S., Nerini, D., Tamburini, C. (2014), Relation between deep bioluminescence and oceanographic
variables: A statistical analysis using time–frequency decompositions, Progress in Oceanography, 127, 117-
128, https://doi.org/10.1016/j.pocean.2014.07.003
Martini, S., Haddock, S. (2017), Quantification of bioluminescence from the surface to the deep sea
demonstrates its predominance as an ecological trait, Sci Rep 7, 45750, https://doi.org/10.1038/srep45750
Piontkovski, S. A., Melnik, A. V., Serikova, I. M., Minsky, I. A., Zhuk, V. F. (2023), Bioluminescent eddies of
the World Ocean, Luminescence, 38(4), 505, https://doi.org/10.1002/bio.4475
Tanet, L., Martini, S., Casalot, L., and Tamburini, C. (2020), Reviews and syntheses: Bacterial
bioluminescence – ecology and impact in the biological carbon pump, Biogeosciences, 17, 3757–3778,
https://doi.org/10.5194/bg-17-3757-2020.

How to cite: Jourdin, F. and Martini, S.: Glider, ship and satellite measurements of marine bioluminescence in the Mediterranean Sea: the BIOLUMOPS project, EGU General Assembly 2024, Vienna, Austria, 14–19 Apr 2024, EGU24-8144, https://doi.org/10.5194/egusphere-egu24-8144, 2024.

EGU24-8543 | ECS | Orals | OS2.3

Intermittent supply of North Adriatic Dense Water to the deep South Adriatic Pit  through gravity currents: an observational study 

Julien Le Meur, Achim Wirth, Francesco Paladini de Mendoza, Stefano Miserocchi, and Vanessa Cardin

Severe winters in the northern Adriatic potentially generate gravity currents flowing along the eastern flank of the Adriatic, filling and ventilating the deepest layer of the southern Adriatic Pit with high-density water. The pulses of gravity current observed by data at the moorings in the Canyon of Bari (BB site) and the shelf-slope observation site (FF) are followed by strong fluctuations in the thermohaline properties in the pit observed at the E2M3A site in 2012, 2017, 2018 and 2022. While temperature was the main driver of gravity flow in 2012, salinity played an equal or greater role in the following extreme gravity current events. Thermohaline data from these three moorings show an arrival from mid-February to June and the relaxation phase of the high frequency oscillations (few tens of hours) lasts about two months. During this phase, the gravity current water displaces and mixes with the surrounding water masses. The gravity currents lead to a restratification of the water column, while local convection processes in winter time erode the stratification.

The effects of gravity currents in the southern Adriatic have a profound impact on the Eastern Mediterranean circulation, influencing its thermohaline properties and facilitating the ventilation of deep waters. The Adriatic dense water formation adds to and competes with the convection in the Gulf of Lion, forming the dense waters in the Mediterranean which outflow through the Strait of Gibraltar into the northern Atlantic.

The European Multidisciplinary Seafloor and water column Observatory (EMSO) South Adriatic Regional Facility (E2M3A in the pit, BB and FF at the edge of the pit) has been providing hourly data on temperature, salinity, oxygen and currents along the water column for about 15 years. This makes it possible to study these high-frequency small-scale processes and their interaction with the surroundings over an extended period of time and to assess their role in a changing climate.

How to cite: Le Meur, J., Wirth, A., Paladini de Mendoza, F., Miserocchi, S., and Cardin, V.: Intermittent supply of North Adriatic Dense Water to the deep South Adriatic Pit  through gravity currents: an observational study, EGU General Assembly 2024, Vienna, Austria, 14–19 Apr 2024, EGU24-8543, https://doi.org/10.5194/egusphere-egu24-8543, 2024.

EGU24-15799 | Orals | OS2.3

Palaeohydrological reconstruction of the Eastern Mediterranean Sea during the Eemian 

Guohui Gao, Christophe Colin, Giuseppe Siani, and Arnaud Dapoigny

The Mediterranean Sea's thermohaline circulation, sensitive to global climate changes, influences the Atlantic Meridional Overturning Circulation (AMOC) and the occurrence of sapropel layers in Mediterranean sediments. While sapropel formation is attributed to stagnant deep-water conditions and increased biological production during specific orbital cycles, debates persist concerning the complex interaction between high and low latitude climatic changes, circulation dynamics, and sapropel formation. We have investigated the hydrological dynamics of the eastern Mediterranean Sea during the Eemian using neodymium isotopes on foraminifera and other geochemical proxies. Cores from the southeastern Aegean Sea were compared with data from other Mediterranean regions to reconstruct water circulation patterns. Foraminiferal eNd records permit to identify two distinctive phases in the circulation patterns within the Sapropel S5. Initially, a large influx of freshwater causes water stratification, preventing the formation of deep-water layers and leading to localized signals observed in different cores. Cores located in the southern Mediterranean Sea exhibit prominent neodymium radiogenic signatures influenced by the Nile inputs. Conversely, cores positioned in the northern Mediterranean displays minimal Nile influence due to their more northerly location. During the deposition of the Sapropel S5, slight decreasing of sea levels and winter temperatures favored the formation of deep-water masses in the northern region, increasing basin-wide circulation. This enhanced circulation facilitates the transfer of radiogenic lithogenic Nd from the Nile to the northern part of the Eastern Mediterranean Sea. This change in circulation patterns highlights the influence of climate change on the deep hydrodynamics of the Eastern Mediterranean during the Eemian. Our data indicate for the first time that during the deposition of the sapropel S5, εNd not only exhibited vertical disparities and stratification but also shown noticeable large lateral variations in the Eastern Mediterranean Sea. Our new results highlight the importance of studying several cores in order to unravel the hydrodynamics on a basin scale and to elucidate the complex interactions within the Nd isotopic composition between freshwater input, circulation dynamics and fluvial sediment discharges in the eastern Mediterranean Sea during the last interglacial period.

How to cite: Gao, G., Colin, C., Siani, G., and Dapoigny, A.: Palaeohydrological reconstruction of the Eastern Mediterranean Sea during the Eemian, EGU General Assembly 2024, Vienna, Austria, 14–19 Apr 2024, EGU24-15799, https://doi.org/10.5194/egusphere-egu24-15799, 2024.

EGU24-17784 | Orals | OS2.3

Unveiled the Black Sea Spring dynamics using Underwater Glider Observations 

Nikolaos Zarokanellos, Manuel Rubio, Sorin Balan, Viorel Gh. Ungureanu, Albert Miralles, Sabin Rotaru, Patricia Rivera Rodríguez, Vangelis Papathanassiou, Andrew Tyler, Benjamin Casas, Adrian Stanica, and Joaquin Tintore

The Black Sea is a semi-enclosed basin with substantial river discharges. These inflows are crucial for the Black Sea's hydrography, nutrient supply, and ecological dynamics. The interplay of atmospheric forcing, river inflows, and mesoscale dynamics contribute to the formation of distinct water masses in the Black Sea. In the northern part, the extended shelf is prone to seasonal hypoxia and eutrophication, while the southern part is deep and stratified, marked by anoxic waters below 100m, rendering the Black Sea an immense meromictic sea. In the framework of the DOORS project (Developing Optimal and Open Research Support), during the DOORS field campaign, a first glider mission was performed in the Romanian Exclusive Economic Zone from May 6 to June 17, 2023, covering 288 nautical miles and conducting 863 physical and biogeochemical profiles at 1000m. The glider performed ten repeated transects perpendicular to the shelf parallel to the Danube Cone. Each transect has been completed approximately within four days, revealing the spatial and temporal characteristics of the region. At the shelf break, the isopycnals notably steepen and relax. In addition, intense surface heat gain of up to 3 oC induced strong stratification in two weeks, decreasing the density and MLD. The glider observations also captured small-scale eddies that contribute to the re-stratification process. These re-stratification events are essential to be monitored as they provide insights into the dynamic processes that affect the thermohaline characteristics of the water column and impact the nutrient availability in the euphotic layer. Understanding these events is essential for predicting and managing changes in the stratification, which plays a fundamental role in the upper layer circulation. By integrating glider-based observations with the broader regional Earth system dynamics context, our research supports a comprehensive understanding of the Black Sea's role in the global ocean climate system.

How to cite: Zarokanellos, N., Rubio, M., Balan, S., Ungureanu, V. Gh., Miralles, A., Rotaru, S., Rivera Rodríguez, P., Papathanassiou, V., Tyler, A., Casas, B., Stanica, A., and Tintore, J.: Unveiled the Black Sea Spring dynamics using Underwater Glider Observations, EGU General Assembly 2024, Vienna, Austria, 14–19 Apr 2024, EGU24-17784, https://doi.org/10.5194/egusphere-egu24-17784, 2024.

EGU24-18229 | Orals | OS2.3

Salinity-driven dynamics in the central Mediterranean in the era of ocean warming 

Milena Menna, Riccardo Martellucci, Miroslav Gačić, Annunziata Pirro, Giuseppe Civitarese, Carlotta Dentico, Vanessa Cardin, and Elena Mauri

Surface currents play a key role in determining the thermohaline structures in the upper ocean and thus influence its mean state and interannual variability. In turn, the thermohaline structure and its variability can also affect surface currents by changing density and pressure gradients in the ocean. At the present, the thermohaline effects on surface currents are poorly understood, particularly with regard to the role of salinity, which is considered less important than other factors influencing the circulation field (such as wind and sea level). However, in an era characterised by ocean warming, which affects ocean stratification and raises sea level, the contribution of ocean density to circulation in the upper layer becomes significant, and salinity could play a leading role in driving thermohaline variability and dense water formation processes.

Within the Mediterranean, the Central Mediterranean Sea (CMed), consisting of the Ionian and Adriatic Seas, is a good indicator of variability for several reasons. Firstly, it is a crossing point of all waters making part of the zonal Mediterranean overturning circulation, i.e. the Atlantic Water (AW) and the Levantine Intermediate Water (LIW). Secondly, the CMed can be considered a connecting point between the zonal and the meridional overturning cells, as it is also one of the sites of open-ocean deep convection and dense water formation of the Mediterranean Sea. It is also considered a gauge of the quasi-decadal variability of the whole Mediterranean Sea.

In recent decades, the water column of the CMed experienced significant positive trends in temperature and salinity. From 2012 onwards, there was a steep increase in salinity, with record breaking values observed in 2021. At the same time, the vorticity field in the upper layer of the Southern Adriatic Gyre (SAG) increased significantly, with the mean value doubling from the end of 2012 compared to the previous period. In this work, the main sources of this enhanced vorticity field in the SAG are analysed using in-situ (Argo-float and ocean glider), satellite and model products. Wind, horizontal advection and baroclinic terms interact to cause the increase of vorticity in 2012, but this new state is mainly supported by advection and baroclinicity in the following period (2012-2023). The baroclinic contribution associated with density gradients is comparable in magnitude to wind stress and shows the largest correlation with the temporal variability of relative vorticity in the period 2012-2023. A high-resolution analysis performed using glider data highlights the greater influence of the salinity field compared to the temperature field in modulating the shape of the isopycnals in the surface layer of the SAG. This condition leads to an enhanced positive contribution of the circulation field to the vorticity field, especially during periods of AW inflow along the edges of the SAG.

The results of this work emphasise the role of salinity in shaping the thermohaline variability of the CMed with direct effects on the surface currents field.

How to cite: Menna, M., Martellucci, R., Gačić, M., Pirro, A., Civitarese, G., Dentico, C., Cardin, V., and Mauri, E.: Salinity-driven dynamics in the central Mediterranean in the era of ocean warming, EGU General Assembly 2024, Vienna, Austria, 14–19 Apr 2024, EGU24-18229, https://doi.org/10.5194/egusphere-egu24-18229, 2024.

EGU24-19225 | ECS | Posters on site | OS2.3

Regional model estimation of seasonal and interannual variability of circulation and volume transport in the Sicily Channel. 

Lorenzo Pasculli, Francesco Marcello Falcieri, Katrin Schroeder, Jacopo Chiggiato, and Angelo Rubino

The Sicily Channel is a key area for the dynamics of the Mediterranean Sea, as it crucially contributes regulating the exchange of water masses, as well as of biogechemical characteristics between the Western and Eastern Mediterranean basins. This research focuses on investigating the dynamics of the Sicily Channel, particularly its seasonal variability, studied using a high-resolution regional model (Regional Ocean Modeling System – ROMS) and in situ data (moorings equipped with ADCPs) referring to the period from 2010 to 2019. During winter, the surface circulation is mainly influenced by the wind, which fosters the formation of mesoscale variability, whereas it is mainly regulated by the topography of the Strait in summer. The deep circulation is mainly regulated by the Strait's bathymetric constraints and by the remote variability of intermediate waters, which reflect the large-scale variability of the basin. These processes lead to an increase in transport during the winter months, peaking in January-February, while a general decrease occurs in the summer.

How to cite: Pasculli, L., Falcieri, F. M., Schroeder, K., Chiggiato, J., and Rubino, A.: Regional model estimation of seasonal and interannual variability of circulation and volume transport in the Sicily Channel., EGU General Assembly 2024, Vienna, Austria, 14–19 Apr 2024, EGU24-19225, https://doi.org/10.5194/egusphere-egu24-19225, 2024.

EGU24-22227 | ECS | Orals | OS2.3

Blue Transitions in the Black Sea: Multi-ActorForums to Advance a Sustainable Blue Economy 

Lydia Papadaki, Ebun Akinsete, and Phoebe Koundouri

The Blue Economy, encompassing all economic activities associated with littoral regions,
oceans, and waters, is crucial for the sustainable development of areas worldwide. Situated at
the nexus of Asia and Europe, the Black Sea possesses tremendous potential for the expansion
of a thriving Blue Economy. Conversely, this potential is accompanied by a distinct array of
obstacles that necessitate resolution in order to guarantee the enduring expansion of maritime
sectors in the area. An EU-funded project, DOORS Black Sea 1 , that develops optimal and
accessible Black Sea research support, aims to tackle these issues. DOORS facilitates
collaboration among industry, academia, and local communities in an effort to revitalize the
Black Sea and foster "blue economy" opportunities through the implementation of a system of
systems (SoS) that addresses the effects of climate change and human activities on the marine
ecosystem. Success, value, and impact of DOORS are contingent on stakeholder participation.
Collaboration with researchers advances science and technology, imbuing project work with
greater significance. Multi-Actor Forums (MAFs) facilitate the collaboration of diverse
national stakeholders from Georgia, Romania, Bulgaria, and Turkey in order to assist
scientists in the prioritization of Black Sea issues, with an emphasis on innovations to address
gaps and blue economy policies. This method also contributes to the co-design of the region&#39;s
System of Systems, which provides the necessary insights for researchers to address
environmental challenges and advance the blue economy. This research examines the
potential implications of the findings on the sustainable growth of the Blue Economy and
policy-related matters in the area.

https://www.doorsblacksea.eu

How to cite: Papadaki, L., Akinsete, E., and Koundouri, P.: Blue Transitions in the Black Sea: Multi-ActorForums to Advance a Sustainable Blue Economy, EGU General Assembly 2024, Vienna, Austria, 14–19 Apr 2024, EGU24-22227, https://doi.org/10.5194/egusphere-egu24-22227, 2024.

The Mediterranean Ship-based Hydrography Program (Med-SHIP) addresses a critical gap
in the monitoring of the Mediterranean Sea by establishing a sustainable initiative for
regularly repeated coast-to-coast zonal and meridional full-depth cruises. Anchored within
the Global Ocean Ship-based Hydrographic Investigations Program (GO-SHIP), Med-SHIP
focuses on collecting Essential Ocean Variables (EOVs) to comprehensively assess the
budget of heat, freshwater, carbon, oxygen, and various nutrients in the Mediterranean
basin.
The program, initiated in 2011 as recommended by the Mediterranean Science Commission
(CIESM), orchestrates cruises through strategic access to Exclusive Economic Zones
(EEZs) in the challenging diplomatic landscape of the region. The Med-SHIP program has
made substantial strides in executing its objectives, conducting zonal surveys from east to
west in 2001, 2011, and 2018, and meridional surveys from north to south in 2016 and 2022.
These surveys adhere to the Repeat Hydrography plan outlined in Schroeder et al. (2015)
and are complemented by contributions from individual countries and the Transnational
Access of the Eurofleets RI. The gathered data, spanning physical, chemical, and biological
EOVs, adhere to the highest international standards and are made publicly accessible in
open data repositories, aligning with the data policy of GO-SHIP. Med-SHIP not only
contributes to the scientific understanding of long-term changes in the Mediterranean but
also fosters regional collaboration and capacity building, bridging gaps between northern
shore countries and those in the Middle East and North Africa.
The Med-SHIP program continues to evolve with planned future surveys. The commitment to
sustained monitoring and collaboration underscores the program's importance in advancing
our understanding of the complex dynamics of the Mediterranean Sea and its implications
for global change.

How to cite: Tanhua, T. and Schroeder, K.: Med-SHIP: Advancing Sustainable and Systematic Hydrographic Surveys in the Mediterranean Sea, EGU General Assembly 2024, Vienna, Austria, 14–19 Apr 2024, EGU24-22318, https://doi.org/10.5194/egusphere-egu24-22318, 2024.

EGU24-2109 | ECS | Orals | OS2.4

Evaluating the numerical modeling of storm surges induced by hurricanes 

Alisée A. Chaigneau, Melisa Menéndez, Marta Ramírez-Pérez, and Alexandra Toimil

Coastal zones are increasingly threatened by extreme sea level (ESL) events. Storm surges (i.e. sea level variations due to meteorological drivers) are one of the most hazardous components of ESLs, especially in regions prone to tropical cyclones. This study aims to explore factors affecting the performance of numerical modeling in simulating storm surges induced by hurricanes. The focus is on the tropical Atlantic region, covering the Caribbean Sea and the Gulf of Mexico.

Several historical hurricanes causing severe coastal impacts are simulated. The skill of the simulations to reproduce the storm surge contribution to ESLs is evaluated against recorded values from tide-gauge stations. The modeled peak surge maxima and the hourly time series are analyzed during these extreme events.

The factors explored in this study encompass the numerical model, oceanic and atmospheric forcings, physical parameterizations, spatial resolution, and baroclinic/barotropic modes.

Two ocean models (ADCIRC and NEMO) are intercompared using a similar configuration: domain, spatial resolution (~9 km), bathymetry and barotropic mode. The sensitivity of the atmospheric forcings is assessed by comparing storm surges induced by ERA5 reanalysis data and parametric wind models usually applied for hurricanes (e.g. Dynamic Holland Model, Generalized Asymmetrical Holland Model). The effect on storm surge due to non-linear interactions with the astronomical tide and variations in mean sea level is also investigated, as well as the sensitivity to different wind stress schemes. In addition, the baroclinic contribution to ESLs is studied using a configuration with 75 vertical levels. Finally, the role of the spatial resolution on the modeled storm surges is evaluated with a high-resolution domain of about 500 m in coastal areas.

The analysis of the numerical experiments reveals some interesting insights. ADCIRC and NEMO can simulate storm surges due to tropical cyclones in a similar way compared to tide gauges. In general, the ERA5 forcing outperforms the various parametric wind models for storm surge modeling, in terms of maximum values, correlation, and duration of extreme events. Non-linear interactions of tides and mean sea level with storm surges have minimal contribution in the storm surges induced by hurricane events. However, the baroclinic response significantly improves the storm surge estimations in some coastal areas (e.g. along the southeastern Florida peninsula). 

All the authors would like to thank the Government of Cantabria through the FENIX Project GFLOOD.

How to cite: Chaigneau, A. A., Menéndez, M., Ramírez-Pérez, M., and Toimil, A.: Evaluating the numerical modeling of storm surges induced by hurricanes, EGU General Assembly 2024, Vienna, Austria, 14–19 Apr 2024, EGU24-2109, https://doi.org/10.5194/egusphere-egu24-2109, 2024.

EGU24-2825 | ECS | Posters on site | OS2.4 | Highlight

Global estimation of storm surge seasonality and the effect of interannual variability. 

Ayoola Apolola, Philip Ward, José Antolínez, and Sanne Muis

Extreme storm surges exhibit significant seasonal and interannual variability influenced by large-scale climate modes. The goal of our work is to investigate the seasonality of storm surge extremes and the influence of interannual climate variability at the global scale, which to date is not fully understood due to lack of observations with long-records.  

To achieve this goal, we use storm surge levels derived from the Global Tides and Surge Model (GTSM) forced with the extended ERA5 climate reanalysis data spanning 1950-2022. Our methodology consists of two main steps. First, we classify the dataset into four seasons (Winter-DJF, Spring-MAM, Summer-JJA, Autumn-SON) and compute the number of events per season. Next, we conduct extreme value analysis on selected thresholds and explore their connections with climate modes.

Preliminary findings indicate that extreme surge events are more frequent and pronounced at higher latitudes during SON, with notable peaks in DJF. This is particularly significant in the North Sea and funnel-shaped coastlines such as Rio de la Plata, Arafura Sea, and Hudson Bay. In contrast, regions like the South China Sea, the Bay of Bengal, the Yellow Sea, and southern Australia experience more frequent surge extremes from JJA to SON with variations in peak season.

Equatorial regions, especially around Africa, have negligible surge extremes except for occasional tropical cyclones from late DJF, with peaks in MAM in Mozambique and Madagascar. Similarly, there are occasional tropical cyclone events in parts of the Caribbean with peaks in JJA.

The study findings have broader implications for understanding the global distribution and spatio-temporal variation of extreme surge events, which could help to provide guidance on the impacts of climate change in the future. Overall, the preliminary findings underpin the need to further explore what the drivers of storm surge variability are. 

How to cite: Apolola, A., Ward, P., Antolínez, J., and Muis, S.: Global estimation of storm surge seasonality and the effect of interannual variability., EGU General Assembly 2024, Vienna, Austria, 14–19 Apr 2024, EGU24-2825, https://doi.org/10.5194/egusphere-egu24-2825, 2024.

EGU24-6238 | Orals | OS2.4

What can we learn on internal tides with the 1-day phase of SWOT ? 

Loren Carrere, Michel Tchilibou, Florent Lyard, Clément Ubelmann, and Gérald Dibarboure

The Surface Water and Ocean Topography (SWOT) altimetry mission launched in 2022 makes 2D observations of sea surface height (SSH) using SAR radar interferometric techniques.  Compared to previous altimetry missions, SWOT extends SSH observations to 15-30 km and offers opportunities to understand better ocean dynamic processes such as mesoscale, sub mesoscale and internal tides (IT).

     This study based on SWOT observations during the Calval (1-day orbit, from mid-March to mid-July) period gives insight into the capability of SWOT to observe IT.  We analyzed the SWOT tracks crossing the Brazilian coast around the Amazon shelf.  The results show that SWOT IT observations in this region are made up of mode 1 and mode 2 but also of strong higher mode (50-2 km).  The M2 coherent IT model deduced from SWOT presents the same spatial distribution as the M2 model from Zaron et al., 2019.  Over this period, the rate of incoherent internal tidal is over 0.5 for modes 1 and 2 and almost 0.9 for higher modes.

How to cite: Carrere, L., Tchilibou, M., Lyard, F., Ubelmann, C., and Dibarboure, G.: What can we learn on internal tides with the 1-day phase of SWOT ?, EGU General Assembly 2024, Vienna, Austria, 14–19 Apr 2024, EGU24-6238, https://doi.org/10.5194/egusphere-egu24-6238, 2024.

EGU24-7151 | Posters on site | OS2.4

Sensitivity analysis of coastal storm surge forecasting using NEMO-based CTSM model 

Nary La and Pil-Hun Chang

The present study introduces a high-resolution Coastal Tide/Storm surge model (CTSM). Recently, the NIMS (National Institute of Meteorological Sciences) developed the CTSM, based on the NEMO ocean model to enhance forecasting capabilities for sea conditions and storm surges. The CTSM is constructed with a two-dimensional barotropic sigma coordinates and has a 1 km horizontal resolution. It consists of Tide/Surge model and Tide model, and their residual is used as surge forecasts. The surge forecasts are then added to the harmonically predicted tides to give forecasts of total water level at the 30 tidal stations around Korea Peninsula. Based on the sensitivity studies, the constant values of 0.0275 and 1024 hPa are adopted as the Charnock coefficient, bottom friction and reference pressure of the model, respectively.
In addition, this study investigated the effect of temporal and spatial variations of Charnock coefficient on the surge forecasts during Typhoon HINNAMNO, which caused substantial damage to the Korean Peninsula in 2022. For this, the 2-D Charnock coefficients derived from an operational Coastal wave model are added to the CTSM. It was found that the Charnock values generally exceeded the model’s constant value of 0.0275 during typhoon period. This alteration in Charnock coefficient impacts on the surge forecasts especially near the coastal regions, showing about 10% increase in the sea level.

How to cite: La, N. and Chang, P.-H.: Sensitivity analysis of coastal storm surge forecasting using NEMO-based CTSM model, EGU General Assembly 2024, Vienna, Austria, 14–19 Apr 2024, EGU24-7151, https://doi.org/10.5194/egusphere-egu24-7151, 2024.

EGU24-7830 | Posters on site | OS2.4

Developing Best Practices in Tidal Analysis 

Andrew Matthews and the IAPSO Tidal Analysis Best Practice Study Group

The tide is generally the dominant component of a sea level record in many parts of the world and its analysis has therefore been a central part of oceanography for hundreds of years. Methods to predict the tide have changed over time, but have largely converged on the classical harmonic method, which is based on the principle that a series of tidal observations may be decomposed into a finite number of sinusoidal functions, known as tidal constituents, with angular speeds related to known astronomical frequencies.

Classical harmonic analysis is usually carried out using one of a number of software packages made available by scientists and oceanographic institutions. These are exceptionally useful, but within them they encode a series of assumptions and decisions that need to be made in order to carry out an analysis, including:

  • What is an appropriate set of constituents to use in a location, given the data available and the hydrodynamics of the area?
  • How does the analysis account for variations of the tidal constituents over time, for example over the nodal cycle?
  • How will our results be affected by non-tidal influences?

Furthermore, other approaches will be more successful in particular environments, for example in shallow waters when the tidal curve can be highly non-symmetric.

Non-experts in tidal science are often unaware of the options available, and the consequence of making the wrong decision. Furthermore, this knowledge is developed as rules-of-thumb within organisations based on many years of experience, so is not readily accessible. As a result, there is a need for some internationally agreed recommendations.

We recently held a tidal analysis workshop to discuss these matters, funded by the International Association for the Physical Sciences of the Oceans (IAPSO) as one of their Best Practice Study Groups. Here we present some illustrations of the issues mentioned above, along with some of our suggested approaches.

The best practice document is currently being drafted based on discussions held at the workshop, and when completed will be submitted to the International Oceanographic Commission’s best practice system (https://www.oceanbestpractices.org/).

How to cite: Matthews, A. and the IAPSO Tidal Analysis Best Practice Study Group: Developing Best Practices in Tidal Analysis, EGU General Assembly 2024, Vienna, Austria, 14–19 Apr 2024, EGU24-7830, https://doi.org/10.5194/egusphere-egu24-7830, 2024.

EGU24-9923 | Posters on site | OS2.4

Refinements to harmonic tidal predictions in estuaries and shallow water. 

Joanne Williams and Angela Hibbert
Harmonic analysis is used to predict tidal heights from observations or model data. The usual method is to fit tidal constituents, at frequencies informed by astronomical cycles. In most cases the higher harmonics of these frequencies are sufficient to provide a good model of the tide to within observational accuracy, and successfully predict tides for decades outside the observational period, even including double high and low water and seasonal variations.
In shallow bays or estuaries the propagation of the tidal wave slows, leading to very slow draining of the water and much faster rise. The tidal waveform is closer to a saw-tooth shape than sinusoidal. So least-square fit of harmonics leads to Gibbs ringing artefacts around the discontinuity in slope just before the tide rises. These are often several tens of cm in the macrotidal regime of the UK, and complicate the assessment of surge modelling.
Though the problem is not new, we are still seeking a consistent and universally applicable solution. In practice manual corrections are often applied at individual sites. Or with enough data, more harmonics can be fitted to minimise the false peaks, but at the risk of over-fitting. In this presentation we quantify the severity of this problem in UK estuarine sites, improvements using the response method, and the subsequent effect on total water level  for operational storm surge forecasting.

How to cite: Williams, J. and Hibbert, A.: Refinements to harmonic tidal predictions in estuaries and shallow water., EGU General Assembly 2024, Vienna, Austria, 14–19 Apr 2024, EGU24-9923, https://doi.org/10.5194/egusphere-egu24-9923, 2024.

EGU24-10223 | ECS | Orals | OS2.4

Storm surge events and associated dynamics in the North Atlantic 

Simon Barbot, Lucia Pineau-Guillou, and Jean-Marc Delouis

Storm surges events are investigated using the ECHAR method, which identify and quantify the different dynamical structures of a typical storm surge event. In the North Atlantic, analysis of 65 tide gauges revealed that storm surge events display 2 majors and 2 minors structures, each of them corresponding to specific ocean dynamics. The 2 major structures refer to a slow-time Gaussian structure, lasting around 24 days, associated with the impact of the atmospheric pressure and a fast-time Laplace structure, lasting around 1.4 days, mainly wind-driven. The absence of the Gaussian structure along the North America coasts is explained by storms of smaller spatial extension, compared to Europe. Concerning the minor structures, a negative  surge of around 6 cm just after the peak surge is observed over North America only. Such a sudden drop of the sea level is explained by the turning winds during the storm event, favored by the smaller spatial extension of storms. Finally, high frequency oscillations, with amplitude typically of 3 cm and up to 25 cm, are observed at some tide gauges. These oscillations refer to tide-surge interactions they are often maximum at a specific phase of the tide and/or enhanced because of resonant basins.

How to cite: Barbot, S., Pineau-Guillou, L., and Delouis, J.-M.: Storm surge events and associated dynamics in the North Atlantic, EGU General Assembly 2024, Vienna, Austria, 14–19 Apr 2024, EGU24-10223, https://doi.org/10.5194/egusphere-egu24-10223, 2024.

EGU24-10307 | Posters on site | OS2.4 | Highlight

Storm surge warning for the German North Sea coast 

Ludwig Schenk and Marlies Methe

Storm surges along the German North Sea coast are tidal surges that reach a peak of 1.5 metres or more above mean high water (MHW). Severe and very severe storm surges exceed 2.5 and 3.5 metres above mean high water respectively. Storm surges along the German North Sea coast are triggered by westerly winds from approx. 7 to 8 Beaufort. At the Hamburg, St. Pauli gauge, the long-term average is 5 to 6 storm surges per year; less frequent are severe (2 in 3 years) and very severe storm surges (every 5 years). The period of occurrence is essentially limited to the winter half-year.

The Federal Maritime and Hydrographic Agency (BSH) is responsible for warning of storm surges along the Baltic and North Sea coasts and the tidal river sections of the Ems, Weser, Jade and Elbe. Warnings of storm surges are distributed in very different ways. Warnings have been broadcast on the radio for many decades. In Hamburg, firecrackers are set off by the police. In recent years, dissemination via the BSH website and a customisable telephone distribution system has become established. Since the 2021/22 storm surge season, warnings have been fed into warning apps such as NINA via the Modular Warning System (MoWaS) of the Federal Office of Civil Protection and Disaster Assistance (BBK) and thus reach more directly affected citizens.

The possibilities offered by new media make it necessary to further develop warning strategies. For example, we are currently working closely with the BBK on the automated provision of warnings via the NINA warning app. This leads to faster and more precise distribution of storm surge forecasts.

The warnings and forecasts described take place against the background of the mean sea level rise and the associated rise in mean high water level. It is also the responsibility of the Federal Maritime and Hydrographic Agency to monitor this and to provide and analyse it at tide gauges such as Cuxhaven Steubenhöft, where measurements have been taken for around 180 years.

When creating the forecasts, we set up the Flood Early Warning System (FEWS), which pools and helps to process the data and creates and publishes reports. With the help of our developed Model Output Statistics System (BSH-MOS), precise and individualised forecasts up to one week into the future are possible for up to 40 gauges. Among other things, MOS evaluates water level measurements, wind forecasts from the German Weather Service (DWD) and area-based modelled water level forecasts from the BSH model system.

How to cite: Schenk, L. and Methe, M.: Storm surge warning for the German North Sea coast, EGU General Assembly 2024, Vienna, Austria, 14–19 Apr 2024, EGU24-10307, https://doi.org/10.5194/egusphere-egu24-10307, 2024.

EGU24-10476 | ECS | Orals | OS2.4

Combination of Extreme Water Levels and Waves in a Semi-enclosed Sea: Reconstruction of the Baltic Sea 2023 Storm Surge (Babet) 

Anna Adell, Aart Kroon, Björn Almström, and Caroline Hallin

The October 2023 storm surge, denoted Babet, caused severe flooding and unprecedented damage along the southwestern Baltic Sea coasts. The beginning of October 2023 was dominated by several westerly low-pressure systems over the Baltic Sea region. The abundance of westerly winds pushed water into the Baltic Sea basin through the Danish straits resulting in elevated water levels of +50 cm above normal in the basin. Around the 18th of October the wind direction shifted from west to north and subsequently to east while also increasing in intensity, with mean wind speeds of 25 m/s and gusts exceeding 30 m/s. This gave strong wind setup in the southwestern part of the Baltic Sea and the strong winds generated large waves as well as increasing the water levels further. Notably, the area experienced the most extreme storm conditions in over a century with the storm peak was reached during the night between the 20th to 21st October.

We present a study with results of the numerical model simulation using SWAN set up for the southwestern part to the Baltic Sea basin. The simulation combines the wave conditions derived from wind forcing and observed water levels from a network of observation gauges. These levels are compared to historical event statistics from an existing long-term hindcast model of wave climate conditions for the region. Finally, the results of storm surge levels are assessed in relation to observed flooding and erosion impact on natural coastal areas and impact to existing coastal protection.

How to cite: Adell, A., Kroon, A., Almström, B., and Hallin, C.: Combination of Extreme Water Levels and Waves in a Semi-enclosed Sea: Reconstruction of the Baltic Sea 2023 Storm Surge (Babet), EGU General Assembly 2024, Vienna, Austria, 14–19 Apr 2024, EGU24-10476, https://doi.org/10.5194/egusphere-egu24-10476, 2024.

EGU24-10636 | Posters on site | OS2.4

The impact of storm surges on ocean tides: insights from numerical simulations 

Sanne Muis, Michael Hart-Davis, Jelmer Veenstra, Martin Verlaan, Joanne Williams, and Denise Dettmering

The interaction between tides and storm surges can significantly affect shallow water regions with large tidal ranges. In modelling studies, including the atmospheric forcing, which drives the storm surge estimations within the model, can result in changes to the amplitudes and phases of the major tidal constituents. In certain regions, this can have severe impacts on the tidal predictions.

A standard product used to provide the atmospheric forcing is the ERA5 product developed at ECWMF. Previous studies have shown the presence of tidal constituents within the sea level pressure data provided by ERA5 used in various applications. For example, the commonly used Dynamic Atmospheric Correction derived from these data, which is used to correct satellite altimetry measurements for the atmospheric influence on the radar returns, has been shown to significantly impact the estimation of ocean tides from satellite altimetry. 

The Global Tide and Surge Model (GTSM), developed at Deltares, allows for the global estimation of ocean tides with and without atmospheric forcings. This presents the possibility of evaluating the influence of storm surges on the estimation of individual tidal constituents and the resultant prediction of tidal heights. In this poster, three model simulations are produced, which are as follows: an ocean tide-only version, a storm surge-only simulation and a tide plus storm surge version. The eight major tidal constituents are evaluated globally to assess the changes in their respective amplitudes and phases. Finally, several case studies are presented in regions with high influence on the individual constituents by evaluating the results of the tidal predictions with respect to in-situ measurements. 

How to cite: Muis, S., Hart-Davis, M., Veenstra, J., Verlaan, M., Williams, J., and Dettmering, D.: The impact of storm surges on ocean tides: insights from numerical simulations, EGU General Assembly 2024, Vienna, Austria, 14–19 Apr 2024, EGU24-10636, https://doi.org/10.5194/egusphere-egu24-10636, 2024.

EGU24-10850 | ECS | Posters on site | OS2.4

Estimation of time-varying tidal amplitudes using a state space model 

Koen Haakman, Cornelis Slobbe, and Martin Verlaan

Recently, global trends in tidal amplitudes have been estimated from satellite radar altimetry data by including several constituents with linearly changing amplitudes into the harmonic analysis least squares problem. However, changes in tidal amplitudes do not have to be linear. The assumption of linearity can potentially obscure the true time-varying evolution of tidal amplitudes. Revealing deviations from linearity could be useful for attribution of physical mechanisms responsible for changes in tidal amplitudes and may have implications for future projections.

To address this limitation, an algorithm that estimates time-varying amplitudes without making any assumptions about the temporal shape is desired. To that end, we propose to use a state space time series model, for which time-varying parameters are estimated using a Kalman filter. Unlike the conventional least squares problem, the state space approach allows the value of a parameter to vary at each time step, providing a more flexible representation of the dynamic nature of tidal amplitude changes.

We apply the model to global TOPEX/Poseidon and Jason altimetry data from 1993-2023 at satellite crossover locations, aiming to identify if and where tidal amplitude changes are deviating from linearity. Provisional results show that, in many locations, the M2 amplitude trend is close to linear during the considered timescale. Nevertheless, there are some regions where the estimated M2 amplitude trends are clearly deviating from linearity. However, these results should be interpreted with caution since the 95% confidence intervals around the estimated amplitudes are often of similar magnitude as the temporal variability of the amplitude. One potential strategy to mitigate this issue involves increasing the number of samples per time series by binning altimetry observations, as opposed to restricting the analysis solely to crossover locations. To fully understand whether the generated time-varying amplitudes are reliable, the state space model will be thoroughly tested with synthetic data.

How to cite: Haakman, K., Slobbe, C., and Verlaan, M.: Estimation of time-varying tidal amplitudes using a state space model, EGU General Assembly 2024, Vienna, Austria, 14–19 Apr 2024, EGU24-10850, https://doi.org/10.5194/egusphere-egu24-10850, 2024.

EGU24-10958 | Orals | OS2.4 | Highlight

The connection between coastal sea level and local ocean dynamics, and its relation to high-tide flooding along southern New England (U.S.)  

Carolina M.L. Camargo, Christopher G. Piecuch, and Britt Raubenheimer

According to NOAA’s Annual High Tide Flooding Outlook [1], the number of high-tide flooding days along the US East coast has increased  rapidly in recent years. High-tide flooding, also known as nuisance flooding, identifies floods that can occur in the absence of storms, for example, simply due to above-normal water levels.. Due to sea-level rise, it is predicted that, by 2050, coastal communities across the U.S. will experience high-tide flooding on average 45 to 85 days per year. Predicting the frequency of future coastal flooding is vital for the development and maintenance of coastal cities. Here we discuss the role of  local ocean dynamics to coastal flooding.

Along the Northeast US coast, an important driver of coastal sea-level variability is ocean dynamics, which includes large-scale circulation, such as the Gulf Stream, but also to smaller local ocean currents. An important circulation feature in this region is the Shelf break jet (SBJ). The SBJ flows equatorward from the Labrador Sea towards the Gulf Stream at Cape Hatteras following the shelf break along the Northeast US coast. We use velocity data from the Ocean Observatory Initiative (OOI) Coastal Pioneer Array and tide-gauge data during 2014-2022 to establish the connection between coastal sea level and local ocean circulation over the shelf and the slope. Located at the New England shelf break,  about 75 nautical miles south of Martha’s Vineyard, the Array is composed of seven site moorings, spread from the shelf to offshore of the shelf break. Each mooring contains, among other instruments, an upward-looking ADCP, which measures three-dimensional velocities throughout the water column. A spectral coherence and admittance analysis reveal that, after removing the effects of tides and the inverted barometer, about 30% of the coastal sea-level variance in the 1—15-day band in this region is related to the SBJ transport. This relationship has a clear spatial pattern: we find significant coherence between SBJ transport and coastal sea level from the South of New England to as far south as the Delaware coast, depending on frequency.

Since this frequency band coincides with the frequency variability of storm surges, we pose the question: “Are any of the flood events registered in this region related to SBJ variability”? To answer this question, we focus on 6 tide gauges stations along southern New England, which feature the highest coherence with SBJ transport in the 1—15-day band. When the jet-related variability is regressed off the tide-gauge sea level data over these frequencies, the number of minor flood days reduces. Thus, a fraction of coastal floods in these locations might be related to SBJ variability. This simple exercise highlights the importance of considering local ocean dynamics when projecting future coastal flooding.


Reference:

[1] https://tidesandcurrents.noaa.gov/high-tide-flooding/annual-outlook.html

How to cite: M.L. Camargo, C., G. Piecuch, C., and Raubenheimer, B.: The connection between coastal sea level and local ocean dynamics, and its relation to high-tide flooding along southern New England (U.S.) , EGU General Assembly 2024, Vienna, Austria, 14–19 Apr 2024, EGU24-10958, https://doi.org/10.5194/egusphere-egu24-10958, 2024.

EGU24-12341 | Orals | OS2.4

The effect of the 18.6-year lunar nodal cycle on steric sea level changes 

Dewi Le Bars, Sterre Bult, Ivan Haigh, and Theo Gerkema

We show that steric sea-level varies with a period of 18.6 years along the western European coast. We hypothesize that this variation originates from the modulation of semidiurnal tides by the lunar nodal cycle and associated changes in ocean mixing. Accounting for the steric sea level changes in the upper 400 m of the ocean solves the discrepancy between the nodal cycle in mean sea level observed by tide gauges and the theoretical equilibrium nodal tide. Namely, by combining the equilibrium tide with the nodal modulation of steric sea level, we close the gap with the observations. This result supports earlier findings that the observed phase and amplitude of the 18.6-year cycle do not always correspond to the equilibrium nodal tide. This finding allows to better filter natural variability when estimating the current rate of sea level rise along the European coast. Practical applications include the detection of an acceleration of sea level rise and the comparison between tide gauge and satellite observations with sea level projections.

How to cite: Le Bars, D., Bult, S., Haigh, I., and Gerkema, T.: The effect of the 18.6-year lunar nodal cycle on steric sea level changes, EGU General Assembly 2024, Vienna, Austria, 14–19 Apr 2024, EGU24-12341, https://doi.org/10.5194/egusphere-egu24-12341, 2024.

EGU24-13233 | Posters on site | OS2.4 | Highlight

Twin storms and the performance of storm surge barriers 

Alexander Bakker and Dion Rovers

Early 2022, four severe storms (Corrie, Dudley, Eunice and Franklin) raged over the Netherlands, of which the latter three hit the Dutch coast in only four days. The question is how well the Dutch flood protection system can deal with such a series of storms. Will there be enough time to recover from the previous storm?

The Maeslant barrier is a storm surge barrier near Rotterdam that exists of two enormous floating sector doors. In rest, they are safely located in the dry docks along the shore. Yet, in case of the most severe storms the doors are floated to the middle of the river and submerged to retain storm surges from the sea. After the storm they are floated up again and moved back to the docks. During its operation the Maeslant barrier is likely to be more vulnerable for small damages, that may lead to the temporal unavailability of the surge retaining function.

This study investigates 1) the probability that the barrier needs to close shortly after a previous closure and 2) the flood risk as a result of failure of the second closure. Herewith, we distinguish two different phenomena. The two-top storm is a single storm during which the barrier needs to close twice and open in between as a result of the astronomical tide. The twin storm (or even triplet or multiple storm) is a cluster of severe storms that succeed each other shortly.

The probabilities of both phenomena are estimated from a data-analysis of a long record of sea level observations at Hoek van Holland, close to Rotterdam. The associated flood risk is estimated from a simple conceptual model of the failure probability of the Maeslant barrier.

How to cite: Bakker, A. and Rovers, D.: Twin storms and the performance of storm surge barriers, EGU General Assembly 2024, Vienna, Austria, 14–19 Apr 2024, EGU24-13233, https://doi.org/10.5194/egusphere-egu24-13233, 2024.

EGU24-14262 | ECS | Orals | OS2.4 | Highlight

Counting the contributions of tides and surges to changing coastal flooding 

Karen Palmer, Christopher Watson, Hannah Power, and John Hunter

Globally, the frequency of high tide exceedances is increasing with sea level rise. However, the rate of mean sea level (MSL) alone is not enough for estimating changes in coastal flooding. Understanding the drivers of changing exceedance frequency must also factor in additional contributions from tides and surges, accounting for the importance of local variability and interactions. Our novel Joint Probability of Maxima Method represents these complex processes nonparametrically, efficiently enabling the estimation of exceedance thresholds at user defined average recurrence intervals (ARIs). We compared exceedance levels between two recent 19-year epochs for 166 widely distributed coastal tide gauge sites, at 1, 5, and 10 year ARIs. We then quantified the specific contributions of MSL, tide, and skew surge components to the net changes in exceedance levels in metric terms, relating them directly to the height of coastal protections. Our approach demonstrates that high water exceedance levels are, on average, increasing more than MSL alone, and that changing exceedance frequency can depend significantly on local characteristics of sea level variability. On average, exceedance frequency doubled over the epochs assessed.

How to cite: Palmer, K., Watson, C., Power, H., and Hunter, J.: Counting the contributions of tides and surges to changing coastal flooding, EGU General Assembly 2024, Vienna, Austria, 14–19 Apr 2024, EGU24-14262, https://doi.org/10.5194/egusphere-egu24-14262, 2024.

Severe storm tides are one of the main hazards for the German coast. Understanding the development of storm tides and the resulting water levels supports decision-making. We have used a hydrodynamic model to simulate several of the highest observed storm tide events for the locations Norderney, Cuxhaven and Husum (German Bight). The hydrodynamic model is forced by atmospheric (century) reanalysis data (20CR-ensembles, ERA5 and UERRA-HARMONIE) and FES-tides.  In general, the simulations of the severe storms with tracks over Scandinavia and a strong wind gradient over the North Sea show better peak water level results and lower variability compared with more southerly storms with storm tracks over the North Sea. However, the highest observed water level in the German Bight could not be simulated with any of the considered atmospheric forcings. The individual weather situations with the corresponding storm tracks are analysed in order to better understand their different effects on the peak storm tides, their variability and their predictability.

How to cite: Meyer, E. M. I. and Gaslikova, L.: How good are simulations of historical severe storm tides forced by atmospheric reanalysis products in the German Bight?, EGU General Assembly 2024, Vienna, Austria, 14–19 Apr 2024, EGU24-14664, https://doi.org/10.5194/egusphere-egu24-14664, 2024.

EGU24-15703 | ECS | Posters on site | OS2.4

Unravelling Spatial Variability of Sea Level Extremes in the Netherlands: Insights from Observational Data 

Mia Pupić Vurilj, Jose A. Alvarez Antolinez, Oswaldo Morales Napoles, Sanne Muis, and Fernando J. Mendez

Coastal regions in the Netherlands face persistent challenges from sea level extremes, prompting a comprehensive exploration of their spatial variability. Our study explores the nuances of extreme sea level events across the country, using the observed sea level data from the GESLA-3 (Global Extreme Sea Level Analysis) dataset. We analyse 16 stations with observational periods spanning from 38 to 68 years.

The total observed sea level is detrended and split into two components: (i) the tidal component, derived using harmonic analysis, and (ii) the non-tidal residual, calculated by subtracting the obtained tidal signal from the observed sea-level records. Extremes of both total sea level and non-tidal residual are then identified using the Peak over Threshold method, opting for a 70th percentile threshold. This choice allows us to examine less severe scenarios, suitable for risk assessments or planning purposes.

Our preliminary analysis of extreme event characteristics, such as the duration and intensity of an event, indicates significant spatial differences across stations. Correlation coefficients between stations, particularly for total extreme sea level characteristics and extreme non-tidal residual characteristics (duration and intensity), show a noticeable pattern that consistently reveals higher values between stations with similar latitudes across all variables. Moreover, the distributions of total extreme sea level characteristics exhibit noteworthy differences as well - for example, in southern regions, the distributions of intensity are more broadly dispersed and skewed to the right, signifying higher events than those in the northern counterparts. However, this distinction is less pronounced when focusing solely on the non-tidal residual, possibly since the total sea level is influenced by factors such as the river inflow, prevalent in the south, and tidal propagation behaviour in the North Sea.

As we progress with our analysis, we plan to apply a supervised learning method for classifying extreme events based on storm characteristics, and conduct a clustering analysis to reveal hidden spatial patterns of extreme events, for both total sea level and non-tidal residual. Furthermore, we aim to explore the interactions between surges and tides across different classes of extreme events, unravelling the underlying driving mechanisms of enhanced compound events.

In summary, our ongoing study of sea level extremes in the Netherlands, from spatial dynamics to event characteristics, will provide a solid foundation for understanding the driving mechanisms behind the extremes, gaining insights about their natural variability, and evaluating the impacts of changing climatic conditions.

How to cite: Pupić Vurilj, M., Alvarez Antolinez, J. A., Morales Napoles, O., Muis, S., and Mendez, F. J.: Unravelling Spatial Variability of Sea Level Extremes in the Netherlands: Insights from Observational Data, EGU General Assembly 2024, Vienna, Austria, 14–19 Apr 2024, EGU24-15703, https://doi.org/10.5194/egusphere-egu24-15703, 2024.

EGU24-15861 | ECS | Orals | OS2.4

Optimized Prediction of Shallow-Water Tides with the Global Ocean Tide Model TiME 

Roman Sulzbach, Henryk Dobslaw, and Maik Thomas

Usually, the most accurate ocean tide atlases are produced by incorporating satellite altimetry observations into the modeling process. This strategy works best for large amplitude, i.e., major, ocean tides, which prominently appear in satellite observations. However, in the case of sparsely available observations or reduced observation precision (e.g., small-amplitude tides), purely numerical ocean tide models can provide valuable constraints for improving tidal predictions. For example, third-degree ocean tides, and several radiational tides were successfully predicted and identified in geodetic records by employing barotropic ocean models (e.g., Sulzbach et al. 2022; doi: 10.1007/s00190-022-01609-w), while they are hard to identify in altimetric records.

A further complex facet of ocean tidal dynamics is shallow-water tides (SWTs), which are not directly generated by celestial bodies, but through the non-linear interaction of ocean tides in shallow waters. While appearing relatively small in amplitude in the deep ocean, SWTs exhibit more prominent signals in shallow waters and are also relevant for the processing of geodetic satellite observations, e.g., altimetry and gravimetry. The responsible non-linear tide-generating processes depend on several spatially variable characteristics of the ocean, e.g., seafloor roughness and ocean depth, and the accurate incorporation of major tides into the ocean model. Therefore, their excitation mechanism is only approximately known in contrast to gravitationally-excited tides. This uncertainty poses an additional challenge to the numerical modeling process.

Here, we reapproach the simulation of shallow-water tides with the ocean tide model TiME by readressing the parameterization of potentially non-linear ocean-bottom friction. The barotropic ocean tide model has been refined to incorporate updated energy dissipation mechanisms by topographic wave drag and sea ice friction, possesses a truly global grid based on the rotation of the numerical poles, and operates at a relatively high resolution of 1/12°. Most importantly, the effect of Self-Attraction and Loading (SAL) is modeled based on fast decomposition into Spherical Harmonic Functions at each time step. Thus, the model does not rely on prior estimates of the SAL effect, which are only weakly constrained for the SWTs, but estimates SAL self-consistently in real-time.

The ocean tide model is optimized to simultaneously depict an accurate prediction of the major lunar tide M2, as well as its overtides in shallow waters (e.g., M4). Validation relies on geodetic data sets of complementary characteristics and focuses on a densely observed focus region: the European Shelf Sea. Based on multiple validation metrics, probing the sea surface height anomaly and the gravitational field of the SWTs, the effect of the improved bottom friction parameterization and the self-consistent effect of SAL are investigated. The simulations indicate that incorporating the self-consistent SAL effect for nonlinear tides significantly affects tidal propagation in the open ocean, similar to diurnal and semi-diurnal tides. Further, tuning of linear and nonlinear bottom friction effectively allows the reduction of the combined RMS for linear and nonlinear tides.

How to cite: Sulzbach, R., Dobslaw, H., and Thomas, M.: Optimized Prediction of Shallow-Water Tides with the Global Ocean Tide Model TiME, EGU General Assembly 2024, Vienna, Austria, 14–19 Apr 2024, EGU24-15861, https://doi.org/10.5194/egusphere-egu24-15861, 2024.

EGU24-17298 | ECS | Posters on site | OS2.4

Unlocking Insights in Historic Tidal Records with Analysis Methods Tailored to High-Low Tidal Data 

Joris Beemster, Paul Torfs, and Ton Hoitink

Water-level measurements, sometimes spanning centuries, offer a valuable historical perspective. Although contemporary tidal data is collected digitally at high frequencies, historical records often merely consist of basic high and low water levels. Recognizing the value of these low-resolution tidal records, recent 'data rescue efforts' focus on digitizing and preserving them. Current tidal analysis methods, optimized for high-frequency data, fall short in exploiting the potential of high- and low-water observations.

Here, we introduce a specialized tidal analysis methodology tailored for high- and low-water observations. Leveraging equilibrium tide information and the unique characteristics of these observations, such as a derivative constraint, we enhance the analysis of historical records. Additionally, we explore interpolation methods for high- and low-water observations, aiming to address the possibilities and limitations associated with these data.

Our approach has the potential to offer valuable insights into century-scale water level changes, and to unravel the contributions by tides, river discharge, mean sea level, storm surges and interactions among those governing factors to water level variation. A key ambition we have is to reveal the hydrodynamic consequences of human interventions, which are difficult to distinguish from each other. We hope the new technique will encourage to continue digitization of historic high-low-tidal observations, and allow to demonstrate the role of intertidal areas in modulating water level extremes.

How to cite: Beemster, J., Torfs, P., and Hoitink, T.: Unlocking Insights in Historic Tidal Records with Analysis Methods Tailored to High-Low Tidal Data, EGU General Assembly 2024, Vienna, Austria, 14–19 Apr 2024, EGU24-17298, https://doi.org/10.5194/egusphere-egu24-17298, 2024.

EGU24-17544 | ECS | Posters on site | OS2.4

Improving the temporal resolution of GNSS-IR water level monitoring using single-cycle periodogram 

Peng Feng, Rüdiger Haas, and Gunnar Elgered

GNSS-IR represents an innovative technique for monitoring water levels. By analyzing the frequency of interference patterns between the direct GNSS signals and the signals reflected off the water surface, GNSS-IR offers a robust alternative to traditional tide gauges. GNSS-IR provides various advantages, including cost savings, convenient implementation, and accurate separation of vertical land motion. Recently, commercial companies started to adopt GNSS-IR for operational water level monitoring campaigns. The Lomb-Scargle Periodogram (LSP) is widely used to determine the frequency of interference patterns in the GNSS signal-to-noise ratio (SNR) data. Subsequently, the frequency/period can be converted into reflector height and water level. The LSP retrieves only one dominant frequency for each satellite and each channel, ascending or descending, over a time period longer than 20 min. Consequently, the temporal resolution of GNSS-IR water level measurements with LSP is lower compared to traditional tide gauges. High-temporal-resolution water level data would be valuable for applications like coastal hydrodynamics and hurricane studies. To address the temporal resolution, we developed a Single-Cycle Periodogram (SCP) analysis. The SCP analysis uses the LSP retrieval as a priori value and determines the period for each SNR cycle by tracking the maximum/minimum point corresponding to constructive/destructive interferences. Due to the reduced data span, the SCP suffers from noise. To improve the data quality of the interference patterns, we installed a GNSS antenna 90 degree tilted, facing the horizon, taking advantage of the antenna gain characterises. Such an experimental installation exists at the Onsala Space Observatory, with a relative small reflector height of approximately 3 m. Usually a small reflector height GNSS-IR installation results in low temporal resolution due to few interference fringes. However, using the proposed SCP analysis, preliminary results from 26 days of data indicate a significant increase in the number of water level retrievals. The LSP method yields approximately 200 unevenly distributed results per day, with occasional gaps exceeding 30 min. The SCP method gives approximately 10 times more retrivals. Furthermore, using the nearby traditional tide gauge (in the Swedish observation network of sea level) as a reference, the SCP retrievals, averaged over 6 min, provide a higher accuracy compared to the unevenly distributed LSP results.

How to cite: Feng, P., Haas, R., and Elgered, G.: Improving the temporal resolution of GNSS-IR water level monitoring using single-cycle periodogram, EGU General Assembly 2024, Vienna, Austria, 14–19 Apr 2024, EGU24-17544, https://doi.org/10.5194/egusphere-egu24-17544, 2024.

EGU24-19209 | ECS | Posters on site | OS2.4

A Stochastic Deep Learning Approach for Projecting Storm Surges in the Context of Climate Change 

Simon Treu, Matthias Mengel, and Katja Frieler

Projections of sea level rise are vital for assessing the impacts of climate change, especially in coastal regions. Present sea level rise projections are primarily focused on monthly water levels, but tend to underrepresent the critical role of storm surges. There are some studies that also provide projections of storm surges along global coastlines based on numerical models using meteorological forcing data from Global Climate Models (GCMs). However, those applications are limited by coarse meteorological inputs as well as the computational demands placed by running numerical models for an ensemble of different GCMs and climate change scenarios.

We propose a stochastic deep learning model trained on model output from numerical surge models. It is designed to capture the spatial and temporal dependencies that are characteristic of storm surge time series. Our approach generates potential storm surge scenarios that are consistent with GCM outputs but are not directly determined by those meteorological inputs. A second advantage is that the trained machine learning model has lower computational demands than traditional numerical models which makes it possible to explore different GCMs and climate change scenarios.

How to cite: Treu, S., Mengel, M., and Frieler, K.: A Stochastic Deep Learning Approach for Projecting Storm Surges in the Context of Climate Change, EGU General Assembly 2024, Vienna, Austria, 14–19 Apr 2024, EGU24-19209, https://doi.org/10.5194/egusphere-egu24-19209, 2024.

EGU24-19316 | Posters on site | OS2.4

Changes in ocean tides by the end of the 21st century in response to stronger stratification 

Leigh MacPherson, Lana Opel, Michael Schindelegger, Arne Arns, and Athanasios Vafeidis

Recent model results in combination with observations have provided a first coherent picture of secular changes in ocean tides since 1993. Strengthening of ocean stratification has been identified as an important driver of the observed secular trends, where the barotropic tide is primarily affected through enhanced tidal conversion at topography. These changes are responsible for open-ocean trends in the order of 0.1 mm yr-1 for the barotropic M2 tide, increasing to magnitudes comparable to the tidal response to sea level change (0.2—0.4 mm yr-1) in several coastal regions. This has ramifications for global projections of future extreme sea levels, which either neglect changes in tides or consider them solely as a function of sea level rise. In this study, we employ a global high-resolution (1/12°) internal-tide permitting numerical ocean model to quantify future changes in ocean tides until 2100 as a result of upper-ocean warming and the concomitant increase in stratification. We simulate the evolution of leading tidal constituents in 5-year average time slices and use EC-Earth3P HighResMIP density data to constrain the model’s background stratification. As the Representative Concentration Pathway (RCP) in the EC-Earth3P simulation is a high greenhouse gas emission scenario (RCP8.5), we also consider data from a CM2.6 coupled global climate model, which is more closely aligned with a medium stabilisation scenario (RCP6.0).

How to cite: MacPherson, L., Opel, L., Schindelegger, M., Arns, A., and Vafeidis, A.: Changes in ocean tides by the end of the 21st century in response to stronger stratification, EGU General Assembly 2024, Vienna, Austria, 14–19 Apr 2024, EGU24-19316, https://doi.org/10.5194/egusphere-egu24-19316, 2024.

EGU24-19451 | ECS | Posters on site | OS2.4 | Highlight

Analysing extreme sea levels on the Finnish coast using Block Maxima and Peak Over Threshold approaches 

Ulpu Leijala, Milla Johansson, and Havu Pellikka

Melting of the land-based ice and warming of the oceans around the world has resulted in acceleration of the pace of global mean sea level rise. Higher mean sea level causes more frequent extreme sea levels. This forces coastal cities urgently to do major preparedness and adaptation measures.

In Finland, preparedness for coastal flooding hazards is relevant even though protection given by the post-glacial land uplift is helpful. This is especially true on the Finnish southern coast, where mean sea level rise is foreseen and increase of probability of high sea levels within the 21st century is expected (Pellikka et al., 2023, 2018). In the Finnish coastal area, the extreme sea level estimates are used e.g. to support infrastructure planning, flood maps and safe operation of nuclear power plants.

On a short timescale, sea level variations are driven on the Finnish coast by storm surges, wind induced oscillations within the bays, and tides (playing a minor role). On the long-term side, global mean sea level rise, land uplift and the water inflow and outflow in the Danish straits (which change the total amount of Baltic Sea water) are the main factors controlling the sea level behaviour.

In this presentation, a study aiming at improving extreme sea level estimates in Finland will be illustrated. Tentative results on how different sampling techniques and extrapolation approaches affect the probability estimates of coastal floods will be presented.

Altogether 90 years of observations from the 13 Finnish tide gauges are analysed. We apply two different well-known sampling methods (Block Maxima and Peak Over Threshold) to the high tail of the sea level distribution and investigate which extrapolation function belonging to the family of Generalized Extreme Value (GEV) distribution matches best to the Finnish tide gauge observations. The results will be grouped into four coastal regions in Finland: the Gulf of Finland and Archipelago Sea in the south, and the Bothnian Sea and Bay of Bothnia in the west.


Pellikka, H., Johansson, M. M., Nordman, M., and Ruosteenoja, K., 2023: Probabilistic projections and past trends of sea level rise in Finland, Nat. Hazards Earth Syst. Sci., 23, 1613–1630, https://doi.org/10.5194/nhess-23-1613-2023

Pellikka, H., Leijala, U., Johansson, M. M., Leinonen, K., Kahma, K. K., 2018: Future probabilities of coastal floods in Finland, Continental Shelf Research, 157, 32-42, https://doi.org/10.1016/j.csr.2018.02.006

How to cite: Leijala, U., Johansson, M., and Pellikka, H.: Analysing extreme sea levels on the Finnish coast using Block Maxima and Peak Over Threshold approaches, EGU General Assembly 2024, Vienna, Austria, 14–19 Apr 2024, EGU24-19451, https://doi.org/10.5194/egusphere-egu24-19451, 2024.

EGU24-19556 | Orals | OS2.4

Exploiting the wealth of satellite radar altimeter data to calibrate regional, high-resolution hydrodynamic models 

Cornelis Slobbe, Henrique Guarneri, and Martin Verlaan

To exploit the wealth of satellite radar altimeter data in calibrating the regional, high-resolution 2D tide-surge Dutch Continental Shelf Model version 7 (DCSM) model covering the northeast Atlantic including the North Sea and Wadden Sea requires an approach that can be applied to the separate water level variability contributors. In this study, we aim to improve DCSM's ability in representing the low-frequency water level variability by assimilating data acquired by the TOPEX/Poseidon and Jason (TPJ) satellites. This variability, caused by physical processes not included in the model’s governing equations or forcing terms, is a major source of errors in the operational forecasting of water levels. To validate the impact of the data assimilation, we used i) S3-derived water levels acquired over the southern North Sea and Wadden Sea that were produced in the context of ESA’s HYDROCOASTAL project, and ii) tide gauge records required at 149 locations throughout the DCSM model domain. The results show that the impact of the assimilation is substantial. At the tide gauge locations, the median SD of the residual monthly-mean water levels reduced from 6.2 cm to 2.8. The impact cannot be assessed from the HYDROCOASTAL data. The most likely explanation is the fact that these data are still impacted by the tidal errors in the DCSM-derived tide-surge water levels.

How to cite: Slobbe, C., Guarneri, H., and Verlaan, M.: Exploiting the wealth of satellite radar altimeter data to calibrate regional, high-resolution hydrodynamic models, EGU General Assembly 2024, Vienna, Austria, 14–19 Apr 2024, EGU24-19556, https://doi.org/10.5194/egusphere-egu24-19556, 2024.

EGU24-19736 | ECS | Posters on site | OS2.4

An exploration of the potential of using storm characteristics from long synthetic time series of wind and water levels for operational forecasting 

Paulina Kindermann, Oswaldo Morales Napoles, and José Antonlínez

The Dutch coast is characterized by dikes, dunes, and structural barriers with low-lying, densely populated hinterland, which makes the area very vulnerable to coastal flooding. Therefore, the reliability of flood forecasting models is of great importance: accurate short-term forecasts (up to 2 weeks lead time) are necessary for operational decision-making processes (e.g. closing the storm surge barriers on time), while mid-term forecasting (seasonal) is useful for the planning of maintenance, for example. However, the uncertainty of forecasts naturally increases with longer lead times, which means that the extent of a storm is often only known on short term, leaving little time to take safety measures (Pardowitz et al., 2016). With a changing climate, the uncertainty in forecasting might even increase. Improving our understanding of the characteristics of storm evolutions in present and future climate plays a fundamental role to reduce uncertainty in forecasting models.

In recent years, research into storms and resulting extreme sea levels along the Dutch coast has been boosted by the availability of long time series of meteorological data in the current climate, from the seasonal forecasting system (SEAS5) by the European Centre for Medium-Range Weather Forecasts (ECMWF) (ECMWF, 2021). For these synthetic time series of wind data, the Royal Dutch Meteorological Institute (KNMI) calculated corresponding sea levels (van den Brink, 2020). As a result, a period of 8,000 years of simulated meteorological and hydraulic data of the current climate have become available for many Dutch coastal locations. Compared to the limited availability of measurements from coastal stations (up to 50 or 100 years for a limited number of stations) these long time series are a great source of synthetic storm information.

The aim of this study is to explore the potential of using storm characteristics derived from these long synthetic time series of wind and corresponding water level for operational forecasting at the Dutch coast. First, physical and statistical properties of storm characteristics and their mutual correlations are analyzed. Storm characteristics consist of the temporal and spatial evolution of wind speed, wind direction and surge height, the duration of wind speed and storm surge above a certain threshold and the phase difference between the maximum storm surge and high tide. Mutual correlations between these characteristics are derived using copulas. Previous analyses result in strong correlations between wind speed and surge height, although it varies significantly depending on the location and combination of wind direction, duration and phase (Caspers & Kindermann, 2023). Still, this strong correlation suggests potential to be used for the forecasting of resulting storm surges from wind speed. Consequently, the correlations and other storm evolution properties found from these synthetic time series are compared to the observations of storms in recent years to investigate whether the findings from synthetic data agree with the characteristics of observed storm evolutions, in order to explore their potential for the short and mid-term forecasting of storm impact at the Dutch coast.

How to cite: Kindermann, P., Morales Napoles, O., and Antonlínez, J.: An exploration of the potential of using storm characteristics from long synthetic time series of wind and water levels for operational forecasting, EGU General Assembly 2024, Vienna, Austria, 14–19 Apr 2024, EGU24-19736, https://doi.org/10.5194/egusphere-egu24-19736, 2024.

EGU24-22402 | Posters on site | OS2.4

Sedimentary record analysis of the geographic occurrences of storm surge events in response to climate change 

Shue Gao, Yang Yang, Liang Zhou, Yanan Li, and Jianhua Gao

The objective of this study is to establish a methodological framework for the study of the pattern changes in terms of geographic occurrences of storm surge events, caused by climate changes. The intensification of storms as a result of global warming may be true because of the enhanced energy level, but any specific situation depends on the geographic location. Due to the spherical shape of the earth and the distribution characteristics of the sea and land, climate zones are formulated, with variations with latitude and longitude. Thus, there are several possible combinations for storm intensity and frequency changes, but where do these different patterns occur and what are the control mechanisms? Here we carry out analyses of sedimentary records to answer these questions, by identifying the relationship between storm processes and the resultant product of deposition. We capture time series information on changes in intensity and frequency of Typhoons in Southeastern Asia and Hurricanes in the Atlantic, from sedimentary records within and near the storm event regions, and then compare them with other synchronous information on SST, ENSO, monsoon, ocean circulation, and atmospheric dust transport, to find clues for mechanism studies. We obtained the materials from the various marine environments, including tidal flats, coastal lagoons, beaches and coastal dunes, storm boulders on biological reefs and continental shelf regions, to identify the presence of storm event records, and obtain the information on the dynamic process that generates the record, in terms of the intensity and frequency of storms. sediment records, and studies of sediment records were carried out. Since the sedimentary records are distributed over low to middle latitudes, the zonation changes in the storm intensity/frequency can be compared with climate changes during the Holocene period. The data sets obtained so far reveal both patterns of synchronicity and asynchronicity of storm pattern changes in different geographical zones and during different climatic periods. The combined effects of the changes in the various factors, as mentioned above, may explain the complexity of the changing patterns. However, in order to quantify or establish a general model for the storm pattern and climate changes, the uncertainties of this study should be reduced, by enhancing the accuracy of storm intensity and frequency indicators, and improving the techniques to determine the spatial resolution of the sedimentary records of storm events.


How to cite: Gao, S., Yang, Y., Zhou, L., Li, Y., and Gao, J.: Sedimentary record analysis of the geographic occurrences of storm surge events in response to climate change, EGU General Assembly 2024, Vienna, Austria, 14–19 Apr 2024, EGU24-22402, https://doi.org/10.5194/egusphere-egu24-22402, 2024.

EGU24-1858 | Posters on site | OS2.5

Quantifying adaptation strategies: The gate index approach to extreme sea level scenarios in the western Baltic Sea 

Jian Su, Birte-Marie Ehlers, Jacob Woge Nielsen, Kristine Skovgaard Madsen, Morten Andreas Dahl Larsen, and Frank Janssen

Sea level rise is a significant threat to coastal regions, requiring thorough scientific evaluations to implement effective adaptation planning. Recent incidents of damages to ships and infrastructure in harbours during storm surge events in the western Baltic Sea have highlighted the urgent need for robust adaptation strategies to sea level rise. This study utilizes regional climate simulations, employing five members of the EURO-CORDEX ensembles, to investigate sea level rise scenarios under the RCP4.5 and RCP8.5 scenarios. Using the concept of "gate index", the study quantitatively assesses the frequency and duration of potential closures of storm surge gates in harbours in response to extreme sea level rise events. The results show significant spatial differences in vulnerabilities across the region, with increased risks under the RCP8.5 scenario. The analysis also emphasises substantial uncertainties, stemming from various factors such as variations in global climate models, complexities in ocean-atmosphere interactions, potential changes in ice sheet dynamics, and uncertainties in future greenhouse gas emissions trajectories. In addition, regional factors such as local sedimentation processes, tectonic activities, and land-use changes can further amplify these uncertainties. The interplay of these multifaceted factors underscores the complex nature of projecting sea-level rise, highlighting the need for a cautious and adaptive approach in coastal planning and policy formulation. These findings provide critical insights for policymakers and practitioners engaged in coastal risk assessment and adaptation planning in the vulnerable Baltic Sea region.

How to cite: Su, J., Ehlers, B.-M., Nielsen, J. W., Madsen, K. S., Larsen, M. A. D., and Janssen, F.: Quantifying adaptation strategies: The gate index approach to extreme sea level scenarios in the western Baltic Sea, EGU General Assembly 2024, Vienna, Austria, 14–19 Apr 2024, EGU24-1858, https://doi.org/10.5194/egusphere-egu24-1858, 2024.

Coastal areas are more vulnerable due to the high extreme natural events and anthropogenic activates are destroying the environment. Food demand is gradually increasing because of the population pressure, while alternative planning like aquaculture land is increasing in some parts of the Saudi Arabia. Global sea level rise is also a triggering factor for shoreline change in the coastal environment with high soil salinity increase. Without any sustainable planning and management, those areas are gradually affected through shoreline shifting and soil salinity-related problems. Remote sensing is the most powerful tool to detect those earth’s surface changes through earth observational datasets. Landsat series datasets were applied for detecting shoreline shifting, aquaculture land identification, and soil salinity along with automatic water area detection using Google Earth Engine cloud computing platform from 1994 to 2023 near Alqalh area, Saudi Arabia. Decadal shoreline shifting observed like 4.48 km2 (1994-2002), 8.82 km2 (2002-2014), 6.61 km2 (2014-2023) and 9.24 km2 (1994-2023), while overall 43.47 km2 (1994-2023) of the area is accretion measured. In the initial periods (1994) aquaculture land did not exit in this area but in the recent time (2023) this area have 71.16 km2 (13.38%) of aquaculture land. Some geo-spatial indices also applied for soil salinity, vegetation and water body area where Vegetation Soil Salinity Index (VSSI) observed high salinity in the year of 2024 due to huge aquaculture land and shoreline shifting towards north-west, south and south-east position of the study area. This investigation outcomes may help local planners in developing novel adaptation strategies in order to protect the environmental degradation.  

Keywords: Coastal area water assessment; Shoreline shifting; Soil salinity; Aquaculture; Remote sensing.                                          

How to cite: Al-Suwaiyan, M. and Yaseen, Z. M.: Coastal area shoreline shifting detection and water salinity assessment based on remote sensing and google earth engine platform: Active aquacultural case study area in Saudi Arabia, EGU General Assembly 2024, Vienna, Austria, 14–19 Apr 2024, EGU24-2656, https://doi.org/10.5194/egusphere-egu24-2656, 2024.

EGU24-3340 | ECS | Orals | OS2.5

Seasonal to multiannual marine ecosystem prediction using a deep learning approach 

Ji-sook Park, Jong-yeon Park, Jeong-hwan Kim, and Yoo-geun Ham

Marine biogeochemistry governs the flux of climate-active gases at the ocean-atmosphere interface, influencing diverse climate feedbacks. Despite advances in Earth System Models (ESMs) for climate-ecosystem predictions, challenges persist in the initialization and validation with biogeochemical observation data. In this study, Convolutional Neural Network (CNN)-based models predict chlorophyll concentrations in a productive large coastal area. The model was trained and validated using Coupled Model Intercomparison Project Phase 6 (CMIP6) multi-model ensemble datasets and physical–biogeochemical reanalysis data from a data assimilative ESM run. Through sensitivity tests on the model structure and input data, the CNN-based model demonstrates physical interpretability consistent with previous studies. Our optimized model adeptly reproduces annual observational chlorophyll variations in coastal regions where dynamic models face challenges, demonstrating comparable prediction skill to dynamic models in seasonal prediction by capturing large-scale climate variabilities. These findings highlight the importance of combining dynamic models and deep learning approaches, offering the potential for more accurate and comprehensive predictions of marine ecosystems.

How to cite: Park, J., Park, J., Kim, J., and Ham, Y.: Seasonal to multiannual marine ecosystem prediction using a deep learning approach, EGU General Assembly 2024, Vienna, Austria, 14–19 Apr 2024, EGU24-3340, https://doi.org/10.5194/egusphere-egu24-3340, 2024.

Investigations on the spatiotemporal variability of coastal sea level and its mechanisms are of great scientific and practical importance. Unlike deep-ocean sea level that can be measured by satellite altimetry, studies on the spatial variability of coastal sea level require measurements from tide gauges and their associated vertical leveling information. Also, the dynamical mechanisms controlling the temporal variability has long been a research hotspot of coastal ocean dynamics. Local winds on the shelf and coastal currents are well recognized to be important in driving coastal sea level variability, but how do open-ocean signals affect sea level at the coast is less known. In addition, coastal sea level reconstruction or prediction often relies on climate models or statistical models. From a new and more dynamic perspective, we recently propose a dynamic framework to quantitatively reconstruct sea level at the coast. This presentation will focus on our recent works on the spatiotemporal variability of coastal sea level, including its alongshore tilts, mechanisms and dynamic reconstruction, as well as the implications and outstanding issues for further research.

How to cite: Lin, H.: Coastal sea level variability: Geodetic measurements, driving factors & dynamic reconstruction., EGU General Assembly 2024, Vienna, Austria, 14–19 Apr 2024, EGU24-3419, https://doi.org/10.5194/egusphere-egu24-3419, 2024.

The need to understand and forecast disasters driven by anthropogenic and natural forces in the Gulf of Mexico and to support management responses to hazardous events led policymakers, scientists, and industry representatives in Mexico to launch an ocean observation and modeling project (2015–2023) aimed at collecting multi-layered baseline information and continuous monitoring of the ocean environment across the southern Gulf of Mexico. We will show the observational network and modeling efforts, led by the Research Consortium for the Gulf of Mexico (CIGoM), include developing a marine hazard warning system to investigate the multiple stressors that are altering the state and health of this large marine ecosystem and its coastal communities. This warning system is intended to aid in establishing of national contingency plans and mitigate the impacts of extreme events and long-term ocean trends. Stressors include hydrocarbon spills, tropical cyclones, marine heatwaves, long-term ocean surface warming, and harmful algal blooms. In this talk we will present part of our work related to the early warning system we have developed involving satelita detection, forecasting models and impact assessments of some oil spills that have occurred in the past few months in this region.

How to cite: Herguera, J. C. and the CIGOM: Ocean Monitoring and Prediction Network for the Sustainable Development of the Gulf of Mexico, EGU General Assembly 2024, Vienna, Austria, 14–19 Apr 2024, EGU24-4170, https://doi.org/10.5194/egusphere-egu24-4170, 2024.

EGU24-4995 | Posters on site | OS2.5

The Ieodo Ocean Research Station (Ieodo-ORS) and Research Endeavors by the Korea Hydrographic and Oceanographic Agency (KHOA) 

Kwang-Young Jeong, Gwangho Seo, Seok Jae Kwon, Hyun-Sik Ham, and Hyun-Ju Oh

Constructed in June 2003, "The Ieodo Ocean Research Station (Ieodo-ORS)," a steel-framed tower-type platform, is strategically positioned near a submarine rock named Ieodo. Its primary objective is to advance our understanding of oceanic and atmospheric phenomena and their intricate interactions in the East China Sea. This station attains global significance owing to its distinctive open-sea location, situated approximately 149 km away from Jeju Island. Initially established by KIOST as part of the Research and Development project of the Ministry of Oceans and Fisheries, control of the Ieodo-ORS was transferred to the KHOA in 2007. Outfitted with 29 instruments for collecting oceanographic, meteorological, and environmental data, the Ieodo-ORS functions as a central hub for diverse projects initiated by the KHOA. These projects are geared towards refining observation techniques, optimizing the utilization of observational data, and systematically monitoring oceanic and atmospheric environments. Since 2014, the KHOA has executed the 'Ieodo-ORS Field Research Trip' program, providing support for a dedicated ship to service the Ieodo-ORS and leverage its facilities. The ultimate objective of the KHOA is to establish the Ieodo-ORS as a globally recognized scientific station through a comprehensive array of academic research initiatives.

How to cite: Jeong, K.-Y., Seo, G., Kwon, S. J., Ham, H.-S., and Oh, H.-J.: The Ieodo Ocean Research Station (Ieodo-ORS) and Research Endeavors by the Korea Hydrographic and Oceanographic Agency (KHOA), EGU General Assembly 2024, Vienna, Austria, 14–19 Apr 2024, EGU24-4995, https://doi.org/10.5194/egusphere-egu24-4995, 2024.

EGU24-6248 | Orals | OS2.5

A new UK scale ocean-wave-river modelling system for predicting extreme sea levels at the coast  

Michela De Dominicis, Lucy Bricheno, Ryan Patmore, Toby Marthews, Segolene Berthou, and Laurent Amoudry

Extreme coastal sea level events are driven by various mechanisms, spanning a wide range of time scales. The long-term decadal and seasonal variability of mean sea level is combined at the coast with the seasonal variability of freshwater discharges, the daily scale of weather-related wave and surge events, and the semidiurnal to diurnal scale of astronomical tidal oscillations. Currently, future extreme sea levels are calculated as a combination of individually modelled sea surface height associated with storm surges and waves, tide and sea level rise, with number of limitations, e.g. the interaction between sea level rise and extreme sea surface height associated with storm surges, waves and tides is not taken into account. Progress in the modelling of the coupled coastal processes is urgently needed to predict how sea level rise will influence extreme sea level change at the coast and to ensure that design criteria for coastal protection are correctly specified, and hazard warning systems picks up potential disasters.

To reproduce the non-linear interactions between mean sea level, storm surge, tides and waves, we are developing an innovative high-resolution (500m) UK scale coastal ocean model based on the NEMO and WaveWatchIII systems (NEMO-WWIII UK500). This new configuration will include intertidal areas and processes (wetting and drying scheme); tides-surge-waves and sea level rise interactions; fully vertically resolved physics to include wave-current interactions and river plume dynamics; near-shore wave processes (wave set-up and run-up); sea level rise impact on tidal range/phase. NEMO-WWIII UK500 will provide predictions of water levels and waves conditions for present (fully validated by contemporary observations) and future scenarios.

The NEMO-WWIII UK500 will also provide a downstream boundary condition to the hydrological model JULES. This will enable the quantification of the effects of ocean water levels on rivers (backwater effect), which is important to lead to correct water levels in the transitional waters (e.g. estuaries and tidal rivers) which host a large proportion of infrastructure (e.g. ports, airports, power stations) and habitats of national and international significance.

How to cite: De Dominicis, M., Bricheno, L., Patmore, R., Marthews, T., Berthou, S., and Amoudry, L.: A new UK scale ocean-wave-river modelling system for predicting extreme sea levels at the coast , EGU General Assembly 2024, Vienna, Austria, 14–19 Apr 2024, EGU24-6248, https://doi.org/10.5194/egusphere-egu24-6248, 2024.

EGU24-7012 | ECS | Posters virtual | OS2.5

Temporal trends and causes of deoxygenation: a comparison of the Northwest Atlantic Shelf and Atlantic Basin 

Hung Nguyen, Samantha Siedlecki, Enrique Curchitser, Charles Stock, Cesar Rocha, Zhuomin Chen, and Felipe Soares

Oxygen concentrations are of fundamental importance for organisms as well as geochemical cycling in oceans. Since the middle of the 20th century, oxygen concentrations have been declining in the open ocean and the coastal ocean. Located near the intersection of subtropical and subpolar circulation, the northwest Atlantic (NWA) Shelf is sensitive to climate variability. Recent work has been done on regional NWA trends in sea-surface temperature, salinity, and chlorophyll, but the trends and drivers of oxygen in the region have not yet been established. Here, we use World Ocean Database oxygen observations to determine the temporal trend of subsurface oxygen concentrations between 50-100m on the NWA Shelf from 1988 to 2019. We also use a regional NWA ROMS and MOM6 configuration to simulate the historical decadal trends and spatial patterns in dissolved oxygen concentrations over the shelf. Our results indicate a significant decrease of oxygen by 1.542±0.308 µmol/kg/year, which surpasses the established Atlantic basin-wide trend. The greatest subregional oxygen loss occurs on the Scotian Shelf and in the Gulf of St. Lawrence. A detailed analysis revealed that the oxygen trends on the NWA shelf are driven by changes in Apparent Oxygen Utilization (AOU), consistent with the decreased influence of Labrador Current in the region and associated water mass properties. Our model identifies the location of minimum oxygen concentrations occurring both at the bottom but also at midwater column depths in the Mid-Atlantic Bight and Gulf of Maine. Under SSP5-8.5, our dynamically downscaled projection (2014-2098) projects that the bottom oxygen in the NWA Shelf will accelerate relative to the historical period (1980-2014). Diagnosis of the mechanisms behind the future acceleration as well as the mid-water column minimum oxygen pattern using various tools will be presented.

How to cite: Nguyen, H., Siedlecki, S., Curchitser, E., Stock, C., Rocha, C., Chen, Z., and Soares, F.: Temporal trends and causes of deoxygenation: a comparison of the Northwest Atlantic Shelf and Atlantic Basin, EGU General Assembly 2024, Vienna, Austria, 14–19 Apr 2024, EGU24-7012, https://doi.org/10.5194/egusphere-egu24-7012, 2024.

EGU24-7495 | Orals | OS2.5

Transdisciplinary co-design to assess impacts of climate change on coastal schemes. 

Laurent Amoudry, Elina Apine, Sara Kaffashi, Constantinos Matsoukis, Marta Meschini, Marta Payo Payo, Amani Becker, Kenisha Garnett, Simon Jude, Claire Evans, Stephen Jay, Francisco Mir Calafat, Andy Plater, Leonie Robinson, Joanna Zawadzka, Jennifer Brown, Richard Dunning, Anil Graves, and Tim Stojanovic

Coastal hazards pose a significant risk to people, property, and infrastructure worldwide. They will be increasing over the next century mainly driven by sea level rise. Managing the coast in a sustainable way requires understanding the impacts under a changing climate of actions done and decisions taken now. This often relies on exploring the response of coastal systems to changing natural and/or anthropogenic drivers using modelling tools. The experimental design of such modelling work is essential in providing the robust scientific evidence needed to underpin effective coastal management. Yet, this experimental design often remains rooted within disciplinary silos and may not take a holistic view of the whole coupled human-environment coastal system. We will explore how considering whole coastal social-ecological systems and social acceptance can shape the experimental design of modelling coastal impacts under a changing climate, and lead to better scientific evidence.

We will present a new integrated, transdisciplinary system-based framework that brings together the provision of a conceptual representation of the complex coastal social-ecological system and consideration of key drivers in this, modelling coastal flooding and valuing ecosystem services now and into the future, and the influence of social perceptions and values. We will illustrate our approach with case studies across the United Kingdom. We will also discuss the benefits and challenges of following a transdisciplinary approach with respect to common coastal managements ambitions, such as improving coastal resilience, promoting a transition towards greener nature-based solutions, and following national and/or global net-zero and net gain objectives.

Our case studies span a range of coastal systems across three nations of the United Kingdom in order to provide examples of different policies and interventions as well as different environmental drivers. Our work builds on the outcomes of a  transdisciplinary capacity-building workshop, which highlighted the need for robustness, consistency, and communication when developing modelling scenarios. We use Fuzzy-Cognitive Mapping to elicit maps of generic coastal social-ecological systems. This is complemented by Soft System Modelling of coastal scheme decision making. We use questionnaire surveys and focus groups combined with Q-sort methodology to define and rank key factors in social acceptability of coastal schemes. Numerical modelling of coastal flooding relies on nested implementations of DELFT3D and SFINCS (Super-Fast INundation of CoastS) models for our case studies. Economic assessment and cost benefit analyses are grounded in the CICES framework and use GIS for habitat mapping to identify the extent and value of various habitats and assess potential flood losses. Overlaying social and flood maps for different scenarios ensures a thorough understanding of impacts, aiding informed decision-making. This approach integrates current habitat conditions with future change projections, essential for effective environmental management and policy planning.

Applying these methods for our case studies, and bringing them together via morphological analysis, our results show that Fuzzy-Cognitive Mapping, Soft System Modelling, Q-sort, and focus groups all provide valuable information and change the optimal output of the experimental design and selection of scenarios. The outcome is that the scientific evidence produced becomes more useful, useable, and trusted.

How to cite: Amoudry, L., Apine, E., Kaffashi, S., Matsoukis, C., Meschini, M., Payo Payo, M., Becker, A., Garnett, K., Jude, S., Evans, C., Jay, S., Mir Calafat, F., Plater, A., Robinson, L., Zawadzka, J., Brown, J., Dunning, R., Graves, A., and Stojanovic, T.: Transdisciplinary co-design to assess impacts of climate change on coastal schemes., EGU General Assembly 2024, Vienna, Austria, 14–19 Apr 2024, EGU24-7495, https://doi.org/10.5194/egusphere-egu24-7495, 2024.

EGU24-8413 | ECS | Posters on site | OS2.5

Probabilistic Assessment of Exposure to Coastal Hazards at a Nuclear Power Station Development Site in the UK 

Zehua Zhong, Hachem Kassem, Ivan Haigh, Dafni Sifnioti, and Ben Gouldby

A fundamental requirement for the development of nuclear power stations is an evaluation of the risk and exposure to external hazards that may challenge nuclear safety. These hazards are often driven by a wide range of meteorological, oceanographic, and geomorphological processes which act on varying spatial and temporal scales. For coastal flooding and erosion, assessing the hazard potential requires consideration of both the local wave and water level variations and the associated regional weather conditions. Fortunately, the development of downscaling techniques offers useful tools for transferring large-scale climate forcings to local impacts. This research aims to conduct probabilistic assessments of coastal hazard exposure at a nuclear power station in the UK by using a hybrid downscaling framework. First, a weather typing method is employed to statistically downscale from regional atmospheric conditions to coastal waves and storm surges at the Hartlepool nuclear power station, which will be further downscaled to coastal flooding and erosion using physics-based dynamical models. We performed a sensitivity analysis to determine what parameters are significant in weather typing to downscale waves and storm surges. The resulting weather types and their associated wave climate and surge conditions are useful in identifying weather patterns related to extreme wave and surge events, which helps to reduce the computational effort in dynamical downscaling by focusing on those coastal-risk weather types and investigating their impacts. The sensitivity analysis reveals that the inclusion of the gradient of sea level pressure as the predictor and the use of local predictands to guide the classification of weather types are important to improve the model performance. 

How to cite: Zhong, Z., Kassem, H., Haigh, I., Sifnioti, D., and Gouldby, B.: Probabilistic Assessment of Exposure to Coastal Hazards at a Nuclear Power Station Development Site in the UK, EGU General Assembly 2024, Vienna, Austria, 14–19 Apr 2024, EGU24-8413, https://doi.org/10.5194/egusphere-egu24-8413, 2024.

EGU24-8719 | Orals | OS2.5

Using on-demand prediction services to build user-tailored coastal Digital Twins 

Anabela Oliveira, Marta Rodrigues, Isa Elegbede, Gonçalo Jesus, André Fortunato, Ricardo Martins, and Alberto Azevedo

The concept of open forecast data has been gaining importance throughout the world, whether they address global, regional or local dynamics.  Most forecast systems in operation, however, just publish images, without providing quantified predictions that could be used to produce new services and have a greater societal impact. The initiatives under the UN Ocean Decade such as CoastPredict (https://www.coastpredict.org/) and DITTO (https://ditto-oceandecade.org/) programs aim at opening forecast information to all and address dynamics from the global to the coastal dimension.

Setting up model or forecast systems are complex tasks that require considerable expertise of coastal dynamics, numerical modeling and computer science. In the last few years, several initiatives have emerged to provide simplified ways to address this challenge and provide user-friendly tools to set up models and their forecast systems, with automatic linkage to global or regional forcings and access to data comparison in near real time. These on-demand forecast platforms aim at expanding the application of forecast systems worldwide, allowing for a broad implementation of decision support and emergency tools thus being an integral part of Digital Twins creation for coastal areas. Examples include SURF (Trotta et al., 2021), Delft-FEWS (Delft-Flood Early Warning System, Werner et al., 2013) and OPENCoastS (Oliveira et al., 2019, 2021).

Herein the OPENCoastS service and web platform are used to illustrate the creation of a core coastal Digital Twin for a data-poor region, using model outputs to compute relevant indicators for fisheries. The application site is the coast of Nigeria in Africa and CMEMs global data is used both to force the predictions and to evaluate its results through comparison with remote sensing products. Indicators suitable for fisheries sustainable operation are presented, developed in close collaboration with local players. This demonstration showcases the importance of on-demand forecast platforms and their role in the construction of Digital twins, facilitating the implementation of the UN Decade goals. The proposed methodology can be expanded in the future to other coastal regions in the scope of the UN Decade WOLLF project, supported by the human and computational resources provided by the ATTRACT European Digital Innovation Hub project.

References

Trotta, F., Federico, I., Pinardi, N., Coppini, G., Causio, S., Jansen, E., Iovino, D., Masina, S., 2021. A Relocatable Ocean Modeling Platform for Downscaling to Shelf-Coastal Areas to Support Disaster Risk Reduction. Front. Mar. Sci. 8, 642815. https://doi.org/10.3389/fmars.2021.642815.

Werner, M., Schellekens, J., Gijsbers, P., van Dijk, M., van den Akker, O., Heynert, K., 2013. The Delft-FEWS flow forecasting system. Environmental Modelling & Software 40, 65–77. https://doi.org/10.1016/j.envsoft.2012.07.010

Oliveira, A., A.B. Fortunato, M. Rodrigues, A. Azevedo, J. Rogeiro, S. Bernardo, L. Lavaud, X. Bertin, A. Nahon, G. Jesus, M. Rocha, P. Lopes, 2021. Forecasting contrasting coastal and estuarine hydrodynamics with OPENCoastS, Environmental Modelling & Software, Volume 143,105132, ISSN 1364-8152, https://doi.org/10.1016/j.envsoft.2021.105132.

Oliveira, A., A.B. Fortunato, J. Rogeiro, J. Teixeira, A. Azevedo, L. Lavaud, X. Bertin, J. Gomes, M. David, J. Pina, M. Rodrigues, P. Lopes, 2019. OPENCoastS: An open-access service for the automatic generation of coastal forecast systems, Environmental Modelling & Software, Volume 124, 104585, ISSN 1364-8152, https://doi.org/10.1016/j.envsoft.2019.104585

How to cite: Oliveira, A., Rodrigues, M., Elegbede, I., Jesus, G., Fortunato, A., Martins, R., and Azevedo, A.: Using on-demand prediction services to build user-tailored coastal Digital Twins, EGU General Assembly 2024, Vienna, Austria, 14–19 Apr 2024, EGU24-8719, https://doi.org/10.5194/egusphere-egu24-8719, 2024.

EGU24-9126 | Orals | OS2.5

Climate Change Impacts on the Adriatic Sea: Integrating Sea State Indicators and River Release Dynamics 

Vladimir Santos da Costa, Giorgia Verri, Murat Gunduz, Alessandro De Lorenzis, Luca Furnari, Alfonso Senatore, Jacopo Alessandri, and Lorenzo Mentaschi

This comprehensive study, conducted within the AdriaClim project, offers a detailed exploration of the multifaceted impacts of climate change on the Adriatic Sea. We propose a limited area climate downscaling with mesoscale integrated modeling of the Adriatic water cycle, including the atmosphere, hydrology and marine thermo-hydrodynamics. The analysis covers the climate window between 1992 and 2050, under the high emission scenario RCP8.5 Examination of Sea Surface Temperature (SST) patterns, revealing a discernible warming trend, particularly along the continental slope influenced by the Western Adriatic Coastal Current. This regional warming has substantial implications for the delicate balance of the Adriatic Sea's ecosystems and underscores the need for targeted adaptive measures.

Marine Heatwaves (MHWs) exhibit both increased duration and intensity during the projection period. This emphasizes the imminent ecological and socio-economic repercussions, necessitating a proactive approach in policy formulations. The study delves into the intricacies of Brunt–Väisälä frequency analysis, unraveling alterations in ocean circulation and heat transport. This comprehensive understanding of regional climate impacts is crucial for informed decision-making in climate adaptation strategies.

Sea Level Rise (SLR) dynamics are explored in detail, showcasing nuanced spatial variations. A latitudinal decrease towards the northeast and heightened levels along the west coast are identified. The mid-term projection indicates a steric-driven increase in SLR, highlighting the importance of region-specific considerations and factors influencing sea level changes. These findings contribute significantly to the broader discourse on global sea-level rise and its regional variations.

A pivotal aspect of the study addresses the impact of projected changes in river release on local density stratification and SLR. Projections indicate a mid-term future decrease of approximately 35% in river release, affecting the Northern and Southern sub-basins differently. The Northern sub-basin will experience salinization prevailing on heating through the whole water column due to the projected runoff decrease, resulting in dense water formation increase and moderated sea level rise. Conversely,  the runoff decrease will have a lower impact in the Southern sub-basin where the future changes of other mechanisms may play a major role, making heating prevailing on salinization at intermediate to deep water column, resulting in lower dense water formation and higher SLR.

This integrated analysis underscores the intricate dynamics of regional climate impacts on the Adriatic Sea. The interplay of warming trends, altered ocean stratification, intensified MHWs, and river release dynamics demands a holistic approach to climate adaptation. Despite the significant strides made, the study acknowledges certain limitations, such as the absence of land subsidence models. The dynamic nature of the Adriatic Sea and the evolving landscape of climate change necessitate continuous monitoring and refinement of models for heightened accuracy in future projections.

The study serves as a testament to the importance of integrated research with a more comprehensive representation of the local water cycle at high time and space resolutions emphasizing the imperative of harmonizing scientific insights with pragmatic policy implementations.

How to cite: Santos da Costa, V., Verri, G., Gunduz, M., De Lorenzis, A., Furnari, L., Senatore, A., Alessandri, J., and Mentaschi, L.: Climate Change Impacts on the Adriatic Sea: Integrating Sea State Indicators and River Release Dynamics, EGU General Assembly 2024, Vienna, Austria, 14–19 Apr 2024, EGU24-9126, https://doi.org/10.5194/egusphere-egu24-9126, 2024.

EGU24-10061 | Posters on site | OS2.5

Adaptation to climate change: Regional sea surface temperature scenarios for the North Sea and the Baltic Sea 

Birte-Marie Ehlers, Jian Su, and Frank Janssen

The German Strategy for Adaptation to Climate Change (Deutsche Anpassungsstrategie - DAS) is the political framework to climate change adaptation in Germany and laid the foundation to prepare for the impacts of climate change and reduce climate risks in a continuous process. The DAS core service “Climate and Water” provides monitoring and projection data to evaluate requirements for climate change adaptation.

An ensemble of regional climate ocean simulations is provided to tackle a large number of questions on the topics of sea level, water temperature, salinity and currents. The regional climate ocean simulation ensemble is based on atmospheric forcing from five members of the EURO-CORDEX ensemble. The simulations were calculated for a thirty-year ”historical” period (1971-2000), a thirty-year ”near future” period (2031-2060) and one for the ”far future” (2071-2100) for the RCP8.5 scenario.In this study, we focus on the evaluation of the sea surface temperature (SST), which has a major impact on the ecosystem and therefore must be part of the adaptation strategy. A comparison of all SST model results with observational data provides a bias correction of the individual ensemble members, which than is also applied to the projected data. The ensemble approach is examined with respect to substantial uncertainties and different types of ensemble representation are discussed. The results are prepared for policymakers and practitioners engaged in coastal risk assessment and adaptation planning and will be available on the internet at https://das.bsh.de.

How to cite: Ehlers, B.-M., Su, J., and Janssen, F.: Adaptation to climate change: Regional sea surface temperature scenarios for the North Sea and the Baltic Sea, EGU General Assembly 2024, Vienna, Austria, 14–19 Apr 2024, EGU24-10061, https://doi.org/10.5194/egusphere-egu24-10061, 2024.

EGU24-11438 | ECS | Orals | OS2.5

Investigating the efficiency of nature-based solutions against estuarine coastal flooding under present and future conditions  

Constantinos Matsoukis, Marta Payo Payo, Elina Apine, Sara Kaffashi, Marta Meschini, Amani Becker, Kenisha Garnett, Simon Jude, Claire Evans, Stephen Jay, Francisco Mir Calafat, Andy Plater, Leonie Robinson, Joanna Zawadzka, Jennifer Brown, Richard Dunning, Anil Gaves, Tim Stojanovic, and Laurent Amoudry

Most coastal areas around the world are currently at risk of flooding, which is increasing due to sea level rise and other impacts of a changing climate. The design of appropriate flood protection policies and schemes is thus becoming more imperative. Partly in response to net zero and net gain agendas, coastal practitioners across sectors have started to champion ‘greener’ nature-based solutions in place of traditional hard coastal defences. However, social acceptance is limited, and examples worldwide are too scarce to fully test and demonstrate the efficiency and societal benefits of nature-based solutions. Appropriate case studies are required to build the knowledge and evidence base needed for the implementation of nature-based solutions.  

In this study, the efficiency of nature-based solutions (e.g., managed realignment) against flooding is investigated for an estuarine case study in Scotland. The Forth Estuary is one of UK’s most important estuarine ecosystems both for economic and ecological reasons. In recent years, flooding events have considerably affected urban areas and infrastructure along the estuary. The frequency and intensity of such events is expected to increase due to climate change and result in significant adverse impacts on local population and economy. Airth is a village situated in the south bank of the inner Forth Estuary. It is a residential area that covers 5500 hectares of agricultural land with some woodland as well. Part of it is designated as a conservation area because of its significant historical background. However, it is often subject to coastal and/or surface water flooding. The local authority has launched a management plan strategy for flooding mitigation seeking adaptation solutions. 

 A 2D numerical model has been built in Delft3D-FM to determine the hydrodynamic setup in the Forth estuary. The model encompasses a large area starting from the inland tidal limit and including both the inner and outer Forth estuary. It is forced upstream by river discharge and downstream by water level time series. To account for additional flood drivers such as wave set-up, run-up, and wind-driven surges, a second model is built in SFINCS with a finer resolution and with its extents locally restrained around the Airth coast. Modelling scenarios comprise at first a series of hindcast simulations performed to reproduce the impact of three recent storm events that largely affected the local community by causing extensive inundation and flooding of properties. The simulations are then repeated with bathymetry adaptations to represent interventions (i.e., managed realignment) into the model and compare their effect against flooding. In addition, simulations with future sea level scenarios are considered to assess these interventions efficiency under a changing climate. As events of similar or higher intensity can be expected in the future, model results can give a good indication of how the system responds when the nature-based defences are in place. These can assist, advise, and direct stakeholders and local authorities to consider alternative and state-of-the-art solutions in their fight against coastal flooding impact. 

How to cite: Matsoukis, C., Payo Payo, M., Apine, E., Kaffashi, S., Meschini, M., Becker, A., Garnett, K., Jude, S., Evans, C., Jay, S., Calafat, F. M., Plater, A., Robinson, L., Zawadzka, J., Brown, J., Dunning, R., Gaves, A., Stojanovic, T., and Amoudry, L.: Investigating the efficiency of nature-based solutions against estuarine coastal flooding under present and future conditions , EGU General Assembly 2024, Vienna, Austria, 14–19 Apr 2024, EGU24-11438, https://doi.org/10.5194/egusphere-egu24-11438, 2024.

EGU24-11959 | ECS | Orals | OS2.5

Future projections of a salt-wedge estuary under a changing climate: impact of the sea level rise and evaluationof a nature-based-solution 

Alessandro De Lorenzis, Giorgia Verri, Vladimir Santos Da Costa, Nadia Pinardi, Giovanni Coppini, Albert Sorolla, Adrian Löchner, and Eugènia Martí

Estuarine zones are particularly vulnerable coastal areas as consequence of the changing climate. The river flow decrease, RD, and the sea level rise, SLR, are leading to: (i) salinization of the surface and subsurface catchment waters, (ii) salt-wedge intrusion SWI moving more and more inland, with a non-linear response to the main drivers of the estuarine dynamics.

 The current study uses a one-dimensional two-layer estuary box model, the so-called CMCC EBM (Verri et al 2020; 2021) which solves the estuarine water exchange by means of two conservation equations for volume and salt fluxes averaged over the diurnal tidal cycle, plus two parametric equations estimating the SWI length and the along-estuary diffusivity.
  The EBM has been applied to the Po di Goro branch of the Po river delta, which is characterised by a river-dominated estuary flowing into the micro-tidal Northern Adriatic Sea. A strength of the EBM here proposed is the extremely low computational time which makes it particularly suitable for climate purposes by bridging the gap between available hydrology and marine hydrodynamics projections which reach at most the mesoscale with high computational costs and without representing the estuarine transitional areas. Additional assets are the minimal data storage and no need to postprocess the results as the SWI length is among the model outcomes. On the other hand, a proper tuning of the parametric equations is required and this was made possible by an accurate in-situ monitoring and a site specific “learning dataset” built upon the outcomes of a 3D unstructured modelling of the Po delta system.

  Considering that there are few studies devoted to the impacts of the local SLR on the SWI and the salinity of estuaries in micro-tidal environments, one of the aims of this study is to expand the knowledge on this topic by proving future projections for the selected test-case.  

  Moreover, the increasing salinization of the Po di Goro estuary threats the local economy and the ecosystem health. Thus, the second aim of this study is to evaluate a Nature-Based-Solution, NBS, to mitigate the SWI, i.e. we assess the salt uptake capability of the Atriplex portulacoides within our modelling study.

Three climate experiments with the EBM have been carried out over 1991-2100 with a ‘mechanistic’ approach: (i) Exp1 is a full-forcing experiment with the river inflow (volume flux at the estuary head) and the seawater inflow (volume flux, salinity and sea level at the estuary mouth) provided by a regional climate model RCM considering RCP 8.5; (ii) Exp2 is a twin experiment of Exp1 but neglecting the sea level among input forcings of the EBM; (iii) Exp3 is a twin experiment of Exp1 but with a reduced salinity of the seawater inflow by assuming that 20% of the estuary water volume interacts with the halophytes planted along the estuary banks.

We propose a discussion on the relative role of the SLR and the RD in determining the future projections of the Po di Goro estuarine dynamics and the potential effect of a site-specific NBS.

How to cite: De Lorenzis, A., Verri, G., Santos Da Costa, V., Pinardi, N., Coppini, G., Sorolla, A., Löchner, A., and Martí, E.: Future projections of a salt-wedge estuary under a changing climate: impact of the sea level rise and evaluationof a nature-based-solution, EGU General Assembly 2024, Vienna, Austria, 14–19 Apr 2024, EGU24-11959, https://doi.org/10.5194/egusphere-egu24-11959, 2024.

EGU24-12416 | ECS | Orals | OS2.5

Forecasting of atmospheric variables based on ECMWF analysis data using Machine Learning approaches 

Mahmud Hasan Ghani, Francesco Trotta, and Nadia Pinardi

Recent advancements within the arena of Artificial Intelligence have widened the potential applications of Machine Learning (ML) frameworks in climate prediction and weather forecasting. For any modern forecasting system, a core objective is linked with handling uncertainty and scientists are interested in the accuracy of the forecasts.  The time series forecast of air temperature using ML approaches is available in the literature. But for this study, we have selected major atmospheric variables- air temperature, dew point temperature, wind components and mean sea-level pressure (MSL-P) retrieved from the ECMWF analysis system and which are to be used in perturbation of the ocean forecasting system. In our previous approach, we analysed the probability distributions of the selected atmospheric variables. In this study, we intend to forecast those atmospheric variables using machine learning algorithms to compare with the analysis dataset produced by ECMWF. Under the initial approach, a Convolution Neural Network (CNN) approach is built to predict the time series for the atmospheric variables. The predicted results from the forecasts have shown minimal differences in comparison to the observations.  Based on the results produced from the CNN, we would like to apply other ML approaches to compare the accuracy and in the process of selecting a better ML model.  

How to cite: Ghani, M. H., Trotta, F., and Pinardi, N.: Forecasting of atmospheric variables based on ECMWF analysis data using Machine Learning approaches, EGU General Assembly 2024, Vienna, Austria, 14–19 Apr 2024, EGU24-12416, https://doi.org/10.5194/egusphere-egu24-12416, 2024.

EGU24-13192 | ECS | Posters on site | OS2.5

The new ICATMAR high-frequency radar network: data analysis and preliminary results on the Catalan Coast turbulence characterization. 

Lucía Quirós-Collazos, Justino Martínez, Lluc Segura-Lladó, Gerard Llorach-Tó, Joaquim Ballabrera-Poy, Concepción Bueno, Emilio García-Ladona, and Jordi Isern-Fontanet

Over the last year 2023, a new high-frequency (HF) radar network has been implemented along the Catalan Coast by the ICATMAR, a cooperative body between the Institute of Marine Sciences (ICM-CSIC) and the Catalan Government that aims to provide scientific advice for the maritime governance in this region. The network consists of 7 CODAR antennas, 5 of which are already operating and the rest will be commissioned before the end of 2024. These antennas provide surface radial velocities and waves measurements along the Catalan Coast, between the coastline and about 40 miles offshore. The radial velocity measurements obtained by two or more antennas are currently being combined using the (unweighted) least-squares fitting method to derive the total current velocity fields. Current data provided by the ICATMAR HF radar network has a spatial resolution of about 9 km2 and is delivered every hour.

The results presented here focus on the characterisation Probability Density Functions (PDFs), statistical moments and structure functions of radial velocities. Quality control standards of JERICO network (defined in JERICO-Next D5.13) have been applied on radial velocity data measured by two antennas (stations CREU and BEGU) over an almost 1-year time series since their installation in 2023. The analysis of the main four moments were performed on validated data in order to characterize the main statistical properties. The derived PDFs differ from a Gaussian distribution by showing heavy tails, characteristic of turbulent flows and ocean observations. Structure functions up to the 15th order were calculated along each radial direction and their scaling were derived, unveiling a spatial variation of the anomalous scaling of the structure functions.

These preliminary results highlight the HF radars value as a tool for sampling surface sub-mesoscale turbulence structures which, in turn, will help improve our understanding of the dynamical properties of ocean flows, specially, in near coastal marine regions where high resolution currents data is scarce.

How to cite: Quirós-Collazos, L., Martínez, J., Segura-Lladó, L., Llorach-Tó, G., Ballabrera-Poy, J., Bueno, C., García-Ladona, E., and Isern-Fontanet, J.: The new ICATMAR high-frequency radar network: data analysis and preliminary results on the Catalan Coast turbulence characterization., EGU General Assembly 2024, Vienna, Austria, 14–19 Apr 2024, EGU24-13192, https://doi.org/10.5194/egusphere-egu24-13192, 2024.

The need for skillful seasonal prediction of coastal sea level anomalies has become increasingly evident as climate change has increased the risk of coastal flooding events. Aiming to improve our ability to forecast coastal inundation risk on seasonal and longer time scales, NOAA and NASA initiated the RISE project, a collaborative effort focused on developing and assessing novel dynamical and statistical forecast methods for coastal sea level and inundation risk for US coasts. This presentation is an outgrowth of that project, initially based on a pilot study of monthly sea level anomaly forecast skill assessed at two tide gauge stations, San Diego CA, and Charleston SC. In this study, we evaluate several current forecast systems -- NCAR Community Climate System Model Version 4 (CCSM4), GFDL Seamless System for Prediction and Earth System Research (SPEAR), and ECMWF Seasonal Forecast System 5 (SEAS5) -- by calculating deterministic and probabilistic skill from a few decades (1993-2015) of their retrospective forecasts (“hindcasts”) and for lead times of up to 6-9 months. Additionally, we examine potential local enhancement of hindcast skill by two post-processing downscaling techniques, an observationally-based multivariate linear regression and a hybrid dynamical model approach, using the adjoint model of the Estimating Circulation and Climate of the Ocean (ECCO) system forced by observed and model-predicted surface forcings.

We find that all these approaches face challenges stemming from whether the modeled sea surface height sufficiently represents observed local variations of coastal sea level, because of ocean model limitations and because of inadequacies in both model initialization and ensemble spread. Some of these issues also complicate the ability of the downscaling techniques to improve probabilistic skill, even though they do somewhat improve deterministic skill. In general, while deterministic hindcast skill is considerably higher for San Diego than Charleston, ensemble spread metrics such as forecast reliability and sharpness are mediocre for both locations. Additionally, evaluating how well any technique predicts seasonal coastal sea level variations is considerably complicated by the forced trend component and particularly how it is estimated, especially for Charleston; .essentially, skill assessment of US coastal sea level seasonal prediction is also a trend detection problem. Moreover, these results are largely matched by hindcasts from a Linear Inverse Model (LIM), a simple stochastically-forced linear prediction model constructed from observations, suggesting that substantial improvement still remains for coastal sea level prediction.

How to cite: Newman, M., Long, X., and Shin, S.-I.: Evaluating Current Statistical and Dynamical Forecast Techniques for Seasonal United States Coastal Sea Level Prediction, EGU General Assembly 2024, Vienna, Austria, 14–19 Apr 2024, EGU24-14252, https://doi.org/10.5194/egusphere-egu24-14252, 2024.

EGU24-14266 | Orals | OS2.5 | Highlight

Advancing Marine Sustainability through Digital Twin What-If Scenarios in Nature Based Solutions 

Joanna Staneva, Nadia Pinardi, Giovanni Coppini, Benjamin Jacob, Wei Chen, Philip-Neri Jayson-Quashigah, Jacopo Alessandri, Lorenzo Mentaschi, and Yann Drillet

Digitalization, particularly through the utilization of digital twins of the ocean, can play a significant role in advancing the sustainable development of the marine environment. The Digital Twin (DT) creates a digital replica of the ocean, enabling testing of various What-If scenarios, such as the impacts of sea level rise, Nature-Based Solutions (NBS), as well as the effectiveness of mitigation and adaptation plans. DTs provide insights into ocean conditions, ecosystems, and human effects, guiding decisions for sustainable resource use. DT-based What-If scenarios in NBS foster cooperation among stakeholders in shared oceanic spaces, enabling data-driven decisions and collaboration. This platform serves for decision-making and management strategies aimed at fostering the sustainable utilization of ocean resources. Such an application is a Digital Twin strategy in designed experiments for nature-based solutions.  It can be employed to evaluate the effects of sea level rise and wave actions on seagrass meadows; and evaluate different management approaches to enhance resilience, while assessing diverse management tactics for bolstering resilience. We demonstrate how Digital twins of the coastal ocean can contribute by aiding decision-making through the use of Whar-If scenarios for coastal protection against erosion and sediment transport by sea level rise, while also ensuring the preservation of coastal biodiversity. By monitoring and optimizing solutions through digital twins, effectiveness and long-term sustainability are heightened, necessitating collaborative efforts for coastline protection and ecosystem preservation.

To further support the coastal restoration (e.g. of seagrass meadows), digital twin technology can be utilized to monitor and model the climate (e.g. sea level rise) and human induced effects on coastal ecosystems. The collaborative efforts for nature based solution as coastline protection and ecosystem preservation are demonstrated in various coastal areas around the Global coast (e.g., in the North Atlantic, Wadden Sea coast, Danube-western Black Sea, Mediterranean coast, Eastern coast of Ghana) In the context of nature-based solutions, a digital twin help identifying areas where seagrass is most vulnerable to the impacts of sea level rise and evaluate different management strategies to promote resilience. In addition to seagrass restoration, other nature-based solutions can effectively address the impacts of sea level rise. These solutions include the restoration of wetlands, dunes, and mangroves, as well as the implementation of green infrastructure such as bioswales and green roofs. Coastal communities can play a critical role in implementing and supporting nature-based solutions. This includes engaging in community-based monitoring and restoration efforts, as well as advocating for policies that prioritize nature-based solutions for coastal protection. The integration of digital twin technology with community efforts can foster a collaborative and data-driven approach to sustainable coastal management and resilience.

How to cite: Staneva, J., Pinardi, N., Coppini, G., Jacob, B., Chen, W., Jayson-Quashigah, P.-N., Alessandri, J., Mentaschi, L., and Drillet, Y.: Advancing Marine Sustainability through Digital Twin What-If Scenarios in Nature Based Solutions, EGU General Assembly 2024, Vienna, Austria, 14–19 Apr 2024, EGU24-14266, https://doi.org/10.5194/egusphere-egu24-14266, 2024.

EGU24-16161 | ECS | Posters on site | OS2.5

Challenges and Strategies in the Development and Operation of High-Frequency Marine Radar Systems in Taiwan 

Huan Meng Chang, Jian Wu Lai, Hsin Yu Yu, Hwa Chien, and Jenq Chi Mau

    The pivotal role of oceanographic parameters in informed decision-making spans a spectrum of marine issues, including resource management, ecological preservation, maritime safety, and national security. Conventional data acquisition methods, such as buoys and survey ships, have become increasingly inadequate in addressing the complex demands of these domains. This insufficiency has propelled the global development of spatially-oriented observational technologies, among which High-Frequency (HF) ocean radar is a standout. Globally, the deployment of HF ocean radar systems has surpassed 1000 units. Taiwan, since the 1990s, has installed 48 HF radar systems, including variants like CODAR, WEAR, and LERA. Despite initial successes, a decline in system performance post-deployment is a recurring issue, often linked to policy discontinuity, fluctuating financial support, team dynamics, technical proficiency, and data application and dissemination challenges. This study explores Taiwan's unique experiences with these impediments in the evolution of HF ocean radar systems, aiming to strategize effective long-term operational planning.

    A case in point is the Taiwan Ocean Radar Observation System (TOROS), established by the Taiwan Ocean Research Institute (TORI) in 2016. This system confronted operational challenges due to insufficient maintenance budgets soon after its inauguration, leading to the cessation of some station operations. Further analysis identified a reactive data dissemination model, requiring user applications and approvals, as a primary issue. This inefficiency, compounded by inadequate promotion, weakened the system's perceived utility, resulting in unsustainable policy support, budget cuts, and the loss of specialized personnel, thereby adversely impacting system functionality in a cyclic manner.

    This paper argues that the ubiquity of data fosters demand, a critical metric for evaluating system utility. Such utility influences administrative decisions, which in turn affect financial commitment, vital for cultivating a skilled technical team. The strategic deployment of this workforce is crucial for consistent system operation and maintenance, ultimately determining operational success. Leveraging insights from past installations and operational experiences, the study proposes methodologies to sustain operational continuity and bolster the efficacy and resilience of HF ocean radar systems.

How to cite: Chang, H. M., Lai, J. W., Yu, H. Y., Chien, H., and Mau, J. C.: Challenges and Strategies in the Development and Operation of High-Frequency Marine Radar Systems in Taiwan, EGU General Assembly 2024, Vienna, Austria, 14–19 Apr 2024, EGU24-16161, https://doi.org/10.5194/egusphere-egu24-16161, 2024.

EGU24-16644 | Orals | OS2.5

Coastline migration and restoring recommendations in China  

Xuege Wang, Fengqin Yan, and Fenzhen Su

Coastal areas are important and functional regions due to their location and abundant natural resources that support human life and certain industries, while these areas are also ecologically vulnerable and have experienced dramatic changes due to both human activities and natural factors. In this article, remote sensing and geographic information system technology are utilized to extract and analyze the spatiotemporal changes in China’s coastline from 1980 to 2018. Additionally, the study introduces the Ecosystem Service Values (ESVs) evaluation method to quantitatively assess the impact of coastline changes on coastal ESVs. Results indicate that from 1980 to 2018, the length of China's mainland coastline increased by 10.2%, characterized by a significant increase in artificial and a sharp decrease in natural coastlines. Aquaculture ponds were the type of coastline with the most increase, followed by construction land and ports. Bedrock coastline was the type of coastline with the most reduction, followed by sandy and muddy coastlines. Over the past four decades, the changes in coastline have led to a decrease of $6.83 billion in ESV in China's coastal zone. Therefore, protecting and restoring China's natural coastline should be highly prioritized. Local authorities should evaluate the ecological environment of specific coastal zones in a timely and effective manner using big data and decision-making tools, and provide feedback to guide the adjustment and implementation of relevant national/regional policies.

How to cite: Wang, X., Yan, F., and Su, F.: Coastline migration and restoring recommendations in China , EGU General Assembly 2024, Vienna, Austria, 14–19 Apr 2024, EGU24-16644, https://doi.org/10.5194/egusphere-egu24-16644, 2024.

EGU24-18780 | ECS | Orals | OS2.5

Multi-model statistical system for monitoring the dispersion of pollutants: Mediterranean case study 

Beatrice Maddalena Scotto, Antonio Novellino, Giovanni Besio, and Andrea Lira Loarca

INTRODUCTION

The Mediterranean Sea is facing escalating environmental threats due to increasing maritime activities, resulting in increased marine pollution. Effectively addressing these challenges necessitates an expanded focus on reliable monitoring services to predict and mitigate the impacts of pollution spills. This study aims to comprehensively understand the dynamics of oil spills in the Mediterranean region, with the objective of establishing a robust and user-friendly framework for an application. This application not only assesses historical oil spill events but also elucidates the intricate interplay of environmental factors, serving as a predictive tool for effective monitoring and planning.

METHODOLOGY

The study centers on determining the dispersion velocity of pollutants, accounting for three significant contributions influencing spill movement: surface velocity of currents, Stokes drift induced by waves, and wind influence within the initial 10 meters above the sea surface. These contributions are fine-tuned using coefficients, building on established methodologies. Data integration from three oceanic models—Copernicus Marine Environmental Monitoring Service (CMEMS), Naval Hydrographic and Oceanographic Service (SHOM), and the French Research Institute for the Exploitation of the Sea (IFREMER)—provides a nuanced analysis of surface current velocities, addressing uncertainties within the ensemble.

The dispersion simulation utilizes the OceanParcels Lagrangian Particle Tracking Model (PTM), tailored to specific events. The analysis includes the temporal and spatial evolution of oil slicks, determining particle release parameters, and evaluating centroids at each moment. Comparison with Synthetic Aperture Radar (SAR) satellite imagery refines model precision, offering real-world validation and aiding in model selection for accurate environmental protection decision-making.

RESULTS

Validation with a real-case scenario, a shipping accident off the coast of Corsica in October 2018, reveals distinctive trajectories among models (Figure1). Integrating wind and Stokes drift refines outputs, with notable alignment to observed events, showcasing enhanced predictive capabilities, especially during the detection of hydrocarbons in France on October 16th (Figure2).

Figure 1(left) – Models trajectory simulated with sea surface currents, showing the evolution of the centroid trajectory and particle distribution in space and time. On the right the color bar showing the values of the particles’ experimental distribution. Figure 2 (right) -Trajectories simulated with the contributions of sea surface currents, wind at 10m and stokes drift, showing the evolution of the centroid trajectory and particle distribution in space and time.

Graphical representations illustrate the spatio-temporal evolution of the particle cloud, providing comprehensive insights into oil spill movement.

CONCLUSIONS

Despite evident progress, persistent uncertainties in climate services pose challenges in predicting and mitigating oil spill impacts. Sustained investments in research and development for climate monitoring services are crucial for addressing uncertainties and ensuring the long-term sustainability of the Mediterranean ecosystem. The future lies in refining models, integrating high-resolution data, and advancing climate monitoring to enhance prediction accuracy and minimize environmental repercussions from pollutant spills in the Mediterranean basin.

How to cite: Scotto, B. M., Novellino, A., Besio, G., and Lira Loarca, A.: Multi-model statistical system for monitoring the dispersion of pollutants: Mediterranean case study, EGU General Assembly 2024, Vienna, Austria, 14–19 Apr 2024, EGU24-18780, https://doi.org/10.5194/egusphere-egu24-18780, 2024.

EGU24-19020 | Orals | OS2.5

The Baltic Sea Observatory – A new holistic approach to understand the coastal ocean 

Peter Holtermann, Jacob Geersen, Robert Mars, Sebastian Neubert, Miriam von Thenen, and Maren Voss

The Baltic Sea, a European semi-enclosed marginal sea, is driven by the estuarine circulation of dense, saline North-Sea water entering the Baltic Sea and mixing with the freshwater input due to rivers and precipitation. The mixed brackish water leaves the Baltic Sea at the surface through the Danish Belts and the Sound. These processes lead to a strong vertical stratification of the Baltic Sea water masses, the halocline. The slow water exchange causes a mean residence time of the water of 30 years, which leads an accumulation of nutrients. A major consequence of the long residence time and the halocline are low oxygen concentrations below the halocline, with virtually permanent anoxic conditions in the deep basins of the Baltic Sea. To what respect climate change, with the warming of the Baltic Sea as one effect, is impacting the Baltic Sea ecosystem is an open and very relevant research question. One potential consequence could be a further spreading of low or anoxic zones towards the coastal areas, which is already being observed. A less well understood part of the Baltic Sea are the shallow coastal zones, but recent research points to the direction of a strong relevance for e.g. the nutrient turnover. To develop a fundamental understanding of the relevant processes and their coupled effect on the biota, it is therefore essential to measure, monitor and predict the shallow water processes along the margins of the Baltic Sea and how they alter the state of the sea at a basin-wide scale.

To address these research questions, the IOW is establishing an interdisciplinary network of long-term and short-term observations in the coastal area of the southern Baltic Sea. This involves deploying moorings in shallow water that send their data to the institute in real time, where they are made immediately available to the general public. The essential ocean parameters (EOP) acquired will be used to control specialized sampling. A measurement program on biogeochemical nutrient turnover, sediment dynamics, geophysics, phytoplankton and zooplankton takes place regularly and is linked to physical data on current patterns, wave intensity and turbulence. The in-Situ measurements are combined with high-resolution numerical modeling to be able to extrapolate the field measurements and to develop numerical experiments.

Different stakeholders groups will be involved to provide society and authorities with the latest findings of the measurement campaigns.

How to cite: Holtermann, P., Geersen, J., Mars, R., Neubert, S., von Thenen, M., and Voss, M.: The Baltic Sea Observatory – A new holistic approach to understand the coastal ocean, EGU General Assembly 2024, Vienna, Austria, 14–19 Apr 2024, EGU24-19020, https://doi.org/10.5194/egusphere-egu24-19020, 2024.

EGU24-19023 | ECS | Orals | OS2.5

Projecting future sea-level change along the coast of the Netherlands with a regional ocean model 

Jeemijn Scheen, Dewi Le Bars, Iris J. Keizer, Tim H.J. Hermans, Sophie J.C. Tubbergen, Bert Wouters, Stef Lhermitte, and Aimée B.A. Slangen

Global mean sea level is rising due to anthropogenic climate change, via the thermal expansion of seawater and the mass loss of land ice. Regional sea-level change is also affected by changes in ocean currents due to the changing climate or internal climate variability. We use the Regional Ocean Modeling System (ROMS) to simulate future sterodynamic sea-level change – the combined contribution of thermal expansion and ocean dynamics – on the Northwestern European Shelf. Regional ocean models such as ROMS are suitable to simulate the exchange of deep ocean currents in the Atlantic with the Northwestern European shelf, and can improve the horizontal resolution from the order of 100 by 100 km (typical for global climate models) to the order of 10 by 10 km. The ROMS model is driven by CMIP6 (Coupled Model Intercomparison Project Phase 6) global climate model output at the domain boundaries, and uses dynamical downscaling to produce projections of sterodynamic sea-level change at a 12 by 12 km horizontal resolution with 30 terrain-following depth layers.

We present projections until 2100 based on 2 CMIP6 models and 5 emission scenarios, for Western Europe at this high resolution. Our results show the advantage of dynamical downscaling on projecting annual average sea level and how this differs between the chosen CMIP6 models and the different emission scenarios. In addition, we assess the linkage between regional sea level and freshwater input of European rivers, comparing simulations without river input, with realistic river input (based on observations) and with enhanced river input. This tests whether a potential future increase in river discharge is relevant to consider in projections of regional sea-level change.

How to cite: Scheen, J., Le Bars, D., Keizer, I. J., Hermans, T. H. J., Tubbergen, S. J. C., Wouters, B., Lhermitte, S., and Slangen, A. B. A.: Projecting future sea-level change along the coast of the Netherlands with a regional ocean model, EGU General Assembly 2024, Vienna, Austria, 14–19 Apr 2024, EGU24-19023, https://doi.org/10.5194/egusphere-egu24-19023, 2024.

EGU24-19232 | ECS | Orals | OS2.5

Oceanographic processes influence the high primary productivity in the Visayan Sea, Philippines   

Aiko Love del Rosario, Adonis Gallentes, Princess Hope Bilgera, and Cesar Villanoy

The mechanisms behind the high productivity of the Visayan Sea (Philippines) need to be understood for better fisheries management. However, current global ocean models are limited to spatial resolution of 1/8° to 1/12° which is around 8-14 km in grid size. Due to the presence of islands, shallow depths and narrow straits surrounding the Visayan Sea, global models cannot resolve and explain the Visayan Sea surface currents. In this paper, we explore the possible reasons for the high productivity in the region through analysis of satellite-derived chl-a and high resolution hydrodynamic models of the Visayan Sea in DELFT3D-Flow and SURF-NEMO.

Tide analysis suggests that the dominant constituents in the Visayan Sea are both semi-diurnal - M2 (principal lunar) and S2 (principal solar). In the larger Philippine Internal Seas which include the Visayan Sea, notably higher M2 and S2 amplitudes are observed in the latter. This can be attributed to the possible resonance of wave-wave interaction by tides coming from surrounding basins. Being a relatively shallow body of water (30-90 m) surrounded by deeper waters (100-1,700 m) and an area where maximum tidal amplitudes are found, stronger vertical mixing and nutrient exchange are ensued, thereby reinforcing productivity. 

Satellite-observed chlorophyll-a concentrations from 2002 to 2022 in the Visayan Sea and adjacent seas are consistently high, regardless of monsoon reversal. Empirical orthogonal function (EOF) analysis of chlorophyll data was also conducted to determine the dominant patterns of chl-a variance. The first 10 modes contribute 65.2 % of the total variance. Mode 1 (18.8 %) is attributed to the seasonal variability (i.e., monsoons). Mode 2 (11.1 %) pattern can be associated with the Nino3.4 ENSO Index, suggesting that primary productivity in the Visayan Sea could be well affected by the changing climate. 

Lastly, this study presents a recommendation of areas that need protection and focused management for better implementation of fishing seasonal closure in the Visayan Sea.

How to cite: del Rosario, A. L., Gallentes, A., Bilgera, P. H., and Villanoy, C.: Oceanographic processes influence the high primary productivity in the Visayan Sea, Philippines  , EGU General Assembly 2024, Vienna, Austria, 14–19 Apr 2024, EGU24-19232, https://doi.org/10.5194/egusphere-egu24-19232, 2024.

EGU24-19635 | Posters on site | OS2.5

Numerical Study on the Circulation in the Gulf of Thailand and Its Seasonal Water Exchange with the South China Sea 

Changshui Xia, Youting wu, Fangli Qiao, and Chalermrat Sangmanee

      Gulf of Thailand is a semi-closed shallow water basin connected to the South China Sea. The seasonal Circulation patterns in the Gulf of Thailand and its water exchange with the South China Sea are studied using the CROCO model from 2017 to 2020. The simulated temperature, salinity, Sea surface height and current field agree with the observation well.  Based on the model result, the upper flow velocity of the horizontal flow field in the Gulf of Thailand a is greater than the lower flow velocity, which means that the Ekman flow driven by the monsoon dominates the upper flow field. Winter and summer are the strongest periods of the monsoon in the sea area, as well as the strongest periods of water exchange between the Gulf of Thailand and the South China Sea. In winter, the upper layer of South China Sea water flows into the Gulf of Thailand, causing an increase in SSH, causing the middle layer of seawater to sink and flow out from the bottom; In summer, the upper layer of Gulf of Thailand water flows out, SSH decreases, the middle layer of seawater surges up to supplement the surface deficiency, and the bottom layer of South China Sea water flows in to compensate.  

Keywords: Gulf of Thailand, Circulation patterns, Gulf of Thailand, South China Sea

How to cite: Xia, C., wu, Y., Qiao, F., and Sangmanee, C.: Numerical Study on the Circulation in the Gulf of Thailand and Its Seasonal Water Exchange with the South China Sea, EGU General Assembly 2024, Vienna, Austria, 14–19 Apr 2024, EGU24-19635, https://doi.org/10.5194/egusphere-egu24-19635, 2024.

EGU24-19811 | ECS | Posters on site | OS2.5

Predicting massive floating macroalgal blooms in the regional sea 

Fucang Zhou, Zhi Chen, Dongyan Liu, Ruishan Chen, Changsheng Chen, Karline Soetaert, and Jianzhong Ge

Increasingly severe and massive floating macroalgal blooms pose significant challenges to the prediction and management of coastal and ocean environment. This study introduces the Floating Macroalgal Growth and Drift Model (FMGDM), a physical-ecological model that tracks, replicates, and extinguishes Lagrangian particles to dynamically simulate the growth and drift pattern of floating macroalgae. The model updates the position, velocity, quantity, and represented biomass of these particles synchronously within its tracking and ecological modules. The macroalgal ecodynamic processes are driven by the oceanic physical-biochemical environments of hydrodynamics, temperature, nutrients, and atmospheric conditions. With the support of the hydrodynamic model and biological macroalgae data, FMGDM can serve as a model tool to forecast floating macroalgal blooms. We developed a forecasting system for large-scale floating macroalgal blooms, which integrates the FMGDM with the Finite-Volume Community Ocean Model (FVCOM). This system is capable of predicting the physical-biogeochemical environment and macroalgal ecodynamic processes in the regional ocean. Biological parameters for this model were specifically derived from culture experiments of Ulva prolifera, a phytoplankton species causing the largest worldwide bloom of green tide in the Yellow Sea, China. With real-time multi-resource satellite data, the system successfully applied to predict green tide events in the Yellow Sea for 2021-2023. The prediction accuracy of coverage can reach 67.0%, and the minimum error of green tide center of mass is 7.39 nautical miles for total coverage of 52.01 km2 and prediction duration of 7 days. Supported by regional marine data and macroalgal physiological characteristics, this system can be expanded to other similar floating macroalgal blooms.

How to cite: Zhou, F., Chen, Z., Liu, D., Chen, R., Chen, C., Soetaert, K., and Ge, J.: Predicting massive floating macroalgal blooms in the regional sea, EGU General Assembly 2024, Vienna, Austria, 14–19 Apr 2024, EGU24-19811, https://doi.org/10.5194/egusphere-egu24-19811, 2024.

EGU24-20826 | ECS | Posters on site | OS2.5

3D high-resolution Romanian Black Sea – Danube Delta coastal geomorphic surveys for change analysis 

Andrei Gabriel Dragos, Monica Palaseanu-Lovejoy, Gabriel Iordache, Irina Stanciu, Florin Pitea, Maria Ionescu, Adrian Gherghe, and Adrian Stanica

The security and wellbeing of a community is partially dependent on a critical understanding of the natural environment, landscape evolution, available resources, vital information communication in response to an event or increasing rates of change. The ability to map flooding, erosion, and habitat loss is a key tool in a country's resilience and strategies for mitigation and adaptation against costly natural hazards, and this cannot be done without high-resolution, accurate 3D data.

Structure-from-Motion (SfM) photogrammetry is a powerful technique for creating high-resolution 3D digital terrain models (DTMs) from overlapping 2D images at a relatively low cost.

We conducted several SfM-photogrammetric surveys in the Romanian Black Sea coastal zone, on the wild protected beaches in front of the Danube Delta - Edighiol barrier beach (July and November 2023) on the southern extent of the Danube Delta, and the Sf. Gheorghe beach immediately North of the southernmost arm of the Danube in the Black Sea (August 2022 and August 2023). Sf. Gheorghe is the only asymmetric active lobe in the Romanian part of the Danube Delta associated with a river-sea confluence barrier island (South of the mouth), which is a very dynamic spit with a large cyclic development. We generated DEMs and orthomosaics at 4 – 5 cm pixel resolution with a vertical mean square error between 5 to 8 cm and a mean error bias of 2 cm or less.

In the case of Sf. Gheorghe beach, between 2012 LiDAR survey and 2022 SfM survey, shoreline erosion up to 100 m was observed immediately adjacent of the northern side of the Sf. Gheorghe branch, at the confluence with the Black Sea. The erosional trend increases closer to the confluence on both Sf. Gheorghe bank and Black Sea shore sides. About 2 km North of the Sf. Gheorghe mouth the 2012 and 2022 shorelines coincide, while on the Sf. Gheorghe branch shore, the two left bank positions coincide after 400 m only. The uneven erosion near the confluence point suggests the impact of Black Sea longshore currents due to insufficient sediment from the Danube. Edighiol SfM surveys analyzed coastal dynamics, emphasizing winter storms, inundation, vegetation changes, sand dune shifts, and beach erosion.

The Danube Delta Black Sea coast erosion is primarily caused by human activities, including reduced sediment supply, altered sediment pathways (resulting from damming, embankments, and canal cutting), and accelerated climate change. Natural factors like subsidence, sea-level rise, and occasional extreme storms also contribute. SfM surveys provide quantitative analysis for assessing short- and long-term changes influenced by episodic and seasonal events in this dynamic environment.


Acknowledgements

This work was financed by The Core Program PN 23 30 03 01 and the H2020 DOORS, EC Grant 101000518 -  Developing Optimal and Open Research Support for the Black Sea (DOORS) project.

How to cite: Dragos, A. G., Palaseanu-Lovejoy, M., Iordache, G., Stanciu, I., Pitea, F., Ionescu, M., Gherghe, A., and Stanica, A.: 3D high-resolution Romanian Black Sea – Danube Delta coastal geomorphic surveys for change analysis, EGU General Assembly 2024, Vienna, Austria, 14–19 Apr 2024, EGU24-20826, https://doi.org/10.5194/egusphere-egu24-20826, 2024.

EGU24-21569 | Orals | OS2.5

Saving lives at sea: Integration of Oceanographic Models and Observations to Improve Coastguard Search and Rescue Operations 

Cristina Forbes, Mairéad O’Donovan, and Giovanni Coppini

Search and rescue planning tools and programs use surface currents and wind data to perform drift simulations to determine the approximate location of persons lost at sea. Access to accurate ocean and atmospheric modeling forecast data and real-time observations is critical for drift modeling simulations to enable targeted SAR operations and planning, and narrowing of search areas in the marine environment, thus saving lives at sea.

The United States Coast Guard (USCG) employs the Search and Rescue Optimal Planning System (SAROPS) for search and rescue (SAR) and planning. SAROPS accesses more than 100 environmental global and local ocean and meteorological surface currents and wind products through the Environmental Data Server (EDS) to perform thousands of Monte Carlo drift simulations and generate time-evolving probability maps which depict the envelope of the search area.

The accuracy of ocean and atmospheric models combined with observations is essential to save lives. Real-time measurements are critical in:

1) areas covered by two or more models which render current speeds/directions that do not match,

2) areas where one model is not accurate at that particular time and location,

3) remote areas (e.g. small islands in the Pacific Ocean) where ocean dynamics are not adequately represented by the global models available.

Inaccuracy in model data becomes very challenging for SAR of mariners lost at sea because searches will be conducted in wrong locations, thus delaying the rescue and expending resources.

Observations from drifters and observational networks are essential for additional SAR guidance. 95% of SAR cases are within 20 NM from the coast. 

The U.S.C.G. deploys self-locating datum marker buoys (SLDMB), Davis-style oceanographic surface drifters, from aircrafts and vessels to provide real-time currents and assist in determining the best model that matches the observations to use for drift modeling and planning. Other oceanographic measurements useful for SAR are near real-time surface currents from High Frequency Radar (HFR) networks which provide continuous maps of ocean surface currents within 200 km of the coast at high spatial (1–6 km) and temporal resolution (hourly or higher).  HFR surface currents are used for model validations, for assimilation into models, and for input to the Short-Term Predictive System (STPS), a forecast model based on HFR - all products used in SAROPS.

Collaboration between the US Coast Guard and CoastPredict’s Predict-on-Time Core Project is intended to have particular impact in remote areas, e.g. remote islands where low-resolution models restrict the efficacy of drift modeling simulations for SAR. Small islands and atolls of the Pacific rely on ocean resources for their subsistence with limited technology so the likelihood of having a distress incident is higher. Getting search and rescue units (SRUs) to those remote areas requires additional time, so the uncertainty in the location of the lost craft or persons becomes larger. Access to more accurate, high-resolution models is critical and the international network for collaboration established by CoastPredict offers an opportunity to leverage existing knowledge and a shared digital infrastructure to improve capacity in areas currently under-resourced. 

How to cite: Forbes, C., O’Donovan, M., and Coppini, G.: Saving lives at sea: Integration of Oceanographic Models and Observations to Improve Coastguard Search and Rescue Operations, EGU General Assembly 2024, Vienna, Austria, 14–19 Apr 2024, EGU24-21569, https://doi.org/10.5194/egusphere-egu24-21569, 2024.

EGU24-21906 | Orals | OS2.5 | Highlight

CoastPredict: the GlobalCoast framework for accelerated coordination of an integrated global system for coastal ocean observing and prediction 

Giovanni Coppini, Villy Kourafalou, Joaquín Tintoré, Emma Heslop, Jo Hopkins, Miguel Charcos Llorens, Mairéad O’Donovan, and Nadia Pinardi

The CoastPredict Programme, an endorsed Programme of the Ocean Decade, has established a central framework for coordination and practical implementation called ‘GlobalCoast’. GlobalCoast will coordinate implementation and integration of the science and technology advances from CoastPredict’s six Focus Areas at Pilot Sites in a range of contrasting Regions of the Global Coastal Ocean, using and developing best practice principles in observing, data management, modelling and co-design. The Programme Focus Areas projects address priorities related to coastal resilience including: Integrated observing and modelling for short term coastal forecasting and early warnings; Future Coastal Ocean climates: Earth System observing and modelling; Solutions for integrated coastal management; Coastal information integrated in an open and free international exchange infrastructure; Equitable coastal ocean capacity.

GlobalCoast will overcome a number of existing barriers including: the lack of an international network for Global Coastal Ocean innovation and solutions for integrated observing and prediction, and associated fragmentation of knowledge; the particular challenge regarding open and free data access in the Global South; the lack of end-user (coastal managers / communities) involvement and the long timeframe currently required to demonstrate solutions.  

Through GlobalCoast, CoastPredict will demonstrate (at Pilot Sites) an integrated observing and predicting system for the global coastal ocean and create globally replicable solutions, standards, and applications that enhance coastal resilience. A global digital cloud-based infrastructure will be key to acceleration - the cloud-based computing platform will enable accelerated data collection and open and free data sharing, and advancement of modelling and analysis tools, aligned with best practices.

How to cite: Coppini, G., Kourafalou, V., Tintoré, J., Heslop, E., Hopkins, J., Charcos Llorens, M., O’Donovan, M., and Pinardi, N.: CoastPredict: the GlobalCoast framework for accelerated coordination of an integrated global system for coastal ocean observing and prediction, EGU General Assembly 2024, Vienna, Austria, 14–19 Apr 2024, EGU24-21906, https://doi.org/10.5194/egusphere-egu24-21906, 2024.

Large submarine landslides are a global concern as they can trigger tsunamis with no clear precursors. While geological characterization of submarine landslides remains a challenge to many areas worldwide, the availability of global bathymetric datasets and spatial analysis tools has led to progress in mapping these submarine geomorphological features. Morphological and statistical analyses of submarine landslides and their attributes enable the identification of regions susceptible to large submarine failures and covariates that are good predictors of submarine landslide volume. This study identifies significant clusters of large submarine landslides mapped (n=1214) in the Negros–Sulu Trench System by testing the spatial dependence of volume using global Moran’s I and Getis-Ord (Gi*) statistic. This study further explores a spatial model that best elucidates the distribution of submarine landslide volume. Global Moran’s I suggests significant positive spatial autocorrelation, while Gi* statistic reveals local clustering of large-volume submarine landslides, where the densest clustering occurs offshore of southern Panay Island. Among the 18 spatial regression models, the (1) univariate spatial Durbin, (2) nested, and (3) spatial Durbin error with the maximum slope as the predictor have the lowest Akaike information criterion (AIC) of 2056.1, 2057.0, and 2057.8, respectively. The spatial regression models also revealed that mean depth is a poor predictor of submarine landslide volume. Log likelihood-ratio test suggests a simpler option of the nested model. The spatial Durbin error model better represents the underlying local heterogeneities such as sediment flux and subduction processes in triggering submarine landslides than the global spillover effects of the spatial Durbin model. Furthermore, this study highlights the dominant role of slope and tectonic processes that induce oversteepening, triggering large submarine landslides that may induce damaging tsunamis. The identified offshore areas with significant clustering of large submarine landslides are valuable information for offshore geophysical surveys and tsunami hazard assessment in the region.

How to cite: Nawanao, L. and Ramos, N.: Spatial Regression Modeling and Distribution of Submarine Landslides in the Negros–Sulu Trench System, EGU General Assembly 2024, Vienna, Austria, 14–19 Apr 2024, EGU24-22, https://doi.org/10.5194/egusphere-egu24-22, 2024.

The Ordovician karst fracture-cave reservoir in Tahe oilfield has strong heterogeneity, and palaeogeomorphology, fault and fracture play important roles in the development of the complexity of the fracture-cave reservoir. Based on rich geological and geophysical data, the influence of faults on the karst reservoir development in carbonatite under different palaeogeomorphic conditions are analyzed through the interpretation of faults and the activity of internal faults in carbonate rocks in different periods, combined with palaeokarst environment and karst products. 
The results show that there are not only strike-slip faults but also an NNE-thrust fault in the sixth and seventh districts of Tahe Oilfield, which control the direction of long-axis anticline in the center of the study area. The anticline becomes an important watershed and most of the surface gullies develop along suitable faults from the top of the anticline to lower areas. According to the karst geomorphology, water system and fracture-cave distribution, landforms are divided into three types: hoodoo-upland, karst depression and karst basin. In the hoodoo-upland, the fracture networks around the faults are dissolved and small and medium-sized fractures develop, and the reservoirs have low filling degree and good performance. In the karst depression, the landforms are transformed by strong water erosion and karst dissolution. The underground rivers and the palaeogeomorphic gullies controlled by high-angle strike-slip faults are relatively straight, while the others controlled by low-angle faults are tortuous. Unfilled caves and intergranular pores in cave fillings are the main reservoir spaces. In karst basin, the Ordovician soluble limestone is covered by stucco deposits, which greatly weakens the karstification. The fractures and caves can develop only along the faults and fractures at a very deep depth. The spatial structure, connectivity, porosity and permeability are complicated. The main reservoir types are fractures, fracture-cave and isolated caves. The filling types are fault karst breccia, giant crystal chemical filling or no filling. Therefore, faults affect the development of reservoir types and fillings under different geomorphology and karst water conditions, which has important guiding significance for the accurate exploration and development of carbonate fracture-cave reservoirs. 

How to cite: Zhang, X. and Jin, Q.: The influence of faults on the development of canbonate karst reservoir in main area of tahe oilfield and its significance in petroleum geology, EGU General Assembly 2024, Vienna, Austria, 14–19 Apr 2024, EGU24-67, https://doi.org/10.5194/egusphere-egu24-67, 2024.

EGU24-648 | ECS | Orals | GM9.6 | Highlight

Unveiling the Multifaceted Hazard Risks of Volcanic Eruptions: The case of Kolumbo submarine volcano 

Anna Katsigera, Paraskevi Nomikou, Kosmas Pavlopoulos, Paraskevi Polymenakou, Konstantinos Karantzalos, Aggelos Mallios, Sergio Simone Scire Scapuzzo, Andrea Luca Rizzo, Gianluca Lazaro, Manfredi Longo, Walter D'Alessandro, Fausto Grassa, Lars-Eric Heimbürger-Boavida, Valsamis Ntouskos, Christos Antoniou, and Sotiris Spanos

Volcanic eruptions stand as formidable threats to adjacent communities, unleashing a spectrum of hazards such as earthquakes, tsunamis, pyroclastic flows, and toxic gases. The imperative for proactive management of volcanic risks cannot be overstated, particularly in densely populated areas where the potential for widespread devastation looms large. Kolumbo, an active submerged volcano located approximately 7 kilometers northeast of Santorini Island in Greece at 500m depth, serves a pertinent case. Its historical record is marred by an eruption in 1650 AD which triggered a relentless tsunami. The aftermath witnessed havoc on neighboring islands, coupled with casualties stemming from noxious gases in Santorini. Eyewitness accounts mention maximum water run-up heights of 20m on the southern coast of Ios, a staggering 240m inundation on Sikinos, and a disconcerting flooding of up to 2km² of land on the eastern coast of Santorini.

Recent studies suggest that a potential future explosive eruption of Kolumbo poses a substantial hazard to the northern and eastern coasts of Santorini. Unfortunately, the absence of a concrete management protocol, leaves these areas vulnerable to an impending threat that demands immediate attention. Therefore, it is recommended that a comprehensive approach be adopted, involving scientific research (active monitoring, hazard maps), community engagement, preparedness planning with government agencies, and the development of timely response strategies to reduce the associated risks, prevent casualties, and mitigate the consequences on the region's economy and infrastructure. Our team has multidisciplinary data from past oceanographic expeditions that will help us to understand Kolumbo’s behavior. These include a) High-resolution multibeam bathymetry data and optical data., b) a dense network of sub-seafloor seismic reflection profiles, c) a series of the seafloor and sub-seafloor samples of microbial mat and sediments, d) CTD data, e) several polymetallic (Au, Ag, As, Sb, Pb, Hg, Mo, Zn, Cu, Tl) CO2 diffuser chimney samples and f) tephra in marine sediment cores. Despite the current knowledge that we managed to obtain, monitoring is needed to efficiently assess potential hazards and create early warning systems and management protocols for an imminent eruption from Kolumbo. In the current context, advanced sensors have been deployed to monitor Kolumbo's active hydrothermal field as part of the SANTORY project. The SANTORY project aims to create innovative communication tools and establish interregional monitoring protocols, providing the scientific community, policymakers, and stakeholders with the means to assess hazard warning codes effectively.

How to cite: Katsigera, A., Nomikou, P., Pavlopoulos, K., Polymenakou, P., Karantzalos, K., Mallios, A., Scire Scapuzzo, S. S., Rizzo, A. L., Lazaro, G., Longo, M., D'Alessandro, W., Grassa, F., Heimbürger-Boavida, L.-E., Ntouskos, V., Antoniou, C., and Spanos, S.: Unveiling the Multifaceted Hazard Risks of Volcanic Eruptions: The case of Kolumbo submarine volcano, EGU General Assembly 2024, Vienna, Austria, 14–19 Apr 2024, EGU24-648, https://doi.org/10.5194/egusphere-egu24-648, 2024.

Lake Sapanca is located in the Eastern Marmara region of Turkiye and formed as a tectonic lake by the right-lateral strike slip North Anatolian Fault (NAF). Located 33 m above sea level, this tectonic lake has a length of 16 km in the east-west direction and 5 km in the north-south direction. The area in which the lake is located is on the Izmit-Sapanca Corridor, which is bordered by the segments of the northern branch of the NAF, between the Samanlı Mountains to the south and the Kocaeli Peneplain to the north. Multibeam bathymetry and high-resolution seismic data were acquired in the lake as a part of a TUBITAK project (Project No: 117Y130) in August 2018 to determine the structural and stratigraphic elements of the lake. Many pockmark structures, as well as lineaments related to the NAF, were observed on multibeam maps giving cm-scale resolution on the lake bottom. Thus, the effects of NAF in the lake can be better determined depending on the geometrical properties of the pockmarks, more than 300 in number, which are formed due to gas or fluid outflows from the lake-bottom, and their distribution in certain parts of the lake. In order to determine these features of pockmarks, semi-automatic approaches of QGIS and ARCGIS software programs were used and it was observed that the pockmark distribution increased along the lineament direction of the NAF and in the northeast of the lake. Moreover, we conclude that, the consistent orientation of the individual pockmarks may indicate that all pockmarks were formed in a relatively short period of time or that the bottom current regime in the lake has been effective for a long time. 

How to cite: Sönmez, E. and Kurt, H.: An Example of Determining Fault Properties from Morphological Analysis of Pockmarks is Sapanca Lake, Located on the North Anatolian Fault, Turkiye, EGU General Assembly 2024, Vienna, Austria, 14–19 Apr 2024, EGU24-997, https://doi.org/10.5194/egusphere-egu24-997, 2024.

EGU24-1121 | ECS | Orals | GM9.6

Dynamic changes in depositional patterns and glaciotectonic deformations revealed by high-resolution 3D seismic data in the Northern North Sea. 

Bartosz Kurjanski, Nick Lee, Allan MacKay, Bill Powell, and Julien Oukili

During the Last Glacial Maximum (LGM), the British-Irish ice sheet is known to have been coalescent with the Fennoscandian ice sheet. Some models indicate that this might have been rather short-lived, whereas other reconstructions indicate an early and long-lasting coalescence of the ice sheets which, together reached the Northern North Sea continental shelf edge around 27,000 years ago. To date, the lack of empirical data, in the form of boreholes or high and ultra-high resolution seismic data has hindered efforts to validate the reconstructions and identify ice flow directions, drainage patterns, and chronology. Little is also known about the nature of the deglaciation and unzipping of the two ice sheets  which would  have likely comprised  multiple ice re-advances, stillstands, and retreats as well as an unknown duration of ice grounding which, based on experience, will result in complex and heterogeneous stratigraphy, vertically and horizontally

In this study, a unique 3D seismic dataset with bin spacing of 3.125m x 3.125m and a frequency range of ~10-160Hz will be used to reconstruct the depositional history and sequence of events in the shallow subsurface(~ 200m below sea bed) including but not limited to processes responsible for tunnel valley formation and infill, large scale glaciotectonic deformation or postglacial deposition. This will be juxtaposed against known paraglacial reconstructions to propose preliminary timing of events. Implications for offshore infrastructure projects will be subsequently discussed in the context of ground conditions identified over the site.

How to cite: Kurjanski, B., Lee, N., MacKay, A., Powell, B., and Oukili, J.: Dynamic changes in depositional patterns and glaciotectonic deformations revealed by high-resolution 3D seismic data in the Northern North Sea., EGU General Assembly 2024, Vienna, Austria, 14–19 Apr 2024, EGU24-1121, https://doi.org/10.5194/egusphere-egu24-1121, 2024.

EGU24-2937 | ECS | Posters on site | GM9.6

Fine-scale seafloor bedform morphology along a slope-confined submarine canyon in the Northern South China Sea 

Yue Sun, Dawei Wang, Miquel Canals, Tiago M Alves, and Fanchang Zeng

Bedforms are widely distributed within deep-water submarine canyons, which are usually documented by vessel-mounted sensors. Yet, fine-scale geomorphology and shallow structures of bedforms in deep-water submarine canyons remain poorly documented, and understood, because of the insufficient resolution of vessel-based data. This study utilizes high-resolution autonomous underwater vehicle (AUV) dataset combined with intermediate seismic reflection profile and sediment cores to analyze bedform sets along a slope-confined submarine canyon (canyon C14) from the northern South China Sea. A train of crescent-shaped to inverted U-shaped axial steps in plan view are aligned downstream along the canyon thalweg from upper course to lower course. Based on comprehensive analysis of morphologic features, subsurface structures, flow estimates, and potential origins, these steps are likely to be cyclic steps created by supercritical turbidity currents. Sediment cores mainly comprised by silt with minor sand contents further suggesting the shallow canyon sediments probably deposited by diluted turbidity currents. Axial steps (S1-S4) with lower asymmetry and wavelengths in the upper course show an erosional truncation and horizontal to sub-horizontal reflectors draping on the lee side and stoss side, respectively, illustrating the erosional-depositional cyclic steps formed by more confined flow with higher erosion capability due to the narrow canyon (average width of 3.5 km) and steep slope gradient (average of 2.36°). Leaving transition segment, the less confined flow passing through lower course can be subject to wider canyon (average width of 5.5 km) and gently slope gradient (average of 1.2°) that increases the asymmetry and wavelengths of axial steps (S5-S7) and leave backset bed deposits on the stoss sides, probably pointing to the depositional cyclic steps with higher aggradation. Sediment filling, almost padding each cyclic step-associated scour, indicate that the previous-formed bedforms can be reworked by subsequent gravity flows deposits which mainly consist of slope failures-associated mass-transport deposits and turbidity currents deposits. Near the lower end of the canyon, reduction in flow velocity caused by further decrease of slope gradient (average of 1.05°) as the key factor leading to the shift from cyclic steps to furrows, but always under supercritical flow conditions. In this context, a sector of axial channel probably promotes the re-convergence of turbidity currents, resulting in the erosion of fine-grained cohesive deposits on the canyon floor, to form linear furrows within the axial channel. This work provides a good opportunity to investigate the fine-scale morphological features and shallow structures of bedforms in deep-water submarine canyon, and understand their evolution under the influence of canyon topography.

How to cite: Sun, Y., Wang, D., Canals, M., Alves, T. M., and Zeng, F.: Fine-scale seafloor bedform morphology along a slope-confined submarine canyon in the Northern South China Sea, EGU General Assembly 2024, Vienna, Austria, 14–19 Apr 2024, EGU24-2937, https://doi.org/10.5194/egusphere-egu24-2937, 2024.

EGU24-5688 | ECS | Orals | GM9.6

Turbulence intermittency effects on initiation threshold of sediment motion in natural waters  

Renzhi Li, Yaping Wang, and Shu Gao

The initiation threshold of sediment motion, a key component in quantifying sediment transport, has potential link to intermittent turbulence bursts. Here, we elaborated in situ experiments on coastal sea bottom covered with cohesive sediments, to extract intermittency parameters. For the first time, waiting time between turbulence bursts was utilized to capture the occurrence of sediment initiation events. A relationship found between waiting time and shear stress reveals the different intermittency feature of sediment flux time series before and after reaching the threshold, which can be used to determine the initiation threshold of sediment motion. Multi-site results demonstrate the limitations of traditional empirical formulae for fine-grained sediments, where cohesiveness becomes more pronounced as grain size decreases and the deviation can reach 600%. The empirical formula was modified using grain size, and the modified calculations were in good agreement with observed values, which will greatly assist in sediment transport and geomorphology model predictions.

How to cite: Li, R., Wang, Y., and Gao, S.: Turbulence intermittency effects on initiation threshold of sediment motion in natural waters , EGU General Assembly 2024, Vienna, Austria, 14–19 Apr 2024, EGU24-5688, https://doi.org/10.5194/egusphere-egu24-5688, 2024.

EGU24-5760 | Posters on site | GM9.6

Automatic pockmark detection in the Norwegian Channel  

Dag Ottesen and Markus Diesing

Pockmarks are widely distributed in areas with fine-grained layered sediments. We utilised a large multibeam bathymetric dataset covering an area of c. 15,000 km2 of the Norwegian Channel (NC), the western slope and adjacent shelf outside western Norway. Pockmarks were extracted from the bathymetry data with two approaches: by identifying local minima in the bathymetry and by mapping landform types based on geomorphons. While the former approach yielded a point dataset indicating local minimum depths, the latter approach allowed to outline potential pockmarks as polygons based on the landform types of pits and valleys. To increase the reliability of the classification, only pockmark polygons that contained at least one local minimum were subsequently retained. This mainly removed artefacts at the edges of the classified area. Likewise, only those local minima that fell inside a pockmark polygon were retained. Finally, a limited number (<1%) of polygons incorrectly mapped as pockmarks was manually removed. 

Approximately 65,000 pockmarks were automatically detected inside the study area. The highest pockmark densities were located in the western slope of the NC. Here, an extensive pattern of elongated pockmarks was found, indicating strong bottom currents over the area.  

The study area is located in the Viking Graben area with the Øygarden Fault zone to the east. The stratigraphy comprises dipping Mesozoic and Cenozoic clastic sediments over a Paleozoic or crystalline basement. On top of these layers an Upper Regional Unconformity (URU) appears. Above the URU, which forms the base of the NC, flat lying units of glacial (till) and marine sediments are found. Above these layers of late-glacial and Holocene sediments up to a few tens of metres appear.   

The gigantic Troll hydrocarbon field is located in the northern part of the study area, and several studies have documented that there is no active fluid seepage today, so the pockmarks are thought to have been formed by gas hydrate dissociation under/after the last deglaciation. 

How to cite: Ottesen, D. and Diesing, M.: Automatic pockmark detection in the Norwegian Channel , EGU General Assembly 2024, Vienna, Austria, 14–19 Apr 2024, EGU24-5760, https://doi.org/10.5194/egusphere-egu24-5760, 2024.

Diamantina Trench in the southeast Indian Ocean is one of the less unexplored hadal trenches (> 6000 m) of our planet, which develops the second deepest point (Dordrecht Deep, ca. 7019 m depth) in the Indian Ocean. Humans did not visit its ocean floor until the Chinese submersible Fendouzhe reached its deepest point in January 2023. This expedition collected high-resolution multibeam sonar bathymetry data covering about 3000 nautical miles and conducted 28 scientific dives with high-resolution videos and push core sediments of the upper seafloor (max. 40 cm) at a wide range of submarine geomorphology. This study combines these materials to fully assess the morphological variability of the trench and the causative factors and processes determining such characteristics.

Bathymetry data indicate a rugged and complex landscape with various seamounts and debris deposits in the Diamantina Trench which could be classified into three sections. Bounded by the Broken Ridge to the north, the western section contains a series of basins and gorges, as well as parallel intruded ridges (WNW striking). The eastern section shows deeper and steeper slopes compared to the western section. The transitional area of the two sections (the Dordrecht Deep area, 270 km2) is the deepest part of the trench.

Four push core sediment profiles were analyzed from the most west and east locations, the Dordrecht Deep area, and the western trend with foraminifera oozes. Layers of foraminifera and calcareous nannofossil oozes occur at the western section, whereas brownish pelagic sediments with occasionally coarse-grained Fe-Mn nodules develop at the eastern section. The preliminary results of total carbon (TC) and total nitrogen (TN) suggest distinct differences among and within profiles. TC values reach 12% in foraminifera oozes and less than 1.2% in the pelagic sediments. TC values decrease rapidly at the upper 10 cm and remain low (0.1–0.2%) at the lower part in the profiles from the eastern section and Dordrecht Deep area. An analogous trend applies to the TN graphs. The sediment profile from the western section, however, shows decreasing TC and TN values within depth.

This research provides the first knowledge of the highly spatial heterogeneity of submarine geomorphological characteristics and sediment dynamics in the Diamantina Trench. The ongoing measurements of organic matter content, carbon isotope, and grain size from different topographic locations with the potential of dating methods (e.g., 14C and paleontological data) will further aid in reconstructing the spatial variations of paleoenvironmental changes and organic cycling process, as well as in understanding the relationship with tectonic activities and catastrophic events in hadal zones.

How to cite: Yang, X., Huang, X., Zhou, P., and Peng, X.: Submarine geomorphology of the Diamantina Trench (SE Indian Ocean) based on high-resolution multibeam sonar bathymetry and push core sediments, EGU General Assembly 2024, Vienna, Austria, 14–19 Apr 2024, EGU24-5882, https://doi.org/10.5194/egusphere-egu24-5882, 2024.

Submarine braided channels, driven by turbidity currents, have been revealed on several deep-sea fans, displaying similar morphological features to fluvial braided rivers. Past experimental studies on submarine braided channels have shown that active braiding intensity (BIA) is proportional to fixed confinement width, dimensionless stream power (ω*) and dimensionless sediment-stream power (ω**). However, the field-scale submarine braided channels may not restrict to a fixed confinement width (B); instead, the confinement shape often exhibits gradual widening or narrowing. In this study, we use physical experiments to investigate the influence of confinement shapes and inflow-to-sediment discharge ratios (Qin/Qs) on the evolution of submarine braided channels. In the experiments, three confinement shapes were simulated: diamond, hourglass, and reversed trapezoid. The experimental results show that the BIA is strongly proportional to the varying confinement width, i.e., increasing confinement width facilitates the degree of braiding; decreasing confinement width suppresses the degree of braiding. The measured BIA is proportional to both the ω* and ω**. Additionally, increasing Qin/Qs causes a slightly decrease of BIA. The measured active width (Wa) is proportional to the bulk change (Vbulk). These relations all agree with the published trends of both fluvial and submarine braided channels. For the geometric properties of sandbars, the measured sandbar aspect ratio and sandbar compactness ratio remain constant regardless the change of confinement shape or Qin/Qs. Finally, the experimental results may aid our understanding to the morphological evolution of submarine braided channels and provide insights to the stacking patterns of hydrocarbon reservoirs.


Keywords: submarine braided channels, turbidity current, physical experiment, confinement shape, active braiding intensity

How to cite: Tsai, Y.-T. and Lai, S. Y. J.: Submarine braided channels in response to channel confinement shapes and inflow-to-sediment discharge ratios: Insights from physical experiments, EGU General Assembly 2024, Vienna, Austria, 14–19 Apr 2024, EGU24-6154, https://doi.org/10.5194/egusphere-egu24-6154, 2024.

EGU24-7144 | Posters on site | GM9.6

Submerged aeolian dunes on the flat-topped Dokdo seamount in the East (Japan) Sea, Korea 

Jang-Jun Bahk, Soo-Jin Kim, Chang Hwan Kim, Young Kwan Sohn, and Chan Hong Park

This study examines subaqueous dunes located on the southern periphery of the flat top of Dokdo Seamount at water depths from 120 to 170 meters, where the present ocean currents are incapable of generating such large bedforms. To determine their origin, we conducted a comprehensive analysis of the geomorphic characteristics using high-resolution multi-beam bathymetry and the grain-size characteristics of seafloor sediments. The analysis of the dune spacing in relation to height, as well as their migration and growth pattern, indicates that the Dokdo subaqueous dunes (DSDs) originally formed as aeolian dunes. These were shaped by northerly winter winds that carried sands from the wave erosion surfaces on the northern part of the flat top. The DSDs are believed to have transitioned to their current submerged state without experiencing significant erosion or reactivation. Considering the variations in the Plio-Pleistocene global mean sea level, we estimate the possible subsidence rate of the flat top to be approximately 130 m/myrs, aligning with the conditions required for the formation of DSDs. This study highlights how relict features such as submerged aeolian dunes on seamount summits can be utilized to precisely estimate the subsidence rate of oceanic volcanoes.

How to cite: Bahk, J.-J., Kim, S.-J., Kim, C. H., Sohn, Y. K., and Park, C. H.: Submerged aeolian dunes on the flat-topped Dokdo seamount in the East (Japan) Sea, Korea, EGU General Assembly 2024, Vienna, Austria, 14–19 Apr 2024, EGU24-7144, https://doi.org/10.5194/egusphere-egu24-7144, 2024.

 This study presents a detailed analysis of grain-size distributions of closely spaced surface sediment samples from the eastern continental margin of the Korean Peninsula off Gangneung and Donghae. This region is characterized by a wave-dominated beach, narrow shelf less than 10 km wide, and slopes with varying gradients ranging from 0.7 to 6.3 degrees. Spatial variations in dominant sediment transport modes were identified using end-member analysis (EMA) of the grain-size distributions.

 The EMA revealed five distinct end-member distributions (EMD) with mean grain sizes of 221.2 μm (EMD1), 89.2 μm (EMD2), 52.4 μm (EMD3), 22.0 μm (EMD4), and 4.5 μm (EMD5), respectively. EMD1, is significant only at two shallow sample sites near the coast, adjacent to the exposed rocky seafloor, indicating an origin from a relict sand during the post-glacial transgression. EMD2 predominates on the shelf and upper slope (40 to 150 m water depths) along the margin, particularly near a local river mouth, suggesting bedload transport of riverine sand by longshore drifts or episodic storm surges. EMD3, potentially representing coarser suspended load, dominates the upper middle slope (200 to 400 m water depths) where the slope gradient is relatively constant, and the isobaths generally run parallel to the shoreline about 15 km apart. EMD4, potentially representing finer suspended load, prevails in the deeper middle slope (400 to 800 m water depths) characterized by varying morphology: narrower and relatively steeper in the northern part, and wider and gentler in the southern part of the margin. The higher proportions of EMD4 extend far offshore in the wider and gentler southern part more than about 35 km, whereas they are limited to within 30 km from the shoreline at the base of the steeper and narrower slope in the northern part. The morphologically controlled EMD4 distributions suggest that a density current was responsible for the offshore fine-grained sediment transport in this margin, rather than diffusion or advection by ocean currents. Finally, the finest EMD5, predominates in the deepest part of the study area, showing no significant further offshore variations, and is interpreted to represent aeolian dust from the Asian inland.

How to cite: Sim, G., Bahk, J.-J., Jang, J., Kim, H., Jeong, J., and Um, I.-K.: Distinguishing sediment transport modes in the eastern continental margin of the Korean Peninsula through end-member analysis of surface sediment grain-size distributions., EGU General Assembly 2024, Vienna, Austria, 14–19 Apr 2024, EGU24-7149, https://doi.org/10.5194/egusphere-egu24-7149, 2024.

EGU24-7453 | Orals | GM9.6

Integrated 3D Seismic Analysis of Pleistocene Tunnel Valleys and their infills in the German North Sea sector  

Sonja Breuer, Anke Bebiolka, Axel Ehrhardt, Vera Noack, and Jörg Lang

Our research project is dedicated to the development of a comprehensive model for analysing the distribution, dimensions, and evolution of Pleistocene tunnel valleys and their deposits in northern Germany and adjacent areas. The primary objective is to leverage these findings to assess the likelihood of future tunnel-valley formation, with potential implications for the long-term (over the next 1 million years) safety of a radioactive waste repository.

To achieve our goal, we are relying on a 3D seismic dataset. Previously, the mapping of tunnel valleys on land is primarily based on 2D seismic and boreholes, which unfortunately do not provide the required accuracy. Therefore, we have opted to utilize a marine seismic dataset. This 3D seismic dataset 'GeoBasis3D' was acquired by the BGR in 2021.

The 3D seismic dataset is situated within the German Exclusive Economic Zone (EEZ) in the 'Entenschnabel' area. In this region, two intersecting tunnel valleys exist, with one located above the 'Belinda' salt dome. The interpretation of the tunnel-valley base based on the seismic data, and we will observe the influence of the crestal faults above the salt dome on the genesis and filling of the tunnel valley. The filling of the tunnel valleys will be described in terms of seismic facies. Different sedimentary processes can be interpreted from the seismic data. The deepest parts of the tunnel valley are directly filled, and the valley widens above. Some slumping can be detected along the steep slopes of the tunnel valley. Different phases of sedimentation can be observed within the tunnel valley, including both glacifluvial and glacilacustrine phases with parallel and homogenous reflectors. Since there are no available geological cores for the Quaternary in the area of the seismic surveys, we will have to rely on cores from Danish North Sea for the lithostratigraphic description of the sediments and for their chronological classification.

Our aim is to analyse sediment facies to draw conclusions about the backfilling process and repeated erosion phases. This will enable us to compare the findings with the development of onshore tunnel valleys in the next step. The tunnel valleys are a type of glacial erosion that can reach depths of up to 600 meters above sea level in northern Germany. They can have an impact on the long-term safety of a repository, which is required by law to be located at a minimum depth of 300 meters below ground level.

How to cite: Breuer, S., Bebiolka, A., Ehrhardt, A., Noack, V., and Lang, J.: Integrated 3D Seismic Analysis of Pleistocene Tunnel Valleys and their infills in the German North Sea sector , EGU General Assembly 2024, Vienna, Austria, 14–19 Apr 2024, EGU24-7453, https://doi.org/10.5194/egusphere-egu24-7453, 2024.

Taiwan has excellent natural conditions for marine energy development. However, due to the active marine environment and geological processes, submarine geohazards must be carefully assessed before engineering development offshore southeastern Taiwan. Tectonically, it is situated in the oblique collision between the Eurasian Plate and the Philippine Sea Plate with fast exhumation and eroding transportation of sediments. Previous studies suggest that the Southern Longitudinal Trough (SLT) is characterized by a series of backthrusts and slumpings. Considering the rapid erosion and deposition led by extreme events, including typhoons and active tectonics, offshore SE Taiwan is an excellent site to study submarine geomorphology and seafloor instabilities.

After detailed structural and morphological analyses from seismic and bathymetry data, some geological features, faultings, gullies, and submarine canyon systems are recognized, moreover, several sliding scars and slumpings are interpreted from repeated and sequence surveys. It gives us insights into the potential mechanisms of sediment transportation and geological hazards by discussing the structure connections and distribution.

Since the study area has high ocean energy potential, appropriate site selection and development planning based on geological analysis should be carried out before marine industry projects. Whether in marine scientific research, site selection, engineering design, or social and economic development, studying geological processes and seabed stability offshore SE of Taiwan is urgent. Our results could provide a basis for subsequent seabed monitoring and engineering development.

How to cite: Chen, L. and Han, W.-C.: Submarine Geomorphology and Seafloor Instabilities Revealed from Geophysical Data Offshore Southeastern Taiwan, EGU General Assembly 2024, Vienna, Austria, 14–19 Apr 2024, EGU24-7466, https://doi.org/10.5194/egusphere-egu24-7466, 2024.

EGU24-8455 | ECS | Orals | GM9.6

Seismic and core-based glacial sequence stratigraphy of an overdeepened valley fill in northern Switzerland  

Sebastian Schaller, Bennet Schuster, Sarah Beraus, Marius W. Buechi, Hermann Buness, and Flavio S. Anselmetti

In the context of the DOVE (Drilling Overdeepened Alpine Valleys) project, supported by the International Continental Scientific Drilling Program (ICDP), a series of boreholes were drilled into buried overdeepened glacial troughs situated in the northern forelands of the Central and Eastern Alps. The sediments infilled into these troughs provide relatively complete sedimentary records of the Mid- and Late Pleistocene and help to better understand past glaciations, paleoclimate, and landscape evolution. As part of this project, an over 250 meters thick succession of unconsolidated Quaternary lacustrine and glacio-to-glaciofluvial sediments was successfully cored from the Basadingen Trough (ICDP 5068_2, NE Switzerland). This overdeepend trough is located in the NE sector of the former Rhine glacier's foreland lobe and is associated with an SSE-NNW valley system that connects the present-day Thur Valley with the Rhine Valley. This association, absent in the current surface morphology, is believed to have been active solely during the Middle Pleistocene.

The correlation of the core with two lines of high-resolution 2D seismic data (acquired during a pre-drill site survey) directly links seismic facies, the petrophysical data of the core (obtained from MSCL- and wireline-logging), and sedimentological properties. This link allowed us to develop a glacial sequence stratigraphy, based on which the overdeepend valley fill could be grouped into three glacial sequences (S1 – S3), enabling a more detailed reconstruction of the glacial advance and retreat history.

Furthermore, integration of the 2D seismic lines with the local geological information (e.g., drill cores, bedrock map, topography, model of the Quaternary sediment cover) has facilitated the establishment of a three-dimensional model of a segment of the Basadingen Trough. This model visualizes the shape of the initial bedrock incision, the multiphase trough-infill architecture, and the emplacement of fluvial channels overlaying the overdeepend basin. This three-dimensional approach overcomes inherent limitations in two-dimensional representations, providing a more accurate mapping of actual geometries. This study thus contributes to the development of a local glaciation model for the Basadingen Trough and a model of subglacial erosion of overdeepened basins in the northern Alpine foreland.

How to cite: Schaller, S., Schuster, B., Beraus, S., Buechi, M. W., Buness, H., and Anselmetti, F. S.: Seismic and core-based glacial sequence stratigraphy of an overdeepened valley fill in northern Switzerland , EGU General Assembly 2024, Vienna, Austria, 14–19 Apr 2024, EGU24-8455, https://doi.org/10.5194/egusphere-egu24-8455, 2024.

EGU24-8468 | Orals | GM9.6

Examining sedimentological processes in a sublacustrine delta: from underflows to geomorphic changes (Lake Brienz, Switzerland) 

Gaétan Sauter, Damien Bouffard, Koen Blanckaert, Stefano C. Fabbri, Flavio Anselmetti, and Katrina Kremer

Slope failures within subaquatic deltas have the potential to induce underwater mass movements that can be tsunamigenic. Historical cases of subaquatic delta failures have been documented in marine contexts (Anthony & Julian, 1997; Bailey et al., 2021) and lacustrine settings (Girardclos et al., 2007; Hilbe & Anselmetti, 2015). However, the traces and failure planes of these mass movements are rapidly buried due to the high sedimentation rates caused by incoming rivers so that detailed process studies of such failures are challenging.

Given the rise in population near shorelines, there is a need to gain a deeper understanding of this hazard. By monitoring present-day sedimentation processes, we can gain insights into the dynamics of erosion, deposition, and potential slope failures. As lakes are more accessible than marine settings yet share similar sedimentation processes, lacustrine deltas can serve as natural laboratories for any deltaic system.

Our study employs a multi-method approach to monitor sedimentation processes within the Aare Delta of Lake Brienz, situated in a Swiss perialpine lake known for historical delta failures (Girardclos et al., 2007). This approach comprises (i) analyzing bottom currents derived from an Acoustic Doppler Current Profilers (ADCPs) campaign conducted from June to September 2022. These data are compared with river parameters (discharge, temperature, turbidity; from Federal Office of Environment) and meteorological data (rainfall, wind speed, directions; from Federal Office of Meteorology) to evaluate the governing processes of underflows, and (ii) examination of high-resolution bathymetric difference maps derived from two surveys conducted in 2018 and 2023. This assessment seeks to understand geomorphic changes over time and establish connections between these changes and the observed bottom currents.

We show the results of these campaigns that offer valuable insights into sedimentation processes within lacustrine deltas. Repetitive bathymetric surveys highlight substantial geomorphic changes in submerged channels, while ADCPs moored in those areas reveal the presence of underflow currents. Yet, the exact triggers behind these events remain unclear, challenging our understanding of sediment-transport mechanisms within the Aare Delta.

References:

Anthony, E. J., & Julian, M. (1997). The 1979 Var Delta Landslide on the French Riviera: A Retrospective Analysis. Journal of Coastal Research, 13(1), 27-35. http://www.jstor.org/stable/4298587

Bailey, L. P., Clare, M. A., Rosenberger, K. J., Cartigny, M. J. B., Talling, P. J., Paull, C. K., Gwiazda, R., Parsons, D. R., Simmons, S. M., Xu, J., Haigh, I. D., Maier, K. L., McGann, M., & Lundsten, E. (2021). Preconditioning by sediment accumulation can produce powerful turbidity currents without major external triggers. Earth and Planetary Science Letters, 562, 116845. https://doi.org/10.1016/j.epsl.2021.116845

Girardclos, S., Schmidt, O. T., Sturm, M., Ariztegui, D., Pugin, A., & Anselmetti, F. S. (2007). The 1996 AD delta collapse and large turbidite in Lake Brienz. Marine Geology, 241(1), 137‑154. https://doi.org/10.1016/j.margeo.2007.03.011

Hilbe, M., & Anselmetti, F. S. (2015). Mass movement-induced tsunami hazard on perialpine Lake Lucerne (Switzerland): Scenarios and numerical experiments. Pure and Applied Geophysics, 545-568. https://doi.org/10.1007/s00024-014-0907-7

How to cite: Sauter, G., Bouffard, D., Blanckaert, K., Fabbri, S. C., Anselmetti, F., and Kremer, K.: Examining sedimentological processes in a sublacustrine delta: from underflows to geomorphic changes (Lake Brienz, Switzerland), EGU General Assembly 2024, Vienna, Austria, 14–19 Apr 2024, EGU24-8468, https://doi.org/10.5194/egusphere-egu24-8468, 2024.

EGU24-8508 | ECS | Orals | GM9.6

A new fully erosive end-member to the strait depositional model: the importance of strong internal tides and shallow water settings, case of the Rion-Antirion Strait (Greece)  

Basile Caterina, Romain Rubi, Elias Fakiris, Dimitris Christodolou, Xenophon Dimas, Maria Geraga, George Papatheodorou, and Aurélia Ferrari

Straits are crucial in terms of oceanic circulation between basins. Many modern straits are dominated by tidal currents that flow differently than in the connected basins. These tidal currents are shaping the seafloor into complex geometries, alongside sediment sources, tectonic activities and inherited lowstand features. The proposed common tidal strait depositional model comprises a strait centre zone in erosion bounded on both sides by depositional areas with 2D and 3D tidal dunes (known as dune-bedded strait zones). This model does not consider another type of hydrodynamic forcing that can be generated in strait, internal tidal waves. The aim of this study is to evidence the combined effect of tidal currents and internal tides on the morphosedimentary features of the strait seafloor.

We focused here on the Rion-Antirion strait in Greece, connecting the Corinth Gulf with the Ionian Sea. Despite its location in the microtidal Mediterranean context, this 2 km wide and 70 m deep strait is strongly experiencing strong tidal currents. We utilized high-resolution multibeam bathymetry (MBES) covering a 21 km² area to reveal seafloor morphological structures. Swath bathymetric profiles were coupled with chirp sub-bottom and sparker reflection profiles imaging the internal sedimentary structures and with currents data from two ADCP campaigns. To comprehensively assess all the oceanographic parameters, we also incorporated satellite data and ROMS modelling. Consequently, we establish connections between oceanographic circulation, sea bottom dynamics within the strait and Gulf, and the observed sedimentary features.

Typically, in tidal settings, sand deposition occurs when the tidal current velocity drops, usually before the currents change direction, and the existing strait tidal model shows sand dunes. The complex bathymetry features observed in the Rion tidal strait lack dunes but features erosional characteristics such as deep pools and crest morphology, with limited depositional features. In our settings, the numerical model demonstrates that the strait experience strong tidal currents alongside currents associated with the internal tide, which are predominantly out of phase, generating significant turbulences. As a result, there are no periods during which sand can settle. These factors underline the absence of deposition in this case and the need to revise the strait depositional model to incorporate this new end-member.

How to cite: Caterina, B., Rubi, R., Fakiris, E., Christodolou, D., Dimas, X., Geraga, M., Papatheodorou, G., and Ferrari, A.: A new fully erosive end-member to the strait depositional model: the importance of strong internal tides and shallow water settings, case of the Rion-Antirion Strait (Greece) , EGU General Assembly 2024, Vienna, Austria, 14–19 Apr 2024, EGU24-8508, https://doi.org/10.5194/egusphere-egu24-8508, 2024.

EGU24-8780 | Posters on site | GM9.6

Assessing the influence of climate on Antarctic submarine gully evolution   

Jenny Gales, Robert McKay, Laura De Santis, Michele Rebesco, Jan Sverre Laberg, Denise Kulhanek, Molly patterson, Maxine King, and Sookwan Kim

Antarctica’s continental slopes hold invaluable insights for understanding past climate, ice-sheet dynamics, ocean circulation, erosional and depositional processes, and submarine geohazards over millennial timescales. We present a multidisciplinary dataset from the Ross Sea continental margin, Antarctica from the EUROFLEETS-funded ANTSSS expedition and International Ocean Discovery Program Expedition 374, including core records spanning ~3 Ma, multibeam echosounder and single-channel seismic data and legacy seismic data available through the Antarctic Seismic Data Library System. Here, gully and channel systems occur at the head of the Hillary Canyon, with palaeo-gullies evident in seismic data. New sediment core-seismic correlations show that palaeo-gullies evolved on the Ross Sea continental margin over multiple glacial cycles, filling and reforming associated with glacial advances, cold dense water cascading and other processes. We show multidisciplinary datasets that constrain the signature of down and along-slope processes and examine factors driving their timing, frequency, and impact on gully evolution. We discuss the implications of these findings in relation to Neogene and Quaternary West Antarctic Ice Sheet expansions to the shelf edge.

How to cite: Gales, J., McKay, R., De Santis, L., Rebesco, M., Laberg, J. S., Kulhanek, D., patterson, M., King, M., and Kim, S.: Assessing the influence of climate on Antarctic submarine gully evolution  , EGU General Assembly 2024, Vienna, Austria, 14–19 Apr 2024, EGU24-8780, https://doi.org/10.5194/egusphere-egu24-8780, 2024.

Area-wide hydroacoustic mapping in coastal environments is a time-consuming and cumbersome task due to the limited swath width of most devices, especially in shallow waters. At the same time, these environments hold important functions for coastal ecosystems, are subject to intensive anthropogenic use, and are characterized by dynamic and complex geomorphological interactions of waves, currents, and tides. We presently investigate the seafloor geomorphology of a marine protected area in the eastern North Sea based on a combination of own archived hydroacoustic data, hydrographic single-beam survey data, and fishing vessel position data. The research area is located within 12-nautical miles from the coast, covers approx. 1,200km2, and is characterized by water depths between 12 and 18 m. The topography of the seafloor is relatively flat and dominated by mobile sands although gravel and hard substrate (boulder reef) environments commonly occur throughout the area and are protected under the EU Habitats Directive. The properties and spatial distribution of these habitats remain currently unknown, despite the fact that the area hosts intensive fisheries with bottom-contact gears and one of Europe’s largest marine sand extraction sites. Our results show that the integration of different data sources allows an effective assessment of essential habitat parameters, natural seafloor processes, and anthropogenic stressors. Against this background, a strategy to more closely survey and/or monitor specific areas can be devised in order to better protect seafloor habitats and to mitigate human impacts on coastal ecosystems.  

How to cite: Sander, L., Yapa, T., Hoffmann, J., and Saathoff, M.: Ship-based mapping of protected seafloor habitats and anthropogenic stressors in a very shallow coastal environment: Spatial data integration in a marine protected area offshore Sylt (North Sea), EGU General Assembly 2024, Vienna, Austria, 14–19 Apr 2024, EGU24-9300, https://doi.org/10.5194/egusphere-egu24-9300, 2024.

Late Quaternary paleoceanography and hydrography of the Sea of Marmara (SoM) have been extensively investigated because of its key location between the Black Sea and the Mediterranean Sea. Although the hydrography and paleoceanography of the SoM are reasonably known for the MIS 1-MIS 6, our knowledge of the stages is revealing and based on discontinuous seismic records from shelf cores. Integrated three-dimensional paleomorphologic and sedimentary modeling was used to predict the basin architecture and depositional pattern of sedimentary units in SoM.

By unraveling the structure and decompressing the stratigraphy of the targeted stratigraphic unit, we successfully modeled the ancient bathymetry during the MIS1-2 and MIS4-5 transition periods. Over 700 gridded 3.5 kHz high-resolution seismic profiles were processed, revealing distinct reflectors and stratigraphic units separated by reflectors that signify regional unconformities across 12 sediment piston cores, totaling approximately 25 meters in length. Accurate depth-scaling of chronostratigraphic units within cores is crucial for precise sedimentation rate calculations. Aligning seismic profiles with cores involved cross-referencing Multi-Sensor Core-Logger (MSCL) data with seismic reflection coefficients and amplitudes across various stratigraphic layers. Using data from the MSCL, we produced different synthetic seismograms to identify and correct depth-scale inconsistencies caused by mismatches in the upper sedimentary layers in seismic profiles. This technique is centered on synchronizing synthetic seismograms, derived from high-quality physical property logs, with corresponding CHIRP profiles to rectify these discrepancies. Mapping sequence boundaries, delineated by distinct reflection coefficients and amplitude values across the entire gulf area using pseudo-3D seismic data, allowed for comprehensive representation. To model basin evolution, isopach and isochron maps were constructed using a 2-D cubic B-spline interpolation method.

This study transferring the boundaries determined in marine isotopic periods, MIS5-MIS4, from cores to the acoustic environment for the creation of paleo-depth maps has been completed. Sample comparison models have been prepared on profiles taken from Çınarcık Basin towards Tekirdağ Basin for the application of grid interpolation modeling for different basins, using amplitude values from produced synthetic seismograms.

The robust age models derived from these cores, paired with reflectors corresponding to known levels in existing literature, positioned the marine-lacustrine transition at 13.7 k years before present (ka BP) at a water level of -85 meters and at 97.4 ka BP, the transition from marine to terrestrial environment. Using this timeline, we generated multiple maps illustrating paleo-bathymetry, sediment thickness, and mass-flow charts in the different basins, allowing us to simulate the environmental conditions in the SoM during the transitions.

Keywords: Sea of Marmara, Seismic Stratigraphy, Synthetic Seismogram, Age-Depth Modeling, Paleobathymetry Modelling

How to cite: Sabuncu, A., Eriş, K. K., Demirbağ, E., and Vardar, D.: Pre-Holocene Morphobathymetry of Sea of Marmara (SoM) Sedimentary Basins: A Case Study With Precise Correlations Developed by Sediment Cores and HR Seismic Profiles, EGU General Assembly 2024, Vienna, Austria, 14–19 Apr 2024, EGU24-9763, https://doi.org/10.5194/egusphere-egu24-9763, 2024.

EGU24-9993 | ECS | Posters on site | GM9.6

Understanding the paleogeographic evolution of the North Axial Channel, Southern North Sea  

Morgan Vervoort, Despina Kyriakoudi, Ruth Plets, Thomas Mestdagh, Tine Missiaen, and Marc De Batist

During the last 500 000 years, ice sheets occupied parts of the North Sea during three major glaciations. The existence of these ice sheets was accompanied by a large fall in sea level, causing the Southern North Sea to emerge and become isolated from the Atlantic. In this area a complex drainage system was created by river water of the West-European rivers (e.g., Thames, Rhine, Meuse and Scheldt) and glacial meltwater. Furthermore, most offshore studies support the idea of the formation of large proglacial lakes in front of these ice sheets, which may have caused high-magnitude outburst floods at the end of each glacial period. The existence of such a proglacial lake is used in the argument that glacial outburst floods during the Elsterian (500-450 ka) created erosional features still preserved nowadays in the Dover Strait.

A remnant of this large, complex fluvial and glacial drainage system is the (North) Axial Channel, a prominent geomorphological feature seen on the present-day sea floor of the Southern North Sea. Its formation and evolution, however, are still uncertain. Previous studies state that the Axial Channel forms the northern extension of the Lobourg Channel, located in the Strait of Dover, which was formed during Middle Miocene times. Further erosion is assumed to have occurred during the Pliocene and Pleistocene, as sediments within the Murray Pit (located in the Axial Channel, about 100 km northeast of the Lobourg Channel) are assumed to be Early Pliocene, and no Quaternary infilled sediments have been identified. A series of NE-SW oriented scarps are identifiable from bathymetric and seismic reflection data and have been attributed to different Pleistocene incisional events. However, currently only a relative chronology of potential events has been established, with large uncertainties. Understanding the paleogeographic changes that affected the region also increases the knowledge on how early humans may have settled in and/or migrated through the region. 

In the framework of the WALDO project (“Where are All the (proglacial) Lake seDiments in the NOrth Sea Basin?”), a survey has been conducted in October 2023 during which high-resolution geophysical data (multibeam bathymetry and backscatter, acoustic and seismic data) combined with ground-truth data (vibrocores) have been acquired. One of the reflection-seismic grids was conducted ~40 km east of the East of England coast, over the western edge of the North Axial Channel, where also four sediment cores were taken. Here, we present the first interpretation of these new data, which allow us to evaluate, update and improve the relative chronology of the formation of the (North) Axial Channel.  

How to cite: Vervoort, M., Kyriakoudi, D., Plets, R., Mestdagh, T., Missiaen, T., and De Batist, M.: Understanding the paleogeographic evolution of the North Axial Channel, Southern North Sea , EGU General Assembly 2024, Vienna, Austria, 14–19 Apr 2024, EGU24-9993, https://doi.org/10.5194/egusphere-egu24-9993, 2024.

EGU24-10335 | ECS | Posters on site | GM9.6

Exploring the Outline of the Pre-Odra River System Through Seismic Reflection Imaging Offshore Rügen Island 

Maryse C. Schmidt, Christian Hübscher, Elisabeth Seidel, Jonas Preine, and Benedikt Haimerl

Understanding the course and dynamics of ancient river systems, such as the pre-Odra, is crucial for unravelling the geological history of regions like the southern Baltic Sea, providing valuable insights into the post-glacial evolution of landscapes and riverine processes. We will present marine reflection seismic and acoustic data from three research cruises on the research vessel ALKOR that allow us to investigate the pre-Odra river system in the southern Baltic Sea. Our analysis focuses on the region off the east coast of the island Rügen. This region corresponds to the suspected location of the pre-Odra river system, which was situated during the post-glacial phase approximately 9,000 - 14,500 years BP off Rügen. The seismic reflection data indicate that the sediment infill of the pre-Odra is charged by shallow gas of presumably biogenic origin. Since the seismic gas indicators correspond with the pre-Odra where its location has been determined by previous geological studies, we use gas lineaments as a proxy for the braided paleo-river bed. This study refines and extends the known fluvial extent of the Odra river system by 60 km, tracing it north towards the Tromper Wiek, indicating its terminus in the Baltic Sea close to eastern to Rügen.

How to cite: Schmidt, M. C., Hübscher, C., Seidel, E., Preine, J., and Haimerl, B.: Exploring the Outline of the Pre-Odra River System Through Seismic Reflection Imaging Offshore Rügen Island, EGU General Assembly 2024, Vienna, Austria, 14–19 Apr 2024, EGU24-10335, https://doi.org/10.5194/egusphere-egu24-10335, 2024.

EGU24-10619 | ECS | Posters on site | GM9.6

Josephine Submarine Seamount: New Insights from multibeam data and seabed sampling for environmental conditions in the Early Quaternary 

Vasco Carvalho, Pedro Terrinha, Marta Neres, Antje Voelker, Luís Batista, and Marcos Rosa

The Josephine submarine seamount is located in the NE Atlantic Ocean around 470 km west of the coast of mainland Portugal and 500 km northeast of Madeira Island on the vicinity of the Africa-Eurasia plate boundary. With 47 km in length and 10 km in width, it rises 2500 meters above the adjacent abyssal plains, with its top standing at a depth of 170 m. It is a basaltic submarine seamount that yielded ages of 16.3 ± 0.9Ma to 11.7±0.7Ma (Geldmacher et al. 2006).

Multibeam and backscatter data were acquired to increase our knowledge about the seamount. The backscatter data shows the presence of fine sediment on the eroded top of the seamount, not present in the northern part. The top of the seamount dips gently (~1º) to the northwest allowing the deposition of fine grained sediment down to ~500 m where the seafloor is irregular with slopes dipping between 10⁰ and 15⁰ and the igneous rocks crop out.

Morphologic analysis suggests that the very flat and smooth surface of the southernmost portion of Josephine Seamount has been above sea level and subjected to near coastal erosive processes of areas lying at ~420 m depth. Since the sea level of the last 15 Ma has not been lower than 160 m of the present-day levels (Miller et al. 2020), tectonic and/or erosional processes must have lowered the seamount’s height by at least 260 meters.

Sedimentary rocks were dredged from depths from 480 to 347 m, on the southeastern part of the Josephine seamount and were analyzed for their shape, composition and sedimentary facies. The dredged samples are calciclastic limestone blocks that have a half horn torus shape (donut). Most of the specimens are trespassed by a 3 to 5 cm long conical cavity that developed from the base to the top of each sample.

The rocks consist of 96.6% of foraminifera tests (82.4% planktic and 17.6% benthic), with a very low mineral content. The grains are diagenetically cemented by a calcite matrix (confirmed by EDS analysis). The presence of the planktonic foraminifera species Globorotalia truncatulinoides, whose first occurrence dates of 1.93 Ma (Wade et al., 2011), provides a maximum age of formation, making these sedimentary rocks at least 10 Ma younger than the volcanic rocks that constitute the Josephine Seamount basement. The presence of the benthic foraminifera Lobatula lobatula and Discanomalina semipunctata indicate strong currents that could have contributed to the erosion of the seamount’s top.

This work was funded by the Portuguese Fundação para a Ciência e a Tecnologia (FCT) I.P./MCTES through national funds through the project LISA (https://doi.org/10.54499/PTDC/CTA-GEF/1666/2020).

How to cite: Carvalho, V., Terrinha, P., Neres, M., Voelker, A., Batista, L., and Rosa, M.: Josephine Submarine Seamount: New Insights from multibeam data and seabed sampling for environmental conditions in the Early Quaternary, EGU General Assembly 2024, Vienna, Austria, 14–19 Apr 2024, EGU24-10619, https://doi.org/10.5194/egusphere-egu24-10619, 2024.

EGU24-10732 | ECS | Posters on site | GM9.6

Imaging the Plio-Quaternary submarine geomorphological evolution of the Gulf of Cagliari 

Maria Cristina Caradonna, Anna Del Ben, Riccardo Geletti, Gian Andrea Pini, Veronica Frisicchio, Gemma Ercilla, and Ferran Estrada

Based on the morpho–bathymetric data coming from the MaGIC project (Marine Geohazards along the Italian Coast) and the high-resolution seismic reflection profiles acquired in 2010 by OGS-Explora, we depict the complex geomorphology of the Gulf of Cagliari and the evolution of the most striking morphosedimentary features developed during the PQ. The seafloor is shaped by the canyon system, the Sarroch and S. Elia-Foxy canyons. The obtained results point that their onset and location do not coincide with paleoincisions formed by the Messinian erosion. The main pathway changes of the Sarroch canyon are conditioned by extensional tectonics of the Campidano Graben and are controlled by the Banghittu High. Cut-and-fill features and infill deposits indicate that retrogressive erosive processes affect the canyon heads and produce landslides. transport deposits in the basin. In fact, four large MTD's have been recognized and analysed within the PQ sequence. They show different seismic facies, from transparent to chaotic, and are locally affected by internal deformational structures which allow us to distinguish the translational and compressional domains. The interplay between the morphosedimentary evolution of the systems canyons and the MTDs are useful to understanding the role played by the downslope channelized and non-channelized sedimentary processes over time and to explore the factors, local and/or global, controlling their occurrence and/or predominance. This analysis of the submarine canyon morphologies and occurrence of MTDs can help evaluate the potential geo-hazard implications of the region.

How to cite: Caradonna, M. C., Del Ben, A., Geletti, R., Pini, G. A., Frisicchio, V., Ercilla, G., and Estrada, F.: Imaging the Plio-Quaternary submarine geomorphological evolution of the Gulf of Cagliari, EGU General Assembly 2024, Vienna, Austria, 14–19 Apr 2024, EGU24-10732, https://doi.org/10.5194/egusphere-egu24-10732, 2024.

EGU24-10857 | Posters on site | GM9.6

Assessing the dynamics of turbiditic terminal lobes: a geometrical approach 

Jean-Louis Grimaud, Louison Mercier, Fabien Ors, and Damien Huyghe

Terminal lobes constitute the endmembers of siliciclastic systems. They are of great interest to marine geologists and constitute high-quality reservoirs actively sought out and exploited by the oil and gas industry. The sizes and shapes of lobes vary depending on the type of sedimentary system and the nature of associated gravity flows. Sea bottom topography -induced either by preexisting lobes or mass transport deposition or tectonic deformation- is another important factor controlling lobe morphology. Previous studies carried out on recent systems (based on multibeam bathymetry and 2D/3D seismic data) show different shapes, classically characterized as lobate, but also radial or elongated. Currently, much remains to be known on the relative influences of autocyclic and allocyclic forcings on the internal architecture of lobes.

This study focuses on a better definition of lobe shapes in natural systems to build a ruled -based model of lobes that will later be incorporated into the FLUMY© software. To this end, a database is built based on cases from the literature in various systems (e.g., the Congo, Amazon, Indonesia and East Corsica). We use the classical shape ratios defined by Prélat et al. (2010) as well as a new metric, called the progradation factor (PF), defined as the length ratio between the upstream and downstream segments of lobes (i.e., with respect to their centroids).

Measures of PF were applied at different scales from the bed element to the lobe complex. Independently of the sedimentary system type, three different shapes of lobate bodies were identified: (i) a “classical” lobate shape -wider downstream- when PF > 1.15, (ii) lobes that are wider upstream when PF < 0.85 and, (iii) an elliptical shape when 0.85 ≤ PF ≤1.15. The classical lobate shape is interpreted as marking the absence of topographic confinement. Elliptical lobes occur mainly during maximum and minimum of progradation/retrogradation cycles. Lobes that are wider upstream result from topographic confinement and are mainly deposited at the end of retrogradation cycles. Finally, plotting thickness vs area allows identifying semi-confined lobes as a third category located between confined and unconfined lobes. This category follows a linear trend and exhibits a minimum thickness of 20 m.

How to cite: Grimaud, J.-L., Mercier, L., Ors, F., and Huyghe, D.: Assessing the dynamics of turbiditic terminal lobes: a geometrical approach, EGU General Assembly 2024, Vienna, Austria, 14–19 Apr 2024, EGU24-10857, https://doi.org/10.5194/egusphere-egu24-10857, 2024.

EGU24-10932 | ECS | Posters on site | GM9.6

Glacial seismic geomorphology offshore northwest Europe 

Andrew Newton, Alexandr Montelli, Christine Batchelor, Benjamin Bellwald, Rachel Harding, Mads Huuse, Julian Dowdeswell, Dag Ottesen, Ståle Johansen, and Sverre Planke

Plio-Pleistocene records of ice-rafted detritus suggest that northwest European ice sheets regularly advanced across palaeo-coastlines. However, while these records are important, they provide only a limited insight on the frequency, extent, and dynamics of the ice sheets that were delivering the detritus. Three-dimensional reflection seismic data of the northwest European glaciated margin have previously documented buried glacial landforms that inform us on these uncertainties. This work combines existing landform records with new seismic geomorphological observations to catalogue landform occurrence along the European glaciated margin and considers how these features relate to ice sheet history. The compilation shows that Early Pleistocene ice sheets regularly advanced onto and across the continental shelves. This is important because Early Pleistocene sea level reconstructions show lower magnitude fluctuations between glacial-interglacial cycles than when compared to the Middle-Late Pleistocene. The potential for more extensive and more frequent Early Pleistocene glaciation provides a possible mismatch with these sea level reconstructions. This evidence is considered with global records of glaciation to contemplate the possible impacts on our wider understanding of Plio-Pleistocene climate changes, in particular how well Early Pleistocene sea level records capture ice sheet volume changes and how quickly large ice sheets waxed and waned. Resolving such issues relies on how well landforms are dated, whether they can be correlated with other proxy datasets of environmental change, and how accurately these proxies reconstruct the magnitudes of past climatic changes. The results leave many more questions about Pleistocene glaciation in Europe unresolved, with significant impacts on our global understanding of how sea level evolved through the Pleistocene and its association with ice sheet development.

How to cite: Newton, A., Montelli, A., Batchelor, C., Bellwald, B., Harding, R., Huuse, M., Dowdeswell, J., Ottesen, D., Johansen, S., and Planke, S.: Glacial seismic geomorphology offshore northwest Europe, EGU General Assembly 2024, Vienna, Austria, 14–19 Apr 2024, EGU24-10932, https://doi.org/10.5194/egusphere-egu24-10932, 2024.

EGU24-11305 | ECS | Posters on site | GM9.6

Plio-Quaternary geological events in the Western Mediterranean Sea: focus on the West Sardinian margin and adjacent oceanic basin 

Veronica Frisicchio, Anna Del Ben, Riccardo Geletti, Maria Cristina Caradonna, Michele Rebesco, and Massimo Bellucci

The Plio-Quaternary sedimentary deposition in the Western Mediterranean Sea was strongly influenced by the Messinian Salinity Crisis (MSC) and by the consequences of the oceanic opening that produced regional fault systems and the following thermal subsidence, still largely active during the Plio-Quaternary (PQ). We analyse the PQ events that occurred in the West Sardinian margin and in the adjacent deep basin by integrating vintage and more recently acquired seismic data, obtaining the currently most complete regional seismic grid in the study area. The base of the PQ (“Ms” reflector) represents the top of the Messinian evaporites in the lower slope and deep basin and the Messinian erosional truncation in the continental upper slope and shelf. Two units have been recognized within the PQ sequence: the low amplitude lower Plio-Quaternary unit (l-PQ) and the high amplitude upper Plio-Quaternary unit (u-PQ), separated by the “A0” reflector, for which we assume an age of 2.6 My (near Quaternary base), through the correlation with the published ECORS profile.

The thermal subsidence, related to the Oligo-Miocene (OM) oceanic opening, produced the increased inclination of the slope and, coupled with the halokinetics of Messinian evaporites, triggered most of the geological processes in the study area. In the lower continental slope, rollover structures are produced by salt sliding, which is related to the increased deepening of the slope, while in the deep basin typical sub-vertical faults developed above the salt diapirs: these processes, that continued throughout the entire PQ slowing down in the Quaternary, influence the thickness and distribution of the PQ sequence. Faults usually act as a preferential path for magma upwelling and gas rising: fault systems developed during the OM produced some large volcanoes at the boundary between slope and deep basin, while on the continental shelf and upper slope the main volcanic buildings are ascribed to the later Pliocene magmatic phase and are related to fault reactivation caused by the PQ thermal subsidence. On the tilted continental outer shelf, OM faults reactivation led to gas rising phenomena and related pockmarks, generated from the Early Pliocene until Present. During the Quaternary, the accentuated tilting of the continental slope triggered erosional processes that led to the formation of three new canyon systems, not inherited by the Messinian erosion as often hypothesized; at the same time, erosion of the onshore area led to a high sediment supply, responsible for the widening of the clinoforms on the inner shelf. In this study we analyse the evolution of the different PQ process that affected the West Sardinian margin and their relationships with previous regional events occurred in all the West Mediterranean Sea: the objective is to create basic information to subsequently compare with other passive margins of the sea.

How to cite: Frisicchio, V., Del Ben, A., Geletti, R., Caradonna, M. C., Rebesco, M., and Bellucci, M.: Plio-Quaternary geological events in the Western Mediterranean Sea: focus on the West Sardinian margin and adjacent oceanic basin, EGU General Assembly 2024, Vienna, Austria, 14–19 Apr 2024, EGU24-11305, https://doi.org/10.5194/egusphere-egu24-11305, 2024.

EGU24-12684 | ECS | Posters on site | GM9.6

Deciphering the origin of sediment waves along the Northwest African margin through multidisciplinary analysis 

Rebecca Englert, Christoph Boettner, Peter Brandt, Matthieu Cartigny, Hao Huang, Gerd Krahmann, Pere Puig, Mischa Schoenke, Christopher Stevenson, Peter Talling, and Sebastian Krastel

Sediment waves are widely observed on the seafloor in a variety of marine environments (e.g., open slope, submarine channels, levees). They are important for understanding marine hazards because they can influence slope stability and be indicators of currents capable of damaging seafloor infrastructure (e.g., telecommunication cables). However, sediment wave dynamics may vary in different settings and several mechanisms have been invoked to explain their formation including gravity-driven (sediment failure, turbidity currents) and oceanographic (bottom currents, internal tides) processes. In this study, we investigate the generation of large unconfined sediment wave fields along the continental slope of the Northwest African margin using an integrated dataset acquired on the R/V Maria S. Merian cruise MSM113. Data collection included direct monitoring of ocean currents and water column properties over sediment wave fields by CTD casts, acoustic water column profiling, and deployment of short-term moorings equipped with velocity (ADCPs), temperature, salinity, and turbidity sensors. Additional datasets such as shallow and multichannel 2D seismic profiles, multibeam bathymetry, gravity cores, and box cores capture the geomorphic, subsurface, and sedimentary characteristics of the seafloor features. Sediment wave fields occur on the mid-lower slope between 600 – 1900 m water depths and are intersected by straight channels up to 2 km wide and 300 m deep. Individual waves have slope-parallel crests, wavelengths between 400 – 2000 m, and wave heights between 6 – 56 m. In subsurface seismic profiles, sediment waves are composed of upslope-stacking reflectors that indicate preferential deposition on their stoss slopes and upslope crest migration. Sediment cores from sediment waves are predominantly composed of bioturbated gradational sequences of mud, sandy mud, muddy sand, and sand that vary depending on location, suggesting a progressive process of differential sedimentation. Intermittent chaotic muddy deposits and sharp-based sand layers represent occasional punctuated flow events. Time series from moored instruments are dominated by strong semidiurnal tidal fluctuations with current velocities up to 0.3 m/s. Water column measurements and acoustic images reveal a stratified water column with wavy interfaces and small-scale fluctuations caused by the passage of internal waves. Collectively, these findings suggest that downslope gravity flows, along-slope currents, and internal tides contribute to sediment transport along the Northwest African margin; although, tide-topographic interactions are the most likely candidate for maintaining sediment waves. Our integrated analysis provides insight into oceanographic processes, which shape the seafloor and transport sediment along ocean margins.

How to cite: Englert, R., Boettner, C., Brandt, P., Cartigny, M., Huang, H., Krahmann, G., Puig, P., Schoenke, M., Stevenson, C., Talling, P., and Krastel, S.: Deciphering the origin of sediment waves along the Northwest African margin through multidisciplinary analysis, EGU General Assembly 2024, Vienna, Austria, 14–19 Apr 2024, EGU24-12684, https://doi.org/10.5194/egusphere-egu24-12684, 2024.

EGU24-13887 | ECS | Orals | GM9.6

Forward seismic modelling, a tool for the prediction of offshore sedimentary architectures. Application to the Roussillon Basin's Pliocene land-see prism (Gulf of Lion, France). 

Teddy Widemann, Eric Lasseur, Johanna Lofi, Benoît Issautier, Carine Grélaud, Serge Berné, Philippe A. Pezard, and Yvan Caballero

The prediction of offshore sedimentary architectures is a first plan approach to the geological study of continental margins. While such work is commonly led using seismic surveys tied to well-logs, we are interested in land-sea objects for which there is no direct tie between seismic signal and lithology. More precisely, we look at shoreline clinoforms and more continental deposits of which size is below used seismic resolution, and their integration at the shelf-scale. The Roussillon Basin’s Pliocene infill satisfies these criteria. It belongs to a progradational land-sea prism about 100km-long, displaying essentially clinothems and defining the Gulf of Lion modern shelf. It is described with high quality conventional seismic profiles offshore, while outcrops and drill-cores are available onshore. However, there is no data at the transition between the two domains.

In order to predict the offshore sedimentary architecture, we establish classical equivalence hypotheses between seismic facies and expected associated sedimentary facies. This work is based on the seismic facies interpretation and on the lithologies known from outcrops and onshore drillings.

Nonetheless, without directly tied-in seismic such hypotheses rely essentially on interpretation. This, together with seismic data vertical resolution (~15m in thickness) and the upscaling from direct observations onshore, introduce uncertainties.

In order to produce more reliable sedimentary predictions, we test our hypotheses through forward seismic modelling using SeisRoX pro by NORSAR. We create small scale geological/impedance models based on onshore sedimentary observations coupled with well-logs petrophysical data (P-wave velocities). Then we simulate acoustic waves propagation through them and obtain theoretical seismic profiles that are subsequently compared to the seismic data.

This method, including a geophysical control, allows for the testing of various geological hypothesis at the outcrop-scale, and for a more objective subsurface description.

Among the results, we show that vertical velocity variations at a meter scale eventually get a specific seismic signature in terms of both geometry and amplitude on conventional seismic profiles. More generally, we illustrate different lithological models and their results, which allow for a high-resolution reconstruction of most parts of the Roussillon Basin’s Pliocene offshore prism.

How to cite: Widemann, T., Lasseur, E., Lofi, J., Issautier, B., Grélaud, C., Berné, S., Pezard, P. A., and Caballero, Y.: Forward seismic modelling, a tool for the prediction of offshore sedimentary architectures. Application to the Roussillon Basin's Pliocene land-see prism (Gulf of Lion, France)., EGU General Assembly 2024, Vienna, Austria, 14–19 Apr 2024, EGU24-13887, https://doi.org/10.5194/egusphere-egu24-13887, 2024.

Offshore wind projects benefit immensely from a good understanding of the seafloor. Together with the sub-bottom geology and geotechnical properties as well as geohazards and physical hazards, the seafloor conditions can be integrated in ground models and hazard maps as part of a holistic offshore wind site characterization, that enables successful wind farm development and reliable power production.

A full understanding of the seafloor requires “seafloor reading skills”: appropriate data mining, utilization, and interpretation. The seafloor is full of geological, environmental, and anthropogenic features which may affect a wind farm during its lifecycle, such as boulders, mobile sediment, escarpments/faults, wrecks, UXO, cables, seabed habitats and much more. However, when understood properly, we can comprehend the seabed conditions and processes and handle the different challenges at the seabed from installation to production, affecting e.g., foundation feasibility and HSE.

Sørlige Nordsjø II is an envisaged offshore wind site in the southern Norwegian North Sea. Following a multi-method approach, we utilized different geological and geophysical data, such as MBES bathymetry and backscatter, side scan sonar data, boreholes and vibrocores, sub-bottom profiler data, and 2DUHR seismic.

Key results that were achieved include:

  • Detailed seafloor lithology map: Differentiation between different sand facies and glacial lag deposits.
  • Understanding of sediment mobility: Sand waves and megaripples mapped; bedforms, grain size variations and anthropogenic features linked to zones of erosion, transport, and deposition.
  • Determination of boulder locations: Boulder fields and individual boulders mapped; size of boulders determined to mostly up to 3 m.
  • Update of cable and wreck positions, by utilizing backscatter and side scan sonar images, and magnetic anomalies.

We were able to pull out deep knowledge from the available data, to bring it in a coherent order and provide a holistic understanding of the site’s seafloor. This is a major step towards the aim of making informed cost-saving decisions throughout the offshore wind lifecycle.

How to cite: Gehrmann, A. and Lekens, W.: How to read the seafloor and the importance to offshore wind projects. Examples from Sørlige Nordsjø II, Norwegian North Sea, EGU General Assembly 2024, Vienna, Austria, 14–19 Apr 2024, EGU24-15545, https://doi.org/10.5194/egusphere-egu24-15545, 2024.

EGU24-15710 | ECS | Orals | GM9.6

New insight into the Evolution of the Jasmund Glacitectonic Complex from Seismic Mapping of Glacial Erosion Unconformity East of Rügen (SW Baltic Sea) 

Benedikt Haimerl, Elisabeth Seidel, Anna Gehrmann, Jonas Preine, Maryse C. Schmidt, and Christian Hübscher

The Jasmund Glacitectonic Complex (JGC) on the island of Rügen (NE Germany) is a key area where the interplay between glaciation, erosion and tectonics can be studied. Previous reconstructions are based on land-based and outcrop studies. Here, we use 148 high-resolution multi-channel seismic reflection profiles from several cruises of the University of Hamburg with RV ALKOR as well as adjacent borehole data to decipher the offshore extent of the JGC. The seismic data image erosional channels and depressions as well as moraines, which delineate the mainly southwestward directed Weichselian glacier movement. The depth of the erosional surface at around 100 m correlates with the previously modelled décollement depth. Furthermore, these results suggest a continuation of the observed glacial features onshore, highlighting the connection between the marine and terrestrial features of the JGC. Our investigations suggest that the complex evolution of the JGC is not due to three distinct ice streams, as proposed by previous studies. Instead, our data suggest that a single southwestward ice flow, which splits northeast of Jasmund, is responsible for the three-phase evolution. During the formation of the northern and eastern subcomplexes, the Cretaceous sediments were overthrusted almost perpendicular to the ice movement. In the southern subcomplex, however, the overthrusting was caused by the lateral pressure of the ice flow passing south of Jasmund. This study provides a methodological blueprint for the study of similar glacitectonic complexes elsewhere.

How to cite: Haimerl, B., Seidel, E., Gehrmann, A., Preine, J., Schmidt, M. C., and Hübscher, C.: New insight into the Evolution of the Jasmund Glacitectonic Complex from Seismic Mapping of Glacial Erosion Unconformity East of Rügen (SW Baltic Sea), EGU General Assembly 2024, Vienna, Austria, 14–19 Apr 2024, EGU24-15710, https://doi.org/10.5194/egusphere-egu24-15710, 2024.

EGU24-16357 | ECS | Posters on site | GM9.6

Present-day current activity in an inactive canyon-channel system: the Gollum Channel System offshore southwest Ireland. 

Lotte Verweirder, David Van Rooij, Fred Fourie, Kobus Langedock, Martin White, and Aggeliki Georgiopoulou

The Gollum Channel System is a land-detached large-scale canyon-channel system situated offshore southwest Ireland on the Northeast Atlantic margin. The system is considered to have been inactive since the Last Glacial Maximum (LGM), but newly acquired geophysical seafloor and shallow subsurface data do suggest recent activity. To test the hypothesis of present-day (in)activity, high-resolution side-scan sonar, photography and bathymetry data were collected using an AUV in the upper slope (350-1000 m water depth) section of two of the channels. These data are presented alongside current meter data from a mooring station in one of the channels, which were used for quantification and validation of the AUV results. The presence of current ripples on the channel floor indicates that bottom currents acting here are capable of the (re)distribution of sediments. Additionally, some features in the AUV data are interpreted as patches of cold-water corals that depend on nutrient influx as well as a hard enough substrate to grow on, both of which may be promoted by bottom current activity. The current meter data show bottom currents had an average velocity of 15.1 cm/s and reached a maximum of 53.7 cm/s during the measurement period. Therefore, collectively, these datasets allow interpretation of the channel floor features visible within the AUV data with respect to the current regimes they represent, and vice versa. At present, bottom current activity seems prevalent in the channels, while activity from gravity flows has not been observed.

How to cite: Verweirder, L., Van Rooij, D., Fourie, F., Langedock, K., White, M., and Georgiopoulou, A.: Present-day current activity in an inactive canyon-channel system: the Gollum Channel System offshore southwest Ireland., EGU General Assembly 2024, Vienna, Austria, 14–19 Apr 2024, EGU24-16357, https://doi.org/10.5194/egusphere-egu24-16357, 2024.

EGU24-16490 | Orals | GM9.6 | Highlight

A decade of multibeam bathymetric mapping: Implications and lessons learned from (peri-)Alpine lakes in Switzerland 

Katrina Kremer, Stefano Fabbri, Michael Hilbe, and Flavio S. Anselmetti

Studying the morphology of the landscape is crucial for understanding the processes that shape the Earth’s surface. In subaqueous environments, where direct observations are challenging, bathymetry-derived terrain models are the fundamental form of geomorphological data. Over a century ago, Switzerland initiated systematic bathymetric surveys under the federal "Siegfried Map" project, marking an effort to explore the subaquatic morphology of perialpine lakes. These early studies laid the groundwork for subsequent research on the subaqueous landscape in Switzerland. The early bathymetric surveys in Switzerland focused on documenting the general shape of deep basins and discovering features on lake floors such as channel levee complexes and sublacustrine moraine ridges. These observations formed the basis for early theories on the age of the last glaciation and the existence of turbidity currents in lakes.

Recent advances in multibeam swath bathymetry systems combined with differential GNSS location services dramatically improved survey efficiency as well as spatial and vertical resolution by several magnitudes, generating new findings with every surveyed lake. Apart from the reconnaissance of the overall basin shape, the detailed geomorphologic mapping led to the discovery of various subaquatic features, such as landslides and rockfalls, glacial features, pockmarks, channel and canyon systems, fault structures, and prehistoric and historic human impact. These findings had significant implications for evaluating natural hazards caused by earthquakes, floods, and tsunamis. Detailed glacial imprints became suddenly visible in high-alpine proglacial lakes, revealing the recessional behavior of glaciers. Mapping the source area of mass movements on the lake’s slopes represents the base for understanding lacustrine tsunamis and their modeling. Subaquatic canyons of deltaic systems often extend further into deeper waters than anticipated, promoting accelerated transport of coarse-grained sediments into the deepest parts, typical target areas for major drilling campaigns. Submerged traces of prehistoric settlements revealed unexpected chapters of human activities. Therefore, no drilling effort should be planned without a detailed lake floor map.

In this contribution, we will outline lessons learned from these surveys of 22 lake systems across Switzerland since 2007, summarize key findings, and review the implications of the technology on the limnogeological community. We will also glimpse the future and explore what to expect from ongoing 4D-bathymetric mapping campaigns.

How to cite: Kremer, K., Fabbri, S., Hilbe, M., and Anselmetti, F. S.: A decade of multibeam bathymetric mapping: Implications and lessons learned from (peri-)Alpine lakes in Switzerland, EGU General Assembly 2024, Vienna, Austria, 14–19 Apr 2024, EGU24-16490, https://doi.org/10.5194/egusphere-egu24-16490, 2024.

EGU24-17529 | Posters on site | GM9.6

A glimpse below the wine-dark sea: Multi-beam bathymetric survey around Despotiko and Strongylo islands (Cyclades, Greece) 

Erwin Heine, Erich Draganits, Dimitris Sakellariou, and Ioannis Morfis

Our understanding and knowledge about Earth´s surface and processes benefitted greatly from the increasing availability of open accessible, large-scale remote sensing topographic data, including GTOPO30 (c. 1 km, 1996), ASTER (c. 30 m, 2009), SRTM 3.0 (c. 30 m, 2014) and TanDEM-X (c. 12 m, 2014). In comparison, the documentation of the sea floor at higher resolutions and/or its accessibility is scarce (e.g. https://emodnet.ec.europa.eu/en/bathymetry, https://www.ngdc.noaa.gov/mgg/bathymetry/lidar.html, Otero & Mytilineou 2022) and vast submarine areas are still a terra incognita. We have carried out a preliminary multi-beam bathymetric survey during 29-31 May 2023 with the 13.4 m research vessel “Alkyon” of the Hellenic Centre for Marine Research, funded by the Cheops Privatstiftung Wien and the Walter Munk Foundation for the Oceans (https://www.waltermunkfoundation.org). The Alkyon was equipped with a hull-mount Teledyne Reson T-50R multibeam echosounder. In total, an area of 26.8 km2 was surveyed west, south and east of Strongylo Island, south of Despotiko Island up to Cape Petalida at the southern tip of Antiparos and especially the Bay of Despotiko, between Despotiko and Antiparos islands with measured depth ranging between -6.7m to -105.7 m below sea-level. The survey aims include the (i) high-resolution documentation of this previously unknown sea-floor, (ii) information concerning local sea-level rise (see Lykousis 2009, Kolaiti & Mourtzas 2020, 2023), (iii) the possible continuation of tectonic features as well as coastal mass-movements investigated above sea-level. Processing and thorough geomorphological analysis of the high resolution bathymetric data provide valuable information on the extend of posidonia meadows on the seafloor  (e.g. Despotiko Bay), evidence for possible palaeo-sealevel indicators (palaeo-coastlines, wave-cut terraces) at various depths, palaeo-valleys and other geomorphological features belonging to the terrestrial landscape that was drowned during the post-glacial sea-level rise, as well as several deposits associated with the mass movements mapped on the adjacent rocky slopes of Strongylo, Despotiko and South Antiparos islands. Marine geological-geophysical research will be continued and complimented with high resolution sub-bottom profiling data and visual observation to unravel the recent geomorphological evolution of the survey area.

Kolaiti, E. & Mourtzas, N. 2020. New insights on the relative sea level changes during the Late Holocene along the coast of Paros Island and the northern Cyclades (Greece). Annals of Geophysics, 63(6), https://doi.org/10.4401/ag-8504

Kolaiti, E. & Mourtzas, N. 2023. Late Holocene relative sea-level changes and coastal landscape readings in the island group of Mykonos, Delos, and Rheneia (Cyclades, Greece). Mediterranean Geoscience Reviews, 5, 99-128. https://doi.org/10.1007/s42990-023-00104-4

Lykousis, V. 2009. Sea-level changes and shelf break prograding sequences during the last 400 ka in the Aegean margins: Subsidence rates and palaeogeographic implications. Continental Shelf Research, 29(16), 2037-2044.

Otero, M. & Mytilineou, C. (eds.) 2022. Deep-sea Atlas of the Eastern Mediterranean Sea: Current knowledge. IUCN-HCMR DeepEastMed Project. IUCN Gland, Málaga, 371 p. https://uicnmed.org/docs/deep-sea-eastern-med/DEEP-SEA-EASTERN-MEDITERRANEAN.pdf

How to cite: Heine, E., Draganits, E., Sakellariou, D., and Morfis, I.: A glimpse below the wine-dark sea: Multi-beam bathymetric survey around Despotiko and Strongylo islands (Cyclades, Greece), EGU General Assembly 2024, Vienna, Austria, 14–19 Apr 2024, EGU24-17529, https://doi.org/10.5194/egusphere-egu24-17529, 2024.

EGU24-18223 | ECS | Orals | GM9.6

Investigation of sedimentary structures associated with the Deep Western Boundary Current in French Guiana (Demerara Plateau) 

Paul Blin, Lies Loncke, Xavier Durrieu de Madron, Pauline Dupont, Ivane Pairaud, Sébastien Zaragosi, Kelly Fauquembergue, Christophe Basile, and Scientific team Diadem

The Demerara Plateau in the Equatorial Atlantic is a transform marginal plateau (TMP) where the Deep Western Boundary Current (DWBC) transports North Atlantic Deep Water (NADW) to the South Atlantic. This current, circulating in the depth between 1300 and 3500 m, represents the deep part of the thermohaline circulation. It also forms hundreds of sedimentary structures along its path, looking like giant flute-casts and called 'comets’. Those comets can reach 3 km in length and theses field of 'comets' more than ten kilometers large. Nautile dives, AUV acquisitions (equipped with Multibeam Sounder SMF, Doppler current meter ADCP, Sediment Sounder) and a mooring, implemented during the DIADEM campaign (N/O Pourquoi Pas?, January-February 2023, DOI : 10.17600/18000672), first allow to document the dynamics of the current DWBC in this equatorial domain, its spatial and temporal variability. Furthermore, investigated the numerous associated sedimentary systems associated with this current, as the "comets" forming giant erosion structures. Two AUV bathymetric surveys and four Nautile dives have helped to better understand the location of these hydrodynamic structures. They are located along outcrops of intensely tilted and fractured carbonated rock, probably associated with an ancient sliding mass. Nautile data coupled with photogrammetry are also used to reconstruct the outcrops of these carbonate blocks and to characterize their deformation. AUV ADCP data (hydrodynamics) acquired in parallel highlight the difference in current intensity between the comet head, where the current has a much greater magnitude than in the comet tail, which appears more sedimented. Measurements of currents and turbidity recorded at the mooring deployed upstream of the comet over 17 days of recordings clearly demonstrate the effect of the semidiurnal tide in the high-frequency variability of currents and sediment resuspension. Taken together, these geomorphological, oceanographic and sedimentary parameters provide a clearer picture of those complex seafloor sedimentary structures that seem to result from the interaction of the DWBC with remobilized carbonated outcrops. Our observations also suggest that those comets initially formed under higher hydrodynamic conditions than those recorded today.

How to cite: Blin, P., Loncke, L., Durrieu de Madron, X., Dupont, P., Pairaud, I., Zaragosi, S., Fauquembergue, K., Basile, C., and Diadem, S. T.: Investigation of sedimentary structures associated with the Deep Western Boundary Current in French Guiana (Demerara Plateau), EGU General Assembly 2024, Vienna, Austria, 14–19 Apr 2024, EGU24-18223, https://doi.org/10.5194/egusphere-egu24-18223, 2024.

EGU24-19123 | Orals | GM9.6

Results of high-resolution acoustic studies in Eastern Gulf of Finland 

Leonid Budanov, Alexander Sergeev, Alexander Chekulaev, Igor Neevin, Vladimir Zhamoida, and Daria Ryabchuk

Studies were carried out in three key areas in the eastern Gulf of Finland during joint cruises of the A.P. Karpinsky Russian Geological Research Institute and the Shirshov Institute of Oceanology of the Russian Academy of Sciences in 2023. Multibeam echosounding, sub-bottom profiling, and various sediment sampling techniques were performed, and a significant amount of new geological and geophysical data was collected. Analyses of seismic sections, supported by sediment sampling data and a digital elevation model (DEM) of the sea floor, allowed for the revelation of six acoustic unions (AU) which are divided by reflecting interfaces and have unique acoustic waveforms. The sediments of the AUs were developed in different stages of deglaciation and in the postglacial period of the Late Pleistocene - Holocene. A complex analysis of collected and archived data allowed for the construction of DEMs of buried paleo-relief surfaces. Both the sea floor and paleo-relief DEMs allowed for the mapping and discovery of geomorphological features of landforms specific to the study area, such as submerged end moraine, drumlins, eskers, De Geer, etc. The studies provide new data on the Gulf of Finland basin deglaciation and establish sedimentological processes, features, and the impact of exogenous processes on the geological environment.

How to cite: Budanov, L., Sergeev, A., Chekulaev, A., Neevin, I., Zhamoida, V., and Ryabchuk, D.: Results of high-resolution acoustic studies in Eastern Gulf of Finland, EGU General Assembly 2024, Vienna, Austria, 14–19 Apr 2024, EGU24-19123, https://doi.org/10.5194/egusphere-egu24-19123, 2024.

EGU24-19617 | ECS | Orals | GM9.6

The Zabargad Fracture Zone and Mabahiss Deep, Northern Red Sea: new insights from new high-resolution bathymetric mapping 

Margherita Fittipaldi, Adrien Moulin, Daniele Trippanera, Nico Augustin, Froukje van der Zwan, Laura Parisi, and Sigurjon Jonsson

The Red Sea axis hosts an oceanic ultra-slow spreading ridge which is generally arranged into right-stepping segments. The largest apparent ridge offset runs at the transition between the northern and central Red Sea, amounts to ~ 100 km along a N-S trend, and is referred as to the Zabargad Fracture Zone (ZFZ). The ZFZ separates ridge segments characterized by exposed oceanic crust (the Mabahiss “Deep” in the north and the central Red Sea further south), but its nature and precise geometry are debated owing to the extensive Miocene evaporites that cover the basement structures. The ZFZ is the location of the most intensive seismic activity in the northern Red Sea, with a reported historical magnitude 6.5 earthquake. Due to its proximity with coastal communities, the ZFZ thus potentially poses a significant hazard. In order to better characterize the seismic potential of the ZFZ, we collected new high-resolution bathymetric data of the Mabahiss Deep and ZFZ, and use them to map the tectonic structures over both exposed-basement and salt-covered areas.Our findings reveal typical slow spreading-ridge features in the Mabahiss area, such as an axial MORB volcano with a summit caldera located in the middle of a 9 x15 km axial valley bounded by up to ~300-m-high normal fault escarpments. In addition, our results highlight a highly deformed salt cover in the ZFZ area and several salt diapirs outcropping near its eastern edge. The orientation of salt-deformation fabrics records a clear rotation from rift-parallel to rift-normal in the vicinity of the ZFZ, suggesting a potential control by underlying basement structures. Overall, the deformed area indicates that the ZFZ is a 70 km long and 15 km wide fracture zone, oriented roughly N-S, and potentially consisting of several NE-SW rift-perpendicular faults. These new data provide the first step to characterize the geometry and seismic potential of the ZFZ and to constrain the segmentation of the ridge axis in the northern Red Sea, emphasizing the importance of continued research to improve our understanding of this complex region and its potential impact on coastal communities.

How to cite: Fittipaldi, M., Moulin, A., Trippanera, D., Augustin, N., van der Zwan, F., Parisi, L., and Jonsson, S.: The Zabargad Fracture Zone and Mabahiss Deep, Northern Red Sea: new insights from new high-resolution bathymetric mapping, EGU General Assembly 2024, Vienna, Austria, 14–19 Apr 2024, EGU24-19617, https://doi.org/10.5194/egusphere-egu24-19617, 2024.

EGU24-20450 | Orals | GM9.6

Extensive exposure of the Chukchi Shelf since the last deglacial 

Yanguang Liu, Song Zhao, and Jiang Dong

Ice sheets and ice shelves play an important role in Earth’s climate system during the late Quaternary. The cyclic growth and decay of continental ice sheets can be reconstructed from the history of global sea level. However, sea level estimates for the period of ice-sheet retreat after the Last Glacial Maximum (LGM) are full of uncertainties, especially in the Arctic Ocean. For example, the Bering Strait was a land bridge during the LGM, when sea level was ~130 m lower than today. Based on records from multiple sites, we suggest that the Chukchi shelf may not have been widely submerged during the late and/or post-Last deglacial.

The initial evidence comes from the less sea ice coverage and abnormal sediment accumulation rates during the early Holocene, and abnormally sedimentation rates have been observed in many records. Some cores have a very high sedimentation rate, on the contrary, there are hiatus in some records, even if a considerable number of differences due to chronological drift have been evaluated.

There were unusual sand layers before 8.2 ka, which can be associated with a rapid input of IRD in our proposed R11 core, accompanied by a fierce change in organic matter content. The coarse particle size indicates that it may be dominated by ice transition at this time.

The organic carbon record on the Chukchi sea-continental shelf/margin suggests that this model is attributed to ICD (Ice Complex Deposit), which results from the large-scale degradation and thawing of permafrost due to sea-level rise after the ice age. The early Holocene low sea source organic matter and low sea ice cover recorded in R09 indicate that the sea level rise is a long process, and the εNd, which represents the Pacific inflow also has a long-term lifting, during which part of the continental shelf may still be exposed to the surface or even covered by ice caps.

This situation continued until the last discharge of the Laurentide ice sheet during the 8.2 ka period, and the global sea level stabilized. After that, the maximum flux of PW inflow occurs between 6.0~ 5.0 ka. However, this situation may only be applicable in narrow and shallow continental shelves because we found new sedimentary records on the Chukchi borderland that show significantly different sedimentation rates compared to the cores raised from adjacent shelf. In that area, the sedimentation rate starts to rapidly decrease even though the water depth only increased by over hundreds of meters. Besides non-linear ages, the sedimentary records of the Chukchi borderland typically contain hiatus, and also include high IRD content and strong environmental changes. Furthermore, our neighboring region's records show significantly different carbonate content storage conditions compared to those from the Chukchi margin, which is similar to the micro fossil barren observed in the sedimentary record of the Chukchi plateau. Therefore, we need to be more cautious and consider the global perspective when studying the sedimentological environment of the Chukchi Sea and its continental margin.

How to cite: Liu, Y., Zhao, S., and Dong, J.: Extensive exposure of the Chukchi Shelf since the last deglacial, EGU General Assembly 2024, Vienna, Austria, 14–19 Apr 2024, EGU24-20450, https://doi.org/10.5194/egusphere-egu24-20450, 2024.

EGU24-20562 | ECS | Orals | GM9.6

From Ice to Deep Water Fans: Seismic Geomorphology Reveals the Story of a Glacigenic Basin Floor Fan offshore West of Shetland 

Simona Caruso, Vittorio Maselli, Brice Rea, and Matteo Spagnolo

This study uses 3D seismic reflection data to conduct a detailed seismic geomorphology analysis of a portion of a glacigenic basin fan system located offshore West of Shetland in water depths greater than 1000 m.

These deposits lie downslope from a gully system linked to the Foula wedge trough mouth fan, with both systems remarkably preserved at the present-day seafloor. While the seafloor morphology has received extensive attention in existing literature, the basin fan system subsurface structure, particularly its 3D geometry and distribution, remains less understood. This study lifts the veil, unveiling its basal surface and internal architecture in unprecedented detail. The 3D seismic characterisation reveals a complex basin channel network with linear, diverging erosional features and distinctive terminal lobes. These lobes exhibit stacked and backstepping patterns. The seismic geomorphology showcases features indicative of both debris flows and turbidites. This intricate interplay suggests a complex shelf-to-basin sediment transport and deposition mechanism.

The integration of this newfound evidence with existing regional bathymetry, helped pinpoint the source of the main basin distributary channels to two of the downslope gullies.  This suggests that, initially, high energy flows remained somewhat confined within the basin area allowing erosion. These local-scale insights shed light on different sediment delivery processes and their impact on basin fans development. Ultimately, these findings contribute to a more comprehensive understanding of the Foula wedge large-scale dynamics, particularly the influence of meltwater pulses driven by paleo-morphology, substrate characteristics, and unique ice-sheet behaviour during the Pleistocene glaciations.

How to cite: Caruso, S., Maselli, V., Rea, B., and Spagnolo, M.: From Ice to Deep Water Fans: Seismic Geomorphology Reveals the Story of a Glacigenic Basin Floor Fan offshore West of Shetland, EGU General Assembly 2024, Vienna, Austria, 14–19 Apr 2024, EGU24-20562, https://doi.org/10.5194/egusphere-egu24-20562, 2024.

EGU24-22150 | ECS | Posters on site | GM9.6

Feather-like submarine channels: a unique imprint of overbank flows imaged by 3D seismic data 

Aurora Machado Garcia, Benjamin Bellwald, Sverre Planke, Ingrid Anell, Reiden Myklebust, and Ivar Midtkandal

We document for the first time the extensive occurrence of “feather-like channels” in the 19000-year-old glacigenic submarine strata in the North Sea Fan (NSF). We describe these features in the uppermost deposits of the NSF, predominantly on the surface that marks the end of the period of shelf-edge glaciation, using over 14000 km2 of high-resolution 3D seismic reflection data (vertical resolution of 2m and bin size of 6.25 x 18.75m). 

These channels are a few 10’s of meters wide and depths on the limit of seismic resolution (~2 m). They lack clear cross sections, mostly presenting as disruptions in the otherwise readily traceable reflections, which make them easier to identify in amplitude maps rather than structure maps and seismic profiles. These “feather” channels occur exclusively in association with larger, deeper channels. The “feathers” diverge from the margins of the main channel, forming an obtuse angle with the flow direction of the main channel, becoming progressively sub-parallel further downstream, similar to a bird’s feather, with the divergence from the main channel axis in the downstream direction. They run for varied distances, as short as a few 100’s of meters and up to 7 kilometers. It’s also important to highlight that they occur extensively throughout the surface, with a small spacing of 10’s of meters between each other.

Similar features have been described by others as lineations formed at the base of debris flows. This was credited to circular depressions found at the end of such lineations and the fan shape that those features would create at the end of a main channel body. This description is clearly different from what we have described in this study, where both circular depressions and fan-shaped terminations were absent. Here, we interpret them as the record of overbank flows from the main channel, due to their geometry and dimensions, representing the large pulses meltwater coming from the shelf.

Our investigation into the “feather-like channels’’ reveals a unique seismic geomorphology, in a well understood palaeogeographical setting. The exclusive association of these channels with larger, deeper counterparts, their small spacing, and varied distances emphasize their pervasive nature. This research not only refines our understanding of submarine sedimentary dynamics, but also highlights the indispensable role of high-resolution 3D seismic data in understating the subsurface.

How to cite: Machado Garcia, A., Bellwald, B., Planke, S., Anell, I., Myklebust, R., and Midtkandal, I.: Feather-like submarine channels: a unique imprint of overbank flows imaged by 3D seismic data, EGU General Assembly 2024, Vienna, Austria, 14–19 Apr 2024, EGU24-22150, https://doi.org/10.5194/egusphere-egu24-22150, 2024.

The submarine channel, also known as submarine canyon, is a narrow and long negative terrain 
that cuts to the shelf or slope and widely developed on the global continental margins. There are 
numerous factors in forming channels, including climate change, topography, sediment sources and 
grain size, and sea level change. However, for high latitudes, especially in the Antarctic region, the 
controlling factors of the formation and evolution of the channel are still poorly understood. In this 
study, we conduct a systematic analysis of the channels in various regions of the Antarctic 
continental margin with the aim of identifying the differences of the channels between the East and 
West Antarctic continental margins and associated controlling factors. We identified 2126 channels 
on the Antarctic continental margin based on IBCSO V2 data (International Bathymetric Chart of 
the Southern Ocean Version 2). The submarine channels and their possible factors in six regions 
(Weddell Sea, Amundsen Sea, Ross Sea, Wilkes Land, Prydz Bay and Dronning Maud Land) are 
statistically analyzed. Quantitative analysis shows that there are obvious differences in the 
geomorphology of submarine channels between the East and West Antarctic continental margin. 
First, consider the differences in the landscape. The shelf is narrower on the east and wider on the 
west. There are prominent troughs running across the broad shelf. West Antarctica has a gentler 
slope gradient than the East Antarctic continental margin, and the ice velocity is much faster. Second, 
submarine channels on the West Antarctica continental margin are longer and wider in cross section, 
with most large-scale channels extending beyond the slope foot, whereas submarine channels on the 
East Antarctica continental margin are deeper but shorter, with fewer channels. We consider that 
shelf width, slope gradient, trough and ice velocity can control sediment transportation and thus 
affect the size of channels. Channels are longer and wider on the margin with wide shelf, prominent 
trough and fast ice velocity, while they are shorter and deeper on the margin with steep slope.

How to cite: Huang, H. and Huang, X.: Quantitative analysis of Antarctic channel distribution and the role played by continental geomorphology in channel evolution, EGU General Assembly 2024, Vienna, Austria, 14–19 Apr 2024, EGU24-22420, https://doi.org/10.5194/egusphere-egu24-22420, 2024.

EGU24-94 | ECS | Posters on site | SSP1.4

Sedimentology and Geochemistry of Evaporites in Bâlâ-Karakeçili Basin (SE Ankara, Central Anatolia) 

Erhan Karakuş and Erdoğan Tekin

Evaporitic precipitates exposed in the research area consist of gypsum. Seven gypsum lithofacies which massive gypsum (F1), bedded gypsum (F2), laminated gypsum (F3), nodular gypsum (F4), selenitic gypsum (F5), gypsum domes (F6) and satin-spar gypsum (F7) are recognized which are precipitated both shallow water and deep water environments in a restricted basin. Alabastrine, balatino, granoblastic and detritic textures are observed in petrographic studies. SEM/EDS analysis showed that celestite accompanied the gypsum precipitation. The strontium content of gypsum ranges between 197-22970 ppm which indicates the precipitation occured under marine conditions. Low barium content (2-129.4 ppm) indicates that there is no hydrothermal activity during gypsum precipitation, and arsenic, molybdenum and wolfram values lower than 1 ppm show that precipitation occurred under non-reductant conditions. Isotope values of δ34SSO4 range between 20.76‰ to 23.42‰ and δ18OSO4 ranges between 10‰ to 14.49‰ compatible with sulphur and oxygen values of Paleogene (Eocene-Oligocene) seawater. Furthermore, 87/86Sr values range from 0.707747‰  to 0.708558‰. These values correspond with late Eocene – early Oligocene seawater.

All data indicate that the precipitation of evaporite in the study area occurred under marine environmental conditions during the late Eocene - early Oligocene time interval, in the last phase of the regression processes of the remnant Eocene sea, as a result of the horizontal movements of the Eocene period seen almost everywhere in the Anatolian microcontinent.

How to cite: Karakuş, E. and Tekin, E.: Sedimentology and Geochemistry of Evaporites in Bâlâ-Karakeçili Basin (SE Ankara, Central Anatolia), EGU General Assembly 2024, Vienna, Austria, 14–19 Apr 2024, EGU24-94, https://doi.org/10.5194/egusphere-egu24-94, 2024.

EGU24-399 | ECS | Orals | SSP1.4

Probing large paleoenvironmental variability of Mediterranean during the Miocene-Pliocene transition via advanced multivariate statistical analysis on lipid biomarker multiproxy. 

Francesco Pilade, Michele Licata, Iuliana Vasiliev, Daniel Birgel, Francesco Dela Pierre, Marcello Natalicchio, Alan Mancini, Andreas Mulch, and Rocco Gennari

The quantitative reconstruction of paleoclimatic and paleoenvironmental conditions in regions and in time periods characterized by recurrent and significant fluctuations is challenging. An example of strong paleoenvironmental change occurred in the Mediterranean Basin across the Miocene – Pliocene boundary (5.33 Ma), marked by the restoration of normal marine conditions after the 'Lago-Mare' terminal phase of the Messinian salinity crisis. Environmental conditions during the Lago-Mare phase are still uncertain due to the controversial body fossil record, consisting of freshwater to brackish assemblages (ostracods, dinocysts, mollusks, and foraminifera), as well as marine microfossils (otoliths of marine fishes, calcareous plankton).

However, two scenarios were suggested to describe this transition: 1) a catastrophic and sudden sea level rise causing the drastic change from freshwater to marine deep environments; 2) a gradual sea level rise, characterized by a fast to gradual transition from brackish to marine environments.

To quantify the changing conditions during the Miocene–Pliocene transition, we used a multivariate statistical approach to interpret a large array of terrestrial and aquatic molecular-based indices, in a sedimentary succession of the Northern Mediterranean (Maccarone section, Central Italy). The statistical procedure was specifically developed to address the complexities emerging from the heterogeneous dataset.

An illustrative example suggests that using the TEX86, UK37’, and MBT´5ME paleothermometers, we obtained different values and trends in the changing Mediterranean during the study interval. While the study acknowledges the validity of UK37’ as a paleothermometer in variable environments, it highlights that TEX86and MBT´5ME are sometimes compromised by other sources, such as reworked sediment or other organisms that produce the same lipid inventory. In these cases, these proxies provide information about environmental processes rather different than temperatures.

Cluster analysis supports a stepwise evolution during the Miocene-Pliocene transition, besides redundancy analysis (RDA) indicates that the water column structure changed from stratified (Tetrahymanol) during the Messinian to mixed during the Zanclean. A second gradual change is instead related to terrestrial vegetation modifications, indicating a gradual coastal environment reconfiguration after a marine transgression with the distancing of the costal line and  a reduction of wetland aquatic plants signal. Finally, molecular fossils are also influenced by cyclical changes, not related to the Messinian salinity crisis demise but linked to astronomical-driven climatic cycles.

How to cite: Pilade, F., Licata, M., Vasiliev, I., Birgel, D., Dela Pierre, F., Natalicchio, M., Mancini, A., Mulch, A., and Gennari, R.: Probing large paleoenvironmental variability of Mediterranean during the Miocene-Pliocene transition via advanced multivariate statistical analysis on lipid biomarker multiproxy., EGU General Assembly 2024, Vienna, Austria, 14–19 Apr 2024, EGU24-399, https://doi.org/10.5194/egusphere-egu24-399, 2024.

EGU24-570 | ECS | Orals | SSP1.4

Tracing the origin of Lago Mare biota: ostracods and mollusks from the late Neogene of the Slavonian mountains in the southern Pannonian Basin (NE Croatia)  

Katja Mužek, Oleg Mandic, Valentina Hajek Tadesse, Mathias Harzhauser, Marijan Kovačić, Tomislav Kurečić, and Đurđica Pezelj

Lake Pannon was a huge central European long-lived endorheic lake settled in the Pannonian Basin System and surrounded by the Alps, Carpathians and Dinarides mountain ranges during the late Neogene. The rise of brackish Lake Pannon enabled establishment of specific environmental conditions which triggered a spectacular adaptive radiation of a great number of autochthonous mollusk and ostracod species. The latter species represent excellent regional paleoecological proxies and biostratigraphic markers due to their good preservation-potential and taxonomic richness. Although dominantly endemic to Lake Pannon, some of its taxa managed to migrate into the Eastern Paratethys and have also been reported from the Mediterranean. These species are restricted to the Lago Mare interval, representing the ultimate stage of the Messinian Salinity Crisis, a significant environmental perturbation characterized by massive evaporite deposition. The Lago Mare interval was apparently forced by a drainage of the Eastern Paratethys brackish water into the Mediterranean. The Bozara section is situated in the southern Pannonian Basin at the southern slopes of Mt. Papuk and carries a well-preserved benthic fauna representative of Lake Pannon. The 27 -m-thick section consists of alternating pelitic sediments and sand packages divided into 4 facies: silty marl and calcareous silt (F1), sand (F2), intercalation of sand and sandy silt (F3) and clayey silt (F4). According to the regional stratigraphic division it belongs to the Nova Gradiška Formation. We detected therein 25 ostracod and 17 mollusk taxa allowing an integrated evaluation of the depositional setting, biostratigraphic position and paleogeographic distribution pattern. The paleoecology of Bozara fauna documents a general shallowing upward trend along the section from calm deep-water sublittoral to deltaic high-energy littoral conditions. Based on presence of several biostratigraphic markers, such as the bivalve Rhombocongeria rhomboidea and the ostracod Caspiocypris pontica the stratigraphic position of the Bozara section is constrained to the Portaferrian substage (8.0-4.5 Ma).
From 16 ostracod taxa determined at species level, 10 can be found in the Eastern Paratethys deposits, whereas only 3 are shared with the Mediterranean Lago Mare. In contrast, among 12 corresponding mollusk taxa, only 4 are shared with the Eastern Paratethys, while being completely absent from the Lago Mare interval. Such a paleobiogeographic pattern suggests that the Lake Pannon outflow and faunal migration into the Eastern Paratethys, ceased distinctly before the Lago Mare phase and the corresponding migration of Paratethys biota into the Mediterranean basin.


How to cite: Mužek, K., Mandic, O., Hajek Tadesse, V., Harzhauser, M., Kovačić, M., Kurečić, T., and Pezelj, Đ.: Tracing the origin of Lago Mare biota: ostracods and mollusks from the late Neogene of the Slavonian mountains in the southern Pannonian Basin (NE Croatia) , EGU General Assembly 2024, Vienna, Austria, 14–19 Apr 2024, EGU24-570, https://doi.org/10.5194/egusphere-egu24-570, 2024.

EGU24-2095 | ECS | Posters on site | SSP1.4

From turbidites to evaporites: the Messinian Salinity crisis record of the Tabernas Basin (SE Spain) 

Gustavo Kenji Lacerda Orita, Fernando Pérez-Valera, Jesús Soria, Enrique Gomez-Rivas, Hugo Corbi, Núria Sierra Ramirez, Jingjing Liu, and Luis Gibert

The Messinian Salinity crisis (MSC) was a major ecological crisis triggered by a combination of climatic and tectonic drivers that led to the progressive restriction of the Mediterranean, and culminated with the formation of large evaporite deposits. The Tabernas Basin (SE Spain) presents an exceptional Miocene sedimentary record, key for understanding the evolution of a turbiditic basin during the MSC. A composite stratigraphic section (>200m long) from the early Messinian to the early Pliocene shows different phases of the MSC in the Yesón Alto area (~20 km from Almeria City). Our study allows recognizing pre-evaporitic, syn-evaporitic, and post-evaporitic units. Two stratigraphic sections, one in the Yeson Alto and the other in Rambla de Lanujar were measured, sampled and documented for their petrological, geochemical and sedimentary facies characterization. Paleontological data, obtained through the analysis of foraminifera and marine macrofossils, enabled bio-stratigraphic dating. Magnetostratigraphic sampling along the pre- and post-evaporitic units was executed, although only the post-evaporitic deposits allowed the isolation of the primary Characteristic Remanent Magnetization. The preliminary results indicate that sedimentation rates during the pre-evaporitic phase were approximately four times greater than those of the correlated Abad member in the neighbouring Sorbas Basin The examined pre-evaporitic unit (90 m-thick) predominantly comprises fine-grained deposits intercalated with levels of sandstones and limestones. Abundant benthic and planktonic foraminifera, together with other marine fauna, facilitated the identification of 13 bioevents in the succession. The presence of Turborotalita quinqueloba and Orbulina taxa allows correlation with the last Messinian biozone (d) of Mediterranean biostratigraphy. Decimeter-thick beds of fossiliferous packstones/wackestones and barren mixed-siliciclastic carbonates occur toward the uppermost part of the unit, at the transition with the evaporites, indicating the initiation of evaporitic conditions preceding the deposition of the first gypsum bed. Soft-sediment deformation in these transitional beds suggests the occurrence of an important seismic event in Tabernas basins during initial stage of the MSC. The evaporitic unit in this area comprises only three cycles of massive selenitic gypsum beds intercalated with mudstones, in contrast with the Sorbas Basin, where up to 15 cycles have been described. δS analysis of these selenites reveals values expected for Miocene marine evaporites. A level with abundant marine fossils in the second inter-evaporitic level indicates at least an episode of dilution from >150gr/l to <40gr/l during the evaporitic deposition phase, where normal marine conditions prevailed. Towards the basin margins (Rambla de Lanujar section), the pre-evaporitic unit is characterized by the alternation of siliciclastic mudstones and gravity flow deposits, including boulder-grained breccias. The evaporitic unit is represented here by two beds of secondary nodular gypsum and centimetriclenite crystals forming Selenite supercones up to 2.5 m in diameter. Conformably overlying the last gypsum bed, a cyclic sequence of interbedded conglomeratic sandstones, matrix-supported conglomerates, and siliciclastic mudstones occurs. The paleomagnetic analysis reveals a reverse polarity for this unit, suggesting its correlation with the chron C3r. The presence of a fossiliferous assemblage, indicative of marine conditions with high salinity, also supports the conclusion that the post-evaporitic phase began during the Messinian times.

How to cite: Lacerda Orita, G. K., Pérez-Valera, F., Soria, J., Gomez-Rivas, E., Corbi, H., Sierra Ramirez, N., Liu, J., and Gibert, L.: From turbidites to evaporites: the Messinian Salinity crisis record of the Tabernas Basin (SE Spain), EGU General Assembly 2024, Vienna, Austria, 14–19 Apr 2024, EGU24-2095, https://doi.org/10.5194/egusphere-egu24-2095, 2024.

A simple box model is developed to access the astronomical-modulated exchange of Atlantic seawater with the Mediterranean during the Late Miocene salinity crisis. Key to the calculations is an activity coefficient that reduces the rate of evaporation as salinity increases. The model uses a narrow and shallow portal in order to get salinity to increase to saturation for gypsum, halite and the most soluble potash and magnesium salts. Flow through the Atlantic entry portal changes in direction as climate oscillates from arid to wet during each precession cycle. The model addresses the geochemical riddle of “low salinity gypsum” with calculations showing that rain and rivers supply eight times more water to the Mediterranean brine than seawater. The sulfate isotopes in gypsum come in with the ocean and those in the water of hydration in gypsum from atmospheric precipitation. The evolving chloride, sulfate, potassium and magnesium ions observed from fluid inclusions in gypsum and halite are reproduced in the calculations. The mass of computed halite is approximate to the volume of acoustically-transparent halite observed in reflection profiles. The rates of gypsum, halite and kainite precipitation diminish with time as the result of the decreasing activity coefficient and the associated reduction in the amount of Atlantic inflow. The evaporative model’s reduction in the Atlantic-Mediterranean exchange conforms with the sedimentological and geochemical observations of the gypsum deposits on margins and halite on deep basin floors.

How to cite: Ryan, W. and Raad, F.: Computations to account for composition of the Mediterranean’s Messinian gypsum and halite, EGU General Assembly 2024, Vienna, Austria, 14–19 Apr 2024, EGU24-3231, https://doi.org/10.5194/egusphere-egu24-3231, 2024.

EGU24-4237 | Posters on site | SSP1.4 | Highlight

Preliminary results of IODP Expedition 401, the first element of the Miocene Mediterranean-Atlantic Gateway (IMMAGE) Land-2-Sea drilling project 

Rachel Flecker, Emmanuelle Ducassou, and Trevor Williams and the IODP Expedition 401 participants

Warm and saline Mediterranean overflow today is an important driver of thermohaline circulation in the North Atlantic. In the latest Miocene, Mediterranean salinity varied dramatically as the Messinian salt giant formed. The precipitation of a ~1.5 km thick evaporite layer across the Mediterranean seafloor requires substantial changes both to the geometry of the Atlantic-Mediterranean gateway and the nature of exchange between the two basins. This salinity crisis was the consequence of on-going Africa-Eurasia collision, which formed, narrowed, and ultimately closed the two ancestral marine connections that pre-date the Gibraltar Strait. One of these connections is now preserved on land in southern Spain, the other in northern Morocco. Both the initiation of Mediterranean overflow, variations in its size and salinity, and the establishment of the present-day overflow pattern in the early Pliocene are likely to have impacted thermohaline circulation, climatic change and deep water sedimentation during the late Miocene and Pliocene.

IMMAGE (Investigating Miocene Mediterranean-Atlantic Gateway Exchange) is a land-2-sea drilling project designed to recover a complete record of Late Miocene-Pliocene exchange (8-4Ma) offshore with International Ocean Discovery Program (IODP) in both the Atlantic and Mediterranean and onshore with International Continental Scientific Drilling Program (ICDP) in Morocco and Spain. IODP Expedition 401 is the first element of the land-2-sea drilling to take place. At the time of abstract submission, Expedition 401 is at sea (December 2023-February 2024) in the process of recovering these critical records. We propose to present an overview of the sediments recovered during the expedition and initial shipboard analytical results.

How to cite: Flecker, R., Ducassou, E., and Williams, T. and the IODP Expedition 401 participants: Preliminary results of IODP Expedition 401, the first element of the Miocene Mediterranean-Atlantic Gateway (IMMAGE) Land-2-Sea drilling project, EGU General Assembly 2024, Vienna, Austria, 14–19 Apr 2024, EGU24-4237, https://doi.org/10.5194/egusphere-egu24-4237, 2024.

EGU24-5056 | ECS | Orals | SSP1.4

Tracing the opening and connectivity of the South Atlantic with Sr and Os isotopes 

Rafaela Cardoso Dantas, Rachel Flecker, Ian Parkinson, Maurice Tucker, Dan Palcu, Paul Meijer, André Pires Negrão, and Luigi Jovane

The temporal and geological characteristics surrounding the initiation of the Proto-South Atlantic in the Early Cretaceous are presently unclear, marked by potential marine ingressions from both the northern Tethys- and the southern-ocean, ultimately culminating in the generation of immense salt deposits. The Araripe Basin in Northeast Brazil contains crucial outcropping records of these phenomena with its origin and development intricately linked to the tectonic forces orchestrating the disintegration of the Gondwana Supercontinent. The basin underwent distinct tectonic phases, transitioning from a pre-rift continental environment to a syn-rift lacustrine setting, and finally to evaporitic systems in the post-rift/sag phase.

The post-rift stage is notably represented by the Santana Group, which chronicles significant environmental shifts, including the potential existence of a seaway linking the waters of the Tethys to the Proto-South Atlantic, intermittent marine incursions, and the presence of substantial evaporite layers. Despite extensive study, the paleoenvironment of this unit remains contentious, with hypotheses ranging from epicontinental sea to a basin with non-marine and transitional environments under marine influence.

To address this ambiguity, we employ geochemical, paleomagnetic, and isotopic records (strontium 87Sr/86Sr and osmium 187Os/188Os) as indicators of hydrological connectivity. These tools serve as invaluable aids in reconstructing the paleoenvironment during the deposition of both pre- and post-salt phases in the basin.


Keywords: Salt giant, South Atlantic opening, marine gateways, strontium isotopes, osmium isotopes

How to cite: Cardoso Dantas, R., Flecker, R., Parkinson, I., Tucker, M., Palcu, D., Meijer, P., Pires Negrão, A., and Jovane, L.: Tracing the opening and connectivity of the South Atlantic with Sr and Os isotopes, EGU General Assembly 2024, Vienna, Austria, 14–19 Apr 2024, EGU24-5056, https://doi.org/10.5194/egusphere-egu24-5056, 2024.

EGU24-5651 | Posters on site | SSP1.4

Marine functional connectivity through the ages: geological and historical perspectives 

Konstantina Agiadi, Bryony Caswell, and Audrey Darnaude and the the Q-MARE - SEA-UNICORN workshop participants

Marine Functional Connectivity (MFC) refers to all the unimpeded flows of matter, genes and energy that are caused by the movements of marine life that occur at various spatial and temporal scales. Climate, palaeogeography, ocean circulation, biogeochemical cycles, evolution of Life and human activities control MFC over the long term. The geological and historical records offer valuable data on ecological and societal change that can be used to understand the evolution of MFC over time. We explain the links between these long-term drivers and MFC processes, as well as the diverse archives that can be used to study them: the sedimentary record, biogeochemical proxies, fossil assemblages, sclerochronological archives, genetic data, zooarchaeological remains, archaeological artefacts and historical sources.

How to cite: Agiadi, K., Caswell, B., and Darnaude, A. and the the Q-MARE - SEA-UNICORN workshop participants: Marine functional connectivity through the ages: geological and historical perspectives, EGU General Assembly 2024, Vienna, Austria, 14–19 Apr 2024, EGU24-5651, https://doi.org/10.5194/egusphere-egu24-5651, 2024.

EGU24-6137 | ECS | Posters on site | SSP1.4

Functional diversity of the Mediterranean bivalve fauna across the Late Miocene ecological crisis 

Barbara Vesely, Mathias Harzhauser, Stefano Dominici, Efterpi Koskeridou, Danae Thivaiou, and Konstantina Agiadi

The Late Miocene was a period of major paleogeographic, climatic and biotic changes for the Mediterranean due to the restriction of the marine gateway to the Atlantic, which culminated to the Messinian Salinity Crisis (MSC), and the ongoing global climatic cooling. The Late Miocene ecological crisis very likely affected biodiversity of bivalves living in the Mediterranean during that time. In this study, we investigate the consequences of the Messinian Salinity Crisis and its preconditioning phase for the evolution of functional diversity of the Mediterranean bivalve fauna. The biodiversity of bivalves is quantified for the Tortonian, the pre-evaporitic Messinian and the Zanclean of the Mediterranean using the functional richness index, by considering the following bivalve species traits: lifestyle, depth range, maximum adult size, trophic role and substrate affinity. The analysis is based on a recently compiled dataset containing the updated fossil record of the Mediterranean bivalves for this time interval. The traits of the species in this dataset is obtained from online open-access databases and the literature. Our results support a decrease in the functional diversity of bivalves in the Mediterranean from the Tortonian to the Early Messinian and a full recovery in the Early Pliocene.

How to cite: Vesely, B., Harzhauser, M., Dominici, S., Koskeridou, E., Thivaiou, D., and Agiadi, K.: Functional diversity of the Mediterranean bivalve fauna across the Late Miocene ecological crisis, EGU General Assembly 2024, Vienna, Austria, 14–19 Apr 2024, EGU24-6137, https://doi.org/10.5194/egusphere-egu24-6137, 2024.

EGU24-7757 | ECS | Posters on site | SSP1.4

Middle Miocene calcareous nannofossil and isotope fluctuations in the Central Paratethyan Realm (Eastern Carpathians) 

Eliza Anton, Vlad Apotrosoaei, Iulian Pojar, Constantin Lazar, and Mihaela Melinte-Dobrinescu

This work presents the fluctuation pattern related to the modifications in the calcareous nannofossil diversity and abundance and shift in δ13C and δ18O isotopes identified in a succession situated in the Outer Moldavide nappe system of the Eastern Carpathians. The studied section is mainly made by clays and marls and includes a cm-thick volcanic ash layer dated as 13.32 ± 0.07 Ma (de Leeuw et al., 2018). We have pointed out the biotical response to the environmental changes that took place as a consequence of the “Badenian Evaporitic Crisis” of the Central Paratethyan Realm. 

Based on the biostratigraphy of the calcareous nannofossils, we identified the Badenian NN5 biozone, argued by the co-occurrence of Sphenolithus heteromorphus, Coronocyclus nitescens and Cyclicargolithus floridanus. The semiqualitative analysis point out the abundant presence of Helicosphaera spp. (mainly H. carteri), which together with Sphenolithus spp., Cyclicargolithus floridanus, Reticulofenestra pseudoumbilicus and Braarudosphaera bigelowii accounted up to 50% calcareous nannofossil assemblages. Most of the found specimens of Braarudosphaera bigelowii are “rounded” morphotypes, as previously identified in several Central Paratethyan Miocene successions (Melinte-Dobrinescu & Stoica, 2013; Peryt et al., 2021), whereas the “classical” specimens with sharp edges and trapezoidal segments are extremely rare. In the studied interval, the values of δ13C and δ18O isotopes show wide ranges, with a significant negative shift of δ13C isotope values towards the top of the studied succession.

References

De Leeuw, A., Tulbure, M., Kuiper, K.F., Melinte-Dobrinescu, M.C., Stoica, M., Krijgsman, W., 2018. New 40Ar/39Ar, magnetostratigraphic and biostratigraphic constraints on the termination of the Badenian Salinity Crisis: Indications for tectonic improvement of basin interconnectivity in Southern Europe. Global and Planetary Change, 169, 1-15.

Melinte-Dobrinescu, M.C., Stoica, M., 2013. Badenian Calcareous Nannofossil Fluctuation in the Eastern Carpathians: Palaeoenvironmental significance. Acta Palaeontologica Romaniae, 9(2), 47-56.

Peryt, D., Garecka, M., Peryt, T.M., 2021. Foraminiferal and calcareous nannoplankton biostratigraphy of the upper Badenian–lower Sarmatian strata in the SE Polish Carpathian Foredeep. Geological Quarterly, 65(18), 1-22.

How to cite: Anton, E., Apotrosoaei, V., Pojar, I., Lazar, C., and Melinte-Dobrinescu, M.: Middle Miocene calcareous nannofossil and isotope fluctuations in the Central Paratethyan Realm (Eastern Carpathians), EGU General Assembly 2024, Vienna, Austria, 14–19 Apr 2024, EGU24-7757, https://doi.org/10.5194/egusphere-egu24-7757, 2024.

EGU24-9263 | Posters on site | SSP1.4

Calcareous nannofossil fluctuation related to the Messinian Salinity Crisis 

Mihaela Melinte-Dobrinescu, Jean-Pierre Suc, and Popescu Speranta-Maria

In the Mediterranean, the latest Miocene was characterized by an exceptional event caused by the severe drop of the sea-level, leading to the Messinian Salinity Crisis (MSC). This event is characterized throughout the whole Mediterranean by the occurrence of thick evaporites in its deep basins and huge fluvial canyons within its margins (i.e., Cita et al., 1978; Cornée et al., 2006; Clauzon et al., 2008). This significant event triggered important faunas and floras modifications from the Mediterranean region and the surrounding basins, affecting the assemblage diversity, abundance, and composition. One of the most sensitive marine planktonic organisms, the calcareous nannoplankton, is well reflecting the palaeoenvironmental setting of the Messinian-Zanclean boundary interval.

This study presents the fluctuation pattern before, during and after the MSC, as identified in several studied successions of the Western and Eastern Mediterranean regions. Below the MSC, the calcareous nannofossil assemblages are characterized by high diversity and abundance, with dominance of the warm-water taxa, such as the discoasterids. At the beginning of the MSC, brackish environment dominated the late Messinian, which is barren of nannofossils, but some marine influxes are to be assumed, as in some Mediterranean areas the salinity was high enough to allow the nannoplankton survival. Calcareous nannoplankton assemblages recorded in the Messinian deposits (NN11b nannofossil subzone) are dominated by long-ranging and diagenetical resistant taxa (i.e., Reticulofenestra spp., Sphenolithus moriformis, and Coccolithus pelagicus). In most investigated sections, during the MSC, almost monospecific assemblages containing Braarudosphaera bigelowii, indicating strong salinity variations, were observed. Around the base and the top of the above-mentioned intervals, blooms of the calcareous dinoflagellate genus Thoracosphaera (suggesting unstable palaeosetting) were also identified. A marine environment is restored within the base of the Pliocene (early Zanclean), being most probably related to the important transgressive event, linked to the reconnection of Mediterranean with the open-ocean. The earliest Pliocene nannofossil assemblages of the NN12 zone are dominated by Discoaster and Sphenolithus taxa, indicative for warm-surface waters and an open-marine environment.

References

Cita, M.B., Ryan, W.B.F., Kidd, R.B., 1978. Sedimentation rates in Neogene deep sea sediments from the Mediterranean and geodynamic implications of their changes. Initial Reports DSDP 42A, 991–1002.

Clauzon, G., Suc, J.-P., Popescu, S.-M., Melinte-Dobrinescu, M.C., Quillévéré, F., Warny, S.A., Fauquette, S., Armijo, R., Meyer, B., Rubino, J.-L., Lericolais, G., Gillet, H., Çağatay, M.N., Ucarkus, G., Escarguel, G., Jouannic, G., Dalesme, F., 2008. Chronology of the Messinian events and paleogeography of the Mediterranean region s.l. CIESM Workshop Monographs 33, 31–37.

Cornée, J.-J., Ferrandini, M., Saint Martin, J.-P., Münch, P., Moullade, M., Ribaud Laurenti, A., Roger, S., Saint Martin, S., Ferrandini, J., 2006. The late Messinian erosional surface and the subsequent reflooding in the Mediterranean: new insights from the Melilla–Nador basin (Morocco). Palaeogeography, Palaeoclimatology, Palaeoecology 230 (1–2), 129–154.

How to cite: Melinte-Dobrinescu, M., Suc, J.-P., and Speranta-Maria, P.: Calcareous nannofossil fluctuation related to the Messinian Salinity Crisis, EGU General Assembly 2024, Vienna, Austria, 14–19 Apr 2024, EGU24-9263, https://doi.org/10.5194/egusphere-egu24-9263, 2024.

Between 5.97 and 5.33 Ma, the Mediterranean area was fundamentally impacted by the Messinian Salinity Crisis (MSC), a pivotal event that led to the transformation of the Mediterranean Sea into an extensive evaporitic basin, caused by rapidly changing environmental conditions. The MSC was caused by a combination of tectonic and climatic factors, resulting in severe connectivity restriction between the Mediterranean-Paratethys system and the Atlantic Ocean. The Sorbas Basin, thanks to its proximity to the Atlantic gateway and astronomically dated sedimentary succession, represents a key element in understanding the nature of palaeoceanographic transformations affecting the Western Mediterranean, preceding and announcing the MSC. Here, we present the first sea surface temperature (SST) and sea surface salinity (SSS) estimates recorded in Sorbas (i.e., Western Mediterranean) for the time interval between 7.3 to 6.0 Ma. The studied section includes the lower Abad Member (cyclic alternations of homogenous marls and indurated layers) and the upper Abad Member (cyclic alternations of sapropels, diatomites and marls). SSTs were estimated using TEX86 and UK´37 biomarker-based proxies, with cross validation at distinct levels. To further constrain the SSS changes, we combined the TEX86 and UK´37 based SST estimates with δ18O values measured at the same stratigraphic levels on the planktonic foraminifera Orbulina universa. The temperature estimates vary between 17 and 27 °C, with a pronounced cold (17 °C) peak at 7.1 Ma, following the restriction of the Betic and Rifian corridors. This cooling is followed by a generally warmer period lasting until 6.27 Ma, when a colder trend emerges and lasts until 6.18 Ma. A marked and sharp cooling from 27 to 18 °C is observed at 6 Ma, preceding the onset of the MSC. The SST-δ18O- calculated salinity ranges between 34 and 44 for most of the levels. However, several levels around 7.0, 6.74, 6.52 and 6.06 Ma, generated SSS values as low as 20, provoked by exceptionally low, yet not fully understood , δ18OO. universa component in our SSS calculation. The low values might be associated with a significant local influx of fresh water, considering the basin's restricted nature. When comparing our results to coeval records existing for the Eastern and Central Mediterranean (Agios Myron, Kalamaki and Monte dei Corvi), we notice a correlation of warmer and colder peaks across the Mediterranean, albeit with minor leads and lags. Importantly, the Sorbas SST values are well within the range of SSTs in the Eastern and Central Mediterranean. The SSS values of Sorbas are also within the range reported in the Eastern Mediterranean with the exception of those levels presumably affected by fresh water input. In the absence of a full explanation for the associated low-δ18OO. universa values, we observe the dominance of the C37:4 alkenone component, exclusively associated with fresh to brackish water environments, at some of these levels, strongly suggesting the occurrence of repeated fresh water influx into the basin.

How to cite: Lanterna, F., Sierro, F. J., Mulch, A., and Vasiliev, I.: Sorbas’ basin secrets unveiled: First record of Sea Surface Temperature and Sea Surface Salinity in the Western Mediterranean prior to the onset of the Messinian Salinity Crisis, EGU General Assembly 2024, Vienna, Austria, 14–19 Apr 2024, EGU24-9714, https://doi.org/10.5194/egusphere-egu24-9714, 2024.

EGU24-11589 | ECS | Posters on site | SSP1.4

Laminar Gypsum deposited during the Messinian salinity crisis acme: a case study from the Racalmuto basin (Sicily, Italy). 

Enrico Nallino, Mathia Sabino, Francesco Dela Pierre, and Marcello Natalicchio

During the late Miocene Messinian salinity crisis (MSC), the Mediterranean Basin was transformed into the youngest salt giant in Earth's history. The acme phase of the MSC appeared to have coincided with a high-magnitude sea level drop, resulting in widespread erosion of sulphate evaporites deposited in shallow, marginal basins during the early phase of the MSC. Clastic gypsum deposits were consequently emplaced by submarine mass movements and low to high-density gravity flows in deep basins interfingering with thick halite deposits and hemipelagic, laminated sediments including organic-rich shales and laminar gypsum. Deciphering the depositional mechanisms behind hemipelagites is pivotal to reconstruct the paleoenvironmental and paleoceanographic conditions of deep Mediterranean basins during the MSC acme, including water depth and chemical, physical and biological characteristics of the aquatic system. This work focuses on the Racalmuto basin (Sicily, Italy), where a continuous sedimentary record from the pre-evaporitic Tripoli Fm. to the final stages of the MSC (Upper Gypsum) is exposed. Here, the MSC acme is recorded by gypsum turbidites and a chaotic interval, interbedded with laminar gypsum (“balatino”) formed by nucleation of gypsum crystals in the water column and their subsequent deposition on the sea floor (cumulate deposits). The most typical microfacies consist of an intricated network of gypsum crystals with a rhombohedral to prismatic elongated habit (< 1 mm in size). Petrographic observations show textural changes across the studied interval. The size of the crystals progressively decreases upwards across the studied section, possibly reflecting the increase in the saturation of the brine approaching the time of halite deposition in the deeper parts of the basin. The appearance of a diversified calcareous nannofossils assemblage, interbedded with gypsum laminae immediately below the bottom-grown selenitic gypsum of the Upper Gypsum (final stage of the MSC) suggests that normal marine conditions were intermittently established in the upper water column approaching the end of the MSC acme.

How to cite: Nallino, E., Sabino, M., Dela Pierre, F., and Natalicchio, M.: Laminar Gypsum deposited during the Messinian salinity crisis acme: a case study from the Racalmuto basin (Sicily, Italy)., EGU General Assembly 2024, Vienna, Austria, 14–19 Apr 2024, EGU24-11589, https://doi.org/10.5194/egusphere-egu24-11589, 2024.

The coquina along the Oued Beth south of Dar bel Hamri near Sidi Slimane is known for its fossil-richness, but the stratigraphic position has long been debated for Late Miocene or Early Pliocene age. A review of fossils and samples taken during field work in the mid-70ies supports an Early Pliocene age. Recently, I described the rich otolith-based fish fauna from these rocks, which are positioned in a funnel-shaped embayment close to the Strait of Gibraltar ideally situated as a reservoir for remigration of biota into the Mediterranean following the Messinian Salinity Crisis. The analysis of the fish fauna revealed that:

1.- The diversification of the fish fauna is exceptionally high and dominated by otoliths from adult specimens, which probably indicates a high food supply at moderate depth on a middle to lower shelf position during the deposition of the coquina.

2.- The otolith-based fish fauna from the Early Pliocene of the Rharb Basin shows a good resemblance not only to the coeval fauna of the Mediterranean, but also exhibits a notable proportion of putative endemic species and species related to today’s tropical West African fauna.

3.- The faunal composition thus exhibits a unique character that is sufficiently different from known or deduced neighboring bioprovinces, and thus a “Maghrebian bioprovince” is proposed for the Early Pliocene NW African region.

4.- The faunal comparison between Early Pliocene Mediterranean and NW African fish fauna reveals few candidates for allopatric speciation and in situ survival in the Mediterranean.

How to cite: Schwarzhans, W.: The Early Pliocene fish fauna of the Rharb Basin in NW Morocco based on otoliths - a reservoir for remigration into the Mediterranean, EGU General Assembly 2024, Vienna, Austria, 14–19 Apr 2024, EGU24-13099, https://doi.org/10.5194/egusphere-egu24-13099, 2024.

EGU24-14271 | Posters on site | SSP1.4

A similarly warm but drier Mediterranean region at the Miocene - Pliocene transition 

Iuliana Vasiliev-Popa, Konstantina Agiadi, Katharina Methner, Jens Fiebig, and Andreas Mulch

Between 5.97-5.33 Ma, kilometre-thick evaporite units were deposited in the Mediterranean Basin during an event known as the Messinian Salinity Crisis (MSC). The MSC was characterised by a strongly negative hydrological budget, with a net evaporative loss of Mediterranean basin water exceeding precipitation and riverine runoff inputs. Despite evident proves of environmental crisis at the end of the Messinian, the Mediterranean domain still lacks quantitative estimates of temperature change across the transition from the (brackish) Lago Mare, marking the end of the Miocene, to the fully marine Pliocene. Here we reconstruct continental mean annual temperatures (MAT) using branched glycerol dialkyl glycerol tetraether (brGDGT) biomarkers for the time period corresponding to the MSC Stage 3 (5.55-5.33 Ma) and compare them with continental temperature values obtained from Δ47 clumped isotope geochemistry measured on paleosol carbonate nodules found at few locations in the Mediterranean basin. The well-preserved organic biomarkers were extracted from outcrops onshore and offshore covering a vast portion of the Mediterranean Basin; onshore (Malaga, Sicily, Cyprus) and offshore (DSDP core holes 124 and 134 from the Balearic abyssal plane, hole 374 from the Ionian Basin and hole 376 drilled west of Cyprus). Calculated MATs for the 5.55 to 5.33 Ma time interval show values around 16 to 19 ºC for the Malaga, Sicily and Cyprus outcrops. The MAT values calculated for DSDP Leg 13 holes 124, 134 and Leg 42A holes 374 and 376 are lower, around 13 to 16 ºC. Comparing the brGDGT-MAT values with Δ47-MAT values from carbonate nodules, shows high congruence between both approaches. For the northern Mediterranean Δ47-MAT is 24.6 ± 1.6 °C and brGDGT-MAT is 19 ± 4.8 ºC. For Cyprus Δ47-MAT is 20.3 ± 1.7 °C and brGDGT-MAT is 18 ºC ± 4.8 ºC. Given the very different nature of the used paleoproxies, the similarity of the obtained MAT values provides a strong indication of their (cross)validity in sampled sections. Additionally, the measured δ18O values for the carbonate nodules used for the Δ47-MAT show high δ18O of the soil water (in the range of -5 ±0.7‰) indicate highly evaporative conditions for the two onland sites where these were collected (Northern Apennines and Cyprus). We conclude that between 5.55 to 5.33 Ma the temperatures in the Mediterranean region were similar to present-day conditions, yet the region has suffered from excess evaporation as indicated by combined high δ18O values from (inorganic) carbonate nodules and δ2H values from (organic) biomarkers.

How to cite: Vasiliev-Popa, I., Agiadi, K., Methner, K., Fiebig, J., and Mulch, A.: A similarly warm but drier Mediterranean region at the Miocene - Pliocene transition, EGU General Assembly 2024, Vienna, Austria, 14–19 Apr 2024, EGU24-14271, https://doi.org/10.5194/egusphere-egu24-14271, 2024.

The Messinian Salinity Crisis is an event that not only led to the youngest known salt giant, but also impacted the global ocean salinity due to the mass of ions trapped in the Mediterranean Sea. Understanding its full implications requires comprehensive understanding of the events, and due to limitations in data acquisition, modeling is essential to bridge knowledge gaps.
Our latest box model aims to include those processes and aspects that have been indicated to be the most influential by previous model studies. It is forced by (1) a reconstructed freshwater budget with the option to include a salinity feedback, (2) the depth of the Sstrait of Gibraltar and (3) changes in the sea level of the Atlantic. The circulation in the Mediterranean includes the exchange between the eastern and the western basin across the sill  of Sicily on the horizontal level, as well as vertical exchange between two layers. The shapes of the boxes are determined by the hypsometry of the basin, which allows for realistic drawdown and refilling scenarios. The latter offers the option to test the influence of the Paratethys.
To assess the validity of scenarios, the model output is compared to the volume of the known deposits as well as the cycles recorded in gypsum outcrops. An additional tracer in the model is the Sr isotope signal. 
Our findings highlight the importance of horizontal gradients in explaining gypsum deposits in the western basin, unlike the more uniform distribution of gypsum and halite the model produces in the eastern basin. While the onset of gypsum deposition may not necessarily differ between the basins, our results support the theory that halite precipitation began earlier in the east than in the west. This type of model will not answer all questions, but it might guide us to the new ones.

How to cite: Ebner, R., Meijer, P., and Aloisi, G.: From marine to brine and back – a new box model approach to investigate the external influences on the Messinian salinity crisis  , EGU General Assembly 2024, Vienna, Austria, 14–19 Apr 2024, EGU24-16605, https://doi.org/10.5194/egusphere-egu24-16605, 2024.

EGU24-20769 | Orals | SSP1.4

What controlled the Mediterranean Sea level during the Lago-Mare stage of the Messinian salinity crisis? 

Daniel Garcia-Castellanos, Hanneke Heida, Dan Palcu, and Vanni Aloisi

Stratigraphic and geochemical evidence suggests that the Mediterranean Sea underwent widespread salinization and a kilometer-scale evaporative drawdown between 5.97 to 5.33 million years ago, during the period known as the Messinian salinity crisis (MSC). The mechanisms responsible for the accumulation of one million cubic kilometers of salt on the sea floor and the impact on terrestrial and marine fauna and on climate are being better understood in the last decades. However, the presence of relatively fresh water sediment containing fossil fauna of eastern (Paratethyan) provenance in the last stages of the MSC poses severe problems to understand the ending of the crisis. These brackish-water deposits, known as the Lago-Mare unit, are sometimes found at elevations close to the present sea level, in apparent contradiction with the coetaneous evaporitic sediment found in deeper, central parts of the Mediterranean.


We make use of landscape evolution models calibrated with sediment transport and river incision data to explore plausible scenarios of climate and sea level changes during the MSC. The results show that, upon full isolation, the large initial evaporative sea level fall of the Mediterranean leads to a progressive capture of the waters from nearby lacustrine basins such as the Black Sea or the Pannonian Basin. This drainage area expansion triggers a gradual sea level rise in the Mediterranean. Milankovic climate oscillations superimposed to this trend lead to large-amplitude (500-1000 m) harmonic sea level variations reaching ever-higher levels. This is consistent with the salt precipitation in deeper areas during lowstands and Lago-Mare deposition during highstands in marginal areas. This model may also explain the seemingly contradiction between the high-level Lago-Mare deposits and the km-scale sea level drop estimated from erosion markers and implicit in the Zanclean cataclysmic reflooding model.

How to cite: Garcia-Castellanos, D., Heida, H., Palcu, D., and Aloisi, V.: What controlled the Mediterranean Sea level during the Lago-Mare stage of the Messinian salinity crisis?, EGU General Assembly 2024, Vienna, Austria, 14–19 Apr 2024, EGU24-20769, https://doi.org/10.5194/egusphere-egu24-20769, 2024.

EGU24-21155 | Orals | SSP1.4

The history of the Eastern Paratethys during the Serravallian-Tortonian from a restricted marine basin to a megalake: integrated stratigraphy, hydrological evolution and biotic record 

Davit Vasilyan, Oleg Mandic, Marius Stoica, Kakhabe Koiava, Stjepan Coric, Pavel Goldin, Mathias Harzhauser, Wout Krijgsman, and Sergei Lazarev

During the late Middle – Late Miocene, the large epicontinental Paratethys Sea that occupied the vast territory of West Eurasia’s interior underwent a remarkable hydrological transformation. At 12.6 Ma, driven by the interplay between the climatically controlled basin water budget and tectonically controlled gateway dynamics, the Paratethys became hydrologically isolated from the global ocean. During the following Sarmatian s.l. Stage (12.65 – 7.6 Ma), the largest eastern branch of the Paratethys – The Eastern Paratethys – became an endorheic basin with the hydrological balance being primarily controlled by the climate (ratio of evaporation/precipitation). Variations in the hydrological balance affected water chemistry, leading to a high level of aquatic ecosystem endemism/radiation and later to their extinction. Despite relatively well-documented trends of biotic evolution in the Sarmatian s.l., aspects such as comprehensive age constraints, (substage) biozonation, and depositional characteristics of strong water-level fluctuations are still missing. This gap of knowledge complicates interregional paleo(bio)geographic, tectonic, and paleoenvironmental studies of the five million-year-long portion of West Eurasian history.

In this study, we present the results of our multidisciplinary research project dedicated to geochronology, biostratigraphy, environmental evolution, and dynamics/response of the biotic record of the Eastern Paratethys during the Sarmatian s.l. The periods (i.e. stages) prior to (Konkian) and after (Maeotian) the isolation have been also considered in this study to provide a complete picture of the basin’s hydrological transformation. Three representative sections, located in the Caspian Sea, Transcaucasian Strait and the Black Sea covering the Konkian – Sarmatian s.l. – lower Maoetian, have been studied. Systematic sampling of the sections for magnetostratigraphy, mollusk, ostracod, foraminifera and nannofossils allowed to create a consecutive and well-dated biotic record and enabled evaluation of the synchronicity of the biozones in different parts and depositional settings of the basin. Moreover, the marine vertebrate fauna (fishes, marine mammals) across the Konkian-Maeotian has also been documented and studied.

Our data provides integrated stratigraphic constraints of the Serravallian-Tortonian of the Eastern Paratethys and completes the so far missing ages of the Sarmatian s.l. substages and biozones. Further, the reconstruction of depositional environments of the Eastern Paratethys during the Sarmatian s.l., especially for the Caspian Basin part, helped to understand the scale of the extreme Sarmatian s.l. water level oscillations. Integration of the age model, depositional setting and marine vertebrate faunal record suggest a very diverse and abundant fish and marine mammalian fauna in the Volynian (early Sarmatian s.l.), which, however, gradually decrease in the Bessarabian (middle Sarmatian s.l.) and entirely vanishes by the end of the Khersonian (late Sarmatian s.l.).

How to cite: Vasilyan, D., Mandic, O., Stoica, M., Koiava, K., Coric, S., Goldin, P., Harzhauser, M., Krijgsman, W., and Lazarev, S.: The history of the Eastern Paratethys during the Serravallian-Tortonian from a restricted marine basin to a megalake: integrated stratigraphy, hydrological evolution and biotic record, EGU General Assembly 2024, Vienna, Austria, 14–19 Apr 2024, EGU24-21155, https://doi.org/10.5194/egusphere-egu24-21155, 2024.

EGU24-22572 | Posters on site | SSP1.4

Multi-proxy characterization of the Messinian Salinity Crisis deposits in the Sorbas Basin (SE Spain): Implications on the paleo-environmental evolution during the uppermost Miocene 

Fadl Raad, Philippe Pezard, Cesar Viseras, Francisco J. Sierro, Luis M. Yeste, Andrea Schleifer, Johanna Lofi, Angelo Camerlenghi, and Giovanni Aloisi

The Sorbas Basin (Spain) has been a key study area for the understanding of the Late Miocene Messinian Salinity Crisis (MSC) (5.97-5.33 Ma). The MSC deposits of the Sorbas Basin consist of four sedimentary units: (1) the pre-MSC Abad marls topped by (2) the evaporitic Yesares gypsum member, followed by two non-evaporitic units known as the (3) Sorbas and (4) Zorreras members. These deposits have been widely studied almost exclusively in the several outcrops across the basin.


In 2021, four ~175m-long boreholes (named SG0, 1, 2 and 3) covering most of the MSC sequence were drilled, cored, and logged in the Marylen gypsum mine in Sorbas. These successions provided for the first time a continuous, non-outcropping succession of the MSC record. In addition to the recovered cores (~75% recovery), downhole geophysical logging data was obtained from the four holes and digital images of the area were collected with a drone.


Optical borehole wall images provide mm-scale images of the borehole walls, highlighting the sedimentological and structural characteristics of the deposits. Downhole geophysical measurements included acoustic velocity, electric resistivity and magnetic susceptibility, and natural spectral gamma ray. In addition to the petrophysical logs, a Vertical Seismic Profile, including a walk-away distributed acoustic sensing experiment, was acquired in holes SG2 and SG3.


Preliminary results confirmed not only the astronomical precession-driven cyclicity observed elsewhere in the Messinian gypsum, but also potentially higher-frequency cyclicity in the post-evaporitic Sorbas Mb. The Digital Outcrop Model allowed for a detailed correlation between the wells while recognizing various discontinuities and obtaining 3D data of geometry and dimensions of the different geobodies that respond to the interaction of auto and allocyclic processes that conditioned erosion and sedimentation in this western sector of the Mediterranean.

How to cite: Raad, F., Pezard, P., Viseras, C., Sierro, F. J., Yeste, L. M., Schleifer, A., Lofi, J., Camerlenghi, A., and Aloisi, G.: Multi-proxy characterization of the Messinian Salinity Crisis deposits in the Sorbas Basin (SE Spain): Implications on the paleo-environmental evolution during the uppermost Miocene, EGU General Assembly 2024, Vienna, Austria, 14–19 Apr 2024, EGU24-22572, https://doi.org/10.5194/egusphere-egu24-22572, 2024.

EGU24-22574 | Orals | SSP1.4

Gateway to a salt giant: a new record of the Messinian Salinity Crisis from the westernmost part of the Mediterranean 

Emmanuelle Ducassou, Rachel Flecker, and Trevor Williams and the IODP Expedition 401 participants

Salt giant formation is dependent on the dimensions of the connection linking the marginal basin to the open ocean and the nature of exchange between then. However, records from these connecting straits are rare, making it difficult to test connectivity scenarios. As part of the IMMAGE Land-2-Sea project, Integrated Ocean Discovery Program Expedition 401 drilled a new site, U1611, in the Alborán Sea. This basin is thought to have been part of the corridor that linked the Mediterranean with the Atlantic during the formation of the late Miocene salt giant. More than 600 m of sediments were recovered from Site U1611 spanning the early Messinian to early Pliocene. Here we present preliminary results and consider their implications for the origin and evolution of the Messinian Salinity Crisis.

How to cite: Ducassou, E., Flecker, R., and Williams, T. and the IODP Expedition 401 participants: Gateway to a salt giant: a new record of the Messinian Salinity Crisis from the westernmost part of the Mediterranean, EGU General Assembly 2024, Vienna, Austria, 14–19 Apr 2024, EGU24-22574, https://doi.org/10.5194/egusphere-egu24-22574, 2024.

OS3 – Ocean Biogeochemistry and Biology

Typhoons can significantly change marine biogeochemical processes. The organic matter (OM) decomposition (carbon source) plays an important role in biogeochemical process in coastal waters after typhoons. However, more field investigations are needed to quantify the contributions of particulate organic matter (POM) and dissolved organic matter (DOM) to OM decomposition triggered by typhoons. To address this issue, the stable isotopes of particulate OM (POM) and the spectral properties of dissolved OM (DOM) were investigated before and after Typhoon "Barija" in Zhanjiang Bay, northwestern South China Sea. High-salinity seawater intruded from the lower bay to the upper bay due to the external forces of clockwise wind stress, thereby forming an ocean front in the middle bay during the typhoon. The POM decomposition induced by the typhoon in the upper bay (inventory 72%) was substantially higher than in the lower bay (inventory 5%) due to the barrier effect of ocean front in the middle bay. However, the decomposition removed only 1–4% DOM in the upper bay, and a net addition of DOM occurred in the lower bay due to phytoplankton growth and POM decomposition. More importantly, although the quantity of DOM is much larger than that of POM in the water, the inventory of POM in the upper bay removed by typhoon-induced decomposition (20.19 g m-2) is much higher than that of DOM (16.08 g m-2). Overall, our study suggests that POM decomposition is more critical than DOM decomposition after typhoons, mainly controlled by the strong ocean front and vertical mixing.

How to cite: Lu, X.: Using stable isotopes and spectral properties to quantify the contributions of particulate organic matter and dissolved organic matter to organic matter decomposition triggered by typhoons, EGU General Assembly 2024, Vienna, Austria, 14–19 Apr 2024, EGU24-1273, https://doi.org/10.5194/egusphere-egu24-1273, 2024.

EGU24-1928 | ECS | Posters on site | OS3.1

External Dynamic Mechanisms Controlling the Periodic Offshore Blooms in Beibu Gulf 

Qibin Lao and Fajin Chen

Since offshore waters are less affected by human activities and nutrient-rich water masses, existing theories on periodic offshore blooms (POB) consider that the POB is proportional to the intensity of ocean fronts (nutrient supply from enhancing vertical mixing), ignoring external nutrient supply and external forcing (climatic oscillations). This study proposes an external dynamic mechanism of the POB on the basis of field observations and long-term satellite remote sensing data (1981–2022) in Beibu Gulf, which is influenced by remarkable external forcing. Three water masses, coastal current (CC), West-Guangdong coastal current (WGCC), and South China Sea water (SCSW), were identified using dual water isotopes. The seawater in the gulf mainly originated from CC in summer and fall, while it changed to the SCSW in winter. The nutrient in the gulf was mainly from the CC in summer and fall, while it shifted to the WGCC in winter. Notably, a strong thermal front with an inverted-V structure was found in the central gulf every winter due to the strong wind stress and change of water mass mixing. The intensity of the front on the east side is weaker due to the intrusion of WGCC. However, Chlorophyll-a concentrations in the eastern (nutrients supplied by WGCC) and northern (nutrients supplied by vertical mixing) were obviously higher than that in the western front (limited nutrient supply) in winter. On an interannual scale, the intensity of POB in La Niña years is remarkably stronger than in El Niño years due to the stronger WGCC supplying more nutrients in La Niña. This study suggests that the intensity and range of POB are not proportional to the frontal intensity in the gulf, but are directly driven by the internal forcing (fronts and nutrient supply from WGCC), which is controlled by the external forcing.

How to cite: Lao, Q. and Chen, F.: External Dynamic Mechanisms Controlling the Periodic Offshore Blooms in Beibu Gulf, EGU General Assembly 2024, Vienna, Austria, 14–19 Apr 2024, EGU24-1928, https://doi.org/10.5194/egusphere-egu24-1928, 2024.

Typhoons are extreme whether events that can not only affect marine dynamics, but also change marine biogeochemistry, which greatly impact on the marine eco-environment and climate. Recently, we reported that decomposition (as a carbon source) of organic matter (OM) is the dominant process in coastal waters after typhoons, which is contrary to phytoplankton blooms (as a carbon sink) in previous studies. The decomposition directly affects the global carbon and nitrogen cycles, and the efficiency of the biological pump and global climate change. Yet, the mechanisms of OM decomposition after typhoons and the question of whether the decomposition is mainly of particulate organic matter (POM) or dissolved organic matter are still unclear. To address these issues, more than ten typhoons with different intensity, moving speed, and path of the typhoon were chosen, and physicochemical parameters and multiple isotopes in the coastal waters were measured before and after typhoons. The results showed that not all typhoons can trigger phytoplankton blooms in the oceans, which mainly depends on the supply of nutrients after typhoons. However, a positive apparent oxygen utilization value occurred in the coastal waters, suggesting that decomposition of OM was the dominant biogeochemical process regardless of whether phytoplankton blooms occurred after the typhoon. Despite the overall larger DOM in the water column, the amount of POM removed by typhoon-induced decomposition is much greater than that of DOM. Our study suggests that typhoon-induced decomposition might be dominated by POM, which is not conducive to the storage of OM in sediments. It means that the capacity of sediments as a carbon sink will be weakened under global warming (increasing typhoon events).

How to cite: Chen, F. and Lao, Q.: Characteristics and Mechanisms of Typhoon-Induced Decomposition of Organic Matter and Its Implication for Climate Change, EGU General Assembly 2024, Vienna, Austria, 14–19 Apr 2024, EGU24-1951, https://doi.org/10.5194/egusphere-egu24-1951, 2024.

EGU24-2243 | ECS | Posters on site | OS3.1

Promoting effect and mechanism of algae bloom on in situ N2O emission: a case from Zhanjiang Bay, China 

Shangjun Cai, Qibin Lao, Chunqing Chen, Xin Zhou, Sihai Liu, Guangzhe Jin, and Fajin Chen

The algae bloom in the bay can lead to a large amount of N2O in situ production. However, the coupling relationship between N2O and algae bloom and their mechanism in the bay remains unclear. To address this issue, N isotope culture experiment and qPCR experiment were measured in Zhanjiang Bay during the normal period and algae bloom period. The results showed that the in situ N2O production in algae bloom is 3 times than normal period. Stable isotope rate cultivation experiments also indicated that denitrification and nitrification-denitrification were promoted in the water during algae bloom period, but the increase in nitrification-denitrification is more significant. In addition, the main way for in situ N2O production, shifted from denitrification in the normal period to nitrification-denitrification during algae bloom period. The increase of denitrification and nitrification-denitrification during algae bloom period was attributed from the increase  of fresh particulate organic matter (POM) from algae bloom organisms. The increase of fresh POM enhanced the degradation, providing the necessary anaerobic and hypoxic environment for denitrification and nitrification-denitrification. Additionally, a positive linear correlation between N2O concentrations and ammonia-oxidizing bacteria (AOB) and denitrifying bacteria (nirK), provided further evidence of significant nitrification-denitrification and denitrification processes occurring in the water during algae bloom. Our findings contribute to a clearer understanding of mechanism of in situ N2O emission during algae bloom period.

How to cite: Cai, S., Lao, Q., Chen, C., Zhou, X., Liu, S., Jin, G., and Chen, F.: Promoting effect and mechanism of algae bloom on in situ N2O emission: a case from Zhanjiang Bay, China, EGU General Assembly 2024, Vienna, Austria, 14–19 Apr 2024, EGU24-2243, https://doi.org/10.5194/egusphere-egu24-2243, 2024.

EGU24-2295 | ECS | Posters on site | OS3.1

Changes in net primary production in a warming ocean: Examining model projections from coarse resolution to the submesoscale  

Helen Stewart, Rin Irie, Tsuneko Kura, Masaki Hisada, and Keiko Takahashi

Projections from CMIP6 Earth System Models forecast a decline in net primary production (NPP) as the ocean warms up due to climate change. However, for coarse model resolutions of O(105) m, there is still roughly a 2-fold disagreement between models for the magnitude and distribution of NPP in the contemporary era [1]. A recent study using the coupled NEMO-LOBSTER ocean physics-biogeochemistry model projected decline in net primary production halving at an eddy-resolving resolution O(103) m compared to an eddy-parameterized coarse resolution O(105) m in response to ocean warming [2]. In this study, we build on our previous work [3] and simulate changes in biogeochemical parameters using the MITgcm Ocean Physics Model coupled with the Simple Global Ocean Biogeochemistry with Light, Iron, Nutrients and Gas (BLING) Model [4] and examine the reproducibility of the results from the previous study [2].

The ocean physics model in this work uses the hydrostatic primitive equations for an implicit free surface, as described in [5], with a bi-linear equation of state. The simulation domain is a closed basin of size (30 × 30)° with a depth of 4000 m,  representing an idealized portion of the North Atlantic Ocean on a spherical polar grid. Analytical profiles of zonal wind, SST forcing and freshwater flux are applied to fluctuate periodically between summer and winter extrema. Temperature and salinity profiles and are initialized using the 2018 World Ocean Atlas reanalyzed climatologies [6]. Monthly atmospheric iron deposition rates are taken from global chemical transport model estimates from a previous work [7]. Biogeochemical tracer concentrations are initialized from interpolated values from MITgcm tutorial experiments [8]. These initial values are spin-up for each resolution until tracer distributions reach equilibrium.

For an ocean warming scenario of +2.8°C over 70 years, roughly corresponding to the SSP8.5 scenario [9], mechanisms for changes in NPP, plankton biomass and nutrient distributions at resolutions of O(105) m, O(104) m, and O(103) m are examined and compared with the previous study [2]. In the future we plan to extend experiments to examine the effect of changing ocean winds and rainfall on ocean biogeochemistry.

Acknowledgements
This work used computational resources of supercomputer Fugaku provided by the RIKEN Center for Computational Science through the HPCI System Research Project (Project ID: hp230382).

References
[1] Tagliabue, A. et al (2021). Frontiers in Climate 3. doi: 10.3389/fclim.2021.738224
[2] Couespel, D. et al. (2021). Biogeosciences 18.14, pp. 4321–4349. doi: 10.5194/bg-18-4321-2021.
[3] Stewart, H. et al (2023). EGU General Assembly 2023, Vienna, Austria, 23–28 Apr 2023, EGU23-11212, https://doi.org/10.5194/egusphere-egu23-11212, 2023.
[4] Dunne, J. P. et al. (2020) Journal of Advances in Modeling Earth Systems 12.10, e2019MS002008. doi: 10.1029/2019MS002008.
[5] Marshall, J. et al. (1997). Journal of Geophysical Research: Oceans 102.C3, pp. 5733–5752. doi: 10.1029/96JC02776.
[6] Garcia, H.E. et al. (2019). World Ocean Atlas 2018.
[7] Fan, S-M et al. (2006).  Geophysical Research Letters 33.7. doi: 10.1029/2005GL024852.
[8] MITgcm User Manual: 4.10 Biogeochemistry Simulation. (Accessed Jan 2024). http://mitgcm.org.
[9] Tokarska, K. B. et al. (2020). Science Advances 6.12, eaaz9549. doi: 10.1126/sciadv.aaz9549.

How to cite: Stewart, H., Irie, R., Kura, T., Hisada, M., and Takahashi, K.: Changes in net primary production in a warming ocean: Examining model projections from coarse resolution to the submesoscale , EGU General Assembly 2024, Vienna, Austria, 14–19 Apr 2024, EGU24-2295, https://doi.org/10.5194/egusphere-egu24-2295, 2024.

EGU24-2725 | Orals | OS3.1

Seafloor Cold Seeps as Crucial Mediators of Arsenic Enrichment in Deep Sea 

Jiwei Li, Xiyang Dong, and Xiaotong Peng

Seafloor cold seepage systems are environments known for their high levels of arsenic, a prevalent and toxic metalloid in nature. However, the biogeochemical mechanisms of arsenic enrichment remain poorly understood. In this study, sediment cores recovered from the active, inactive, and reference areas of the Hama cold seep in the South China Sea were examined using geochemical and metagenomic analyses. Geochemical data revealed evident enrichment of total arsenic, sulfide-bound arsenic, and organic arsenic in the seep site sediments compared to the reference area. Metagenomic analyses identified genes involved in arsenic oxidation (aoxA and arxA) primarily present in the upper zone, while arsenic reduction genes (arrA) were predominantly detected in the deeper zone of the sediment cores in the active area. Moreover, 25 metagenome-Assembled Genomes possessing arsenic reduction genes were affiliated with the Desulfobacterota, possibly syntrophic partners of the Anaerobic Methane Oxidizing Archaea. Furthermore, a strong linear correlation was observed between the dissolved arsenic and DIC (R2=0.64, p<0.01) and δ13CDIC values (R2=0.86, p<0.01) in the active area. These results suggest a synergistic relationship between arsenate reduction and methane oxidation, possibly indicating the occurrence of AsR-AOM, within the sediment column of the active seep site. Combining this with the Fe and Mn geochemistry, we propose that arsenic was efficiently transported from the seawater column to the sediment column through rapid and continuous redox cycling of Mn and Fe, then stored in the sediment columns by HS-, which is produced by bacterially mediated sulfate reduction. In summary, these findings indicate that cold seepage systems function as crucial sink for arsenic in the deep ocean, which would create arsenic-deficient seawater environments during the large-scale methane release events in earth histroy.

How to cite: Li, J., Dong, X., and Peng, X.: Seafloor Cold Seeps as Crucial Mediators of Arsenic Enrichment in Deep Sea, EGU General Assembly 2024, Vienna, Austria, 14–19 Apr 2024, EGU24-2725, https://doi.org/10.5194/egusphere-egu24-2725, 2024.

EGU24-2739 | ECS | Orals | OS3.1

Oceanic and Atmospheric Drivers of Post-El-Niño Chlorophyll Rebound in the Equatorial Pacific  

Hyung-Gyu Lim, John Dunne, Charles Stock, Paul Ginoux, Jasmin John, and John Krasting

The El Niño-Southern Oscillation (ENSO) strongly influences phytoplankton in the tropical Pacific, with El Niño conditions suppressing productivity in the equatorial Pacific (EP) and placing nutritional stresses on marine ecosystems. The Geophysical Fluid Dynamics Laboratory's (GFDL) Earth System Model version 4.1 (ESM4.1) captures observed ENSO-chlorophyll patterns (r = 0.57) much better than GFDL's previous ESM2M (r = 0.23). Most notably, the observed post-El Niño “chlorophyll rebound” is substantially improved in ESM4.1 (r = 0.52). We find that an anomalous increase in iron propagation from western Pacific (WP) subsurface to the cold tongue via the equatorial undercurrent (EUC) and subsequent post-El Niño surfacing, unresolved in ESM2M, is the primary driver of chlorophyll rebound. We also find that this chlorophyll rebound is augmented by high post-El Niño dust-iron deposition anomalies in the eastern EP. This post-El Niño chlorophyll rebound provides a previously unrecognized source of marine ecosystem resilience independent from the La Niña that sometimes follows.

How to cite: Lim, H.-G., Dunne, J., Stock, C., Ginoux, P., John, J., and Krasting, J.: Oceanic and Atmospheric Drivers of Post-El-Niño Chlorophyll Rebound in the Equatorial Pacific , EGU General Assembly 2024, Vienna, Austria, 14–19 Apr 2024, EGU24-2739, https://doi.org/10.5194/egusphere-egu24-2739, 2024.

EGU24-2748 | Orals | OS3.1

Marginal sea-ice is not a major source of iron to support spring blooms in the South Atlantic 

Alakendra Roychoudhury, Kayla Buchanan, and Saumik Samanta

In the South Atlantic HNLC regions, productivity limitation is largely attributed to light in combination with the unavailability of micro-nutrients, mainly dissolved iron (dFe). Many of these regions fall within the dynamic marginal ice zone (MIZ), which are highly vulnerable to future change in climate where in the past decades Southern Ocean is absorbing more heat than the polar north. It is hypothesized that sea-ice formed in winter concentrates macro- and micro-nutrients and serves as their source, on melting, to surface waters in spring to support phytoplankton blooms, where dFe concentrations can be less than 0.1 nM. For the logistical difficulties in accessing these remote areas, especially in winters, and analytical challenges, sea ice as a source or sink of micro-nutrients in these remote regions has remained understudied and only ~78 dFe usable data is available for the entire Southern Ocean sea-ice.

Sea-ice cores were collected in winter and spring from South Atlantic MIZ and analyzed for dissolved and particulate iron (pFe) along with other ancillary data. Ice-core depth profiles of dFe show a typical C-shape with higher dFe concentrations at the top and bottom of the core. dFe profiles did not follow the salinity profiles, suggesting external input of Fe at the top and bottom of the core and not brine drainage. The average concentration of dFe (0.53 ± 0.64 nmol kg-1; n = 34) in sea-ice remained consistently lower than pFe (3.82 ± 2.42 nmol kg-1; n = 11) and there was considerable heterogeneity even in replicate cores collected from the same floe. The measured concentrations translate into a total iron flux (TFe) of 38.05 ± 27.49 mol y-1 (n = 45) in South Atlantic MIZ. Both measured species show regularly lower concentrations than what has been measured from other regions of the Southern Ocean, resulting in the calculated flux from the studied MIZ being 30 times lower than what has been calculated from melting of near shelf ice. 

Experiments conducted in the laboratory show that majority of the dissolved iron accumulated in sea-ice is released within the first 10% of melting but with complete melting and mixing, resulting net dFe concentrations fall within the Fe-limiting conditions. pFe, although available at higher concentrations in sea-ice, had lower Fe/Al ratio compared to the typical crustal ratio. That is, a more refractory phase is released on melting of sea-ice, which is not ideal for uptake by phytoplankton. 

How to cite: Roychoudhury, A., Buchanan, K., and Samanta, S.: Marginal sea-ice is not a major source of iron to support spring blooms in the South Atlantic, EGU General Assembly 2024, Vienna, Austria, 14–19 Apr 2024, EGU24-2748, https://doi.org/10.5194/egusphere-egu24-2748, 2024.

EGU24-4689 | ECS | Orals | OS3.1

The early fate of hydrothermal Fe nano-colloids at the Rainbow Hydrothermal Vent Field 

Lotta Ternieten, Martina Preiner, Peter Kraal, and Oliver Plümper

Motivated by the goal to increase our knowledge of the impact of hydrothermal iron (Fe) nanoparticles on ocean chemistry and to explore their unique catalytic capabilities, we sampled suspended and dissolved matter in the water column above the Rainbow (36°-33°N) hydrothermal vent field at the Mid-Atlantic Ridge. Innovative sampling techniques were used to constrain the (trans)formation of hydrothermal iron-based nanoparticles. Instead of filtration of plume particles, freezing, and later resuspension, which is commonly used to separate particles from their surrounding solution and preserve them1, we immediately drop cast small amounts of the fluid on transmission electron microscopy (TEM) grids and plunge-freeze them, resulting in vitrification of dissolved compounds and preservation of containing nanoparticles. Using an array of (micro)spectroscopic techniques, TEM, and a machine learning approach, we can characterize the Fe nanoparticles and unravel their fate in the ocean biogeochemical cycle.

Initial results show that the new sampling approach allows us to successfully collect Fe colloids with minimal artifacts – specifically avoiding aggregation of various suspended phases during filtration, which can result in spurious spatial correlations. The hydrothermal plume samples collected closest to an active vent show crystalline spherical Fe-nanoparticles that predominantly consist of poorly-ordered Fe-oxyhydroxide and are in parts enriched in P, S, Ni, and/or Cu. Using the machine learning model SIGMA2 further allows us to explore the distribution of distinct Fe phases and reveals the local occurrence of reduced Fe as chalcopyrite and pyrite. On the outside, the Fe-nanoparticles are covered with an amorphous phase enriched in Mg, Cl, ± P, and S. Amorphous silica clusters are omnipresent and often co-occur with the Fe colloids. Notably, our results do not show associations of Fe with (organic) carbon.

These observations suggest that a higher local concentration of P within the Fe-colloids is potentially a crucial component affecting the Fe-nanoparticle's properties and environmental fate. Furthermore, this shows that C-rich phases do not significantly affect, at least in the early stages, the particles at the Rainbow vent field, contrasting previous studies, which suggest that organic compounds play a key role in stabilizing and transporting hydrothermal Fe1,3. While Si is abundant in the hydrothermal fluid and often interacts with Fe precipitates similar to P, we show spatial decoupling suggestive of a distinct precipitation mechanism. Neither in the hydrothermal plume away from the active vent nor in the sediment did we observe much transformation of the poorly-ordered Fe-colloids, suggesting that these were stable early on. However, we do observe an enrichment in organic compounds associated with the Fe-colloids further up in the buoyant plume.

Our research presents the first indications that during the early formation of hydrothermal Fe colloids, the properties of the Fe-based nanoparticle and, subsequently, the environmental fate and impact are more likely affected by P and Si than by organic carbon compounds.


1. Toner, B. M., et al. Acc. Chem. Res. 49, 128–137 (2016).

2. Tung, P., et al. Geochem., Geophys., Geosystems 24, (2023).

3. Bennett, S. A. et al. Deep Sea Res. Part : Oceanogr. Res. Pap. 58, 922–931 (2011).

How to cite: Ternieten, L., Preiner, M., Kraal, P., and Plümper, O.: The early fate of hydrothermal Fe nano-colloids at the Rainbow Hydrothermal Vent Field, EGU General Assembly 2024, Vienna, Austria, 14–19 Apr 2024, EGU24-4689, https://doi.org/10.5194/egusphere-egu24-4689, 2024.

EGU24-5020 | ECS | Posters on site | OS3.1

Predictability of Metabolic index and its application to fish catch prediction 

Hwa-Jin Choi, Jong-Yeon Park, and Charles Stock

Climate change has caused shifts in the abundance, geographic distribution, and phenology of marine species. Spatial shifts of species due to global warming will cause a high local extinction rate and decrease fisheries catch and species richness at tropical latitudes. Predicting the migration of marine organisms in response to climate change holds significance not just from an ecological perspective, but also from an economic standpoint in terms of effectively managing marine living resources. This study investigates the predictability of metabolically viable habitats by utilizing an Earth system model (ESM) that incorporates a coupled physical-biogeochemical prediction system. The metabolic index, previously defined with dissolved oxygen and temperature, has a higher predictability compared to temperature, particularly in the subsurface tropics. The primary factor contributing to the high predictability of the metabolic index is the longer persistency of lateral oxygen advection at the boundary of the tropical oxygen minimum zone. Further investigations indicate that the interannual fluctuations in the catch of bigeye tuna within the exclusive economic zones (EEZs) in tropical regions can be predicted based on the metabolic index forecasted one year ahead, implying the potential application of ESM-based physiological prediction to dynamic management of marine living resources.

How to cite: Choi, H.-J., Park, J.-Y., and Stock, C.: Predictability of Metabolic index and its application to fish catch prediction, EGU General Assembly 2024, Vienna, Austria, 14–19 Apr 2024, EGU24-5020, https://doi.org/10.5194/egusphere-egu24-5020, 2024.

EGU24-5943 | ECS | Orals | OS3.1

Dissolved organic carbon dynamics in a changing ocean: A COBALTv2 Earth System Model analysis 

Lana Flanjak, Aaron Wienkers, and Charlotte Laufkötter

Dissolved organic carbon (DOC) is a substantial pool of bioreactive carbon in the ocean, comparable in quantity to the atmospheric inorganic carbon reservoir. DOC plays an important role in the marine carbon cycle; its contribution to total organic carbon export corresponds to about 20%. Current modeling studies suggest a broad range of DOC surface concentration estimates, and the response of DOC concentration and export to climate change is unclear and has not yet been described in an Earth System Model. To address this knowledge gap, we make use of the ocean biogeochemistry and ecosystem model COBALTv2. We analyze DOC dynamics and export under the present and future climate conditions within the high-emission scenario. The COBALTv2 model, coupled to the GFDL’s ESM2M Earth System Model, enables us to trace DOC from its primary sources, including phytoplankton activity and grazer-prey dynamics, to its sinks such as bacterial remineralization. We also account for the physical processes such as advection that influences DOC distribution. Preliminary findings suggest that the current distribution of DOC in the ocean may undergo significant changes, contingent upon the biological sources and sinks that are sensitive to ocean temperature increases. The relative contributions of different phytoplankton groups to DOC production are expected to shift across various ocean regions, along with the magnitude of heterotrophic respiration, which is the predominant DOC sink. This study contributes to understanding and forecasting of potential shifts in oceanic DOC dynamics under current and future climate conditions.

How to cite: Flanjak, L., Wienkers, A., and Laufkötter, C.: Dissolved organic carbon dynamics in a changing ocean: A COBALTv2 Earth System Model analysis, EGU General Assembly 2024, Vienna, Austria, 14–19 Apr 2024, EGU24-5943, https://doi.org/10.5194/egusphere-egu24-5943, 2024.

The ocean and land biosphere are the two major natural sinks of carbon at present and the ocean is projected to become the dominant sink on centennial timescales when anthropogenic carbon emissions become zero and temperatures stabilize, and. Despite the ocean’s importance for the carbon cycle and climate, uncertainties of the decadal variability of this carbon sink and the underlying drivers of this decadal variability remain uncertain. The main tools to assess the ocean carbon sink over the last decades are global observation-based pCO2 products that extrapolate sparse pCO2 observations in space and time and global ocean biogeochemical models forced with atmospheric reanalysis data. However, these tools (i) are limited in time over the last 3 to 7 decades, which hinders statistical analyses of the drivers, (ii) are all based on the same internal climate state, and (iii) cannot assess the robustness of the drivers in the future, especially when carbon emissions decline or cease entirely. Here, I use an ensemble of 12 Earth System Models (ESMs) from phase 6 of the Coupled Model Intercomparison Project (CMIP6) to understand drivers of decadal trends in the past, present and future ocean carbon sink. The simulations by these ESMs span a period of 251 years and include 4 different future Shared Socioeconomic Pathways, from low emissions and high mitigation to high emissions and low mitigation. Using this ensemble, I show that 80% of decadal trends in the multi-model mean ocean carbon sink can be explained by changes in decadal trends of atmospheric CO2 as long as the ocean carbon sink remains smaller than 4.5 Pg C yr-1. The remaining 20% are due to internal climate variability and ocean heat uptake, which results in a loss of carbon from the ocean. When the carbon sink exceeds 4.5 Pg C yr-1, atmospheric CO2 rises faster, climate change accelerates, and decadal trends in the ocean carbon sink are substantially smaller than estimated based on changes in atmospheric CO2 trends. The breakdown of this relationship under high emission scenarios, also implies that the increase in the ocean carbon sink is effectively limited, even if the trend in atmospheric CO2 continues to increase. This limit of decadal trends in the ocean carbon sink is here estimated to be 1 Pg C yr-1 dec-1.Previously proposed drivers, such as the atmospheric CO2 or the growth rate of atmospheric CO2 can explain trends in the ocean carbon sink for specific time periods, for example during exponential atmospheric CO2 growth, but fail when emissions start to decrease again. The robust relationship over a large Earth System Model ensemble also suggests that very large  positive and negative decadal trends of the ocean carbon sink by some pCO2 products are highly unlikely, and that the change in the decadal trends of the ocean carbon sink in 2000 is likely substantially smaller than estimated by these pCO2 products.

How to cite: Terhaar, J.: Decadal trends of the ocean carbon sink in Earth System Models in the past, present and future, EGU General Assembly 2024, Vienna, Austria, 14–19 Apr 2024, EGU24-6435, https://doi.org/10.5194/egusphere-egu24-6435, 2024.

EGU24-6464 | Posters on site | OS3.1

Impact of tropical cyclones on ocean biogeochemistry in a high resolution Earth system model 

Fatemeh Chegini, David Nielsen, Mariana Salinas, Lucas Casaroli, Nils Brüggemann, Cathy Hohenegger, and Tatiana Ilyina

Tropical cyclones (TCs) and oceans are a tightly coupled system. On the one hand, the ocean physical conditions such as stratification and eddies can change the intensity of TCs. On the other, TCs can strongly affect the physical and biochemical structure of the upper ocean by e.g. increasing mixing and primary production and impacting the ocean pCO2.

While previous studies have explored the impact of TCs on the global upper ocean biogeochmistry using observational data or coarse resolution stand-alone ocean models, their effect on ocean pCO2 and primary production remain unexplored within Earth system models. In this study, we investigate the response of ocean biogeochemistry to TCs through a high resolution simulation using the ICON-ESM model. The simulation features a spatial resolution of 5km for both the atmosphere and the ocean, resolving mesoscale eddies in the ocean and convective storms in the atmosphere. We quantify the contribution of TCs to changes in air-sea CO2 flux and primary production globally and in different basins.

How to cite: Chegini, F., Nielsen, D., Salinas, M., Casaroli, L., Brüggemann, N., Hohenegger, C., and Ilyina, T.: Impact of tropical cyclones on ocean biogeochemistry in a high resolution Earth system model, EGU General Assembly 2024, Vienna, Austria, 14–19 Apr 2024, EGU24-6464, https://doi.org/10.5194/egusphere-egu24-6464, 2024.

EGU24-7254 | ECS | Orals | OS3.1

Global marine ecosystem response to a strong AMOC weakening under low and high emission scenarios 

Amber A. Boot, Jeroen Steenbeek, Marta Coll, Anna S. von der Heydt, and Henk A. Dijkstra

Marine ecosystems provide several important services for the Earth System and society in the form of, for example, carbon export, food and income. These ecosystems, and the functions they provide, are under threat from anthropogenic climate change, pollution and overfishing.  Besides being a large risk for marine ecosystems, anthropogenic climate change might also lead to passing tipping points in the Earth System, leading to relatively fast and strong additional changes to the climate system.  A tipping element in the Earth System is the Atlantic Meridional Overturning Circulation (AMOC). Tipping of the AMOC will disrupt the climate system and lead to changes in temperature, precipitation, wind fields, ocean circulation and the carbon cycle. In this study, we look at the effect of a strong AMOC weakening on global marine ecosystems. We do this by forcing a state-of-the-art model, the Community Earth System Model v2 (CESM2), with low (SSP1-2.6) and high (SSP5-8.5) emission scenarios, and with an additional freshwater flux in the North Atlantic from 2015 to 2100. Since the ecosystem component of the CESM2 is limited, we use the CESM2 output in a marine ecosystem model, EcoOcean v2. EcoOcean simulates 52 functional groups including mammals, birds, zooplankton, benthic species and fish on a 1° horizontal grid, and reconciles food web dynamics with a dynamic niche model. EcoOcean is forced with phytoplankton biomass and temperature fields from the CESM2 simulations and this enables us to determine the effect of the AMOC weakening in CESM2 on marine ecosystems. In CESM2, the weakening of the AMOC has a large impact on phytoplankton biomass and temperature fields through various mechanisms including changes in stratification and mixed layer depth, changes in sea-ice cover, and changes in upwelling velocities. Through these mechanisms, the three dimensional distribution of nutrients in the ocean is altered which directly affects the primary producers in CESM2. In EcoOcean, we see that almost all functional groups are negatively impacted by an AMOC weakening. The strongest net effect is seen in the high emission scenario, but the relative effect of the AMOC weakening is larger in the low emission scenario.  There are some functional groups, e.g. pinnipeds, that show a strong decrease that closely follows the AMOC weakening. These results show that marine ecosystems will be under increased threat if the AMOC strongly weakens. Furthermore, the results show how tipping in the climate system can negatively impact marine ecosystems and thereby put an additional stress on socio-economic systems that are dependent on fishery industries as a food and income source.  

How to cite: Boot, A. A., Steenbeek, J., Coll, M., von der Heydt, A. S., and Dijkstra, H. A.: Global marine ecosystem response to a strong AMOC weakening under low and high emission scenarios, EGU General Assembly 2024, Vienna, Austria, 14–19 Apr 2024, EGU24-7254, https://doi.org/10.5194/egusphere-egu24-7254, 2024.

Seasonal-interannual climate change is an important component of Earth’s climate system and has a significant impact on ecosystems and social systems. However, the scarcity of modern observational data limits our understanding of the seasonal-interannual climates in long-term timescales. The natural archives can provide information on climate change before the industrial period, but most of their temporal resolution is too low to capture the seasonal-interannual climate signals. Tridacna spp. is the largest marine bivalve, and its shell has the potential to trace climatic/environmental changes on a daily to interannual scale. In this study, we have investigated the daily growth pattern of modern Tridacna gigas shell (PL-1) from Palau based on laser scanning confocal microscopy images. The results showed that the growth pattern of PL-1 was affected by OLR primarily on the seasonal timescale. On the interannual timescale, the growth rate of the shell was modulated by ENSO through the changing OLR, SLH, and upwelling, which affect the effective solar radiation and nutrients accepted by Tridacna. The growth rate of Tridacna PL-1 is accelerated during the ENSO positive phase, and vice versa. This study indicates that the daily growth rate of Tridacna shells in equatorial regions may have the potential to reconstruct seasonal-interannual climate/environment variations.

How to cite: Wen, H.: Seasonal to interannual variations of daily growth rate of Tridacna shell from Palau Island, western Pacific, and their paleoclimatic implication, EGU General Assembly 2024, Vienna, Austria, 14–19 Apr 2024, EGU24-7699, https://doi.org/10.5194/egusphere-egu24-7699, 2024.

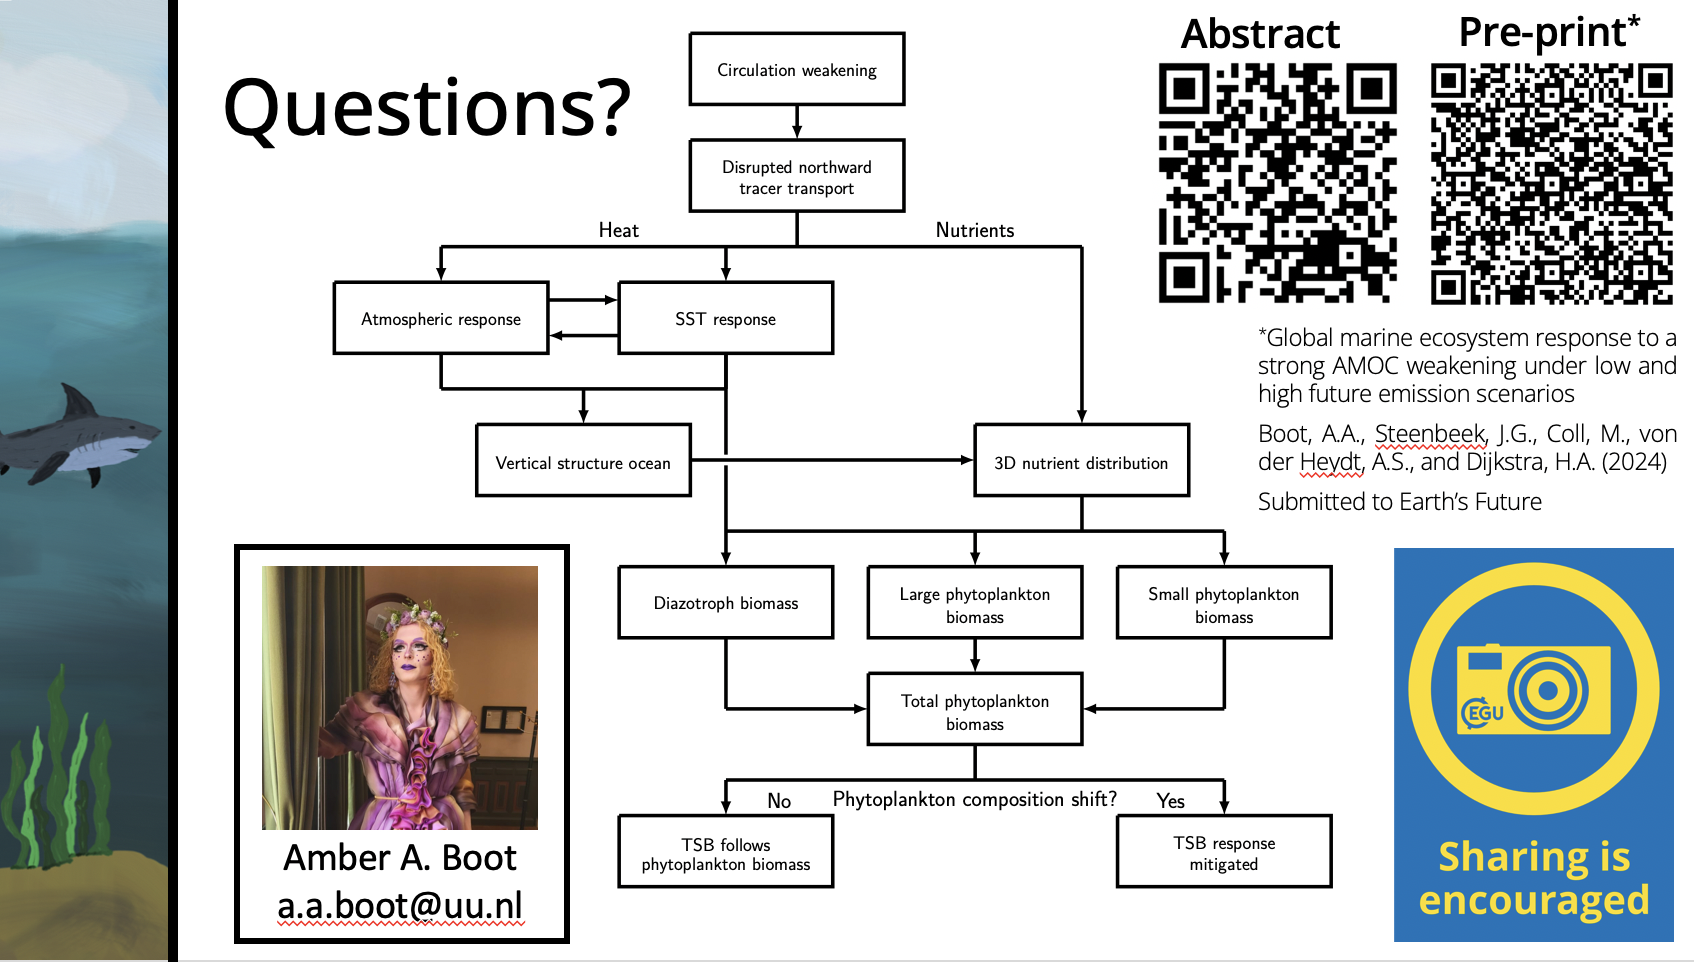
EGU24-7817 | ECS | Posters on site | OS3.1

Changes in the timing of phytoplankton blooms: comparison between northern and southern Adriatic 

Martin Vodopivec, Janja France, Nenad Jasprica, Nika Pasković, Mirna Batistić, and Patricija Mozetič

The phenology of phytoplankton blooms holds significant implications for marine ecosystems as it shapes pelagic food webs. The onset, intensity, and duration of phytoplankton blooms, along with their synchronization with zooplankton cycles, can impact the survival rates of these species and overall community production. In this study, we employ a combination of in situ and satellite-derived chlorophyll concentrations, utilizing various statistical methods to discern the presence and timing of spring and autumn blooms in different regions of the Adriatic Sea. The northern Adriatic (NA) represents a coastal, river-dominated ecosystem influenced by anthropogenic nutrient enrichment, with a recent decline observed in chlorophyll concentration and primary production. Conversely, the southern Adriatic (SA) is characterized as a true pelagic ecosystem with minimal influence from coastal waters on nutrient levels. Here, primary production is primarily controlled by meteorological conditions that dictate convective mixing and nutrient availability for autotrophic uptake. Our analysis reveals that the northern Adriatic predominantly experiences both spring and autumn blooms, whereas the southern Adriatic witnesses only autumn blooms, peaking in late autumn or winter. We investigate trends in the timing of the onset and peak of phytoplankton blooms, searching for environmental factors influencing these shifts. As anticipated, the onset of the autumn bloom is found to be delayed, with statistically significant trends observed in specific areas. It is worth noting that the lack of statistical significance in some instances may be attributed, at least in part, to the relatively short period of available satellite data (from 1997 onwards).

How to cite: Vodopivec, M., France, J., Jasprica, N., Pasković, N., Batistić, M., and Mozetič, P.: Changes in the timing of phytoplankton blooms: comparison between northern and southern Adriatic, EGU General Assembly 2024, Vienna, Austria, 14–19 Apr 2024, EGU24-7817, https://doi.org/10.5194/egusphere-egu24-7817, 2024.

EGU24-7894 | Orals | OS3.1

Reevaluating progress and uncertainties associated with projections of ocean net primary production and acidification  

Lester Kwiatkowski, Laurent Bopp, Olivier Torres, James Orr, and Alessandro Tagliabue

Net primary production (NPP) by marine phytoplankton transfers organic matter and energy to higher tropic levels, supporting ocean food webs, as well as enhancing ocean carbon sequestration. Conversely, ocean acidification is a consequence of anthropogenic carbon uptake and alongside wide-ranging ecosystem impacts, reduces the capacity of the ocean to absorb future anthropogenic emissions. Multi-model projections of NPP (including those of CMIP exercises) have typically had very high associated uncertainty, with model uncertainty generally exceeding scenario uncertainty and limited confidence in even the sign of twenty-first century change. In contrast, projections of acidification have often been portrayed as having almost no associated uncertainty for a given emissions scenario. Here I will reassess these divergent characterizations. Can we say anything about projected changes in ocean NPP with confidence? And do we have any novel insights into projected ocean acidification? Efforts to constrain model projections of NPP have been challenging, with a dramatic increase in global projection uncertainty in CMIP6. Past efforts, which used the observable sensitivity of NPP to ENSO variability to constrain the multi-model NPP response to climate change, have been shown to have their limitations. Notably, parameterizations of marine diazotrophy and phytoplankton iron requirements can both limit the applicability of such emergent constraints. Nonetheless, at regional scales there is often broad agreement across multi-model NPP projections. With respect to acidification, the apparent lack of projection uncertainty is often a result of focusing on the annual mean global surface ocean. Numerous recent advances have been made in understanding regional and subsurface acidification as well as characterizing how the temporal variability of the ocean carbonate system is likely to respond. Particularly notable is the Arctic Ocean, where the amplitude and phasing of the seasonal cycle of CO2 partial pressure are projected to modify in response to both the geochemical and radiative impacts of anthropogenic emissions.

How to cite: Kwiatkowski, L., Bopp, L., Torres, O., Orr, J., and Tagliabue, A.: Reevaluating progress and uncertainties associated with projections of ocean net primary production and acidification , EGU General Assembly 2024, Vienna, Austria, 14–19 Apr 2024, EGU24-7894, https://doi.org/10.5194/egusphere-egu24-7894, 2024.

Human-induced climate change is expected to have a significant impact on primary production in the world's oceans, affecting marine ecosystems and the biological carbon pump. The sixth phase of the Coupled-Models Intercomparison Project (CMIP6) provides a common tool for investigating this impact. However, the extent and direction of the impact can vary widely among these models, partly due to the diverse representations of oceanic biogeochemistry. A comprehensive analysis of the biogeochemistry component in each model is therefore crucial for understanding the origins of diverse responses to similar environmental forcings. In this context, we focused on primary production projections in the subtropical North Atlantic Ocean under the RCP5-8.5 scenario in eight CMIP6 models. To ensure comparability across models with different ocean dynamics, a subtropical region was constructed in the observations using satellite and in-situ measurements from 2000 to 2020. A classification procedure based on a Self-Organizing Maps algorithm was applied to the entire North Atlantic Ocean, and the resulting classification was then used to identify the closest subtropical region in each model. While the eight regions obtained were similar in terms of location and physical boundaries, their surfaces varied from 19.1 to 24.1 million km². Among the eight models, three projected an increase in primary production in the region (up to +19.5 g-C/m2/yr), while the remaining five predicted a decrease (down to -33.4 g-C/m2/yr), despite a consistent decrease of nitrate concentrations across models. Nitrogen fixation, a crucial source of nitrogen in the area, emerged as a key differentiating factor among these models. Three of them (IPSL-CM6A-LR, CanESM5-CanOE, CanESM5) featured an implicit representation of diazotrophy, with no effective control from other nutrients. This led to a substantial increase in nitrogen fixation under the influence of rising temperatures. In IPSL-CM6A-LR and CanESM5-CanOE, the heightened nitrogen fixation sustained ammonium concentrations, enabling an increase in primary production with NH4 serving as an alternative nitrogen source. However, in CanESM5, where only one nitrogen pool was represented, the increase in nitrogen fixation was insufficient to offset the nitrogen decrease, resulting in a decline in primary production. In the models with an explicit representation of diazotrophs (MPI-ESM1-2-LR, CESM2, CESM2-WACCM), primary production was limited by declining phosphate concentrations, leading to a decrease in both nitrogen fixation and primary production. Finally, in models without any representation of nitrogen fixation, primary production decreased when nutrients were initially limiting (UKESM1-0-LL) and increased if they were not (ACCESS-ESM1-5). In conclusion, biogeochemical models with a more realistic representation of diazotrophy consistently projected a decline in primary production in the subtropical North Atlantic Ocean throughout the 21st century. The increases observed in some models were attributed to the absence or inadequate representation of interactions between phosphate, ammonium, and diazotrophy, making such scenarios unlikely. Consequently, an explicit representation of diazotrophs seems necessary for projecting the primary production response to climate change in the subtropical North Atlantic Ocean.

How to cite: Doléac, S., Lévy, M., and Bopp, L.: Nitrogen fixation as a key diverging factor of primary production projections in the subtropical North Atlantic Ocean in CMIP6 models, EGU General Assembly 2024, Vienna, Austria, 14–19 Apr 2024, EGU24-9341, https://doi.org/10.5194/egusphere-egu24-9341, 2024.

EGU24-10594 | Posters on site | OS3.1

Interannual and regional variability in winter nutrient concentrations in Icelandic Waters 

Solveig Olafsdottir, Alice Benoit-Cattin, and Jon Olafsson

We present spatial and temporal patterns of nutrients concentrations from February observations from two hydrographically different regions in the high latitude North-Atlantic: The northern Irminger Sea and the Iceland Sea. Our observations are from two time-series stations located off the continental shelf and from stations on the shelf. The Irminger Sea, southwest of Iceland, is primarily in the realm of Atlantic Water derived from the North Atlantic Current. The Iceland Sea is north of the Greenland-Iceland-Faroe Ridge separating the Nordic Seas from the sub-arctic North Atlantic. Both regions undergo strong seasonal variations and winter mixing is induced by strong winds and loss of heat to the atmosphere. The winter mixed layer depth is found to be variable in the Irminger and Iceland Seas, but it reaches much deeper in the Atlantic Water of the Irminger Sea as a halocline limits the vertical convection in the Arctic Waters of the Iceland Sea. Consequently, the winter mixed layer depths in the two regions range from or 300-700 m and 150-250 m respectively. The nutrient concentrations in the surface layer that result from the winter vertical mixing vary interannually and there is a significant spatial difference between the two regions where the long term (1991-2020) average for the nitrate concentration is 14.4 µmol kg-1 in the Atlantic Water and 10.3 µmol kg-1 in the Arctic Waters. Higher spatial differences are in the silicate concentration, in the Atlantic Water the long-term average concentration is 6.8 µmol kg-1 and 4.0 µmol kg-1 in the Arctic Water. The interannual variations in the relative abundance of nitrate and silicate, the Si/N ratio, are likely to influence the productivity of silicious diatoms in the spring bloom. Nutrient concentrations at the end of winter on the shelf are also high, they reflect the state of the offshore waters. Our observations show hydrographic changes that have induced significant biogeochemical changes in these regions.

How to cite: Olafsdottir, S., Benoit-Cattin, A., and Olafsson, J.: Interannual and regional variability in winter nutrient concentrations in Icelandic Waters, EGU General Assembly 2024, Vienna, Austria, 14–19 Apr 2024, EGU24-10594, https://doi.org/10.5194/egusphere-egu24-10594, 2024.

EGU24-11030 | ECS | Orals | OS3.1

Co-evolution of the oceans and inorganic carbon cycle 

Ruby Barrett, Ann Power, Paul Halloran, and Daniela Schmidt

The Cenozoic shift from a hothouse to icehouse provides a natural experiment to explore how a changing climate and macroevolutionary trends control marine pelagic carbonate production and burial. In the modern ocean, the key components of pelagic carbonate burial — planktic foraminifera and coccolithophores — contribute approximately evenly. However, in the past, coccolithophores dominated open ocean inorganic carbon burial. Exactly when and why this shift away from a coccolithophore dominated ooze occurred is unresolved. To this end, we reconstructed a 65Myr record of foraminifer to nannofossil ratios from sites covering the Pacific, Southern, Indian, and Atlantic Ocean. To better understand the climate and macroevolutionary controls on carbonate production, we move away from the commonly reported bulk changes and instead investigate the individual components of carbonate production:  foraminiferal and coccolithophore size, weight and abundance. We use a suite of methodologies to extract these data, including the novel application of imaging flow cytometry to rapidly and digitally reconstruct the fossil record of coccolithophore size and abundance. Our ratio data shows a shift towards calcareous zooplankton during the Neogene. Initial qualitative analysis reveals that coccolithophore size is relatively smaller in the modern part of the record, whilst automated microscopy shows that modern subtropical and tropical foraminiferal size is greater than recorded in the previous 65Myr. Foraminiferal size-normalised weight (SNW) is expected to be higher in the modern ocean than in the past due to its suggested carbonate system control (i.e. higher carbonate ion concentrations being conducive to heavier tests). However, SNW data from a high latitude site during the Palaeogene are similar to modern values for extant species – potentially implying something other than a carbonate system control on SNW.

How to cite: Barrett, R., Power, A., Halloran, P., and Schmidt, D.: Co-evolution of the oceans and inorganic carbon cycle, EGU General Assembly 2024, Vienna, Austria, 14–19 Apr 2024, EGU24-11030, https://doi.org/10.5194/egusphere-egu24-11030, 2024.

EGU24-11155 | ECS | Orals | OS3.1

Paleogeographic impacts on the ocean biogeochemistry during the mid-Miocene 

Yousheng Li, Alexander Farnsworth, and Paul Valdes

Projections for the future under high scenarios using state-of-the-art Earth System Models suggest a warmer climate for both the land and the ocean, and this leads to ocean acidification globally and ocean deoxygenation. Strengthened denitrification and anammox from Oxygen Minimum Zones (OMZs) or hypoxic coastal areas would possibly enhance nitrous oxide emissions which is one of the main greenhouse gases (GHGs). However, the global dynamics of nitrous oxide are largely uncertain. Considering current emission rates, revisiting past warm periods (e.g., the Paleocene-Eocene Thermal Maximum and the Mid-Miocene Climatic Optimum) would improve our understanding of the biogeochemical-climate feedback. One of the uncertainties in such studies is the paleogeographic boundary condition which is shown to have significant impacts on the global climate and the ocean circulations. However, to date, few studies have been able to explore how paleogeographic features could impact the ocean biogeochemical processes during past warm periods. We applied a suite of sensitivity simulations with modifications only to the topographic features based on three sets of paleogeographies for the mid-Miocene, namely the Getech, the Scotese, and the Robertsons. We found there are huge differences in the ocean circulation patterns, with the strength of the Atlantic Meridional Overturning Circulation (AMOC) ranging from 0Sv to over 12Sv. We will likely see apparent biogeochemical responses accordingly, especially in tropical upwelling regions and the North Atlantic. Results TBC.

How to cite: Li, Y., Farnsworth, A., and Valdes, P.: Paleogeographic impacts on the ocean biogeochemistry during the mid-Miocene, EGU General Assembly 2024, Vienna, Austria, 14–19 Apr 2024, EGU24-11155, https://doi.org/10.5194/egusphere-egu24-11155, 2024.

EGU24-11441 | Orals | OS3.1

Role of temperature and nutrients as drivers of resource allocation, elemental stoichiometry, metabolism and growth in marine phytoplankton 

Emilio Marañón, Cristina Fernández-González, Solange Duhamel, and Mariona Segura

We have conducted experiments with both laboratory cultures and natural plankton assemblages, together with basin-scale observations across the Atlantic Ocean, to investigate the interactive effects of temperature and nutrient supply on phytoplankton across multiple levels of biological organization, including molecules, cells, populations and communities. Laboratory data indicate that nutrient supply has a stronger effect than temperature on photosynthetic protein abundance, C:N stoichiometry, photosynthesis and growth. Due to changing resource allocation into photosynthetic machinery, the chlorophyll a (chl a) content of cells is strongly dependent on both temperature and nutrient availability, which has implications for the use of chl a concentration as a proxy for phytoplankton biomass in the ocean. Across the tropical and subtropical Atlantic, experimental nutrient enrichment consistently causes an increase in chl a concentration, picoeukaryote abundance and the contribution of small nanophytoplankton to total biomass, all of which take place irrespective of temperature. Light-harvesting capacity is synergistically stimulated by warming and nutrient addition in both picocyanobacteria and picoeukaryotes. The latitudinal variability in elemental composition of different phytoplankton groups, determined on single cells with X-ray microanalysis across the temperate, subtropical and tropical Atlantic, reveals the effect of changing temperature and nutrient supply on C:N:P stoichiometry. Our experimental and observational results suggest that while changes in nutrient supply have a stronger effect than temperature on growth, metabolic rates, community structure and elemental stoichiometry, the warming of the surface ocean may increase the ability of tropical phytoplankton assemblages to exploit events of enhanced nutrient availability. Across multiple levels of biological organization, nutrient limitation tends to reduce the effects of temperature on phytoplankton ecophysiology.

How to cite: Marañón, E., Fernández-González, C., Duhamel, S., and Segura, M.: Role of temperature and nutrients as drivers of resource allocation, elemental stoichiometry, metabolism and growth in marine phytoplankton, EGU General Assembly 2024, Vienna, Austria, 14–19 Apr 2024, EGU24-11441, https://doi.org/10.5194/egusphere-egu24-11441, 2024.

EGU24-11752 | Orals | OS3.1

Projected extreme oligotrophication of the marine ecosystems of the Adriatic Sea 

Lorenzo Mentaschi, Tomas Lovato, Momme Butenschön, Jacopo Alessandri, Leonardo Aragao, Giorgia Verri, Roberta Guerra, Giovanni Coppini, and Nadia Pinardi

The Adriatic Sea is home to diverse marine ecosystems, showing rich biodiversity and distinctive ecological dynamics. Its complex coastal habitats and waters support a variety of species, playing a crucial role in the region's ecology and economy. Understanding the impact of ongoing climate changes on this delicate environment is vital for the basin's future preservation. To address this, we developed a comprehensive biogeochemical model for the entire basin, featuring a horizontal resolution of approximately 2 km and 120 vertical levels. This model is driven by atmospheric, hydrological, and ocean circulation projections from 1992 to 2050, downscaled from one Med-CORDEX model under the RCP8.5 emission scenario, developed within the AdriaClim project. The projected changes between 1992-2011 and 2031-2050 were evaluated in distinct trophic ecoregions identified by means of a k-medoid classification. The results reveal a strong oligotrophication tendency, particularly pronounced in the northern estuarine area. This trend can be largely attributed to a significant decrease in river discharge projected by our modelling system for the rivers of the Po Plain. This scenario of unproductive resources, ongoing warming, salinization, and acidification poses concerns about the long-term resilience of the Northern Adriatic food web structure, adapted to thrive in high trophic conditions. Our study provides the stakeholders with insights into how potential long-term decreases in Northern Adriatic river regimes might impact the marine ecosystem and its future goods and services.

How to cite: Mentaschi, L., Lovato, T., Butenschön, M., Alessandri, J., Aragao, L., Verri, G., Guerra, R., Coppini, G., and Pinardi, N.: Projected extreme oligotrophication of the marine ecosystems of the Adriatic Sea, EGU General Assembly 2024, Vienna, Austria, 14–19 Apr 2024, EGU24-11752, https://doi.org/10.5194/egusphere-egu24-11752, 2024.

EGU24-12177 | ECS | Orals | OS3.1

Mesoscale and submesoscale biogeochemical signatures in a high-resolution ocean model (ICON-O/HAMOCC) 

Lucas Casaroli, Tatiana Ilyina, Nuno Serra, and Fatemeh Chegini
Within the oceanic mesoscale and submesoscale spectral ranges, energetic phenomena unfold which include eddies, fronts, filaments and internal waves. Those intricate features significantly impact the biogeochemical cycles. For instance, they contribute to the vertical transport of nutrients to the euphotic zone, modify the mixed layer depth through vertical displacement of isopycnals, and play a pivotal role in shaping the patchiness of phytoplankton. Many ocean biogeochemical models are constrained by computational resources, limiting their ability to resolve the complex details of high-resolution processes. In this study, we introduce a state-of-the-art ocean biogeochemical model (ICON-O/HAMOCC) with a uniform 10-km resolution. Our results show the impact of vortical structures on oxygen, phytoplankton, and carbon. The model solution highlights a robust signal of Tropical Instability Waves (TIW) in biogeochemical tracers in the Equatorial Pacific. We assess the seasonal and interannual variability of this signal, demonstrating the significant role of eddies in ocean oxygenation and in the carbon cycle.

How to cite: Casaroli, L., Ilyina, T., Serra, N., and Chegini, F.: Mesoscale and submesoscale biogeochemical signatures in a high-resolution ocean model (ICON-O/HAMOCC), EGU General Assembly 2024, Vienna, Austria, 14–19 Apr 2024, EGU24-12177, https://doi.org/10.5194/egusphere-egu24-12177, 2024.

This study employs a high-resolution MITgcm-DIC model at 5 km spatial resolution with climatological forcing to investigate the biogeochemical dynamics of surface dissolved inorganic carbon (DIC) and alkalinity (ALK) over the northern Indian Ocean. The physico-chemical parameters of the model are validated against available observational data to ensure its accuracy. The DIC biogeochemical module is integrated within the model framework, considering multiple DIC sources and sinks, including air-sea CO2 exchange, biological production, and carbonate mineral dissolution. To analyse the influences of various processes within our domain, we focussed on the surface DIC and ALK budgets. This investigation helps us understand the intricate interplay of drivers impacting the budgets. The DIC and ALK budgets are found to be significantly influenced by the counterbalancing effects of advective and diffusive terms. We also assessed the role of biological activity and observed that productivity causes a continuous uptake of CO2, which leads to a reduction in surface DIC. Since freshwater intrusion is an important factor governing the surface dynamics of waters in north Indian Ocean, we examined the impact of freshwater dilution on surface DIC and ALK concentrations. The surface ALK budget is predominantly governed by freshwater flux. The dilution of ALK and DIC is attributed to the influence of both precipitation and river runoff. Regions where evaporation exceeds precipitation and river runoff exhibit an increase in the concentration of these variables. The findings shed light on the regional variations along the north Indian Ocean, providing valuable insights into the dominance and interactions of these mechanisms. This study is valuable for enhancing our understanding of regional carbon cycling dynamics in our domain with implications for global carbon cycle models and climate-related predictions. The findings are relevant not only for the scientific community but also for policymakers and stakeholders concerned with oceanic and environmental health.

How to cite: Madkaiker, K. and Rao, A. D.: Variability and budgets of Dissolved Inorganic Carbon and Alkalinity over the north Indian Ocean using a high-resolution model , EGU General Assembly 2024, Vienna, Austria, 14–19 Apr 2024, EGU24-12796, https://doi.org/10.5194/egusphere-egu24-12796, 2024.

EGU24-14377 | Orals | OS3.1

Future evolution of coral reef carbonate production from a global climate-coral reef coupled model 

Nathaelle Bouttes, Lester Kwiatkowski, Elodie Bougeot, Manon Berger, Victor Brovkin, and Guy Munhoven

Coral reefs are currently under threat due to climate change and ocean acidification. However, future atmospheric CO2 levels, climate change and associated impacts on coral reefs remain uncertain. Critically, corals not only respond to atmospheric and climatic conditions but modify them. The calcification of corals modifies the concentration of dissolved inorganic carbon and total alkalinity in the upper ocean, impacting air-sea gas exchange, atmospheric CO2 concentrations, and ultimately climate. These feedbacks between atmospheric conditions and coral biogeochemistry can only be accounted for with a coupled coral-carbon-climate model.

To simulate coral-mediated climate-carbon interactions, we have implemented a coral reef calcification module into the iLOVECLIM Earth system model of intermediate complexity. We then performed an ensemble of 210 parameter perturbation simulations to derive carbonate production parameter values that optimise the simulated distribution of coral reefs and associated carbonate production rates. The tuned model simulates the presence of coral reefs and regional-to-global carbonate production values in good agreement with data-based estimates. We have used this new coupled model to project future changes in coral reef carbonate production. The use of a computationally efficient intermediate complexity model allows us to cover a large range of possible futures that encompass different emissions scenarios (SSPs), climate sensitivities (hence different levels of warming) as well as the possibility of coral reefs adapting to higher SSTs which would reduce the risk of bleaching. We found a high sensitivity of the simulations to the ability of corals to adapt to thermal changes and to climate sensitivity, with the possibility of 20 to 100% coral extinction in scenario SSP1-2.6 depending on these parameters. This highlights the importance of improving the constraints on these factors in models and observations.

How to cite: Bouttes, N., Kwiatkowski, L., Bougeot, E., Berger, M., Brovkin, V., and Munhoven, G.: Future evolution of coral reef carbonate production from a global climate-coral reef coupled model, EGU General Assembly 2024, Vienna, Austria, 14–19 Apr 2024, EGU24-14377, https://doi.org/10.5194/egusphere-egu24-14377, 2024.

EGU24-14657 | Posters virtual | OS3.1

The fate of terrestrial carbon in the Arctic Ocean supplied by increasing coastal erosion 

Moritz Mathis, David Nielsen, Stefan Hagemann, Tatiana Ilyina, and Corinna Schrum

Arctic permafrost thaw and sea ice retreat lead to enhanced coastal erosion and a contemporary increase in the transport of terrestrial carbon to the Arctic Ocean. However, the influence of this carbon supply on the marine carbon cycle and the CO2 uptake of the broad Arctic shelves is poorly understood. We use the global ocean-biogeochemistry model ICON-Coast with a dedicated representation of coastal carbon dynamics to investigate the impacts of erosive coastal carbon input during the 20th century and quantify its partitioning into burial, transport and air-sea gas exchange in the Arctic Ocean. Anthropogenic climate change increased the carbon supply from coastal erosion by 1.5 Tg C yr-1. We find that about 50% of this increase is remineralized on the shelves and released to the atmosphere. Another 30% get deposited in near-shore sediments, whereas 10% are exported to the open ocean via advection, and 10% reside in the shelf waters as accumulating DIC. This means that the anthropogenically induced increase in coastal erosion reduced the CO2 uptake during the past century by 0.8 Tg C yr-1 (3% of the total uptake by Arctic shelves) and may further weaken the CO2 sink of the Arctic Ocean as global warming continues.

How to cite: Mathis, M., Nielsen, D., Hagemann, S., Ilyina, T., and Schrum, C.: The fate of terrestrial carbon in the Arctic Ocean supplied by increasing coastal erosion, EGU General Assembly 2024, Vienna, Austria, 14–19 Apr 2024, EGU24-14657, https://doi.org/10.5194/egusphere-egu24-14657, 2024.

The South Pacific Ocean stands out as a dynamical region with contrasted biogeochemical (BGC) regimes. Among others, it encompasses mesotrophic areas as well as the most oligotrophic waters of the global ocean. Within these regions, the existing thousands of islands can locally or regionally disrupt the oceanic circulation and, thereby, thus the nutrient availability in the upper sunlit layer and the phytoplankton growth. Yet, the phytoplankton seasonal dynamics in these contrasted BGC regions remain largely unknown and understood. Indeed, most existing studies on phytoplankton seasonal variability from observations are either dedicated to the global ocean or based on remotely sensed data due to a lack of in-situ observations in the water column, preventing the consideration of 3D processes.

Here we took advantage of in situ observations from 13 BGC-Argo profiling floats that have drifted from 2015 to 2023 in five subregions of the South Pacific Ocean: the Tasman and Coral Seas, the Fiji island region, the oligotrophic and equatorial mesotrophic areas. We used measurements of temperature, salinity, chlorophyll-a fluorescence (Chl), particulate backscattering at 700 nm (bbp) used as a proxy of particulate organic carbon and Photosynthetically Active Radiation. The seasonal variations of Chl and bbp vertical distributions are characterized among the subregions and physical and biogeochemical processes likely involved have been investigated. To do so, we considered isolume and nutricline depths, the Mixed Layer Depth (MLD) as well as the maximum Brunt-Vaissala depth as an indicator of the ocean stratification stability. The latter appears more suitable than the MLD when related to the phytoplankton seasonal dynamics. 

How to cite: Hermilly, T., Martinez, E., Uitz, J., Cornec, M., and Schmechtig, C.: Seasonal variability of the phytoplankton biomass and its underlying processes in contrasted regions of the South Pacific Ocean based on BioGeoChemical-Argo observations, EGU General Assembly 2024, Vienna, Austria, 14–19 Apr 2024, EGU24-15355, https://doi.org/10.5194/egusphere-egu24-15355, 2024.

EGU24-15731 | Orals | OS3.1

What are the challenges simulating historical ocean deoxygenation? 

Yohei Takano and the Ocean Biogeochemistry Modelling Group

   This study presents an analysis of the historical upper ocean (0-700m) dissolved oxygen (O2) and heat content changes from a suite of  the Coupled Model Intercomparison Project phase 6 (CMIP6) ocean biogeochemistry simulations. The simulations include both forced ocean-only models (the Ocean Model Intercomparison Project, OMIP1 and OMIP2) and coupled historical simulations from Earth System Models (ESMs)  (CMIP6 Historical). Simulated changes in the O2 inventory and ocean heat content (OHC) over the past five decades spatially and temporally diverge across the models. The multi-model mean and spread of the upper ocean global O2 inventory trend for each of the simulations is 0.03 ± 0.39 × 10¹⁴ [mol/decade] for OMIP1,  -0.37 ± 0.15 × 10¹⁴ [mol/decade] for OMIP2, and -1.06 ± 0.68 × 10¹⁴ [mol/decade] for CMIP6 Historical simulations, respectively. The latest observational trend based on the World Ocean Database 2018 is -0.98 × 10¹⁴ [mol/decade],  in line with the CMIP6 Historical multi-model mean, though this recent observations-based trend estimate is weaker than previously reported trends.  A comparison between OMIP1 and OMIP2 simulations suggests that differences in atmospheric forcing such as surface wind explain the simulated divergence across simulations in O2 inventory and OHC changes. An additional comparison between OMIP and CMIP6 Historical simulations indicates that differences in background mean states due to differences in spin-up strategy and equilibrium states result in substantial differences in the climate change response of O2. In this presentation, we will discuss gaps and gaps and uncertainties in both ocean biogeochemistry simulations and observations and explore possible future coordinated ocean biogeochemistry simulations to fill in gaps and unravel the mechanisms controlling the O2 and changes in associated ocean biogeochemical cycles. This presentation is based on the recently published work (Takano et al., 2023).

Reference

Takano Y., Ilyina T., Tjiputra J., Eddebbar Y.A., Berthet S., Bopp L., Buitenhuis E., Butenschön M., Christian J.R., John  J.P., Gröger M., Hayashida H., Hieronymus J., Koenigk T., Krasting J.P., Long M.C., Lovato T., Nakano H., Palmieri J., Schwinger J., Séférian R., Suntharalingam P., Tatebe H., Tsujino H., Urakawa S., Watanabe M., and Yool A.: Simulations of ocean deoxygenation in the historical era: insights from forced and coupled models, Front. Mar. Sci., 10:1139917, doi: 10.3389/fmars.2023.1139917.

How to cite: Takano, Y. and the Ocean Biogeochemistry Modelling Group: What are the challenges simulating historical ocean deoxygenation?, EGU General Assembly 2024, Vienna, Austria, 14–19 Apr 2024, EGU24-15731, https://doi.org/10.5194/egusphere-egu24-15731, 2024.

EGU24-16108 | Posters on site | OS3.1

When co-existence means separation – environmental niche partitioning of ecologically similar zooplankton species in the warming Arctic 

Marta Gluchowska, Weronika Patula, Kaja Balazy, and Emilia Trudnowska

One of the fundamental challenges in modern studies of zooplankton ecology at high latitudes is to understand the processes that promote co-existence of morphologically and ecologically related species with different origin and that maintain high overall zooplankton diversity in a warming Arctic. The increased inflow of warm Atlantic Water into the Arctic Ocean is making marine ecosystems increasingly resemble those of the North Atlantic. Consequently, a mixture of resident and advected species coexist over large areas of the European Arctic. In this study, pairs of taxonomically and ecologically related species (small-sized copepods, large calanoid copepods, amphipods, euphausiids, and chaetognaths), essential for the functioning of Arctic ecosystems were thoroughly studied with regard to their existence and degree of niche separation of studied pairs. Individual species within each pair are characterized by different centers of distribution (Arctic or boreal). The design of our study, covering three core hydrographical regions of the Polar Front on the West Spitsbergen Shelf, was set up to study the pairs of sibling species that either co-occur in the same water (Hornsund fjord, Spitsbergen) or thrive in the water mass they originate from (Arctic and Atlantic domains). Our results demonstrate that vertical abundance distributions in each pair of species differ when species occur separately (waters from each particulate species originate) or from the vertical distribution patterns  when they co-exist. This supports the hypothesis that environmental niche separation exists in sibling species of marine zooplankton sharing the same environment and highlights its role as a mechanism reducing interspecific competition.

How to cite: Gluchowska, M., Patula, W., Balazy, K., and Trudnowska, E.: When co-existence means separation – environmental niche partitioning of ecologically similar zooplankton species in the warming Arctic, EGU General Assembly 2024, Vienna, Austria, 14–19 Apr 2024, EGU24-16108, https://doi.org/10.5194/egusphere-egu24-16108, 2024.

EGU24-16428 | Orals | OS3.1

Seasonal and interannual inorganic carbon dynamics in the Northeast Pacific 

Ana C. Franco, Debby Ianson, Raffaele Bernardello, and Adam H. Monahan

The Northeast Pacific is an important net sink of atmospheric CO2. However, substantial natural variability modulates the long-term increase of seawater partial pressure of CO2 (pCO2), potentially influencing the magnitude of the CO2 sink. In addition to the seasonal cycle, the Pacific Decadal Oscillation (PDO) is known to play a role in driving a large fraction of the non-seasonal variability in the region. Yet, the magnitude of this natural variability, especially periods of high surface dissolved inorganic carbon (DIC), are not well constrained. Here we quantify the seasonal and non-seasonal variability in DIC and pCO2 using observations from the Line P program, the longest marine carbonate system time-series transect in the NE Pacific (1990-2019), as well as an ensemble of historical simulations with an Earth system model (EC-Earth-CC). Preliminary results show that the mean amplitude of the DIC seasonal cycle is similar across our NE Pacific transect (23-30 µmol kg-1) and decreases with depth to less than 5 µmol kg-1 at 60 to 70 m. In contrast, the non-seasonal variability remains approximately constant with depth, ranging between 10 – 20 µmol kg-1. We quantify the role of the PDO in driving this residual non-seasonal variability, and analyse the contrasting impact of temperature and DIC changes in controlling surface pCO2 during opposite phases of the PDO.

How to cite: Franco, A. C., Ianson, D., Bernardello, R., and Monahan, A. H.: Seasonal and interannual inorganic carbon dynamics in the Northeast Pacific, EGU General Assembly 2024, Vienna, Austria, 14–19 Apr 2024, EGU24-16428, https://doi.org/10.5194/egusphere-egu24-16428, 2024.

EGU24-16901 | ECS | Orals | OS3.1

Community structure matters: diverse ecosystem structure shapes carbon dynamics in a model system. 

Rebecca Wright, Joe Guest, Tereza Jarníková, Marie-Fanny Racault, Erik Buitenhuis, Nicolas Mayot, Philip Townsend, and Corinne Le Quéré

Understanding how climate variability and climate change affects marine ecosystem dynamics and its cascading implications for the carbon cycle is a “known-unknown” that was highlighted in the past four Assessment reports of the IPCC. We present results from a novel set of global ocean biogeochemistry model branches which were designed to explore the role of marine ecosystem structure for carbon dynamics both globally and regionally, with a focus on the Southern Ocean.

PlankTOM12 is a global ocean biogeochemistry model based on the representation of marine microorganisms grouped into twelve Plankton Functional Types (PFTs) as a function of their importance for the carbon cycle. PlankTOM12 uniquely represents explicitly heterotrophic bacteria/archaea, six types of phytoplankton , and five types of zooplankton . We build three distinct branches of PlankTOM12, with identical ecosystem framework and identical physical environment, but each branch with its own set of ecosystem parameters allowing different ecosystem formations. Branch 1 (called GCB) is the historical branch that  underpinned much prior research on the carbon cycle using this model and contributed to the Global Carbon Budget 2023. Branch 2 (ECO) is optimised to reproduce the observed mean, seasonal cycle, and interhemispheric distribution of surface chlorophyll-a (Chla). Branch 3 (CO2) is optimised to reproduce the observed mean and seasonality of the partial pressure of surface ocean carbon dioxide (pCO2). Even though the parameterisations are optimised globally, many of the substantial differences between the three branches occur in the Southern Ocean. In particular, it was not possible to reproduce a good mean and seasonality for both Chla and pCO2 simultaneously in the Southern Ocean. Strikingly, each of the three PlankTOM12 model branches offers a different perspective on marine ecosystem dynamics. The branches differ most distinctly in the relative fraction of biomass that is distributed among PFTs: the GCB branch distributes most of its biomass in small phytoplankton PFTs and large zooplankton PFTs, the ECO branch distributes its biomass relatively evenly among PFTs, and the CO2 branch is intermediate with most biomass in the small phytoplankton PFTs and large zooplankton PFTs, but also substantial biomass in the medium-sized PFTs for both phyto- and zooplankton. We show how the differences in these ecosystem structures transfer through to differences in carbon dynamics, including primary and secondary production, sinking fluxes of organic carbon, calcium carbonate, and silica, and how they propagate to carbon export to the deep ocean and export efficiency. We present the response of the three branches to recent climate change and variability using hindcast simulations over 1948-2022, and discuss model evaluation based on available biogeochemistry and ecosystem observational data. Finally, we suggest future applications and questions which may be best addressed by each model branch.

How to cite: Wright, R., Guest, J., Jarníková, T., Racault, M.-F., Buitenhuis, E., Mayot, N., Townsend, P., and Le Quéré, C.: Community structure matters: diverse ecosystem structure shapes carbon dynamics in a model system., EGU General Assembly 2024, Vienna, Austria, 14–19 Apr 2024, EGU24-16901, https://doi.org/10.5194/egusphere-egu24-16901, 2024.

EGU24-17424 | ECS | Orals | OS3.1

The response of planktic foraminifera Globigerina bulloides to changing environmental parameters through extensive culturing experiments 

Freya E. Sykes, Julie Meilland, Adele Westgård, Thomas B. Chalk, Melissa Chierici, Gavin L. Foster, and Mohamed M. Ezat

Planktic foraminifera are calcifying marine protists living in the upper water column of the world’s oceans. As they grow, the composition of their calcite shells is influenced by their local environment. Thus, by analysing the geochemical signature of their fossil shells, a record of past changes in temperature, pH and salinity of the seawater can be reconstructed. Globigerina bulloides is a spinose planktonic foraminifera species that tolerates sub-tropical to sub-polar conditions and is present in high concentrations in the southern Norwegian Sea. It is of ecological interest as it encroaches into previously ‘cold water’ territories due to climate warming and Nordic Seas “Atlantification”. The relative abundance and shell geochemistry of fossil specimens of G. bulloides are also widely used for palaeoceanographic reconstructions in the region. Despite the widespread use of G. bulloides for these reconstructions, biological, metabolic, and behavioural observations are scarce, leaving large knowledge gaps regarding the impacts of these ‘vital effects’ on its calcification and preserved geochemical signature. One way to fill this gap is via the study of the species in controlled culture conditions, however to date, all reported culturing studies have been carried out in a temperate to warm water setting (>14oC), and using sub-tropical specimens. This reduces the applicability of these studies to G. bulloides inhabiting the high latitudes.

We cultivated over 250 individual specimens of G. bulloides from the Norwegian Sea across a range of temperatures (6 - 13o C), salinities (30.4 – 37.8), pHs (7.7 - 8.3) and carbonate ion concentrations (70 – 230 µmol/kg). Experimental conditions were chosen relative to ambient seawater at the collection site(s) and were intended to reflect a plausible range of past and future scenarios.

After several weeks in culture, we observed that G. bulloides was tolerant of environmental conditions well outside their natural range, with no significant difference in mortality or final size. This was corroborated by a high percentage of spine regrowth and/or maintenance (~65% for most treatments) after the first week. Many individuals thrived in culture, with some surviving up to three months. Two alternative strategies appeared to be employed; specimens opted either for rapid growth shortly followed by death, or for a prolonged lifespan with minimal size increase. Longer living specimens developed ectoplasmic structures on multiple occasions. Our observations suggest G. bulloides can exhibit considerable adaptability to shifting environmental conditions with implications to its tolerance to ongoing ocean changes.

How to cite: Sykes, F. E., Meilland, J., Westgård, A., Chalk, T. B., Chierici, M., Foster, G. L., and Ezat, M. M.: The response of planktic foraminifera Globigerina bulloides to changing environmental parameters through extensive culturing experiments, EGU General Assembly 2024, Vienna, Austria, 14–19 Apr 2024, EGU24-17424, https://doi.org/10.5194/egusphere-egu24-17424, 2024.

Global temperatures and atmospheric carbon dioxide (CO2) have been rising since the industrial period due to increased anthropogenic activities. The adverse impact of this warming and changing climate systems significantly reflects on Eastern Boundary Upwelling Systems (EBUS) in the global ocean. Here, we investigate the influence of climate change on EBUS by analysing the long-term changes in upwelling and productivity within these ecologically crucial regions. Based on the Bakun's (1990) hypothesis, which suggests that modifications in land-sea thermal gradients affect atmospheric pressure cells and subsequently influence upwelling patterns in EBUS, we analyse the daily time series data of wind and sea surface temperature (SST). Furthermore, we assess the impact of changes in these upwelling patterns on productivity.

We employ a set of matrices to objectively characterise upwelling dynamics, focusing on frequency, intensity and duration across four EBUS. Our findings reveal a compelling relationship between SST changes and upwelling events, demonstrating a decrease in SST associated with increased upwelling frequency and reduced intensity. Interestingly, variations emerge among EBUS and regions within them, notably an intensification of upwelling in the Humboldt Current systems. Despite this observed response, clear evidence supporting the associated changes in wind dynamics that drive upwelling remains elusive.

This study enhances our understanding of how shifts in global temperatures impact EBUS, which are crucial systems in regulating fisheries and marine ecosystems. Consistent changes in the timing, intensity and spatial heterogeneity of coastal upwelling are evident in most EBUS. The spatially variable yet subtle changes are observed in accordance with climate change patterns. These findings provide valuable insights into the complex interplay between climate-driven shifts and the dynamic nature of EBUS, suggesting implications for marine ecosystems and coastal communities.

How to cite: Panthakka, A. and Kuttippurath, J.: Dynamic shifts in eastern boundary upwelling systems: climate-change driven impacts on frequency, intensity and spatial patterns of upwelling., EGU General Assembly 2024, Vienna, Austria, 14–19 Apr 2024, EGU24-18162, https://doi.org/10.5194/egusphere-egu24-18162, 2024.

EGU24-19449 | ECS | Orals | OS3.1

Unexpected decoupling between biodiversity and standing stocks in marine calcifying phytoplankton  

Joost de Vries, Fanny Monteiro, and Levi Wolf

For many ecosystems, biodiversity promotes productivity. Global biodiversity loss due to anthropogenic climate change has thus raised concerns about its resulting impact on productivity since ecosystem services like carbon sequestration are key in limiting climate change. Our oceans are especially important in this context, as they sequester more carbon than terrestrial ecosystems. Nonetheless, our understanding of how biodiversity relates to productivity in oceanic ecosystems is limited and hitherto undescribed for coccolithophores, a main ocean calcifier which plays a key role in the ocean carbon cycle. Here, by combining a new comprehensive coccolithophore abundance data set and species distribution models we illustrate that biodiversity is decoupled from standing stocks for coccolithophores. We show this is because the processes driving coccolithophore diversity do not influence coccolithophore standing stocks. Our results contribute new knowledge about the relationship between productivity for a key marine planktonic microorganism, highlighting that diversity loss due to anthropogenic carbon emission does not necessitate reduced ocean standing stocks and productivity. This result is important for climate models, suggesting that they do not need to capture our ocean’s full diversity to capture key biogeochemical processes such as calcification and carbon fixation.  


How to cite: de Vries, J., Monteiro, F., and Wolf, L.: Unexpected decoupling between biodiversity and standing stocks in marine calcifying phytoplankton , EGU General Assembly 2024, Vienna, Austria, 14–19 Apr 2024, EGU24-19449, https://doi.org/10.5194/egusphere-egu24-19449, 2024.

CO2 emission-driven simulations are becoming a priority way of running Earth system model simulations of climate change as they directly link Earth system responses to climate policies. Also large ensemble simulations have been identified as a key tool to quantify effects of internal climate variability in the Earth system. We ran a large ensemble of emission-driven climate change projections in MPI-ESM with various CMIP6 emission scenarios. Our simulations produce a realistic temporal and spatial evolution of atmosphric CO2, as well as ocean and land carbon sinks. An increased seasonal cycle in all carbon cycle compartments is projected in future simulations. Ongoing work focuses on discerning responses of the ocean and land carbon sinks to changing emissions. Thereby, we find that changes in atmospheric carbon are asymmetric to CO2 emissions across various scenario pathways. Furthermore, temperature continues to increase after CO2 emission mitigation. In our simulations, under negative emissions, the ocean and land shift from being sink to source after 2100. In particular, for the ocean carbon sink evolution, the regions which acted as a sink for anthropogenic CO2 in the 20th century, remain sinks also during the 21st century. However, the major carbon uptake shifts from the North Atlantic to the Southern Ocean and much of the additional carbon is then stored in the south-west Pacific. In the 22nd century, it is mostly the North Atlantic that shifts towards less uptake of CO2 and from which dissolved inorganic carbon is transported away, while the Barents Sea and WeddelSea keep taking up more CO2 than during pre-industrial times, and parts of the ocean in the southern hemisphere keep accumulating carbon. Air-land CO2 fluxes overlap among different scenarios emphasizing the substantial role of internal climate variability.

How to cite: Ilyina, T., Li, H., Ramme, L., and Li, C.: Unfolding responses in the global ocean and land carbon sinks and atmospheric CO2 to changing emissions with the large ensemble future projections with interactive carbon cycle., EGU General Assembly 2024, Vienna, Austria, 14–19 Apr 2024, EGU24-19854, https://doi.org/10.5194/egusphere-egu24-19854, 2024.

EGU24-20714 | Posters on site | OS3.1

New global machine-learning estimates of coccolithophore standing stocks and calcification rate accounting for biodiversity  

Fanny Monteiro, Joost de Vries, Nicola Wiseman, Alex Poulton, Rosie Sheward, and Levi Wolf

Coccolithophores are a main marine calcifier critical to ocean carbon pumps (via organic matter ballast and the carbonate pump), ultimately controlling atmospheric CO2 and climate. However, their contribution to the global carbon cycle is still very uncertain, limiting our understanding of their impact and response to climate change. One major issue is that most coccolithophore studies rely solely on one outlier species (Emiliania huxleyi), which is relatively small and lightly calcified. Here, we apply novel machine-learning techniques to determine the global distribution of the top 52 species and the total calcite production of coccolithophores. These techniques build predictive models of coccolithophore carbon stocks and calcite production based on newly compiled datasets of coccolithophore abundance and calcification rates, which we combined with environmental data. Our species predictive model shows that a handful of species, including Emiliania huxleyi, are responsible for the global calcite standing stock, with subtropical species being a significant contributor. Our rate predictive model also supports this finding, showing large calcification rates in the subpolar and subtropical regions. This result revisits the traditional view that coccolithophore calcification primarily occurs in sub-arctic bloom-like events and that other species besides Emiliania huxleyi should be considered to resolve coccolithophore’s subtropical contribution. 

How to cite: Monteiro, F., de Vries, J., Wiseman, N., Poulton, A., Sheward, R., and Wolf, L.: New global machine-learning estimates of coccolithophore standing stocks and calcification rate accounting for biodiversity , EGU General Assembly 2024, Vienna, Austria, 14–19 Apr 2024, EGU24-20714, https://doi.org/10.5194/egusphere-egu24-20714, 2024.

EGU24-21938 | Orals | OS3.1

Do Temporal Diversity Dynamics Reconcile Viral and Grazer Based Theories for the Propocalypse? 

Christopher Follett, Barbara Duckworth, and Stephanie Dutkiewicz

Understanding the relative importance of top-down vs. bottom up controls for setting plankton populations is an open challenge in marine ecology. Recent work has focused on the sharp spatial decline in Prochlorococcus biomass when moving northward in the North Pacific transition zone. This work has argued against bottom up controls like temperature and for top down mechanisms like apparent competition or viruses setting the location of the collapse. However, as temperature and light modify the underlying rates in the system we would expect them to play some role in the temporal dynamics. Here, we seek to unify bottom up and top down controls to make predictions about the seasonal progression of the ‘Propocalypse’ and the associated predators of Prochlorococcus. Observations suggest that the Propocalypse occurs further poleward in the summer and about 10 degrees further south in the winter. Here, we use models to confirm that ecological interactions allow for the existence of the transition, and that the meridional movement is determined by growth rate changes due to light and temperature in the spring, and by mixed layer depth changes during the fall and early winter. We go on to seek a diversity-mortality relation for Prochlorococcus connecting viral mortality to the seasonal motion of the Propocalypse. 

How to cite: Follett, C., Duckworth, B., and Dutkiewicz, S.: Do Temporal Diversity Dynamics Reconcile Viral and Grazer Based Theories for the Propocalypse?, EGU General Assembly 2024, Vienna, Austria, 14–19 Apr 2024, EGU24-21938, https://doi.org/10.5194/egusphere-egu24-21938, 2024.

EGU24-22229 | Posters on site | OS3.1

BioGeoSCAPES: Ocean metabolism and nutrient cycles on a changing planet 

Meriel Bittner, Naomi Levine, Benjamin Twining, Mak A. Saito, Maria Teresa Maldonado, and Alessandro Tagliabue

Global biogeochemical cycles in which essential elements are transformed and recycled are governed by microbial processes. Despite international efforts of studying these important cycles, fundamental questions remain especially regarding fluxes and regulation. The international BioGeoSCAPES initiative aims to unravel the intricacies of these interconnected biogeochemical cycles and improve our understanding of the microbial biogeochemistry of the oceans from regional to ocean basin-scale on a changing planet. The community envisions a more quantitative and predictive understanding of ocean biogeochemical cycles and metabolism by combining detailed information of nutrient/metabolite fluxes, plankton and biochemical processes. The program has an integrative and multidisciplinary approach, by combining state-of-the-art methods in biochemistry, omics, physiology and modeling. Within the scope of BioGeoSCAPES standardized best practices will be established and intercalibration efforts carried out to create an international interoperable data system that nations around the world can contribute to and participate in.
Currently, a globally-supported science plan is being developed, in which key scientific interests are identified such as mapping key metabolisms over space and time, measuring rates to connect microbial metabolisms to biogeochemical cycles, and predicting interactions with environmental change. In the near future, the BioGeoSCAPES community will work towards integrating modeling efforts across a range of scales and to develop the infrastructure to support this global initiative. Initial objectives of the science plan will be presented to discuss with the Ocean Sciences community and to receive feedback.

How to cite: Bittner, M., Levine, N., Twining, B., A. Saito, M., Maldonado, M. T., and Tagliabue, A.: BioGeoSCAPES: Ocean metabolism and nutrient cycles on a changing planet, EGU General Assembly 2024, Vienna, Austria, 14–19 Apr 2024, EGU24-22229, https://doi.org/10.5194/egusphere-egu24-22229, 2024.

Marine organisms, from plankton to fish, provide a wealth of ecosystem services, including carbon sequestration in a process known as the ocean’s biological carbon pump (BCP). The BCP brings carbon from the atmosphere to the ocean depths where it is stored for decades to centuries. Although parts of the ocean’s BCP are under threat from human activities,  BCP carbon sequestration rarely features as an objective in efforts to protect ocean spaces. Moreover, although BCP carbon sequestration services could support discussions of conservation and climate finance,  its economic value has yet to be estimated in space and time.

Biogeochemical modeling and mapping efforts have grown in recent years, and emerging results could potentially help to fill in important spatially explicit and economic knowledge gaps that could inform the protection of the BCP. We developed a new metric to map and quantify the global ocean’s BCP long-term carbon sequestration and computed its value on a potential carbon market. We show the  global spatial patterns and valuation in relation to geopolitical and management boundaries, and highlight options for governance and management. Our results highlight potential opportunities for preserving the climate services of the BCP both nationally and in areas beyond national jurisdiction , and can be used to inform discussions about marine protected areas, environmental impact assessment, and conservation finance.

How to cite: Berzaghi, F., Pinti, J., Aumont, O., Maury, O., and Wisz, M.: Distribution and valuation of the biological carbon pump and its carbon sequestration:  Implications for international area-based management and climate finance, EGU General Assembly 2024, Vienna, Austria, 14–19 Apr 2024, EGU24-723, https://doi.org/10.5194/egusphere-egu24-723, 2024.

EGU24-913 | ECS | Posters on site | OS3.2

Dynamics and morphology of sinking particles in the equatorial Atlantic during the 2021 Atlantic Nino 

Joelle Habib, Lars Stemman, Pierre Climent, Alexandre Accardo, Alberto Baudena, Franz Philip Tuchen, Peter Brandt, and Rainer Kiko

The equatorial upwelling system is characterized by a strong seasonal cycle with relatively cold sea surface temperature (SST) and enhanced primary production in the “cold tongue region” of the eastern basin during boreal summer. During the boreal summer of 2021, the equatorial Atlantic witnessed its most intense warm event since the beginning of satellite observations, which is assumed to have a direct impact on the carbon cycle. Here we use data from a BGC Argo float, deployed in the equatorial upwelling region in order to investigate the production peaks of marine particles during two distinct periods: the decay period of the anomalous weak cold tongue and the period of secondary cooling in boreal winter. In situ images of plankton and particles and physical and biogeochemical data provided by the Underwater Vision Profiler 6 (UVP6) and various sensors mounted on the float were analyzed in conjunction with satellite data (sea surface height, SST, ocean color). The float covered the period between 13 July 2021 and 23 March 2022 drifting eastward from 23-7.4°W along the equator and conducting 2000 m profiles every three days. Our data revealed the occurrence of two blooms with high surface chlorophyll concentrations accompanied by the presence of two carbon export events reaching at least 2000 m depth. Both events exhibited high carbon flux at the mixed layer with a flux of 106±5 mgC.m-2d-1 during the first event compared to 122±17 mgC.m-2d-1 during the second while flux between both events remained below 89 mgC.m-2d-1. However, a distinction in the vertical extent of these events was recorded as there was a slightly higher flux at 2000 m for the winter boreal, 30% higher, suggesting a difference between the carbon attenuation flux export associated with the primary upwelling season with the one observed during the secondary cooling period in the boreal winter. The characterization of the morphology of detritus using in situ imaging and clustering method revealed the presence of five different morpho-types with different sinking properties. Two primary classifications—large and small dense aggregates—emerged as the predominant exported detritus to depths while porous aggregates were more concentrated in the surface layer. Our study revealed a dynamic interaction between various layers, involving carbon production in the surface layer, succeeded by its subsequent export to deeper layers. Finally, this study offers new insights into particle dynamics and the morphology of sinking particles within the equatorial region.

How to cite: Habib, J., Stemman, L., Climent, P., Accardo, A., Baudena, A., Tuchen, F. P., Brandt, P., and Kiko, R.: Dynamics and morphology of sinking particles in the equatorial Atlantic during the 2021 Atlantic Nino, EGU General Assembly 2024, Vienna, Austria, 14–19 Apr 2024, EGU24-913, https://doi.org/10.5194/egusphere-egu24-913, 2024.

EGU24-2879 | Orals | OS3.2 | Highlight | Fridtjof Nansen Medal Lecture

Future trends and climate feedbacks of the biological carbon pump 

Stephanie Henson

The biological carbon pump is a series of processes that transfers organic carbon from the surface ocean into the deep ocean.  Without it, atmospheric CO2 levels would be ~ 50 % higher than pre-industrial levels.  Despite its importance, we currently struggle to understand how the strength and efficiency of the biological carbon pump varies temporally and spatially.  This makes it difficult to observe, and therefore model the pump, so our knowledge of how this important component of the global carbon cycle might respond to climate change is poor.  In this talk I’ll present recent progress on using autonomous vehicles to quantify variability in the biological carbon pump, discuss the current limitations in our understanding of the pump, and the implications of those knowledge gaps for robust modelling of the current and future pump. 

How to cite: Henson, S.: Future trends and climate feedbacks of the biological carbon pump, EGU General Assembly 2024, Vienna, Austria, 14–19 Apr 2024, EGU24-2879, https://doi.org/10.5194/egusphere-egu24-2879, 2024.

Marine silicate alteration is a combined process of lithogenic silicate (LSi) dissolution (known as marine silicate weathering) and secondary clay neoformation (known as reverse weathering). Both processes have been shown to affect long-term C cycling. Yet, the net CO2 consumption and production due to marine silicate alteration have not been studied thoroughly. Factors such as silicate types and rates are crucial in determining the fate of CO2 in the marine subsurface. In this study, we aimed to constrain silicate types of marine silicate alterations and their rates by measuring Si isotopic signatures of porewater and different silicate phases (including LSi, biogenic silica (BSi) and amorphous secondary Si phase (ASSi)) and modelling downcore profiles from two drill cores retrieved from the Ulleung Basin, where up to 130 mM of alkalinity has been documented as a result of fast marine silicate weathering. A decrease in porewater dissolved Si (DSi) concentration and an increase in porewater δ30Si (δ30Sipw) value indicate the formation of ASSi in the shallow subsurface (0 to 9 meter below seafloor (mbsf)). Below the sulfate-methane transition zone (9 to 32 mbsf), an increase in DSi concentrations and a decrease in δ30Sipw values were attributed to the LSi dissolution releasing lighter Si isotopes into porewater. Such a dissolving LSi phase is likely a mica-group silicate, as suggested by the elemental content of the separated solid phase and porewater. This finding is supported by reactive transport simulation, which indicates that mica, vermiculite and albite are able to dissolve and release Mg, K and Na into porewater. Precipitation of smectite group silicates consumes Mg and K in the pore fluids at rates lower than the overall silicate dissolution rates. The dissolving mica-group silicate (and albite) neutralises CO2 produced through organic matter fermentation and increases porewater alkalinity, which is 60 times higher than the seawater value. By further conducting model sensitivity tests using various organic matter degradation rates, we found that the alkalinity concentrations contributing by dissolved Mg and K concentrations are majorly affected by changes in smectite group formation rates while mica and vermiculite dissolution rates remain constant. The decreased contribution of mica-like silicate dissolution and the increased contribution of BSi dissolution with sediment depth from 32 to 218 mbsf are indicated by increased DSi concentration, increased δ30Sipw values and rate results output by modelling.

How to cite: Huang, T.-H., Sun, X., Kim, J.-H., Mark, C., and Hong, W.-L.: Extremely high alkalinity due to dissolution of mica-group silicate in the pelagic sediments of the Ulleung Basin (East Sea): stable Si isotopes evidence and reactive transport modelling, EGU General Assembly 2024, Vienna, Austria, 14–19 Apr 2024, EGU24-3289, https://doi.org/10.5194/egusphere-egu24-3289, 2024.

EGU24-4178 | Orals | OS3.2

The role of marine silicate alteration in regulating carbon cycling 

Wei-Li Hong, Xiaole Sun, Tzu-Hao Huang, and Marta Torres

Despite the growing recognition of in-situ silicate alteration (dissolution and formation) in marine sediments, its global significance and controlling factors are still poorly understood. By compiling information from scientific ocean drilling programs and applying numerical modelling, we aim to 1) provide constraints on the environmental parameters of silicate dissolution in marine sediments, 2) identify silicate phases responsible for the hyper porewater alkalinity (>56 meq/L) commonly observed from productive continental margin sediments, and 3) investigate the interplay between silicate dissolution, clay formation, and carbonate authigenesis as well as their effect on marine carbon cycling. 

Through numerical modelling, we show that alkaline conditions resulting from combined iron and sulfate reduction favour formation of smectite group clay minerals, while the acidic conditions arising from organic matter fermentation promote dissolution of saponite and several mica-group silicates. This result resonates with previous observations of reverse weathering (i.e. clay formation) in shallow iron- and/or sulfate reducing sediments, while silicate weathering (i.e. silicate dissolution) has been reported deeper in methanogenic sediment columns. 

Using pore fluid composition data, we show that marine silicate weathering is primarily driven by dissolution of K- and Mg-containing silicate minerals. Especially, higher-than-seawater Mg concentrations were observed in almost all sites that have hyper alkalinity and the weathering process contribute more than one-third of the measured alkalinity. No apparent difference was observed for porewater Ca concentrations when comparing sites with and without hyper alkalinity, which hints for complicated feedbacks through authigenic carbonate formation. 

The global dataset analysed revealed that sites with high alkalinity correspond to locations with a medium distance from shore. While such a pattern cannot be easily explained by supply of organic matter nor by silicate phases alone, we interpret this observation to be the result of sediment maturity. Our inference is further strengthened by observations of higher alkalinity at sites with greater thermal history within the methanogenesis zone, a factor that measures how much time and temperature a sediment parcel has experienced under subsurface conditions. Collectively, we conclude that substantial dissolution of marine silicate phases occurs when the sediments have been transported some distance offshore and buried below sulfate reduction zone for a prolonged period and/or experience sufficiently high geothermal heating.

We simulated alteration of silicate and carbonate phases within a complete early diagenetic sequence to understand how dissolved carbon is converted to alkalinity under variable organic matter degradation rates. We show that authigenic carbonate formation is effective in control downcore DIC/alkalinity level with a moderate organic matter degradation rate. Only a very limited amount of carbonic acid produced by reverse weathering can diffuse away from sediments. Under a scenario with fast organic matter fermentation, dissolution of silicates (such as phlogopite) becomes the only buffer for porewater pH that converts most of the dissolved inorganic carbon produced from organic matter fermentation to carbonate alkalinity. Consequently, marine weathering sustained by silicate mineral dissolution increases the alkalinity production by as much as 16%, with most of the alkalinity leaking to surface oxic sediments instead of being sequestrated as carbonate minerals. 

How to cite: Hong, W.-L., Sun, X., Huang, T.-H., and Torres, M.: The role of marine silicate alteration in regulating carbon cycling, EGU General Assembly 2024, Vienna, Austria, 14–19 Apr 2024, EGU24-4178, https://doi.org/10.5194/egusphere-egu24-4178, 2024.

EGU24-4351 | Posters on site | OS3.2

Observing the biological carbon pump of the twilight zone in the South China Sea 

Bangqin Huang, Chao Xu, and Yibin Huang

The biological carbon pump (BCP) is a key mechanism sustaining ocean carbon sequestration and thus significantly influences atmospheric CO2 concentration. However, most of the key processes of the BCP, particularly in the twilight zone, remain poorly constrained. In this study, we use multiple approaches to constrain the key BCP processes throughout the water column in the South China Sea (SCS), including carbon export, remineralization and sequestration. Firstly, we calculated the small particulate organic carbon (POC) flux exported via the mixed layer pump (MLP) by biogeochemical profiling floats (BGC-float), which are typically ignored in low-latitude regions. We further combined three independent approaches, including BGC-float observation, in vivo reduction of the tetrazolium salt by the cellular electron transport system (in vivo INT), and the synthesis of prokaryotic respiration (PR) determined by radiolabeled leucine incorporation and zooplankton respiration (ZR) empirically estimated from the biomass (PR+ZR), to constrained the twilight zone remineralization (TZR) in the SCS. To reconcile methodological discrepancies, we estimated the possible range of carbon supply by integrating comprehensive carbon sources, including sinking POC flux, dissolved organic carbon input, lateral transport, dark carbon fixation, and active carbon transport by zooplankton migration. We find the in vivo INT approach may overestimate the TZR, while the TZR measured by BGC-float and PR+ZR approaches can be balanced with the total carbon sources. Finally, we further calculate the time-series POC flux at 1000 m by using the optical sediment trap equipped on the BGC-float, which indicates the real carbon sequestration flux and can be isolated from the atmosphere at the time scale of centuries to millennia. Our study provides new insights of the BCP and highlights the importance of inter-disciplinary and integrative process studies for constraining biogeochemical processes.

How to cite: Huang, B., Xu, C., and Huang, Y.: Observing the biological carbon pump of the twilight zone in the South China Sea, EGU General Assembly 2024, Vienna, Austria, 14–19 Apr 2024, EGU24-4351, https://doi.org/10.5194/egusphere-egu24-4351, 2024.

EGU24-4833 | Posters on site | OS3.2

Decreased carbonate pump during the Oligocene-Miocene Transition: Regulating the oceanic buffering capacity 

Ruigang Ma, Chuanlian Liu, and Xiaobo Jin

The oceanic carbonate cycle plays a crucial role in buffering anthopogenic CO2 emmision by regulating the total alkalinity (TA) and dissolved inorganic carbon (DIC) in the seawater. There is a growing interest in comprehending the role of biogenic calcification, the carbonate (counter) pump. The Early Miocene glaciation is thought to be triggered by the declining pCO2 potentially through a threshold effect of ~400 ppm (Greenop et al., 2019), a level we are approaching today. The mechanism(s) behind the long-term pCO2 decline during this period is still an open question, with little discussion on fluctuations in the carbonate burial. We estimated the changes in volume and flux of pelagic carbonate, specifically using coccoliths (calcite scales produced by coccolithophores). Our investigation spanned the transition from the Paleogene to the Neogene (~27-20 Ma), using marine calcareous nannofossil ooze retrieved from the IODP Site U1501 and U1505 located in the western tropical Pacific Ocean. The circular-polarized light microscope is used to measure the thickness (and volume) of the coccolith crystals. Integrating the linear sedimentation rates, we estimated that coccolith carbonate burial varied between 2-8×10⁴ mol·yr-1·km-2. Our result aligns with the modeled alkalinity removal through pelagic carbonate burial (van der Ploeg et al., 2019). Moreover, scanning electron microscope (SEM) observations revealed calcite carbonate dissolution effects in the water column, with ~5-30% of coccolith carbonate dissolving during sinking, releasing additional alkalinity to the sea-water. A negative correlation between Ks and bulk TOC suggests that the organic and inorganic carbon burial were decoupled during the studied period. While further constraints are needed to improve our estimation (e.g., considering assemblage changes in coccolith and planktonic foraminifera), we tentatively conclude that the decline in carbonate production together with the increased dissolution weakened the carbonate pump. As a result, enhanced buffering capacity of the ocean likely played a role in the drawdown of pCO2 from the Late Oligocene to the Early Miocene.

How to cite: Ma, R., Liu, C., and Jin, X.: Decreased carbonate pump during the Oligocene-Miocene Transition: Regulating the oceanic buffering capacity, EGU General Assembly 2024, Vienna, Austria, 14–19 Apr 2024, EGU24-4833, https://doi.org/10.5194/egusphere-egu24-4833, 2024.

The North Pacific (>20°N) stands out as a significant carbon sink, contributing to approximately 25% of the global oceanic CO2 uptake and absorbing around 0.5 Pg C yr-1 from the atmosphere. Despite the well-established importance of the biological carbon pump in maintaining this regional carbon sink, our current understanding of the strength and efficiency of the biological pump in this vast region remains incomplete. Historical studies have primarily relied on extrapolations from a limited number of observations.

In this study, we utilize data from 85 BGC-floats, covering over 160 annual cycles, to constrain essential fluxes relevant to the biological pump in the North Pacific, including net primary production, the export of distinct biogenic carbon, and air-sea CO2 flux. Furthermore, we combine the output from a well-constrained regional ecosystem model (ROMS-CoSiNE-Iron Model) to gain mechanistic insights into how the food-web dynamics drive the strength and efficiency of the biological carbon pump across different ecosystems.

Overall, our study offers an integrated perspective on the North Pacific biological pump by leveraging high-resolution observations from the BGC-float array and simulation from an improved ecosystem model.

How to cite: Huang, Y. and Chai, F.: Integrated Perspective of the Biological Pump in the North Pacific: Synergy from BGC-Float Observations and Ecosystem Model Simulation, EGU General Assembly 2024, Vienna, Austria, 14–19 Apr 2024, EGU24-4985, https://doi.org/10.5194/egusphere-egu24-4985, 2024.

EGU24-5933 | ECS | Posters on site | OS3.2

A mechanistic reproduction of particle transformation via fragmentation and diel vertical migration  

Aaron Naidoo-Bagwell, Fanny Monteiro, Andre Visser, and Stephanie Henson

The export efficiency of the biological carbon pump depends on a multitude of processes that can affect the sinking speed of particulate organic matter (POC). The uncertainty surrounding factors that promote particle aggregation (e.g. through transparent exopolymer particles – TEP), remineralization (e.g. via microbes) and zooplankton consumption and fragmentation (e.g. coprophagy) has led to inconsistent estimates and future predictions for global export flux amongst earth system models. Two of the most unaccounted-for and least understood processes for constraining these simulations of POC flux are fragmentation and diel vertical migration (DVM) by zooplankton, with the majority of CMIP6 model omitting these from their frameworks. Fragmentation rates can be physically-mediated (e.g. turbulent shear) or biologically-mediated (e.g. “sloppy feeding” by zooplankton) and drive remineralization and thus flux attenuation. Another zooplankton activity, DVM, also contributes to export flux. the resulting export flux. DVM, where organisms nocturnally migrate to surface waters to feed and descend during the day, has great implications for biogeochemical fluxes of nutrients and provides a mechanism for POC to bypass potential transformation via fecal pellet production at depth. Here, we use a 1-dimensional particle model (SISSOMA) that includes mechanistic descriptions of key particle transformation processes (aggregation, remineralization, fragmentation etc.) to explore the potential consequences of fragmentation and DVM. SISSOMA enables study into the formation and fate of particles in the mixed layer, producing particle size distributions of the flux exported. Through sensitivity tests on the drivers of fragmentation rates, fed by Underwater Vision Profiler (UVP) and Biogeochemical-Argo floats observations, we can determine what drives particle size distribution and ultimately carbon export. We apply a DVM component to SISSOMA, driven by ecological observations of migrating zooplankton (e.g. EcoTaxa) to investigate the extent to which this process contributes to export flux and its particle size composition. We implore future modelling and observationally-based studies related to constraining the biological pump to consider these processes when designing their research.

How to cite: Naidoo-Bagwell, A., Monteiro, F., Visser, A., and Henson, S.: A mechanistic reproduction of particle transformation via fragmentation and diel vertical migration , EGU General Assembly 2024, Vienna, Austria, 14–19 Apr 2024, EGU24-5933, https://doi.org/10.5194/egusphere-egu24-5933, 2024.

EGU24-6054 | Posters on site | OS3.2 | Highlight

Temperature vs ecosystem structure control over remineralisation length scale of sinking particles in the Global Ocean  

Richard Sanders, Sarah Giering, Stephanie Henson, Adrian Martin, Elaine McDonagh, Ingrid Wiedmann, and Andrew Yool

Ocean biological processes, principally the surface production, sinking and interior conversion of organic carbon to CO2 store enough carbon in the ocean interior to keep atmospheric CO2 concentration substantially lower than it would otherwise be. The size of this effect is linked to the depth at which sinking organic matter is remineralised in the ocean, with a deeper mineralisation causing a greater storage. Two prominent hypotheses regarding the control over the depth at which sinking material is lost are Temperature and Ecosystem Structure, specifically the proportion of diatoms in the surface community. These are both theoretically valid (temperature controls respiration, diatoms control density) and have some support in the literature, however to date have been considered in isolation. In this paper we firstly compute the strength of these effects in isolation from simple theory and show that they produce relationships consistent with existing literature thus suggesting that both factors may play a role. We use these relationships to produce an equation linking mineralisation depth, parameterised as remineralisation length scale, to community structure and temperature, thus uniting the two factors. An analysis of this equation suggests that community structure exerts a stronger control over remineralisation length scale than does temperature.

How to cite: Sanders, R., Giering, S., Henson, S., Martin, A., McDonagh, E., Wiedmann, I., and Yool, A.: Temperature vs ecosystem structure control over remineralisation length scale of sinking particles in the Global Ocean , EGU General Assembly 2024, Vienna, Austria, 14–19 Apr 2024, EGU24-6054, https://doi.org/10.5194/egusphere-egu24-6054, 2024.

The vast and rugged seafloor, densely populated with unique topographic characteristics such as seamounts, serves as hotspots for ocean deep-sea biodiversity and fisheries resources. For oligotrophic regions covering more than a quarter of the global ocean, such unique topography regions are ecological oases within the oceanic desert. However, research on these ecological hotspots remains scarce, particularly in understanding the mechanisms behind the formation of these ecological oases. We selected a shallow seamount in a typical oligotrophic region as a case study and conducted comprehensive on-site physical, chemical, and biological observations, revealing its coupled temporal and spatial response characteristics. By comparing observations from multiple 24-hour time-series stations at different locations on the seamount, we uncovered the differential response characteristics between the upstream and downstream sides induced by the seamount topography. Based on this, we elucidated the efficient organic matter production and export processes on the seamount, attempting to propose a mechanism for the formation of seamount ecological oases.

How to cite: Wang, X.: Seamounts Generate Efficient Biological Carbon Pump Processes to Nourish the Twilight Ecosystem, EGU General Assembly 2024, Vienna, Austria, 14–19 Apr 2024, EGU24-6276, https://doi.org/10.5194/egusphere-egu24-6276, 2024.

EGU24-6440 | ECS | Posters on site | OS3.2

Investigating the fractionation behaviour and mass balance of cadmium isotopes during continental weathering and marine burial. 

Neeraja Baburaj, Alexander Dickson, and Hannah Elms

Organic carbon burial plays an important role in the global carbon cycle, and changes in the magnitude of such carbon burial have the potential to impact the global climate. Recent studies have shown that stable cadmium isotopes (δ114/110Cd) have potential as a tracer for marine organic carbon burial. However, the input and output fluxes and isotopic fractionation behaviour of Cd in the marine system are currently insufficiently constrained for robust application as a paleo-proxy. For example, while the main input flux of Cd to the oceans is from rivers, the isotopic behaviour of Cd during its passage through estuarine mixing zones is poorly understood.

In this study we will present Cd concentration and isotopic measurements of waters spanning a salinity gradient of 34–1 PSU and bedload sediments collected from the Milford Haven estuary in Pembrokeshire, western Wales, The aim is to test the conservative behaviour of Cd in the estuarine mixing zone, to constrain the composition of Cd from weathering in a shale and sandstone dominated catchment, and to investigate the fractionation of Cd during catchment weathering. These data will help in better understanding the riverine input flux of cadmium into the oceans, and the marine cadmium budget.

How to cite: Baburaj, N., Dickson, A., and Elms, H.: Investigating the fractionation behaviour and mass balance of cadmium isotopes during continental weathering and marine burial., EGU General Assembly 2024, Vienna, Austria, 14–19 Apr 2024, EGU24-6440, https://doi.org/10.5194/egusphere-egu24-6440, 2024.

Ocean water yields an integrated global signal of geological and biological processes operating on our planet, which in turn control the marine C cycle, oceanic alkalinity budget and atmospheric CO2 levels. Therefore, reconstructing the chemical and isotope composition of seawater and/or coastal waters through time represents one of the main research objectives of earth system evolution studies.

Here we present stable and radiogenic Sr isotope variations (δ88/86Sr and 87Sr/86Sr) measured in waters and carbonates from modern and Holocene coastal marine system in South Australia (Coorong Lagoon/Murray River Estuary) that is connected to the Southern Ocean, thus exhibiting large gradients in water chemistry, salinity and carbonate saturation (Mosley et al. 2023; Shao et al. 2021). The studied hydrological system shows a large salinity range from brackish (<20 psu) to normal marine (~35 psu) and hypersaline (~110 psu), with the salinity changes being tightly linked to DIC and Alkalinity, and thus CaCO3 saturation state (SI values) of local waters, calculated via PHREEQC. The primary research aim was to assess how spatial and temporal changes in salinity, carbonate chemistry and CaCO3 saturation (dissolution vs precipitation of carbonates), monitored throughout the year (in spring, summer, fall and winter), impact the Sr isotope composition in the present-day coastal marine system. Such knowledge is, in turn, important for a better calibration and assessment of the δ88/86Sr proxy for paleo-oceanographic and environmental applications including past marine alkalinisation/acidification events and/or paleo-salinity reconstructions (Farkas et al. 2024; Shao, 2022).

Importantly, our results from seasonal sampling and monitoring showed that the δ88/86Sr in waters is positively correlated with their SI values (carbonate saturation) and salinity, with the heaviest or most positively fractionated stable Sr isotope signatures of +0.48 ± 0.03‰ (thus above ‘normal seawater’ of +0.39 ‰) measured in summer season (hot and dry period) in hypersaline (>70 psu) and oversaturated (SI ~1) waters. In contrast, the isotopically light and systematically lower stable Sr isotope signatures (< 0.35‰) are documented in brackish waters that are also undersaturated with respect to CaCO3 minerals (SI < 0). Overall, these results point to the primary control of carbonate dissolution versus precipitation phenomena, and thus CaCO3 saturation, on the δ88/86Sr proxy in the modern coastal marine system.

Finally, we will also illustrate how a coupled δ88/86Sr and 87Sr/86Sr approach can be applied for paleo-salinity reconstructions of the coastal marine systems, such as the Coorong Lagoon, based on the Sr isotope analysis of recent and fossil carbonate archives (bivalve shells) recovered from local sediment cores (Shao, 2022). Briefly, available results and geochemical modeling of the Sr isotope data from Holocene fossil shells suggest that over the last ~2400 years the Coorong Lagoon become progressively more evaporitic, exhibiting a temporal shift from a purported brackish paleo-lagoon to the present-day hypersaline carbonate producing system.   


References

Farkas et al. (2024) Treatise on Geochemistry, Third Edition. Elsevier (Book Chapter 00086)

Mosley et al. (2023) Marine Pollution Bulletin, 188, 1-16.  

Shao (2022) PhD Thesis, University of Adelaide 

Shao et al. (2021) GCA, 293, 461-476.  

How to cite: Farkas, J., Shao, Y., Mosley, L., Tyler, J., Tibby, J., and Eisenhauer, A.: Calibrating stable Sr isotope proxy for paleo-oceanographic studies: Insights from δ88/86Sr variability in modern and Holocene coastal marine system in South Australia , EGU General Assembly 2024, Vienna, Austria, 14–19 Apr 2024, EGU24-7103, https://doi.org/10.5194/egusphere-egu24-7103, 2024.

EGU24-7112 | ECS | Posters on site | OS3.2

POC export fluxes across the Seychelles-Chargos Thermocline Ridge in the western Indian Ocean based on 234Th as a tracer 

Junhyeong Seo, Intae Kim, Hyunmi Lee, and Suk Hyun Kim

We investigated the export flux of particulate organic carbon (POC) using 234Th as a tracer in the western Indian Ocean along 60°E and 67°E transects in 2017 and 2018. The Seychelles-Chagos Thermocline Ridge (SCTR), where production is relatively high due to nutrient replenishment by upwelling of subsurface water, was observed at 3°S – 12°S in 2017 and 4°S – 13°S both 60°E and 67°E in 2018. POC fluxes in 2017 showed no differences between the SCTR and non-SCTR regions. However, in 2018, the POC fluxes in the SCTR regions (8.52 ± 7.89 mmol Cm–2 d–1) were one order of magnitude higher than those observed in the non-SCTR regions (0.63 ± 0.07 mmol C m–2 d–1), which appeared to be related to the strong upwelling of subsurface water. These POC fluxes were comparable to those observed under bloom conditions, and thus, are important for estimating the efficiency of carbon sequestration in the ocean.

How to cite: Seo, J., Kim, I., Lee, H., and Kim, S. H.: POC export fluxes across the Seychelles-Chargos Thermocline Ridge in the western Indian Ocean based on 234Th as a tracer, EGU General Assembly 2024, Vienna, Austria, 14–19 Apr 2024, EGU24-7112, https://doi.org/10.5194/egusphere-egu24-7112, 2024.

EGU24-7805 | ECS | Orals | OS3.2

Zooplankton Fecal Pellet Flux and Carbon Export in the Deep South China Sea 

Jiaying Li, Zhifei Liu, Baozhi Lin, Yulong Zhao, Xiaodong Zhang, Junyuan Cao, Jingwen Zhang, Hongzhe Song, Thomas Blattmann, Negar Haghipour, and Timothy Eglinton

Zooplankton fecal pellets constitute a major component of passively sinking particles in the ocean. The sinking of zooplankton fecal pellets provides an efficient vehicle for the transfer and sequestration of particulate organic carbon in the deep sea, which has been widely reported in different ocean regions. However, most existing studies focus on the sinking flux of fecal pellets within the upper ocean, while the lower mesopelagic and bathypelagic zones are rarely investigated. Here, we report the spatiotemporal flux variation of zooplankton fecal pellets collected by two sediment traps deployed in mesopelagic and bathypelagic zones (500 m and 2190 m, respectively) of the southern South China Sea from June 2020 to May 2023. The average fecal pellet numerical flux is 3.21*104and 4.64*104 pellets m-2 d-1 at 500 m and 2190 m, respectively, corresponding to an average fecal pellet carbon flux from 0.43 to 0.84 mg C m-2 d-1 at these two depths. Fecal pellet fluxes display distinct seasonal patterns due to the control of the East Asian monsoon system, with higher fluxes in winter and spring, and lower fluxes in summer and autumn. Higher fecal pellet fluxes combining with the presence of extra-large pellets are found in bathypelagic zone, which is attributed primarily to in-situ reworking and repackaging of sinking particulate matter by deep-dwelling zooplankton communities, as well as lateral inputs from adjacent high productive continental coasts and shelves. We compare our results with global deep-sea (>500 m) fecal pellet flux data reported from different sediment-trap stations with distinct marine primary productivity and zooplankton biomass. Furthermore, we will report on the state of our progress on carbon isotope analysis (13C, 14C) for disentangling the source-to-sink dynamics of fecal pellets and its role in the deep-sea carbon export and sequestration.

How to cite: Li, J., Liu, Z., Lin, B., Zhao, Y., Zhang, X., Cao, J., Zhang, J., Song, H., Blattmann, T., Haghipour, N., and Eglinton, T.: Zooplankton Fecal Pellet Flux and Carbon Export in the Deep South China Sea, EGU General Assembly 2024, Vienna, Austria, 14–19 Apr 2024, EGU24-7805, https://doi.org/10.5194/egusphere-egu24-7805, 2024.

EGU24-9768 | ECS | Orals | OS3.2

Post-mortem pteropod degradation in the Southern Atlantic twilight zone 

Olivier Sulpis, Perrine Chaurand, Anne Kruijt, Ben Cala, Katja TCA Peijnenburg, Robin van Dijk, Daniëlle van der Burg, and Matthew Humphreys

Part of the carbon taken up by the ocean is transformed into biogenic particulate matter, that eventually leaves the surface ocean, settling toward the seafloor. Planktonic organisms secreting a calcium carbonate (CaCO3) shell occupy a key, but ambivalent role in this scheme. First, the precipitation of their shell generates CO2, thereby reducing the ocean CO2 sink, while the sinking of their shell constitutes a direct export of carbon to the deep ocean. Meanwhile, the dissolution of their shells generates alkalinity, which in turn boosts the capacity of seawater to take up more CO2 from the atmosphere.


CaCO3 is present in the ocean under two main mineral forms: calcite (relatively stable) and aragonite (relatively soluble). Aragonite, produced in today’s oceans mostly by pteropods, a group of pelagic snails, has a very poorly understood role in the marine carbon cycle, and key questions remain unanswered: what controls their soft parts degradation and shell dissolution in the upper kilometer of the water column? How do both processes interact?


During the BEYΩND expedition that took place in March 2023 across the Southern Atlantic, we sampled pteropods using a multinet at 5 different depth ranges in the upper kilometer. Retrieved pteropods were representative of different life stages (adults, juveniles), some still well preserved, some dead with various stages of decomposition. Individuals were then preserved into ethanol, and later scanned with a micrometric resolution using microtomography. From the scans, the post-mortem degradation of the different body parts can be appreciated, shell micro-ornamentations can be seen, and possibly gut contents, which may influence dissolution and degradation processes. From the collected scans, a reactive transport model is then applied to predict in 3D the rates at which both organic matter degradation and aragonite dissolution occur, as well as how they interact.

How to cite: Sulpis, O., Chaurand, P., Kruijt, A., Cala, B., Peijnenburg, K. T., van Dijk, R., van der Burg, D., and Humphreys, M.: Post-mortem pteropod degradation in the Southern Atlantic twilight zone, EGU General Assembly 2024, Vienna, Austria, 14–19 Apr 2024, EGU24-9768, https://doi.org/10.5194/egusphere-egu24-9768, 2024.

EGU24-9848 | Orals | OS3.2

Misconceptions of the marine biological carbon pump in a changing climate: Thinking outside the “export” box 

Angela Landolfi, Ivy Frenger, Karin Kvale, Christopher J. Somes, Andreas Oschlies, Wanxuan Yao, and Wolfgang Koeve

The marine biological carbon pump (BCP) stores carbon in the ocean interior, isolating it from exchange with the atmosphere and thereby coregulating atmospheric carbon dioxide (CO2). As the BCP commonly is equated with the flux of organic material to the ocean interior, termed “export flux,” a change in export flux is perceived to directly impact atmospheric CO2, and thus climate. Here, we recap how this perception contrasts with current understanding of the BCP, emphasizing the lack of a direct relationship between global export flux and atmospheric CO2. We argue for the use of the storage of carbon of biological origin in the ocean interior as a diagnostic that directly relates to atmospheric CO2, as a way forward to quantify the changes in the BCP in a changing climate. The diagnostic is conveniently applicable to both climate model data and increasingly available observational data. It can explain a seemingly paradoxical response under anthropogenic climate change: Despite a decrease in export flux, the BCP intensifies due to a longer reemergence time of biogenically stored carbon back to the ocean surface and thereby provides a negative feedback to increasing atmospheric CO2. This feedback is notably small compared with anthropogenic CO2 emissions and other carbon-climate feedbacks. A comprehensive view of the BCP's impact on atmospheric CO2, is a prerequisite for assessing the effectiveness of marine CO2 removal approaches mediated by biology.

How to cite: Landolfi, A., Frenger, I., Kvale, K., Somes, C. J., Oschlies, A., Yao, W., and Koeve, W.: Misconceptions of the marine biological carbon pump in a changing climate: Thinking outside the “export” box, EGU General Assembly 2024, Vienna, Austria, 14–19 Apr 2024, EGU24-9848, https://doi.org/10.5194/egusphere-egu24-9848, 2024.

EGU24-12043 | ECS | Orals | OS3.2

Reassessing the role of diatoms in carbon transfer through the Southern Ocean Twilight Zone 

Jack Williams, Sari Giering, Chelsey Baker, Hannah East, Benoit Espinola, Fred Le Moigne, Maria Villa, Katsiaryna Pabortsava, Sabena Blackbird, Corinne Pebody, Kevin Saw, Mark Moore, Stephanie Henson, Richard Sanders, and Adrian Martin

Diatoms, a ubiquitous group of phytoplankton, account for approximately 40% of particulate organic carbon (POC) exported via the ocean biological carbon pump, which modulates atmospheric CO2. Diatoms are represented in global biogeochemical models as effective vectors for sinking POC, with their large size and dense skeletons made of biogenic Silica (BSi) thought to allow rapid transfer of organic carbon to the ocean interior. However, we observe this not to be the case across large parts of the Southern Ocean mesopelagic zone. Here we present direct flux measurements from different sectors of the Southern Ocean demonstrating that silica and carbon cycles in the Southern Ocean mesopelagic are strongly decoupled, with a weak mechanistic link between BSi and POC fluxes. By combining Marine Snow Catcher flux measurements, in-situ pump, and CTD particulate data, we show that for a large part of the productive season, diatoms do not represent efficient vectors of sinking POC through the mesopelagic, yet POC is still efficiently transferred to depth. We suggest that processes influencing flux attenuation differ between the upper mesopelagic and deep ocean, with rapid BSi flux attenuation in the upper mesopelagic caused by elevated rates of BSi remineralization or negation of biomineral ballast effects by particle processes such as buoyancy regulation or fragmentation. Biomineral ballast may yet play an important role in shaping the efficiency of sinking POC transfer in the deep ocean. More broadly, these results highlight the need to understand the nuanced role this key taxon plays in transferring carbon through the mesopelagic, a region that is highly vulnerable to climate change effects and key in shaping the efficiency of downward carbon transport. As diatoms appear to be inefficient at delivering carbon to the deep ocean, projected losses in the strength of the Southern Ocean BCP due to shifts in phytoplankton community composition to smaller size classes may be less than previously predicted.

How to cite: Williams, J., Giering, S., Baker, C., East, H., Espinola, B., Le Moigne, F., Villa, M., Pabortsava, K., Blackbird, S., Pebody, C., Saw, K., Moore, M., Henson, S., Sanders, R., and Martin, A.: Reassessing the role of diatoms in carbon transfer through the Southern Ocean Twilight Zone, EGU General Assembly 2024, Vienna, Austria, 14–19 Apr 2024, EGU24-12043, https://doi.org/10.5194/egusphere-egu24-12043, 2024.

Phytoplankton acclimate to increased nutrient stress by decreasing their cellular quotas (nutrient:carbon ratios). Reducing cellular quotas reduces the export efficiency of the limiting nutrient, helping sustain biological productivity. Here we present a version of the Community Earth System Model with phytoplankton group specific, fully variable C:N:P:Fe:Si ratios constrained by field observations of particulate organic matter stoichiometry and individual cell spectroscopy. We compare the results of a steady-state fully fixed stoichiometry model to the fully variable model and find that using a fixed Redfield stoichiometry leads to a decrease of 1PgC/yr carbon export, increase of 18 ppm atmospheric CO2, decrease of 55 TgN/yr nitrogen fixation, and decrease of 27/yr TgN nitrogen fixation. We also investigate the impacts of variable nutrient acquisition on global patterns of nutrient limitation and find that the weaker ability of phytoplankton to acclimate to N stress by lowering their cellular quotas relative to other nutrients pushes marine ecosystems towards nitrogen limitation. Only when the nutrient supply ratios are highly skewed, exceeding the ability of the phytoplankton to acclimate, do other nutrients become growth-limiting, as with iron in the High Nitrate, Low Chlorophyll (HNLC) regions. We show that in the oligotrophic gyres, variable plankton stoichiometry, given sufficient time, pushes the marine ecosystems towards co-limitation, as non-limiting nutrients are more efficiently drawn down and exported (higher cellular quotas), relative to the growth-limiting nutrient (lower cellular quotas).

How to cite: Wiseman, N., Moore, J. K., and Martiny, A. C.: Phytoplankton variable elemental composition modifies the marine biological pump and largely determines the global patterns of nutrient limitation, EGU General Assembly 2024, Vienna, Austria, 14–19 Apr 2024, EGU24-12166, https://doi.org/10.5194/egusphere-egu24-12166, 2024.

EGU24-12853 | ECS | Posters virtual | OS3.2

Molecular characterization of the sedimentary organic matter deposited off central Peru (12 – 14ºS): first insights into preservation processes 

Maricarmen Igarza, Michelle Graco, Mohammed Boussafir, Abdelfettah Sifeddine, Jorge Valdés, and Dimitri Gutiérrez

Phytoplankton production represents the ultimate source of organic matter in the ocean; thus, the study of organic compounds can give us information related to organic matter (OM) origin and transformations. Usually less than 1% of the OM produced in the ocean surface reaches the seafloor, although in highly productive regions nearly 10% can be buried and subjected to further degradation. The Peruvian upwelling system is among the most productive marine ecosystems in the world ocean, with high primary production sustained mainly in a year-round upwelling. Along the Peruvian continental margin, variations in primary production, bottom dissolved oxygen, and depth influence OM accumulation and preservation, and thus determine the existence of different depositional environments. Previous geochemical and palaeoceanographic studies have shown that the best records of well-preserved OM are found towards the central area of the Peruvian continental margin, between 12°S and 14°S. Therefore, the study of organic compounds, particularly lipids, deposited in surface sediments could give us information regarding early diagenetic processes related to OM degradation/preservation. The objective of this study was to characterize both the solvent extractable OM fraction (i.e. free lipids) and the insoluble OM fraction (i.e. protokerogen) in order to elucidate possible preservation mechanisms involved in OM accumulation. A total of 14 surface sediment samples from different locations between 12°S and 14°S were analyzed by means of gas chromatography mass spectrometry. Organic compounds such as short-chain and long-chain alkanes and fatty acids were quantified in the solvent-extractable OM fraction, which allowed the calculation of a pristane/phytane index and a carbon preference index. In the insoluble OM fraction, alkanes and fatty acids were also quantified together with dithiophene and benzothiophene compounds and organic sulfur heterocompounds. Overall, our results allowed a detailed geochemical molecular characterization of the OM deposited in surface sediments beneath one of the most productive areas of the Peruvian coast. The differences observed in both the n-alkane and fatty acids distribution between the solvent-extractable OM fraction and the insoluble OM fraction, together with the quantification of sulfur compounds in the insoluble fraction, suggests that complex diagenetic processes occur in surface sediments. An important part of the freshly-produced OM in the highly productive surface waters off central Peru reaches the seafloor and undergoes preservation mechanisms mainly related to natural sulfurization and selective preservation, tightly coupled to the reduced conditions that characterize surface sediments in the area.

How to cite: Igarza, M., Graco, M., Boussafir, M., Sifeddine, A., Valdés, J., and Gutiérrez, D.: Molecular characterization of the sedimentary organic matter deposited off central Peru (12 – 14ºS): first insights into preservation processes, EGU General Assembly 2024, Vienna, Austria, 14–19 Apr 2024, EGU24-12853, https://doi.org/10.5194/egusphere-egu24-12853, 2024.

EGU24-12937 | Posters on site | OS3.2

Reconstructing past seawater δ88/86Sr from calcium-sulfates (gypsum and anhydrite) 

Netta Shalev, Stefano Lugli, Vinicio Manzi, Christoph Leitner, Yining Li, and Yana Kirichenko

Records of the stable-Sr isotope composition of past seawater, δ88/86Srsw, have recently been demonstrated to be good proxies for the evolution of the marine ‘carbonate factory’, the ultimate sink of carbon from the ocean-atmosphere system [e.g., 1-3]. Nevertheless, these records are incomplete, and they generally do not overlap in age. Thus, despite their proven significance, these records have not been validated by data from any independent archives. The Ca-sulfate minerals, gypsum (CaSO4∙2H2O), and its burial transformation product, anhydrite (CaSO4), are relatively abundant in ancient evaporitic sequences and they contain Sr in typically high concentrations of 1000-2000 ppm. In a previous study, we show that gypsum is always 88Sr-enriched relative to its precipitating solution by around 0.2‰ and that it is possible to detect significant variations in past δ88/86Srsw (≥0.1‰) from ancient gypsum/anhydrite samples from the geological record.

Here, we study Phanerozoic Ca-sulfate samples of four different ages: Ordovician, Triassic, Cretaceous, and Messinian. Preliminary δ88/86Sr results are in the range of 0.29 – 0.67‰. Most of the results cluster between the calculated gypsum composition expected for the two known extreme cases of seawater δ88/86Sr values inferred from Ca-carbonate archives: the high- δ88/86Sr Precambrian seawater [3], and Late Permian seawater - the Phanerozoic minimum [2]. Thus, our preliminary Phanerozoic data are generally in accordance with the suggestion that the long-term Precambrian seawater δ88/86Sr is higher than the Phanerozoic long-term background [3]. Furthermore, our preliminary data point to significant seawater δ88/86Sr variations during the Phanerozoic, with lower values in the Ordovician and Triassic relative to Cretaceous and Messinian samples. Such variations may suggest major changes in the ‘carbonate factory’ in the ocean between the Triassic and Cretaceous. It is further suggested that such variations in the mineralogy and/or flux of marine carbonates may result from evolutionary changes in marine calcifiers.


[1] Paytan et al. (2021) A 35-million-year record of seawater stable Sr isotopes reveals a fluctuating global carbon cycle. Science 371(6536), 1346-1350.

[2] Vollstaedt et al. (2014) The Phanerozoic δ88/86Sr record of seawater: New constraints on past changes in oceanic carbonate fluxes. Geochim. Cosmochim. Acta 128, 249–265.

[3] Wang et al. (2023) The evolution of the marine carbonate factory. Nature, 1-5.

[4] Kirichenko et al. (n.d.), First Insights into Strontium Isotope Fractionation in Gypsum and Its Geochemical Implications. Under review in Geochim. Cosmochim. Acta.

How to cite: Shalev, N., Lugli, S., Manzi, V., Leitner, C., Li, Y., and Kirichenko, Y.: Reconstructing past seawater δ88/86Sr from calcium-sulfates (gypsum and anhydrite), EGU General Assembly 2024, Vienna, Austria, 14–19 Apr 2024, EGU24-12937, https://doi.org/10.5194/egusphere-egu24-12937, 2024.

EGU24-13298 | ECS | Posters on site | OS3.2

Carbonate Compensation Depth and Carbonate Carbon Flux in the Pacific Ocean over the Cenozoic  

Faranak Dalvand, Adriana Dutkiewicz, R. Dietmar Müller, Nicky M. Wright, and Ben R. Mather

The Pacific Ocean, the largest ocean basin, plays a critical role in the global carbon cycle, where a massive quantity of deep-sea sediment is sequestered on the seafloor and ultimately transferred into the mantle through its extensive subduction zones. However, the fluxes of carbonate carbon to the seafloor, and the volume stored and subducted in the Pacific remains relatively unknown over the Cenozoic. Here we estimate the carbonate carbon flux to the Pacific seafloor since the early Cenozoic by modelling the evolution of the carbonate compensation depth (CCD), defined as the water depth where carbonate supply from the surface equals its dissolution at depth. This results in a lack of carbonate sediments below the CCD. Except for the eastern equatorial region, the CCD is poorly constrained or unknown in other regions of the Pacific. Given the regional and latitudinal variations in oceanographic parameters affecting carbonate sedimentation (e.g., water chemistry, surface productivity) across the Pacific basin, the Cenozoic CCD is modelled for six regions of the western and eastern North Pacific, western tropical Pacific, eastern equatorial Pacific, and western and eastern South Pacific. We utilize 110 deep-sea drill sites from DSDP, ODP and IODP expeditions to reconstruct the paleo-water depth through time at each location using pyBacktrack software. We carry out a linear reduced major-axis regression of the carbonate accumulation rate (CAR) versus paleo-water depth to compute the CCD in 0.5 My time intervals, incorporating dynamic topography and eustatic sea-level in our computations. We find that the CCD has fluctuated over the Cenozoic by ~1–1.2 km and shows distinct variabilities within the six regions of the Pacific. For example, a relatively shallow CCD (~2.8–4 km) across the western North and eastern South Pacific versus a deep CCD (~4–4.7 km) in the eastern equatorial region, and highly fluctuating western tropical CCD over the late Cenozoic, suggest substantial latitude-longitude control on the carbonate flux. The results indicate that the total carbonate carbon flux is primarily dominated by the eastern equatorial region between the early Oligocene and the middle Miocene (to maximum 55 Mt C/yr), due to enhanced nutrient concentration and higher primary productivity rate, as reflected by a deeper CCD. This contrasts with minimal carbonate carbon flux in the eastern and western North Pacific ranging between 0 and 5 Mt C/yr over the Cenozoic. Additionally, the Pacific total carbonate carbon mass has experienced a modest rise from the early Eocene (55 Ma) to the early Oligocene at ~34 Ma (from 3000 to 3500 Mt), followed by a gradual increase, reaching 4400 Mt at the present day. This recorded progressive rise since the early Oligocene coincides with the initiation of the Antarctic ice-sheet growth and intensified continental silicate weathering and alkalinity input to the oceans. Our new modelling of the CCD to assess the evolution of the Pacific deep-sea carbonate carbon reservoir during the Cenozoic improves constraints on deep carbon computations in the context of the global carbon cycle. 

How to cite: Dalvand, F., Dutkiewicz, A., Müller, R. D., M. Wright, N., and R. Mather, B.: Carbonate Compensation Depth and Carbonate Carbon Flux in the Pacific Ocean over the Cenozoic , EGU General Assembly 2024, Vienna, Austria, 14–19 Apr 2024, EGU24-13298, https://doi.org/10.5194/egusphere-egu24-13298, 2024.

EGU24-13592 | Orals | OS3.2

Present-day global patterns of the ocean carbonate pump and the key drivers of CaCO3 dissolution 

Eun Young Kwon, John Dunne, and Kitack Lee

Calcifying organisms produce calcium carbonate (CaCO3) shells and skeletons. When they die, biogenic CaCO3 is vertically exported from the euphotic zone and dissolves throughout the water column and in sediments. The alkalinity generated from this process can influence the ocean’s buffer capacity for absorbing atmospheric CO2. However, the magnitude and driver of surface CaCO3 export and subsequent dissolution in the ocean’s interior – a process called the carbonate pump – are highly uncertain. We present key drivers of pelagic CaCO3 dissolution constrained by an inverse ocean biogeochemistry model combined with multiple observation databases. Within the upper twilight zone (shallower than 300 m), we found a tight association between particulate organic carbon remineralization rates and the CaCO3 dissolution efficiency (the fraction by which the surface exported CaCO3 dissolves), which is further supported by the observed particle flux and concentration data. In the deep ocean (deeper than 300 m), dissolution of CaCO3 is primarily driven by conventional thermodynamics of CaCO3 solubility with reduced fluxes of CaCO3 burial to marine sediments beneath more corrosive North Pacific deep waters. Shallow CaCO3 dissolution, shown to be sensitive to ocean export production, can increase the neutralizing capacity for respired CO2 by up to 6% in low-latitude thermocline waters. Without shallow dissolution, the ocean might lose 20% more CO2 to the atmosphere through the low-latitude upwelling regions – the world’s largest area of CO2 outgassing in the contemporary climate. Our work identifies a previously overlooked sensitivity of oceanic CO2 uptake to the biological pump. We suggest that Earth system models need to include the respiration driven CaCO3 dissolution processes for a better projection of future oceanic carbon sink.

How to cite: Kwon, E. Y., Dunne, J., and Lee, K.: Present-day global patterns of the ocean carbonate pump and the key drivers of CaCO3 dissolution, EGU General Assembly 2024, Vienna, Austria, 14–19 Apr 2024, EGU24-13592, https://doi.org/10.5194/egusphere-egu24-13592, 2024.

EGU24-13608 | ECS | Orals | OS3.2 | Highlight

Ocean chemistry archived in modern evaporites: implications for robust seawater and CO2 reconstructions from Earth’s past 

Hana Jurikova, Robert Bodnar, Oscar Branson, Matthew Dumont, David Evans, Fernando Gázquez, Yana Kirichenko, Boaz Lazar, Mao-Chang Liang, Tim Lowenstein, Eszter Sendula, Claudia Voigt, Chen Xu, Xinyuan Zheng, and James Rae

The chemical history of seawater provides key information on Earth’s geologic processes and is fundamental for robust CO2 reconstructions. The knowledge of the secular evolution of the oceanic boron isotope budget is particularly important for CO2 reconstruction from boron isotopes. The boron isotope composition of seawater (δ11Bsw) is homogeneous, but varies on multi-million year time scales, given its residence time of approximately 10 million years. To date, the secular evolution of the oceanic boron isotope budget has been difficult to constrain, posing a major uncertainty for boron-based pH and CO2 reconstructions from Earth’s geologic past and critically limiting our understanding of the global biogeochemical cycling of this important element through time. Evaporitic minerals bearing fluid inclusions – and halites in particular – have provided important insights on past variations in major and minor ion composition, and present a highly appealing archive for reconstructing δ11Bsw (as well as other isotopic systems) given their direct origin from seawater. However, the interpretation of their signatures is not straightforward due to the possibility of fractionation during evaporation, crystallisation, and local biogeochemical interactions. Here we present data illuminating the evolution of boron isotopes and various other elements during evaporite formation from laboratory experiments and natural modern evaporitic settings across the globe, accompanied by new analytical developments for high-precision single fluid inclusion measurement using laser ablation. These data enable us to critically evaluate the evaporite archive, paving an avenue to robust seawater and CO2 reconstructions from Earth’s geological past.

How to cite: Jurikova, H., Bodnar, R., Branson, O., Dumont, M., Evans, D., Gázquez, F., Kirichenko, Y., Lazar, B., Liang, M.-C., Lowenstein, T., Sendula, E., Voigt, C., Xu, C., Zheng, X., and Rae, J.: Ocean chemistry archived in modern evaporites: implications for robust seawater and CO2 reconstructions from Earth’s past, EGU General Assembly 2024, Vienna, Austria, 14–19 Apr 2024, EGU24-13608, https://doi.org/10.5194/egusphere-egu24-13608, 2024.

Secular variations in the major ion chemistry and isotopic composition of seawater on multimillion-year time scales over the Phanerozoic are well documented, but the causes of these changes are debated. δ7Li and 87Sr/86Sr are widely utilized to interpret the driving mechanisms of secular changes in seawater chemistry, the tectonic history of the Earth and the link between paleo-ocean chemistry and the carbon cycle. These interpretations and models, however, are based on (1) few quantitative data on strontium concentration [Sr]SW in seawater calculated from the Sr/Ca ratios of marine carbonates and (2) the assumption that the Li concentration [Li]sw of seawater has been similar to modern [Li]sw. But those assumptions, if inaccurate, could undermine the validity of modeling results. The marine strontium and lithium cycles through time could be better reconstructed using coupled marine records of [Sr]SW, 87Sr/86Sr, [Li]sw and δ7Li. [Sr]SW and [Li]sw in ancient seawater would be particularly useful for examining which global processes, continental weathering or global volcanicity at seafloor hydrothermal systems and subduction zones, exerted the dominant control on the changes in seawater chemistry. Recent analytical advances using combined cryo-SEM-EDS and laser ablation ICP-MS now allow quantitative measurement of [Sr]FI and [Li]FI in fluid inclusions in halite. [Sr]SW and [Li]sw, reconstructed from chemical analyses of >1,000 fluid inclusions in more than 100 halite samples with marine 87Sr/86Sr values, varied seven-ten-fold and oscillated twice between high- and low-Sr and Li concentrations over the past 550 million years, in rhythm with Ca-rich and SO4-poor paleoseawater intervals, calcite-aragonite seas, supercontinent breakup, dispersal, and assembly cycles, greenhouse–icehouse climates, and modeled atmospheric pCO2. These data enable us to better constrain the Sr and Li cycle, and offer new insights into geochemical modeling of Phanerozoic seawater chemistry using multiple isotope systems and seawater concentrations. 

How to cite: Weldeghebriel, M., Lowenstein, T., and Higgins, J.: Variability in strontium and lithium composition of ancient seawater from fluid inclusions in halite—implications for reconstructing drivers of seawater secular variability, EGU General Assembly 2024, Vienna, Austria, 14–19 Apr 2024, EGU24-13908, https://doi.org/10.5194/egusphere-egu24-13908, 2024.

EGU24-16877 | ECS | Orals | OS3.2

Impacts of dynamically simulated biogenic particles and iron on the marine carbon cycle 

Markus Adloff, Ashley Dinauer, Charlotte Laufkötter, Frerk Pöppelmeier, Aurich Jeltsch-Thömmes, and Joos Fortunat

We present a novel mechanistic representation of both organic and inorganic marine particles within the Bern3D Earth system model of intermediate complexity, which is based on the columnar particle flux model MSPACMAM. This new approach moves away from the assumption of globally and temporally invariant sinking profiles. Instead, the new scheme calculates sinking speeds and remineralisation and dissolution rates based on local temperature, density, and seawater chemistry. When combined with an improved representation of dynamic iron release and scavenging, this scheme introduces new dynamic feedbacks in the response of the biological pump to climate and circulation changes in the Bern3D model. Particle remineralisation and dissolution rates are now functions of temperature, oxygenation, saturation state, and sinking speed. The sinking rate is in turn modulated by changes in export production (amount and composition) as well as the viscosity of seawater. In addition to light and macronutrients, export production is affected by iron availability, which is depending on the rate of iron removal through scavenging and iron release from decaying particles and sediments, both processes that depend on organic particle fluxes and local oxygen concentrations. We demonstrate the non-linear interactions between these new dependencies in transient and steady-state simulations of various climatic boundary conditions. The newly introduced particle concentrations sensitive to changes in temperature and density result in shallower carbonate dissolution and deeper organic particle remineralisation in the Southern Ocean under full glacial conditions. In idealized scenarios of anthropogenic climate change, there is a smaller decline of export production but faster oxygen depletion than with the old static particle decay scheme. In addition, organic particle fluxes affect sedimentary iron release, which can lead to a positive feedback on export production if the released iron reaches the surface ocean.

How to cite: Adloff, M., Dinauer, A., Laufkötter, C., Pöppelmeier, F., Jeltsch-Thömmes, A., and Fortunat, J.: Impacts of dynamically simulated biogenic particles and iron on the marine carbon cycle, EGU General Assembly 2024, Vienna, Austria, 14–19 Apr 2024, EGU24-16877, https://doi.org/10.5194/egusphere-egu24-16877, 2024.

EGU24-16921 | Orals | OS3.2

Geochemical characterization of Mediterranean Outflow Waters in the modern ocean: Nd isotopes, carbon cycle and new export constraints 

Leopoldo D. Pena, Sara Campderrós, Ester García-Solsona, Eduardo Paredes-Paredes, Jaime Frigola, César Nicolás Rodríguez-Díaz, Arturo Lucas, Eva Calvo, Carles Pelejero, and Isabel Cacho

The North Atlantic Ocean plays a critical role in the global circulation system, regulating the penetration of surface waters into the deep ocean, but also in key ocean biochemical cycles (e.g. carbon, oxygen, nutrients). Meridional heat and salt transport (i.e. buoyancy) drive the formation of different water masses and their circulation pathways. A relatively unknown but important element controlling the net meridional export of heat, salt and other chemical species into the North Atlantic is the Mediterranean Outflow Water (MOW): the salt injector. In this work, we present the first high resolution systematic study of traditional (T, S, Nutrients) and novel (Nd isotopes, alkalinity, pH) geochemical parameters of MOW waters from its source area at the Strait of Gibraltar up to the northern Iberian margin (Cantabric Sea). During the TRANSMOW cruise in spring 2021, over 500 seawater samples were collected along the main MOW pathway following its northward flow. A comprehensive suite of geochemical parameters including εNd, alkalinity, pH and preformed nutrients were analyzed for these samples. We show that MOW can be ‘traced’ unequivocally using εNd as a conservative tracer, a feature that opens a new set of possibilities to better estimate the contribution of MOW export to higher latitudes in the North Atlantic Ocean. Other parameters directly linked to the carbon cycle (alkalinity and pH) are also controlling the distinctive chemical properties of the Mediterranean waters.. One of the key advantages of these geochemical tracers is that they allow to better quantify export and mixing rates of MOW with North Atlantic waters. Using statistical tools such as the Optimum Multi-Parameter Analysis (OMPA) on an array of conservative tracers we have quantified mixing rates and exports between different water masses. These results will be fundamental to better constrain paleoreconstructions in the sedimentary record using different proxies such as Nd and B isotopes (for water mass distribution and pH), B/Ca ratios (for seawater carbonate ion saturation) and even new experimental proxies such as Na/Ca (for salinity).

How to cite: Pena, L. D., Campderrós, S., García-Solsona, E., Paredes-Paredes, E., Frigola, J., Rodríguez-Díaz, C. N., Lucas, A., Calvo, E., Pelejero, C., and Cacho, I.: Geochemical characterization of Mediterranean Outflow Waters in the modern ocean: Nd isotopes, carbon cycle and new export constraints, EGU General Assembly 2024, Vienna, Austria, 14–19 Apr 2024, EGU24-16921, https://doi.org/10.5194/egusphere-egu24-16921, 2024.

EGU24-18309 | ECS | Orals | OS3.2

Examining the utility of barium isotopes as a tracer of large-scale seafloor methane venting 

Ethan Petrou, Luke Bridgestock, Gideon M. Henderson, Yu-Te Hsieh, Germain Bayon, and Nolwenn Lemaitre

Global warming has the potential to release large quantities of methane (CH4) from marine sediments, representing a positive carbon cycle-climate feedback [1]. Unambiguous evidence of this feedback in the geological record will improve understanding of the potential risk it poses for exacerbating anthropogenic global warming. For example, climate driven sedimentary CH4 release is one of the hypothesized mechanisms for the onset of the Paleocene-Eocene Thermal Maximum (PETM) [2]. Increased sedimentary barium (Ba) burial rates have been interpreted as evidence of this mechanism [2,3], but these records are also sensitive to other processes [4]. Stable Ba isotope variations are a new geochemical tool that may improve interpretations of such records, potentially leading to clearer geological insights into the significance of this carbon cycle-climate feedback.

This study aims to determine (1) the flux and isotope composition of Ba across the sediment-water interface associated with seafloor CH4 venting and (2) the significance of these fluxes for the marine Ba inventory. To achieve this, Ba concentration and isotope data is presented for seawater samples at different altitudes above the seafloor (1m to 60m) collected across the Regab pockmark, a methane cold seep offshore Congo. Samples were collected with a remotely operated vehicle, providing a high resolution of sample collection within the benthic boundary layer, spanning areas of varying CH4 venting fluxes.

The measured Ba isotope values from all sites possess δ138/134Ba values +0.20 to +0.40 ‰ and [Ba] values 80.0 – 90.6 nmol kg-1, which are typical of ambient seawater from this depth range. Furthermore, no difference in dissolved Ba isotopes or Ba concentrations with altitude at each location is observed and there is no significant difference in seawater [Ba] and Ba isotope composition between locations featuring different dissolved seawater CH4 concentrations.

These results are interpreted to show that there is no resolvable difference in the [Ba] vs. δ138/134Ba relationship over the pockmark, and any Ba fluxes are too small to resolve in a circulating water column. This likely reflects the quantitative removal of pore water Ba by barite precipitation within the upper sediments, preventing significant Ba release to the water column.

The findings indicate CH4 seeps do not seem to significantly impact either the dissolved Ba concentration or isotope composition of the ocean, and consequently makes the use of sedimentary Ba concentration and isotope records as a tracer of past CH4 release events questionable. These insights suggest caution should be held when developing Ba isotopes as a novel tracer of past large-scale seafloor methane release i.e. PETM sediments. The study also provides insights on the influence of methane seep environments on Ba isotopes and the factors governing the stable isotope distribution of Ba in both modern and ancient sediments and oceans.


Reference:

[1] James et al., (2017), Limnology and Oceanography, 61, S283-S299

[2] Dickens et al., (2003), GSA Special Paper, 369, 11-23

[3] Frieling et al., (2019), Palaeoceanography and paleoclimatology, 34, 546-566

[4] Bridgestock et al., (2019), Earth and Planetary Science Letters, 510, 53-63

How to cite: Petrou, E., Bridgestock, L., Henderson, G. M., Hsieh, Y.-T., Bayon, G., and Lemaitre, N.: Examining the utility of barium isotopes as a tracer of large-scale seafloor methane venting, EGU General Assembly 2024, Vienna, Austria, 14–19 Apr 2024, EGU24-18309, https://doi.org/10.5194/egusphere-egu24-18309, 2024.

EGU24-18479 | ECS | Posters on site | OS3.2

Developing machine learning algorithms to quantify carbon export fluxes in the ocean 

Beatriz González-González, María Villa-Alfageme, Unai Abascal-Ruiz, and Santiago-José Hurtado-Bermúdez

Quantifying the ocean carbon export and sequestration is essential to understand not only the marine carbon cycle but also the impact of the biological pump (BP) on global carbon cycle. The BP includes the different mechanisms by which atmospheric carbon is transferred from the surface to the deep ocean in a process started by the carbon synthetization of phytoplankton and followed by the formation and sinking of the marine snow, enabling the storage of carbon for long periods of time. Particulate organic carbon (POC) downward flux is a key and necessary parameter to characterize the BP and the ocean carbon cycle models.

In order to estimate POC flux, radioactive pairs (238U-234Th or 210Pb-210Po) disequilibrium and sediment traps are robust and accurate methods; however, they generally present low spatial-temporal resolution. In situ optical observations have shown a big potential to generate a wide database of POC fluxes.

Artificial intelligence (AI) and machine learning (ML) algorithms have already shown their potential in the last years to improve the estimations of oceanic POC concentration. It can be obtained as a satellite-derived product using colour remote sensing data, as POC is correlated with optical properties and water components (suspended particulate matter and chlorophyll-a). In contrast, ML have just only recently started to be used to evaluate POC export fluxes, partly because the lack of consistent and extensive datasets combining POC fluxes and ancillary parameters.

Here, we review the state of art of the use of ML techniques for POC concentration predictions as the cornerstone for estimations of POC export fluxes. The potential of ML methodologies to generate global reconstructions of particle fluxes in the ocean, using the current available POC flux databases, will be discussed and described. We will finally include general guidelines to analyse POC export evaluations using ML and comprehensive databases.

How to cite: González-González, B., Villa-Alfageme, M., Abascal-Ruiz, U., and Hurtado-Bermúdez, S.-J.: Developing machine learning algorithms to quantify carbon export fluxes in the ocean, EGU General Assembly 2024, Vienna, Austria, 14–19 Apr 2024, EGU24-18479, https://doi.org/10.5194/egusphere-egu24-18479, 2024.

EGU24-19416 | ECS | Posters on site | OS3.2

Projections and drivers of future changes in biological pump as inferred from apparent oxygen utilizations  

Damien Couespel, Jerry Tjiputra, Siv Kari Lauvset, and Nadine Goris

The biological carbon pump (BCP) stores a large quantity of carbon in the deep ocean and is a major contributor to the surface to depth gradient in dissolved inorganic carbon. Without the BCP, the atmospheric CO2 concentration would be higher by about 200 ppm. Thus, the BCP is a key component of the global carbon cycle, and yet its future evolution is highly uncertain. In model simulations, changes in the BCP are often estimated using the Apparent Oxygen Utilisation (AOU) that measures the difference between the in-situ oxygen content and the saturated oxygen content. With a changing climate, AOU can vary because of changes in ocean circulation or changes in remineralization. Here, we combine AOU with water mass ideal age to take apart changes in the BCP due to circulation change and to remineralization change. We will apply our analysis to a set of Earth System Models under different global warming scenarios. We will determine the sensitivity of these drivers to different level of climate change and investigate the spatio-temporal variability and magnitude of the projected BCP changes. This analysis may help to trace models uncertainty in future BCP change back to ocean physic and marine biogeochemistry. 

How to cite: Couespel, D., Tjiputra, J., Lauvset, S. K., and Goris, N.: Projections and drivers of future changes in biological pump as inferred from apparent oxygen utilizations , EGU General Assembly 2024, Vienna, Austria, 14–19 Apr 2024, EGU24-19416, https://doi.org/10.5194/egusphere-egu24-19416, 2024.

EGU24-19534 | Orals | OS3.2

Foraminiferal biomineralization: mechanisms, calcite chemistry and evolution 

Lennart de Nooijer, Laura Pacho Sampedro, Daniel Francois, Szabina Karancz, and Gert-Jan Reichart

Many foraminifera form shells made of calcium carbonate. The elemental and isotopic composition of these shells varies greatly from inorganically precipitated calcites, suggesting a strong biological control on the process of CaCO3 precipitation. Moreover, this composition differs, sometimes greatly, between species, which may indicate that the controls on calcite chemistry is not fixed among all species. For paleoceanographic application, a better grip on this inter-species variability in calcite chemistry is necessary. Here we present the latest insights in environmental controls on element incorporation, biomineralization mechanisms and evolutionary patterns in biomineralization. An integrated understanding of foraminiferal calcification will also allow predicting their response to changes in marine inorganic carbon chemistry (e.g. ocean acidification), which in turn, is necessary to assess the contribution of changes in foraminiferal calcification rates to (surface) marine inorganic carbon cycling.

How to cite: de Nooijer, L., Pacho Sampedro, L., Francois, D., Karancz, S., and Reichart, G.-J.: Foraminiferal biomineralization: mechanisms, calcite chemistry and evolution, EGU General Assembly 2024, Vienna, Austria, 14–19 Apr 2024, EGU24-19534, https://doi.org/10.5194/egusphere-egu24-19534, 2024.

EGU24-19571 | ECS | Orals | OS3.2

Sulfur incorporation in (foraminiferal) calcite 

Szabina Karancz, Joji Uchikawa, Lennart J. de Nooijer, Mariëtte Wolthers, Kyle Conner, Corinne Hite, Geert-Jan A. Brummer, Julie Lattaud, Negar Haghipour, Yair Rosenthal, Richard E. Zeebe, Shiv Sharma, and Gert-Jan Reichart

Sulfur over calcium ratio (S/Ca) in foraminiferal calcite has been suggested as a potential tool to reconstruct seawater carbonate ion concentration ([CO32-]). The approach of using sulfur incorporation as a proxy for the carbon system was based on benthic foraminiferal controlled growth experiments, which suggested that foraminifera incorporate more sulfur when there is less [CO32-] available in the seawater. With sulfate ([SO42-]) being proposed to be the dominant form in which sulfur is incorporated in the calcium carbonate of the foraminiferal shells, S/Ca would provide an independent parameter for the reconstruction of seawater inorganic carbon chemistry. To further explore the potential of this proxy, we used five planktonic foraminiferal species collected from the field. S/Ca values in planktonic foraminifera collected from core-top sediments that span a large range of growth conditions (temperature, salinity, [CO32-] and [HCO3-]) reveal an opposite trend with [CO32-] compared to the results from the benthic foraminifera culture experiments. Moreover, we found an additional effect of incorporation of Mg on S/Ca ratios, or a combined effect on both. Using the ratio of S to Mg overcomes this issue and S/Mg ratios correlate with [CO32-]. Still, these correlations are likely affected by multiple parameters and/or incorporation pathways other than only SO42- as suggested by our inorganic calcite growth experiments. Results of this study suggest a critical evaluation of the use of foraminiferal S/Ca, considering the aqueous species involved during uptake and potentially combining other elements that may share controls.

How to cite: Karancz, S., Uchikawa, J., de Nooijer, L. J., Wolthers, M., Conner, K., Hite, C., Brummer, G.-J. A., Lattaud, J., Haghipour, N., Rosenthal, Y., Zeebe, R. E., Sharma, S., and Reichart, G.-J.: Sulfur incorporation in (foraminiferal) calcite, EGU General Assembly 2024, Vienna, Austria, 14–19 Apr 2024, EGU24-19571, https://doi.org/10.5194/egusphere-egu24-19571, 2024.

EGU24-22422 | ECS | Posters on site | OS3.2

Temporal variations of sinking particulate organic radiocarbon in the deep Sargasso Sea 

Charlotte Schnepper, Rut Pedrosa-Pamies, Maureen Conte, Nicolas Gruber, Negar Haghipour, and Timothy Ian Eglinton

The imprint of bomb radiocarbon on sinking particulate organic carbon (PO¹⁴C) intercepted by sediment traps, together with flux and elemental data, provides information about the origin and dynamics of oceanic particles (Hwang et al., 2010). Of particular interest is the question of the degree to which sinking POC in the deep ocean stems from overlying primary production, i.e., vertical supply via the biological pump, versus other processes such as advection and subsequent aggregation of resuspended sedimentary carbon originating from continental margins and other distal sources (Conte et al., 2019). In this context, natural abundance variations in 14C serves as a useful tracer given contrasting signatures recently fixed and pre-aged carbon sources. To quantify the seasonal to inter-annual variability in sinking PO¹⁴C, we have analyzed sediment trap samples from the Oceanic Flux Program (OFP) in the Sargasso Sea, a deep ocean time-series which has examined the particle flux and its composition at 500, 1500 and 3200 m water depths since 1978.

Radiocarbon measurements of POC of all OFP samples spanning September 2012 to December 2015 reveal seasonal and subseasonal variations in sinking PO¹⁴C with an amplitude in Δ¹⁴C values of ca. 100 ‰. This variability in Δ¹⁴C values is inversely linearly correlated with the proportion of lithogenic material to POC (LM:POC; r2=4.2, p <0.01). This relationship suggests that POC with high Δ¹⁴C values and a low LM:POC ratio reflect the supply of particles that sink vertically via the biological pump. Conversely, lower Δ¹⁴C values and high LM:POC ratios indicate laterally transported materials originating from resuspended sediments containing pre-aged organic carbon. Significant deviations from the linear regression (p <0.01) correlate with δ13C values, indicating an increased state of POC remineralization that is independent of Δ¹⁴C variations attributable to particle provenance.  

Over the 3.3 year period of observation, POΔ¹⁴C decreased by ca. 26 %, exceeding the expected annual decline (~6 ‰) based on reconstructed surface DI14C. This decline potentially could be linked to different source(s) of laterally supplied aged organic carbon associated with lithogenic material and/or a shift in the POΔ¹⁴C of the overlying flux (e.g.  from reduction in particle sinking speeds, enhanced decomposition, increased incorporation of aged suspended particles and/or dissolved organic carbon into the sinking flux). On-going work extending the OFP time-series will examine these multiyear trends and assess potential variability in the balance between vertically exported and laterally supplied POC to the deep ocean flux in the deep Sargasso Sea, enabling a better understanding of the underlying processes which control POC dynamics. 

How to cite: Schnepper, C., Pedrosa-Pamies, R., Conte, M., Gruber, N., Haghipour, N., and Eglinton, T. I.: Temporal variations of sinking particulate organic radiocarbon in the deep Sargasso Sea, EGU General Assembly 2024, Vienna, Austria, 14–19 Apr 2024, EGU24-22422, https://doi.org/10.5194/egusphere-egu24-22422, 2024.

EGU24-1000 | ECS | Orals | OS3.3

Semi-automatic geospatial modeling supporting restoration actions on a Posidonia oceanica meadow offshore Civitavecchia (eastern Tyrrhenian margin, Mediterranean Sea) using Object-Based Image Analysis on acoustic remote sensing data 

Luca Marino, Luca Fallati, Andrea Giulia Varzi, Giorgio Fersini, Daniele Piazzolla, Sergio Scanu, Marco Marcelli, and Alessandra Savini

Marine restoration projects are becoming increasingly important worldwide to mitigate human-driven impacts on marine ecosystems. Nonetheless, their success rate is highly fluctuating and depends upon a number of variables, such as bio-ecological features of the involved species and the geospatial and geomorphological drivers proper to the habitat concerned. Geospatial and geomorphological variables are undoubtedly key factors in controlling benthic species’ distribution; therefore, an accurate analysis of the latter is of paramount importance to detect the most suitable sites for the restoration efforts. The National RENOVATE project (ecosystemic appRoach to the EvaluatioN and testing of cOmpensation and mitigation actions in the marine enVironment: the cAse of the civiTavEcchia harbuor), coordinated by CMCC (Mediterranean Centre for the study of Climate Changes) and funded by “AdSP (Autorità di Sistema Portuale) of the north-central Tyrrhenian Sea”, is performing an integrated methodology for the compensation of Mediterranean marine ecosystems, damaged by anthropogenic impacts, in selected areas located offshore Civitavecchia harbor, in the central Mediterranean sea. In the context of this project, our work focused on providing high-resolution habitat mapping of a Posidonia oceanica meadow, along with the detection of suitable sites for implementing restoration actions. Geospatial and geomorphometric analyses were applied to the available dataset (i.e. multibeam bathymetry and acoustic backscatter) in addition to design a semi-automatic approach, by using Object-Based Image Analysis (OBIA) techniques, to classify the detected morph-acoustic facies. OBIA techniques consist of two sequential steps: (1) image segmentation into different meaningful image-objects, according to the contextual and spectral characteristics of the pixels composing them; (2) semi-automatic classification on the base of spectral, spatial and contextual characteristics of the image-objects. We developed a workflow to analyze multibeam bathymetry and side scan sonar backscatter intensity data specifically referred to the determination of Posidonia oceanica meadow extent, and to the detection of all sedimentary pockets within the meadow that appeared to be suitable for restoration actions (according to a set of pre-defined parameters). We defined OBIA rulesets using the eCognition® 10.3 software from Trimble on a multi-scale and multi-layer level, combining and integrating the original dataset and terrain variables obtained from geomorphometric analyses. Such rulesets comprised the application of deep learning algorithms to generate our final classification. We validated our results by comparing them with prior
knowledge of the study site (provided by researchers of the Università della Tuscia) and by manual interpretation and classification performed using the software ArcMap 10.8.
The methodological approach here presented and the associated rulesets, have been designed in order to be applied (with the proper case-specific precautions) to the planning phase of any Posidonia oceanica meadow restoration project, and represent a new advance in the field of ecosystem management and restoration.

How to cite: Marino, L., Fallati, L., Varzi, A. G., Fersini, G., Piazzolla, D., Scanu, S., Marcelli, M., and Savini, A.: Semi-automatic geospatial modeling supporting restoration actions on a Posidonia oceanica meadow offshore Civitavecchia (eastern Tyrrhenian margin, Mediterranean Sea) using Object-Based Image Analysis on acoustic remote sensing data, EGU General Assembly 2024, Vienna, Austria, 14–19 Apr 2024, EGU24-1000, https://doi.org/10.5194/egusphere-egu24-1000, 2024.

EGU24-1815 | ECS | Orals | OS3.3

Microplastic Contamination of a Benthic Ecosystem in a Deep-Sea Hydrothermal Vent 

Byeongyong Park, Boongho Cho, Jaemin Cho, Seungho Kim, and Tae Won Kim

Plastic contamination is a global pervasive issue, extending from coastal areas and open oceans to polar regions and even the deep sea. Microplastic contamination in hydrothermal vents, which are known for their high biodiversity even under their extreme conditions, has remained largely unexplored. Here, we present, for the first time, microplastic pollution in a deep-sea hydrothermal vent at one of the pristine biodiversity hotspots—the Central Indian Ridge. Not only the environment, (seawater: 2.08 ± 1.04 MPs/L, surface sediments: 0.57 ± 0.19 MP/g) but also all six major benthic species investigated were polluted by microplastics.  Microplastics mainly consisted of polypropylene, polyethylene terephthalate, and polystyrene fragments ≤ 100 µm, and were characterized as being either transparent or white in color. Remarkably, bioaccumulation and even biomagnification of microplastics were observed in the top predators of the ecosystem, such as squat lobsters (14.25 ± 4.65 MPs/individual) and vent crabs (14.00 ± 2.16 MPs/individual) since they contained more microplastics than animals at  lower trophic levels (e.g. mussels and snails, 1.75 ~ 6 average MPs/individuals). These findings reveal microplastic contamination of an ecosystem in a hydrothermal vent, thereby suggesting that their accumulation and magnification can occur in top-level animals even within remote and extreme environments.

How to cite: Park, B., Cho, B., Cho, J., Kim, S., and Kim, T. W.: Microplastic Contamination of a Benthic Ecosystem in a Deep-Sea Hydrothermal Vent, EGU General Assembly 2024, Vienna, Austria, 14–19 Apr 2024, EGU24-1815, https://doi.org/10.5194/egusphere-egu24-1815, 2024.

EGU24-2813 | ECS | Orals | OS3.3

Development of artificial intelligence based computational pathology to assess the histopathological toxicity of antibiotics to marine mussels 

Jianzhou Xu, Ruoxuan Zhao, Ao Liu, Liya Li, Shuimei Li, Kaijie Wu, and Yanan Di

Antibiotics are emerging contaminants of concern worldwide, especially in coastal areas. However, no conclusion can confirm their ecotoxic effects based on popular employed biomarkers. Based on our previous exploration on the histopathological changes on marine model organism-marine mussels, convincing results indicated sulfamethoxazole (SMX) can induce tissue damage but the examination procedure was labor- and time-consuming. In this study, a systematic working flow of histopathological assessment was developed, including qualitative, semi-quantitative, quantitative and artificial intelligence (AI)-based quantitative methods, forming the computational pathology on functional tissues in marine mussels. The exposure of mussels to a serial concentration of SMX was conducted, gill and digestive gland of mussels were stained by H&E to perform the developed working flow. The results confirmed that SMX exposure indeed cause significant histopathological alterations in both tissues. The manual semi-quantitative, quantitative and AI-based quantitative indicators all showed a well dose-response relationship with SMX exposure. In particular, AI-based quantitative methods can identify and segment biological pathological images, and screen quantitative pathological indicators and significantly reduce the time-cost. This study confirmed the valuable application of quantitative and AI-based quantitative histopathological indicators in marine ecotoxicology, and promotes the study of computational pathology of marine organisms in emerging marine pollutants.

How to cite: Xu, J., Zhao, R., Liu, A., Li, L., Li, S., Wu, K., and Di, Y.: Development of artificial intelligence based computational pathology to assess the histopathological toxicity of antibiotics to marine mussels, EGU General Assembly 2024, Vienna, Austria, 14–19 Apr 2024, EGU24-2813, https://doi.org/10.5194/egusphere-egu24-2813, 2024.

EGU24-3099 | Orals | OS3.3

Aerobic scope mapping of an invasive fish species in a global warming scenario 

Giovanni Quattrocchi, Emil Christensen, Matteo Sinerchia, Stefano Marras, Andrea Cucco, Paolo Domenici, and Jane W. Behrens

The aerobic metabolic scope (AMS) of marine ectotherms, a measure of their energetic potential in relation to environmental conditions, can be adopted as a metric to support the prediction of their habitat distribution through time and space.

Considering that climate change will exacerbate the negative effects associated with the introduction of non-indigenous species in marine ecosystems, the prediction of their thermal habitat suitability is a central task in ecology and conservation.

In this context we proposed a methodology to (i) infer the suboptimal AMS of an invader and (ii) to map its suitable thermal habitat during the past decades and in a global warming scenario. Specifically, we combined sightings records, known physiological models of aerobic performance and sea surface temperatures to determining their effects on the AMS of the fish.

The methodology has been tested in the Baltic Sea that is currently displaying the highest increase in sea surface temperature of the world’s large marine ecosystems and that hosts the invasive round goby (Neogobius melanostomus), a fish of Ponto-Caspian origin. As the most widely dispersed invasive fish in the world this species has produced vast ecological impacts in colonized environments including the alteration of benthic invertebrate composition through predation and competition with native fish for food, shelter, and spawning grounds. Round goby, introduced to the Baltic Sea about 30 years ago, is well established in the southern and central parts of the basin but is still absent, aside from sporadic observations, from the north and coldest areas of this region. Its distribution is likely to expand beyond the current cold boundaries due to predicted climate change. However, the proportion of the currently uninvaded areas of the Baltic Sea that will become suitable thermal habitat for round goby, and how fast it can be expected to occur, remain uncertain.

Via AMS mapping, we described changes in the round goby thermal habitat suitability during the past 3 decades and for climatic predictions (until 2100), showing that the favourable thermal habitat in the Baltic Sea has increased during the past 32 years and will continue to do so considering the current climate models predictions. Notably, although the predicted new thermal conditions do not cause any reduction in the AMS of round goby populations, the wintertime cold ranges are likely expected to preserve substantial areas from invasion.

The results of this research are intended to guide future monitoring programs, increasing the chance to detect this invader in novel areas, and to enhance the reliability of the projected changes in ecological models that incorporate the thermal safety margins of native and non-indigenous species.

How to cite: Quattrocchi, G., Christensen, E., Sinerchia, M., Marras, S., Cucco, A., Domenici, P., and Behrens, J. W.: Aerobic scope mapping of an invasive fish species in a global warming scenario, EGU General Assembly 2024, Vienna, Austria, 14–19 Apr 2024, EGU24-3099, https://doi.org/10.5194/egusphere-egu24-3099, 2024.

EGU24-3378 | ECS | Orals | OS3.3

Atmospheric deposition and river runoff stimulate the utilization of dissolved organic phosphorus in coastal seas 

Chao Zhang, Haoyu Jin, Thomas Mock, and Huiwang Gao

In coastal seas with relatively abundant macronutrients and trace metals, the role of atmospheric deposition and river runoff in biological DOP utilization is not well understood. Here, we address this knowledge gap by combining microcosm experiments with a global approach considering the relationship between the activity of alkaline phosphatases and changes in phytoplankton biomass in relation to the concentration of dissolved inorganic phosphorus (DIP). Our results suggest that the addition of aerosols and riverine water stimulate the biological utilization of DOP in coastal seas primarily by depleting DIP due to increasing nitrogen concentrations, which enhances phytoplankton growth. This “Anthropogenic Nitrogen Pump” was therefore identified to make DOP an important source of phosphorus for phytoplankton in coastal seas but only when the ratio of chlorophyll a to DIP [Log10 (Chl a / DIP)] is larger than 1.20. Our study therefore suggests that nitrogen input through atmospheric and riverine sources might contribute to the phosphorus cycle in coastal seas.

How to cite: Zhang, C., Jin, H., Mock, T., and Gao, H.: Atmospheric deposition and river runoff stimulate the utilization of dissolved organic phosphorus in coastal seas, EGU General Assembly 2024, Vienna, Austria, 14–19 Apr 2024, EGU24-3378, https://doi.org/10.5194/egusphere-egu24-3378, 2024.

EGU24-4837 | Orals | OS3.3

Plastic pollution in deep seafloor of the South China Sea 

Shamik Dasgupta, Xiaotong Peng, Hongzhou Xu, Dawei Wang, Hengchao Xu, Kaiwen Ta, Xikun Song, and Mengran Du

Plastic pollution is at the forefront of environmental problems, and has invaded every sphere on Earth. We describe the abundance, distribution, transport pathways and mechanisms, fate and ecological impacts of plastics in the South China Sea (SCS), emphasizing on the deep seafloor microplastics and plastics. We document presence of plastics, primarily based on more than 100 dives in manned submersibles, backed-up by in-depth analysis of dive track videos and images from all locations, providing the first distribution maps of microplastic and plastics on the bottom of the SCS. Abundance of large plastics have been observed to be highest at typical V-shaped geomorphological units, such as canyons, where hydrodynamic conditions are stronger. However, high concentrations of microplastics occur commonly in the sediments of coastal zones. Sources and transportation mechanism of microplastics and plastics in the SCS are thus distinctly different from each other. While a vast majority of microplastics is possibly transported through riverine inputs, most of plastics have a sea-based origin and are discarded from fishing boats, entertainment vessels, and merchant ships. Apart from surface currents, deep-water, seasonal currents, as well as gravity flow, facilitate the transport of marine plastics to deep seafloor sediments. We present two types of models for the transportation of microplastics and plastics in SCS, respectively. We further elucidate the ecosystem which has emerged as a new hot spot with the plastics in SCS. Both large plastics and microplastics additionally act as vectors of chemical pollutants, resulting in ecotoxicological damages. Interaction of biota with deep-sea plastics has been observed and documented in terms of ingestion, entanglement, or proximity, resulting in potential negative effects. The extent of plastic pollution in the SCS is at an alarming level. Therefore, strengthened mitigation procedures, reuse and recycling structures, and waste water management have to be urgently incorporated in National Action Plans to control the burden of plastics entering the SCS. 

How to cite: Dasgupta, S., Peng, X., Xu, H., Wang, D., Xu, H., Ta, K., Song, X., and Du, M.: Plastic pollution in deep seafloor of the South China Sea, EGU General Assembly 2024, Vienna, Austria, 14–19 Apr 2024, EGU24-4837, https://doi.org/10.5194/egusphere-egu24-4837, 2024.

EGU24-7596 | ECS | Posters on site | OS3.3

Simulation of larval dispersal between seamounts for regional environmental management plans of deep-sea mining 

Naoki Saito, Shinichiro Yano, Atsushi Suzuki, and Hiroko Kamoshida

In deep-sea mining, understanding genetic connectivity through larval dispersal can be the basis for regional environmental management plans. This study conducted larval dispersal simulations for seamounts in the Northwest Pacific where potential mineral resources, cobalt-rich crusts, are distributed. A total of 19 seamounts were selected for simulation within a 1000 x 1000 km2 area around seamounts where contracted areas for exploration of cobalt-rich crusts were established by the International Seabed Authority. The pelagic larval duration was assumed to be 97 days, which is the average for deep-sea species (Hilário et al., 2015, Front. Mar. Sci.). Two-dimensional dispersions were calculated at a depth of 900 m just above the seamount summits. Flow velocity data were obtained from the ocean model JCOPE2M. The simulation results showed that seamounts with contracted areas for exploration were divided into separate clusters in the larval dispersal network. Seamounts without contracted areas served as sources or sinks of larvae to seamounts with contracted areas. These results may provide fundamental insights for effective environmental management based on interactions among seamount populations.

How to cite: Saito, N., Yano, S., Suzuki, A., and Kamoshida, H.: Simulation of larval dispersal between seamounts for regional environmental management plans of deep-sea mining, EGU General Assembly 2024, Vienna, Austria, 14–19 Apr 2024, EGU24-7596, https://doi.org/10.5194/egusphere-egu24-7596, 2024.

EGU24-7751 | ECS | Posters on site | OS3.3

Innovative technologies and ecosystem functioning measurements supporting knowledge of P. oceanica meadows in the northern Mediterranean Sea 

Daniele Piazzolla, Sergio Scanu, Francesco Paolo Mancuso, Mar Bosh-Belmar, Simone Bonamano, Alice Madonia, Elena Scagnoli, Mario Francesco Tantillo, Martina Russi, Alessandra Savini, Giorgio Fersini, Gianluca Sarà, Giovanni Coppini, Marco Marcelli, and Viviana Piermattei

Coastal areas host biodiversity-rich and productive marine habitats but are also highly susceptible to human activities. Posidonia oceanica (L.) Delile meadows are one of the most important habitats in the coastal areas of the Mediterranean Sea and are considered a key coastal structuring habitat enhancing biodiversity levels. Accurate information about the spatial distribution and functioning of P. oceanica is essential for an effective management of anthropogenic pressures that can minimise, mitigate, or compensate for the impacts produced, to ensure a long-term successful protection of this habitat. We tested, for the first time, an integrated multi-platform approach for mapping the coastal benthic habitat in the Civitavecchia (northern Latium, Italy) coastal area. This approach includes the use of an unmanned platforms, a remotely-operated vehicle, and in situ P. oceanica ecosystem functioning measurements through benthic chambers.

The multi-platform approach allowed us to reconstruct the spatial distribution of different bottom types, as well as the canopy height and coverage of the Posidonia oceanica seagrass. Furthermore, respiration and net primary production rates of P. oceanica and its associated community were assessed.

Our results highlight the significance of multi-platform observation data for a thorough exploration of marine ecosystems, emphasizing their utility in forecasting biogeochemical processes in the marine environment. The integration of spatial and functional information coming from this novel approach may significantly contribute to improve management and conservation action plans on key and vulnerable habitats under the current and future climate change scenarios. This work was performed as part of the RENOVATE project, financed by the Port System Authority of the Northern-Central Tyrrhenian Sea.

How to cite: Piazzolla, D., Scanu, S., Mancuso, F. P., Bosh-Belmar, M., Bonamano, S., Madonia, A., Scagnoli, E., Tantillo, M. F., Russi, M., Savini, A., Fersini, G., Sarà, G., Coppini, G., Marcelli, M., and Piermattei, V.: Innovative technologies and ecosystem functioning measurements supporting knowledge of P. oceanica meadows in the northern Mediterranean Sea, EGU General Assembly 2024, Vienna, Austria, 14–19 Apr 2024, EGU24-7751, https://doi.org/10.5194/egusphere-egu24-7751, 2024.

EGU24-8288 | Posters on site | OS3.3

A new predictive approach for assessing local human and climate change stressors on coastal marine ecosystems. 

Simone Bonamano, Mar Bosch-Belmar, Daniele Piazzolla, Ivan Federico, Francesco Paolo Mancuso, Sergio Scanu, Alice Madonia, Salvatore Causio, Nicholas Biocca, Mario Francesco Tantillo, Martina Russi, Giorgio Fersini, Viviana Piermattei, Giovanni Coppini, and Gianluca Sarà

The potential impacts of climate-related factors (e.g., heatwaves, temperature spikes) and local human stressors (e.g., dredging) on vulnerable and protected habitats in the Mediterranean coastal marine environment can be comprehensively assessed using an innovative predictive approach. This method integrates results from numerical models and species-specific stressor tolerance curves and thresholds derived from dedicated laboratory experiments. Focusing on the endemic Mediterranean Posidonia oceanica and coralligenous habitats near the port of Civitavecchia on the western coast of Italy, we analyzed the potential disturbance caused by the occurrence of interacting stressors, increasing temperature and turbidity. A new composite index was developed to evaluate potential effects, considering findings from hydrodynamic and sediment transport models, as well as the temperature and turbidity tolerance of the studied habitats. Lower index values indicate a higher risk of habitat regression due to global warming or unsustainable coastal activities (in the absence of mitigation measures, such as an Early Warning System, EWS).

Within the Renovate project, adopting an ecosystem approach for compensation and mitigation actions in the coastal marine environment, the new index was applied to assess the effects of dredging activities for the expansion of the port of Civitavecchia. Additionally, it was used to distinguish impacts on the same habitats caused by heatwaves affecting this coastal stretch. This index will contribute to the development of EWS and the formulation and implementation of risk assessment and management plans in coastal areas.

How to cite: Bonamano, S., Bosch-Belmar, M., Piazzolla, D., Federico, I., Mancuso, F. P., Scanu, S., Madonia, A., Causio, S., Biocca, N., Tantillo, M. F., Russi, M., Fersini, G., Piermattei, V., Coppini, G., and Sarà, G.: A new predictive approach for assessing local human and climate change stressors on coastal marine ecosystems., EGU General Assembly 2024, Vienna, Austria, 14–19 Apr 2024, EGU24-8288, https://doi.org/10.5194/egusphere-egu24-8288, 2024.

EGU24-9109 | ECS | Orals | OS3.3

Climate change fragments Mediterranean seagrasses landscapes: a regional analysis 

Damiano Baldan, Fabrizio Gianni, Marco Reale, and Vinko Bandelj

Seagrasses meadows represent a key habitat of the Mediterranean Sea, since they host a significant biodiversity. Projected changes in seagrasses distributions driven, for instance, by climate change, could dramatically alter the structure of the Mediterranean seascape, with relevant cascading effects on the biodiversity of the basin. In this work, first we combined post-processed COPERNICUS-CMEMS physical and biogeochemical variables and seagrasses occurrences from the Ocean Biodiversity Information System (OBIS) to setup Species Distribution Models (SDMs) for Posidonia Oceanica and Cymodocea nodosa: two dominant mediterranean seagrasses. Then, future changes in their distribution along the 21st century using high resolution physical and biogeochemical projections under two Representative Concentration Pathways (RCP), namely 4.5 and 8.5, have been assessed. In particular, the future changes in the range contraction and distances between suitable habitat patches have been estimated. A significant change in both quantities was detected. The potential implication of an increased fragmentation for metapopulations and metacommunities relying on this habitat is discussed.

How to cite: Baldan, D., Gianni, F., Reale, M., and Bandelj, V.: Climate change fragments Mediterranean seagrasses landscapes: a regional analysis, EGU General Assembly 2024, Vienna, Austria, 14–19 Apr 2024, EGU24-9109, https://doi.org/10.5194/egusphere-egu24-9109, 2024.

EGU24-9420 | ECS | Posters on site | OS3.3

Development of low-cost technologies applied to the study of marine ecosystems. 

Juan Francisco Martinez Osuna, Viviana Piermattei, and Antonio De Luca

The Mediterranean Sea is a recognized area of concern considering climate change impacts. Coastal zones are particularly vulnerable to the influences of sea level variations caused by climate variability. Estuaries, which are crucial ecosystems, represent challenges areas which can be affected from various anthropogenic pressures and the effects of climate change.

Within the research community, there is a growing focus on the risks associated with sea level rise (SLR). The threat of storm-related flooding poses a significant danger to coastal areas, leading to the loss of marine habitats and ecosystems. Recent experiences also have shown that the combination of high-intensity hurricanes and increased sea levels has resulted in numerous fatalities along the coast.

A big lack of data and knowledge about coastal observations, particularly in developing countries, persists due to the difficulty in obtaining affordable and user-friendly instrumentation. To address these challenges, there is a need to develop cost effective, easily accessible technologies that can be integrated into different platforms. These technologies would enhance monitoring capabilities, particularly in terms of spatial resolution, along rivers and coastal zones. By doing so, we can greatly improve our understanding of storm surges, extreme events, and their impacts on transitional areas. Creating a practical tool as part of an early warning system would provide timely information on physical conditions and biological variables, aiding in effective decision-making and mitigation efforts.

How to cite: Martinez Osuna, J. F., Piermattei, V., and De Luca, A.: Development of low-cost technologies applied to the study of marine ecosystems., EGU General Assembly 2024, Vienna, Austria, 14–19 Apr 2024, EGU24-9420, https://doi.org/10.5194/egusphere-egu24-9420, 2024.

EGU24-9562 | ECS | Posters on site | OS3.3

Unveiling Tiber River's Influence on the Tyrrhenian Coastal Ocean and Marine Bio-Optical Properties with Sentinel-2 

Dani Varghese, Viviana Piermattei, Alice Madonia, and Marco Marcelli

Chlorophyll and suspended sediments are the main indicators of the marine ecosystem’s bio-optical properties. Chlorophyll is directly connected with primary productivity, while the suspended sediments are associated with water quality; both factors are influenced by climate change. The present research is mainly focused on testing the capability of Sentinel-2 on estimating the Tiber River driven spatial dynamics of chlorophyll and suspended sediment. The present research also aims to identify suitable methods for estimating chlorophyll and suspended sediment levels in the Tyrrhenian coastal ocean and seas. Algorithms including SNAP-bound C2RCC-Nets, C2X-Nets, C2X-COMPLEX-Nets, and ACOLITE-bound OC2, OC3, SPM_Nechad2010 and SPM_Nechad2016 algorithms were applied to estimate the dynamic distribution of chlorophyll and suspended sediment in the Tyrrhenian region. C2RCC-Nets outperformed all other and a statistically significant positive correlation observed with in situ-derived chlorophyll and suspended sediment, with coefficients of 0.903 and 0.966, respectively. Additionally, a positive seasonal spatial correlation was estimated between chlorophyll and suspended sediments, indicating that Tiber River discharge have positive impacts by accelerating the chlorophyll level on the Tyrrhenian coastline compared to the negative trend observed in the Mediterranean region.

  • Keywords: Sentinel-2, C2RCC, chlorophyll, Suspended sediments, Tiber River, Tyrrhenian region.

How to cite: Varghese, D., Piermattei, V., Madonia, A., and Marcelli, M.: Unveiling Tiber River's Influence on the Tyrrhenian Coastal Ocean and Marine Bio-Optical Properties with Sentinel-2, EGU General Assembly 2024, Vienna, Austria, 14–19 Apr 2024, EGU24-9562, https://doi.org/10.5194/egusphere-egu24-9562, 2024.

EGU24-9785 | ECS | Posters on site | OS3.3

Assessment of legal, regulatory, and environmental issues in the commissioning of low head Pumped Hydro Storage technology: a case study in the Greater North Sea 

Antonio De Luca, Maximo Peviani, Sergio Scanu, Andrea Miccoli, Giuseppe Scapigliati, and Marco Marcelli

Low head Pumped Hydro Storage (PHS) has emerged as a promising solution for energy storage, particularly with the increasing development of off-shore wind power in Northern Europe. The ALPHEUS project (Augmenting Grid Stability Through Low Head Pumped Hydro Energy Utilization and Storage), funded by the European Union’s Horizon 2020 program, places significant emphasis on investigating environmental issues and potential related impacts. By addressing key environmental aspects, the project aims to contribute to the sustainable integration of low head PHS, aligning with the broader goals of promoting renewable energy and grid stability in Europe.

The coastal zone, marked by diverse physical and ecological conditions, is susceptible to the exploitation of numerous natural resources. Studying the current status and the intricate relationships between natural ecosystems and PHS structures during installation, operation, and decommissioning involves identifying and analyzing various multidisciplinary components, including, ecology, engineering, and economics aspects. This evaluation is an integral part of the legislative and regulatory framework governing the assessment of suitable places for the deployment of coastal or off-shore energy production facilities.

The legal and regulatory framework relating to environmental aspects in two countries bordering the North Sea is also compared. Germany and The Netherlands are selected as examples for pilot sites assessment in this study including an evaluation of potential environmental constraints, the availability of environmental public data, and an assessment of existing infrastructure to be potentially converted. The assessment of sites from the environmental point of view is achieved on the basis of the “Marine Strategy Framework Directive” scheme identifying the potential interactions between the ecological parameters and the potential impacts of a PHS infrastructure. The success of sustainable low head Pumped Hydro Storage technology relies on the management of natural resources and the resolution of conflicts among sea use actors such as local communities and stakeholders.

How to cite: De Luca, A., Peviani, M., Scanu, S., Miccoli, A., Scapigliati, G., and Marcelli, M.: Assessment of legal, regulatory, and environmental issues in the commissioning of low head Pumped Hydro Storage technology: a case study in the Greater North Sea, EGU General Assembly 2024, Vienna, Austria, 14–19 Apr 2024, EGU24-9785, https://doi.org/10.5194/egusphere-egu24-9785, 2024.

EGU24-11618 | ECS | Posters on site | OS3.3

Diving into the Future: Advanced Ocean Observation with Cost-Effective AI-Enhanced Autonomous Underwater Vehicles 

Nicola Madonia, Lavinio Gualdesi, Viviana Piermattei, and Marco Marcelli

Our project addresses the growing demand for extended oceanographic observation network. We are developing an innovative and affordable Autonomous Underwater Vehicle (AUV), named Jolly Oscar, that incorporates artificial intelligence for path determination and destination determination based on marine meteorological conditions. AUVs play a crucial role in marine monitoring by enabling independent exploration of areas that are difficult to access by other platforms. The goal of our approach aims to supply a cost-effective solution compared to existing options, allowing for the acquisition of a fleet of Jolly Oscar vehicles to enhance data collection. Simultaneous data gathering by multiple AUVs not only improves efficiency but also supplies a deeper understanding of marine phenomena. This cost-effective approach enables efficient and extensive spatial coverage, making easier the rapid collection of oceanographic data. Jolly Oscar can be equipped with a different array of interchangeable instrumental packages, including sensors for Conductivity-Temperature-Depth (CTD) and pH, chlorophyll fluorescence, turbidity, passive (hydrophone) and active (side-scan sonar or multibeam sonar) acoustic systems, Acoustic Doppler Current Profiler (ADCP). This versatility is crucial for gathering detailed oceanographic data which are essential for feeding numerical models, deepening our understanding of marine ecosystems, and checking ongoing environmental changes. By developing a cost-effective solution, Jolly Oscar aims to supply broader access to advanced oceanographic exploration. This inclusivity aims to encourage participation and involvement from the scientific community, allowing more researchers to use these technologically advanced tools. This collaborative approach contributes to the global effort of monitoring and understanding the intricate dynamics of our oceans, which is crucial for environmental conservation and responsible marine management.

How to cite: Madonia, N., Gualdesi, L., Piermattei, V., and Marcelli, M.: Diving into the Future: Advanced Ocean Observation with Cost-Effective AI-Enhanced Autonomous Underwater Vehicles, EGU General Assembly 2024, Vienna, Austria, 14–19 Apr 2024, EGU24-11618, https://doi.org/10.5194/egusphere-egu24-11618, 2024.

EGU24-16247 | Posters on site | OS3.3

An integrated and sustainable observing system for the implementation of a Coastal Digital Twin of the Ocean 

Marco Marcelli, Simone Bonamano, Mar Bosch-Belmar, Giorgio Fersini, Giulia Ceccherelli, Giovanni Coppini, Giuseppe Andrea De Lucia, Paola Del Negro, Annalisa Falace, Ivan Federico, Alice Madonia, Francesco Paolo Mancuso, Lorenzo Mentaschi, Daniele Piazzolla, Nadia Pinardi, Gianluca Sarà, Alessandra Savini, Sergio Scanu, Benedetta Torelli, and Viviana Piermattei

The coastal zone provides opportunities for a variety of users which can affect the availability of space and the conservation of important habitats. Coastal zone also represents the area of both anthropic and natural inputs through rivers, which can be an important pressure due to the potential introduction of pollutants and the increasing flooding. Latium coast represents and important area for the presence of the Tiber river which affect a big portion of the region. Moreover, this area is an important site for big coastal infrastructures that potentially produce direct and indirect impacts on marine ecosystems, particularly Posidonia oceanica seagrass meadows, rocky and algal reefs. This work shows an integrated and advanced observing system, including autonomous platforms, cost-effective technologies and numerical modeling, applied to the study of the interaction between anthropic pressures and natural resources in order to realize a Digital Twin of the Ocean of this coastal area toward the implementation of nature based solutions.

How to cite: Marcelli, M., Bonamano, S., Bosch-Belmar, M., Fersini, G., Ceccherelli, G., Coppini, G., De Lucia, G. A., Del Negro, P., Falace, A., Federico, I., Madonia, A., Mancuso, F. P., Mentaschi, L., Piazzolla, D., Pinardi, N., Sarà, G., Savini, A., Scanu, S., Torelli, B., and Piermattei, V.: An integrated and sustainable observing system for the implementation of a Coastal Digital Twin of the Ocean, EGU General Assembly 2024, Vienna, Austria, 14–19 Apr 2024, EGU24-16247, https://doi.org/10.5194/egusphere-egu24-16247, 2024.

EGU24-16349 | Posters on site | OS3.3

Adaptive cycles of a phyto-zooplankton community under human pressure  

Areti Balkoni, Wolfgang zu Castell, Karen H. Wiltshire, Maarten Boersma, and Hannah Zoller

Human activities, such as global warming and nutrient pollution, are posing significant threats to the ecological interactions and biodiversity in aquatic environments [1]. The German Bight, a highly dynamic coastal region of the North Sea, has been subject to considerable warming and nutrient fluctuations over recent decades. These changes have had profound impacts on the plankton communities in this area, leading to a swift reorganization of both phyto- [2] and zooplankton functional structures [3].

While the effects of these changes on individual phyto- and zooplankton levels have been well-documented, our understanding of how plankton interactions respond to these environmental stressors remains limited. In this study, we hypothesize that the synergy of warming and nutrient limitation will alter plankton network interactions, resulting in a shift towards consumers being controlled by resources.

We approach this hypothesis from the perspective of Gunderson and Holling’s adaptive cycle metaphor [4]. The metaphor describes ecosystem development as alternating phases of stability and reorganization, being shaped by three systemic properties: the system’s potential available for future change, the connectedness among its internal variables, and its resilience in the light of perturbations.

For the quantification of the adaptive cycle, we use a method developed by zu Castell and Schrenk [5,6]. Based on the most comprehensive timeseries available in marine environments, we infer a dynamic network of information transfer, which allows us to study the evolving interaction pattern between phyto-and zooplankton. We discuss this pattern in the context of the adaptive cycle phases and alternative measures of system resilience.

To our knowledge, our study is the first to provide a holistic analysis of plankton network interactions in marine environments, considering both phyto- and zooplankton species. This approach offers a deeper understanding of how human-induced impacts affect the foundation of marine food webs.


[1] E. Merz, E. Saberski, L. J. Gilarranz, P. D. F. Isles, G. Sugihara, C. Berger, and F. Pomati, Disruption of ecological networks in lakes by climate change and nutrient fluctuations, Nature Climate Change (2023).

[2] J. Di Pane, K. H. Wiltshire, M. McLean, M. Boersma, and C. L. Meunier, Environmentally induced functional shifts in phytoplankton and their potential consequences for ecosystem functioning. Global Change Biology, 28, 2804–2819 (2022).

[3] M. M. Deschamps, M. Boersma, C. L. Meunier, I. V. Kirstein, K. H. Wiltshire, and J. Di Pane, Major shift in the copepod functional community of the southern North Sea and potential environmental drivers. ICES Journal of Marine Science, 0, 1–13 (2023).

[4] L. H. Gunderson and C. S. Holling. Panarchy: understanding transformations in human and natural systems (Island, Washington, D.C., 2002).

[5] W. zu Castell, and H. Schrenk, Computing the adaptive cycle, Scientific Reports 2020(10):18175 (2020).

[6] H. Schrenk, C. Garcia-Perez, N. Schreiber, and W. zu Castell, QtAC: an R-package for analyzing complex systems development in the framework of the adaptive cycle metaphor, Ecological Modelling 466:109860 (2022).

How to cite: Balkoni, A., zu Castell, W., Wiltshire, K. H., Boersma, M., and Zoller, H.: Adaptive cycles of a phyto-zooplankton community under human pressure , EGU General Assembly 2024, Vienna, Austria, 14–19 Apr 2024, EGU24-16349, https://doi.org/10.5194/egusphere-egu24-16349, 2024.

EGU24-17459 | ECS | Orals | OS3.3

Modeling northeast Atlantic marine food webs under global change scenarios. 

Amy Shurety, Eoin O'Gorman, Murray Thompson, and Elena Couce

Climate change and commercial fishing are prominent contributors to global change and can cause gradients in numerous biotic and abiotic variables, all of which can alter food web dynamics. This study aimed to predict future northeast Atlantic marine food webs based on allometric foraging behaviour. More than one thousand food webs from 1992 to 2016 spanning 2035 km2 were modelled and calibrated based on a novel empirical dietary database containing >400,000 individual predator stomachs. A suite of flow and structural ecological metrics, such as connectance, mean trophic level, redundancy, and total energy flux, were calculated from the food web models, which due to their systemic nature can be used to infer ecological resilience of northeast Atlantic ecosystems. The relationship between the suite of ecological metrics, sea surface temperature and mean yearly fishing effort were tested using Bayesian Additive Regression Tree Models. Spatial and temporal variation was found in both structural and flow-based metrics providing evidence that climate change and commercial fishing are potential drivers of northeast Atlantic food web dynamics and in turn ecosystem resilience. For example, redundancy in trophic interactions, which provides buffering capacity to ecosystems in the face of stress, was found to increase with sea surface temperature. A primary goal is to provide robust understanding of food web structure and ecological resilience across multiple scales, helping to highlight vulnerable systems, communities, and species across the northeast Atlantic. This project has the potential to provide the scientific advice needed for climate change and sustainable fisheries management to be effective despite the uncertainty of global change.

How to cite: Shurety, A., O'Gorman, E., Thompson, M., and Couce, E.: Modeling northeast Atlantic marine food webs under global change scenarios., EGU General Assembly 2024, Vienna, Austria, 14–19 Apr 2024, EGU24-17459, https://doi.org/10.5194/egusphere-egu24-17459, 2024.

EGU24-17902 | Posters on site | OS3.3

Development of a new low-cost multispectral radiometer for land and marine applications 

Alice Madonia, Swati Suman, Viviana Piermattei, Marco Marcelli, and Riccardo Valentini

To face the need of mitigation and adaptation measures in order to reduce climate change impacts and improve the robustness of climate projections it is necessary to implement long-term and low-cost observing systems.

One of the main problem is the acquisition of in situ optical data, fundamental to understand the functioning of natural ecosystems since light is the primary source of energy for both terrestrial and marine life. In fact, light directly affects the photosynthetic processes and its availability represents a key factor for primary production.

In this context, there is a lack of spectro-radiometric and PAR measures in the marine environment to retrieve key bio-optical variables for the validation of remote sensing observations, providing useful information on the effects of anthropogenic activities and climate change.

Commercial high-performance spectrometers are characterized by high costs thus limiting the acquisition of a great amount of data for remote sensing and numerical models validation. In the last decades, a big effort was dedicated to the development of miniaturized and autonomous systems to reduce the costs of both land and marine observations while maintaining adequate performance and significant data quality.

In this work we present the development of a new low-cost multichannel spectrometer designed and developed as a fast, accurate and effective device for spectral response monitoring.

To optimise the selection of the optical components and to assess the performance of the developed system, a series of experimental tests were performed both in laboratory and in field. This work shows the results of the developed technology and its applications.

How to cite: Madonia, A., Suman, S., Piermattei, V., Marcelli, M., and Valentini, R.: Development of a new low-cost multispectral radiometer for land and marine applications, EGU General Assembly 2024, Vienna, Austria, 14–19 Apr 2024, EGU24-17902, https://doi.org/10.5194/egusphere-egu24-17902, 2024.

EGU24-18582 | ECS | Posters on site | OS3.3

Spectral signatures of submerged vegetation for remote sensing mapping and benthic coastal marine ecosystem quality assessment 

Fabrizio Varini, Alice Madonia, Sergio Scanu, Viviana Piermattei, and Marco Marcelli

In the context of international guidelines for the protection and conservation of biodiversity in natural environments, the assessment of the effects of human pressure on marine ecosystems assumes a key role. The scientific community has recognised Macroalgae and marine phanerogams as useful bioindicators, thanks to their considerable biomass, permanence, spectral retrieval and ease of identification. Remote sensing technology provides spatially synoptic and near real-time measurements that can be effectively used to detect pollution phenomena. However, remote sensing techniques, especially if applied in coastal areas, need correction and validation through in situ data collection.

In the framework of the STOPP project “Strumenti e Tecniche di Osservazione della Terra in Prossimità e Persistenza” funded by Agenzia Spaziale Italiana (ASI), one of the main goals is the use of innovative aerial platforms, equipped with multispectral sensors, to monitor the impacts of anthropogenic pollution on benthic coastal marine ecosystems.

In this work, we present the advances of the experimental activities aimed at analyzing the changes of the spectral signatures in response to different pollutant exposures in laboratory-controlled conditions, identifying the optimized protocol to detect the "target wavelengths" on seagrasses and macroalgae species. These results are useful for evaluating the feasibility of an innovative methodology for monitoring and mapping marine submerged vegetation through remote sensing.

How to cite: Varini, F., Madonia, A., Scanu, S., Piermattei, V., and Marcelli, M.: Spectral signatures of submerged vegetation for remote sensing mapping and benthic coastal marine ecosystem quality assessment, EGU General Assembly 2024, Vienna, Austria, 14–19 Apr 2024, EGU24-18582, https://doi.org/10.5194/egusphere-egu24-18582, 2024.

EGU24-19096 | ECS | Orals | OS3.3

Surface-water nitrate exposure to world populations has expanded and intensified during 1970-2010 

Junjie Wang, Xiaochen Liu, Arthur Beusen, and Jack Middelburg

Excessive nitrate in surface waters deteriorates water quality and threatens human health. Human activities have caused increased nitrate concentrations in global surface waters over the past 50 years. An assessment of the long-term trajectory of surface-water nitrate exposure to world populations and associated potential health risks is imperative but lacking. Here, we used global spatially explicit data on surface-water nitrate concentrations and population density simulated by the consistent integrated assessment model, in combination with thresholds for various health risks compiled from epidemiological studies, to quantify the long-term changes in surface-water nitrate exposure to world populations at multiple spatial scales. During 1970-2010, global populations potentially affected by acute health risks associated with surface-water nitrate exposure increased from 6 to 60 million persons per year, while populations at potential chronic health risks increased from 169 to 1361 million persons per year. Potential acute risks increasingly affected Asian countries. Populations potentially affected by chronic risks shifted from dominance by high-income countries (in Europe and North America) to middle-income countries (in Asia and Africa). To mitigate adverse health effects associated with surface-water nitrate exposure, anthropogenic nitrogen inputs to natural environments should be drastically reduced. Moreover, international and national standards of maximum nitrate contamination may need to be lowered. By leveraging biogeochemical, socio-economic, and epidemiological knowledge from different disciplines, this novel assessment evaluates the role of humans in driving environmental changes and environmental effects on humans in a consistent manner.

How to cite: Wang, J., Liu, X., Beusen, A., and Middelburg, J.: Surface-water nitrate exposure to world populations has expanded and intensified during 1970-2010, EGU General Assembly 2024, Vienna, Austria, 14–19 Apr 2024, EGU24-19096, https://doi.org/10.5194/egusphere-egu24-19096, 2024.

EGU24-19585 | ECS | Orals | OS3.3

Temperature alters the size selectivity of Southern Ocean fish 

Patrick Keith, Simeon Hill, Lucía López-López, Benjamin Rosenbaum, Ryan Saunders, Geraint Tarling, and Eoin O'Gorman

A primary response of many marine ectotherms to warming is a reduction in body size, to lower the metabolic costs associated with higher temperatures. The impact of such changes on ecosystem dynamics and stability will depend on the resulting changes to community size-structure, but few studies have investigated how temperature affects the relative size of predators and their prey in natural systems. We utilised >3,700 prey size measurements from ten Southern Ocean lanternfish species sampled across >10° of latitude to investigate how temperature influences predator-prey size relationships and size-selective feeding. As temperature increased, predators became closer in size to their prey, driven primarily by a decline in predator size and an increase in the relative abundance of intermediate-sized prey. The potential implications of these changes include reduced top-down control of prey populations and a reduction in the diversity of predator-prey interactions. Both of these factors should reduce the stability of community dynamics and ecosystem resistance to perturbations.

How to cite: Keith, P., Hill, S., López-López, L., Rosenbaum, B., Saunders, R., Tarling, G., and O'Gorman, E.: Temperature alters the size selectivity of Southern Ocean fish, EGU General Assembly 2024, Vienna, Austria, 14–19 Apr 2024, EGU24-19585, https://doi.org/10.5194/egusphere-egu24-19585, 2024.

EGU24-286 | ECS | Posters on site | OS3.5

Non-equilibrated ocean alkalinity enhancement influences nitrogen retention and export  

Philipp Suessle, Kai Schulz, and Ulf Riebesell

Ocean alkalinity enhancement (OAE) has been proposed as a carbon dioxide removal technology (CDR) allowing for long-term storage of atmospheric carbon dioxide (CO2) in the ocean. By changing the carbonate speciation in seawater, OAE may alter plankton communities and the particle export they drive. Using mesocosms in the mesotrophic Raunefjord, Bergen (Norway), we employed five different alkalinity levels for each, a lime- and olivine-based OAE scenario. Total alkalinity (TA) was raised in increments of 150 µmol kg-1­ (ΔTAmax = 600 µmol kg-1) using NaOH solutions. Seawater pCO2 was left to equilibrate with the atmosphere, leading to strong (pHmax = 8.80) but transient changes in carbonate chemistry. In concert with TA, CaCl2 (lime-based) or MgCl2 (olivine-based) was added to simulate the respective cation increase during mineral application. Additionally, equal amounts of Na2SiO3 (75 µmol L-1)was added to all olivine-based mesocosms to simulate the release of silicate whilst separating it from TA effects. Here, we provide insights of the two different OAE approaches on the flux and attenuation of sinking particles. After 49 days of non-equilibrated OAE, the community-mediated cumulative export flux of major elements (POC, PON, POP, BSi) was higher in the olivine- compared to the lime-based application. Preferential remineralization of nitrogen over carbon within the export flux decreased with TA, suggesting a potential nitrogen loss to the surface ocean, potentially shortening productive bloom periods and thus decreasing export production of carbon. This potential negative feedback on atmospheric CO2 levels under OAE warrants further investigation, specifically with respect to its dependence on plankton community composition, heterotrophic nitrogen remineralization, and the chosen alkalinity enhancement approach.

How to cite: Suessle, P., Schulz, K., and Riebesell, U.: Non-equilibrated ocean alkalinity enhancement influences nitrogen retention and export , EGU General Assembly 2024, Vienna, Austria, 14–19 Apr 2024, EGU24-286, https://doi.org/10.5194/egusphere-egu24-286, 2024.

EGU24-300 | ECS | Orals | OS3.5

Assessing the impact of Ocean Alkalinity Enhancement on the zooplankton community 

Amrita Bhaumik, Merle Henning, Giulia Faucher, Leila Kittu, Julieta Schneider, Cédric L. Meunier, Ulf Riebesell, and Maarten Boersma

Ocean alkalinity enhancement (OAE) can help mitigate climate change impacts by increasing the carbon storage capacity of the ocean. The technique involves addition of alkaline substances to the seawater to accelerate the natural rock weathering process. However, this will lead to sudden seawater chemistry changes, such as increased pH that might directly and/or indirectly (through trophic pathways) affect zooplankton, an important trophic link, by altering its metabolic state and community composition. In addition, varying dilution times of alkaline substances might impact organisms differently. To date, the possible influences of OAE on zooplankton communities are largely unexplored. To bridge the knowledge gap, we conducted mesocosm and laboratory experiments in simulated non-equilibrated, calcium-based (Ca(OH)2) OAE setups. An incrementally enhanced alkalinity gradient from 0 to 1250 µmol kg-1 in steps of 250 µmol kg-1 was used in all experiments. The wide-ranging enhanced total alkalinity (∆TA) was selected to assess the safety threshold. In addition, we compared immediate versus delayed dilution scenarios in our mesocosm study, where each scenario ended up with the same ∆TA gradient after mixing. We examined the multitrophic community response by monitoring twelve mesocosms for 39 days including the natural spring bloom community of Helgoland roads waters in the North Sea. Subsequently, the direct effect of alkalinity enhancement on the physiology (i.e., respiration and grazing) of Temora longicornis (predominant copepod in the mesocosms) was evaluated in the laboratory. The species-specific bottom-up effect was examined by culturing Rhodomonas salina in aforementioned ∆TA gradient and feeding them to the T. longicornis. We observed relatively lower zooplankton abundance, and growth rate in mesocosms with ∆TA1000 and 1250 µmol kg-1, which might be a bottom-up effect. In our lab experiments, though, we observed a negative impact on R. salina growth rate and nutritional quality from ∆TA750 µmol kg-1, we did not detect any substantial direct or indirect impact on the physiological performance of T. longicornis. Overall, our laboratory study provided a preliminary understanding of the direct and indirect effects of OAE on a key copepod species, and the mesocosm study gave insight into the zooplankton community response.

How to cite: Bhaumik, A., Henning, M., Faucher, G., Kittu, L., Schneider, J., Meunier, C. L., Riebesell, U., and Boersma, M.: Assessing the impact of Ocean Alkalinity Enhancement on the zooplankton community, EGU General Assembly 2024, Vienna, Austria, 14–19 Apr 2024, EGU24-300, https://doi.org/10.5194/egusphere-egu24-300, 2024.

EGU24-436 | ECS | Orals | OS3.5

Assessing the Influence of OAE on Particulate Matter Stoichiometry in the North Sea – Insights from a Mesocosm Study 

Juliane Tammen, Leila Richards Kittu, Giulia Faucher, Kai G. Schulz, and Ulf Riebesell

The natural dissolution of calcium- or silicate-based rock minerals in the ocean increases the alkalinity and enhances the uptake of atmospheric CO2. Deliberate large-scale addition of such minerals to the surface ocean has been proposed as a promising method to drive negative CO2 emissions through ocean alkalinity enhancement (OAE), mitigating climate change. However, the environmental safe and sustainable implementation of OAE requires a comprehensive understanding of the potential ecological implications of this marine-based Carbon Dioxide Removal technology. In contributing to this understanding, a 39-day mesocosm experiment was conducted in the temperate-eutrophic waters of the German North Sea off Helgoland, during the spring of 2023. The primary objective was to examine how the intensity of alkalinity and the duration of alkalinity exposure before dilution in a calcium-based non-equilibrated OAE application (elevated pH) affects the pelagic ecology and biogeochemistry during a phytoplankton spring bloom. We simulated alkalinisation via calcium hydroxide through the addition of calcium chloride and sodium hydroxide in total alkalinity (∆TA) increments of 250 µmol kg-1 (∆TA = 0, 250, 500, 750, 1000, 1250 µmol kg-1) in one set of six mesocosms (each with a volume of 6 m³). This treatment intended to represent the successful dilution of OAE application through ship-deployment. A second set of six mesocosms was used to simulate a delayed dilution of alkalised waters from a point source. For this, the top layer of these mesocosms was manipulated with twice the amount of TA and mixed with the untreated bottom layer after 48 hours, ultimately leading to the same ∆TA gradient as the immediate dilution treatment. Here, we report on the influence of OAE on phytoplankton bloom dynamics and particulate matter stoichiometry, which are key characteristics of marine ecosystems and carbon cycling. The first results indicate a delay in phytoplankton bloom timing with increasing alkalinity and pH, with no discernible impact of dilution type. Surprisingly, significant differences in Chlorophyll a dynamics at the lowest ∆TA level of 250 were observed in both dilution types. Furthermore, peak concentrations of particulate organic carbon (POC) exhibit a significant decrease with increasing ∆TA and pH in the delayed dilution treatment, particularly evident in the two highest ∆TA treatments. Conversely, the immediate dilution treatment displays a positive trend in POC with increasing ∆TA and pH, indicating the influence of alkalinity intensity and duration of alkalinity exposure before dilution on bulk POC build up by phytoplankton. Given that changes in phytoplankton bloom dynamics and particulate organic matter can alter the ocean’s CO2 uptake and sequestration potential, our results address significant knowledge gaps to determine an ecologically safe operating space for OAE implementation under nutrient rich conditions.

How to cite: Tammen, J., Kittu, L. R., Faucher, G., Schulz, K. G., and Riebesell, U.: Assessing the Influence of OAE on Particulate Matter Stoichiometry in the North Sea – Insights from a Mesocosm Study, EGU General Assembly 2024, Vienna, Austria, 14–19 Apr 2024, EGU24-436, https://doi.org/10.5194/egusphere-egu24-436, 2024.

EGU24-438 | ECS | Posters on site | OS3.5

Ocean Alk-Align: an international research project to assess the potential of Ocean Alkalinity Enhancement for marine Carbon Dioxide Removal 

Jessica Oberlander, Dariia Atamanchuk, Lennart Bach, Katja Fennel, Jens Hartmann, David P. Keller, Boriana Mihailova, Ruth Musgrave, Andreas Oschlies, Ulf Riebesell, Kai G. Schulz, and Douglas Wallace

Of the various marine Carbon Dioxide Removal (CDR) technologies proposed to date, ocean alkalinity enhancement (OAE) has, arguably, the largest carbon removal potential. OAE has several advantages over other approaches: it does not compete for nutrient use, it is applicable to large regions of the coastal and open ocean, it can mitigate ocean acidification, and it has a high potential for permanence. Consequently, a growing number of private-sector innovators are actively pursuing OAE, leading to the potential risk that independent, non-profit-oriented research will fall behind in providing a balanced assessment of OAE.

The Ocean Alk-Align project is a multi-year research effort involving an international consortium of researchers from Canada, Germany, and Australia. The project seeks to increase knowledge on three key research topics essential for OAE implementation: (1) efficiency and durability of CO2 removal; (2) environmental safety; (3) monitoring and verification. This will be done through the development and application of state-of-the-art experimental research, real-world observations, and near-field to Earth system modeling.

The Ocean Alk-Align project will use a multi-scale combination of laboratory and field experimentation in addition to turbulent-, regional-, and large-scale modelling. This presentation will provide an overview of ongoing and planned activities as well as some early results.

How to cite: Oberlander, J., Atamanchuk, D., Bach, L., Fennel, K., Hartmann, J., Keller, D. P., Mihailova, B., Musgrave, R., Oschlies, A., Riebesell, U., Schulz, K. G., and Wallace, D.: Ocean Alk-Align: an international research project to assess the potential of Ocean Alkalinity Enhancement for marine Carbon Dioxide Removal, EGU General Assembly 2024, Vienna, Austria, 14–19 Apr 2024, EGU24-438, https://doi.org/10.5194/egusphere-egu24-438, 2024.

EGU24-655 | ECS | Posters on site | OS3.5

Development of an Autonomous On-Site Dissolved Inorganic Carbon Analyzer using Conductometric Detection Technique 

Sayoni Bhattacharya, Mario Esposito, Toste Tanhua, and Eric P. Achterberg

Gradual increase of anthropogenic CO2 concentration in the Earth's atmosphere changes the CO2 uptake capacity by seawater, leading to alteration of ocean carbon chemistry and therefore resulting in ‘Ocean Acidification’. Dissolved Inorganic Carbon (DIC) is one of the key parameters among the four primary variables (i.e., pH, partial pressure of CO2 (pCO2), Total Alkalinity (TA), and DIC) along with temperature, salinity, and macronutrients to fully characterize the seawater carbonate system. To improve our quantitative and mechanistic understanding of the marine carbonate system, high-quality and high spatial-temporal resolution observations of DIC are required. To meet these expectations, an autonomous DIC analyzer is needed which is cost-effective, offers high sampling frequency, low reagent as well power consumption. Here we present the development and validation of a novel analyzer for autonomous measurements of DIC in seawater using conductometric detection technique. The presented DIC analyzer employs a gas diffusion flow injection approach in a “Tube In A Tube” configuration that facilitates diffusion of gaseous CO2 from an acidified sample through a gas permeable membrane (Teflon AF2400) into a stream of alkaline solution (NaOH). The change in conductivity in the alkaline medium is measured using a detection cell with 4-hollow brass electrodes and the change in conductivity is directly proportional to the DIC concentration of the sample. Physical and chemical optimizations of the analyzer yielded sample acidification to pH < 4, a NaOH concentration of 7 mM with a flowrate of 300 µL min-1, and an inner diameter of the gas permeable tube of 0.6 mm, allowing DIC measurements in both freshwater and marine systems between 500 and 3000 µmol kg-1. The analyzer can measure 4 samples hour-1 and it requires 0.2 mL of H3PO4, 0.75 mL of NaOH, and 2 mL of sample for each measurement. Temperature and salinity effects were characterized over the ranges 5-35°C and 0-35 in the laboratory, respectively, with the formulation of a mathematical T-S correction for accurate DIC determination. Measurements of a DIC reference material (RM) over four days yielded an analytical precision of ±4.89 µmol kg-1 (n=6) and an accuracy of +1 µmol kg-1. The operational robustness of the system has been demonstrated through a field deployment in the southwest Baltic Sea, yielding an analytical precision of ±9.69 µmol kg-1 (n=6). This study describes an autonomous, on-site, cost-effective DIC analyzer capable of measuring DIC in seawater at a high temporal resolution with an ultimate aim to develop an underwater DIC sensor. The achieved accuracy and precision offer an excellent opportunity to employ the analyzer in CO2 leakage monitoring and detection in the context of Carbon Capture and Storage.  

How to cite: Bhattacharya, S., Esposito, M., Tanhua, T., and Achterberg, E. P.: Development of an Autonomous On-Site Dissolved Inorganic Carbon Analyzer using Conductometric Detection Technique, EGU General Assembly 2024, Vienna, Austria, 14–19 Apr 2024, EGU24-655, https://doi.org/10.5194/egusphere-egu24-655, 2024.

EGU24-657 | ECS | Orals | OS3.5

Impact of decarbonated and high pH seawater on the physiology of intertidal mussels 

Guy Hooper, Helen Findlay, Thomas Bell, and Paul Halloran

Marine-based electrochemical Carbon Dioxide Removal (mCDR) is a rapidly evolving subject area. Technology is being developed that facilitates atmospheric CO2 removal by extracting Dissolved Inorganic Carbon (DIC) from seawater. Decarbonated seawater, that also has a high pH, is released into the marine environment, facilitating the drawdown of atmospheric CO­2 into the surface ocean. Chemical perturbations also include low levels of carbon dioxide (CO2) and bicarbonate (HCO3-),and increased levels of carbonate (CO32-). There is no literature that investigates the impact of low carbon seawater with elevated pH on marine ecosystems. Understanding and cataloguing the effect of mCDR is fundamental for: i) determining potential impact on vulnerable systems; ii) supporting the development of any necessary mitigating actions; iii) confirming overall mCDR effectiveness; and iv) engaging the public and harnessing their support.

This work presents results from laboratory experiments that examine the physiological response of keystone organisms to decarbonated and high pH seawater. Decarbonated high pH seawater released into the environment will be diluted by mixing with ambient seawater, such that the chemical perturbations become less extreme with distance from source. Intertidal mussels (Mytilus edulis) are a keystone species that utilize DIC for major cellular functions and have poor acid-base balance. Mussels were exposed to three different dilutions of decarbonated high pH seawater (generating pH values of approximately, 10, 9.2 and 8.7). Mortality, oxygen consumption rate and filtering rate were measured after short-term (48 hr) exposure and then 48 hrs after returning to ambient seawater. Initial experiments indicate that undiluted decarbonated high pH seawater has a significant short-term impact on the physiological response of Mytilus edulis, but the species shows signs of recovery following a week in ambient seawater. Data from these and other experiments will be used to generate a risk gradient that illustrates how physiological response(s) change with dilution of low carbon, high pH seawater discharge.

How to cite: Hooper, G., Findlay, H., Bell, T., and Halloran, P.: Impact of decarbonated and high pH seawater on the physiology of intertidal mussels, EGU General Assembly 2024, Vienna, Austria, 14–19 Apr 2024, EGU24-657, https://doi.org/10.5194/egusphere-egu24-657, 2024.

EGU24-812 | ECS | Orals | OS3.5

Evaluating Mg(OH)2 as an ocean alkalinity agent in tropical river, estuary and saline water 

Xuechao Wang, Jiajia Shi, Xin Huang, Ruqin Bai, Yifan Qi, Ruoyu Niu, and Mark Hopwood

Ocean Alkalinity Enhancement (OAE) is a proposed mechanism of atmospheric CO2 removal, or negative emission technology. The addition of mineral particles to natural waters is one potential method of achieving OAE, yet there are substantial uncertainties concerning the efficiency of this process in terms of total alkalinity (TA) generation under natural conditions. Laboratory incubations are generally conducted under standardized conditions with filtered, deionized or sterile water which, whilst necessary to conduct reproducible mechanistic studies, is clearly not representative of most natural waters in which OAE might be deployed. In order to assess how variation in natural water properties affects the dissolution of minerals proposed as OAE agents, here we test the conversion of Mg(OH)2 to total alkalinity (TA) in river water, estuarine water, coastal seawater and offshore seawater. We found that when added as milk of magnesia, a 10 g/L (final concentration) Mg(OH)2 dose was efficiently converted to TA (>95% efficiency) in river water with low initial TA (mean TA = 239.44), river water with medium initial TA (mean TA = 1636.13), high salinity estuarine water (salinity 27), low salinity estuarine water (salinity 5.3), and seawater. However, when Mg(OH)2 was applied to high TA river water as a single dose (10 mg/L), the TA increase was only 60% of the calculated addition. The effect of multiple small doses (2.5 mg/L) was also tested, with no significant difference in the TA conversion in most cases. Dry additions of Mg(OH)2, rather than pre-mixed suspensions of milk of magnesia, were found to be inefficient TA sources, sometimes leading to negative TA changes- especially when using small incubation bottles (2 L). Overall it was demonstrated that Mg(OH)2 can be used as an efficient TA source in most natural waters for final doses in the range 2.5-10 mg/L.

How to cite: Wang, X., Shi, J., Huang, X., Bai, R., Qi, Y., Niu, R., and Hopwood, M.: Evaluating Mg(OH)2 as an ocean alkalinity agent in tropical river, estuary and saline water, EGU General Assembly 2024, Vienna, Austria, 14–19 Apr 2024, EGU24-812, https://doi.org/10.5194/egusphere-egu24-812, 2024.

EGU24-944 | ECS | Orals | OS3.5

Responses of phytoplankton community to silicate-based and calcium-based ocean alkalinity enhancement 

Xiaoke Xin, Leila Richards Kittu, Joaquin Ortiz Cortes, Anna Wiebke Groen, and Ulf Riebesell

Ocean alkalinity enhancement (OAE) has been proposed as a strategy to sequester carbon dioxide (CO2) from the atmosphere by adding alkaline substances to seawater. In addition to alkalinity, various dissolution products could be released under OAE, depending on the choice of alkali mineral used. These products such as silicate and changes in carbonate chemistry can impact the competitive fitness of phytoplankton species, which could directly or indirectly affect the compositions of the phytoplankton community. Currently, there are knowledge gaps pertaining to the potential ecological impacts of alkalinisation on natural phytoplankton communities, which hamper a comprehensive evaluation of OAE for its large-scale implementation.

To address these gaps, we carried out an in situ mesocosm experiment examining the response of a natural plankton community over 53 days in the temperate mesotrophic waters of the Raunefjord south of Bergen, Norway to two alkali mineral applications. We simulated two mineral types, a calcium-based (quicklime) and silicate-based (olivine) alkalinisation in a non-equilibrated approach. NaOH was used in both mineral treatments to establish a gradient of six alkalinity levels ranging from ambient (~2400 µmol kg-1) to ~3000 µmol kg-1 in steps of 150 µmol kg-1. Silicate-based and calcium-based alkalinisation were simulated through the addition of MgCl2 and CaCl2, respectively. Additionally, the treatment simulating olivine-based OAE received 70 µmol L-1 of Si(OH)4. Since phytoplankton was nutrient limited from the onset of the experiment, nutrients (nitrate, phosphate) were added halfway through the study to allow for an explicit detection of responses.

Here we report on the responses of the phytoplankton community to the simulated OAE scenarios. Our results indicate that phytoplankton abundances remained largely unaffected across the alkalinity gradient and between mineral types during the oligotrophic phase of the experiment. However, significant differences in the phytoplankton community response were observed post nutrient addition. Here, coccolithophores exhibited a negative response to increasing alkalinity in the silicate-based treatment, whereas the correlation was relatively weak in the calcium-based treatment. We attribute these responses, in part, to changes in carbonate chemistry such as low pCO2, which may limit coccolithophore growth and the out-competition by diatoms favoured by added silicate.

Overall, our findings suggest minimal risks associated with OAE under oligotrophic conditions over a 20-day period. However, the potential for species-specific negative impacts of increasing alkalinity should be carefully considered under high nutrient availability. These results represent a crucial first step towards understanding the ecological responses of phytoplankton communities, helping to define the safe operating space in non-equilibrated OAE implementations. 

How to cite: Xin, X., Kittu, L. R., Ortiz Cortes, J., Groen, A. W., and Riebesell, U.: Responses of phytoplankton community to silicate-based and calcium-based ocean alkalinity enhancement, EGU General Assembly 2024, Vienna, Austria, 14–19 Apr 2024, EGU24-944, https://doi.org/10.5194/egusphere-egu24-944, 2024.

EGU24-1429 | ECS | Orals | OS3.5

A global efficiency map of ocean alkalinity enhancement (OAE) for CO2 removal 

Mengyang Zhou, Michael D. Tyka, Scott Bachman, Elizabeth Yankovsky, Alicia R. Karspeck, David T. Ho, and Matthew C. Long

To limit global warming to below 2°C by 2100, carbon dioxide removal (CDR) from the atmosphere will be necessary. Ocean alkalinity enhancement (OAE) is a promising approach to achieving CDR at a large scale. However, OAE deployments are subject to slow or incomplete air-sea CO2 exchange, reducing the efficiency of carbon removal, defined as the excess CO2 uptake per mol of alkalinity addition. We used a coupled ocean circulation-biogeochemistry model to generate the first global, time-resolved map of OAE efficiency across four different seasons and investigated its controlling factors. An ensemble of alkalinity pulse injections in the global ocean were simulated with the global 1-degree ocean component of the Community Earth System Model version 2 (CESM2). Alkalinity was added to the surface ocean for 1 month in a total of 690 patches and in 4 different seasons of a year. Each simulation was run for 15 years for each patch and season to compute OAE efficiency, residence time of excess alkalinity retained in the mixed layer, and CO2 re-equilibration timescales - all referenced to the geographic location of the induced perturbation. OAE efficiency showed large spatial and seasonal variations. The highest seasonal mean OAE efficiency achieved after 15 years, ranging from 0.7 to 0.9, were found in the subpolar oceans, the semi-closed regions, such as the Gulf of St. Lawrence and the North Sea, as well as the coastal zones along the Pacific and South Atlantic. The lowest seasonal mean, ranging from 0.3 to 0.5, was found in the high latitudes Atlantic and Southern Ocean where deep water forms. The intermediate values, ranging from 0.5 to 0.7, were found predominantly in the subtropical gyres, as well as western and eastern boundary currents. Seasonally, higher maximum OAE efficiency could generally be achieved when alkalinity is released in the summer rather than in winter. Accurate understanding of the CO2 response curves, as provided by our maps, is critical for choosing suitable OAE deployment sites and is central to the MRV (Measurement, Reporting & Verification) challenge faced by all marine CDR methods. 

How to cite: Zhou, M., Tyka, M. D., Bachman, S., Yankovsky, E., Karspeck, A. R., Ho, D. T., and Long, M. C.: A global efficiency map of ocean alkalinity enhancement (OAE) for CO2 removal, EGU General Assembly 2024, Vienna, Austria, 14–19 Apr 2024, EGU24-1429, https://doi.org/10.5194/egusphere-egu24-1429, 2024.

Bringing carbon dioxide (CO2removal approaches from the laboratory to the industrial scale in the following years is imperative to reaching Net Zero goals. Ocean Alkalinity Enhancement (OAE) is a promising approach that introduces alkalinity into surface waters, slightly modifying the carbonate equilibrium and thus increasing the seawater’s CO2 removal capacity. The co-location of OAE with existing coastal industries (e.g., desalination plants) is a way to accelerate their deployment.

Recognizing the importance of balancing climate mitigation strategies with environmental stewardship, our study focuses on the outcomes of comprehensive ecotoxicity tests conducted to discern the effects of return flows from desalination plants (concentrated seawater or brine) enriched with alkalinity (carbonates). To simulate real conditions, we investigated three scenarios: (i) brine alone, (ii) alkalinity alone, and (iii) brine with added alkalinity. The ecotoxicity tests were designed to capture the responses of key marine organisms across various trophic levels. Bacterial assays illuminated the microbial community's sensitivity to different scenarios, while diatom assessments provided insights into primary producers' adaptive capacity. Copepod and crustacean tests explored the cascading effects on higher trophic levels, elucidating potential ramifications for marine food webs.

Our findings shed light on the intricate interplay between alkalinity-enhanced brines and local ecosystems, providing valuable insights into potential stressors and their implications for marine biota. The ecotoxicity results at different dilutions are combined with the knowledge of mixing zones for ocean outfall technologies, putting forward the environmental impact at different distances from the alkalinity addition.

By addressing the specific challenges posed by integrating OAE with desalination, this research contributes to the ongoing dialogue on responsible and sustainable climate mitigation strategies. It offers a nuanced understanding of the potential trade-offs and synergies between addressing climate change and preserving or benefitting local marine environments. At a time when environmental testing at scale is needed, this study assesses the potential risks of such research. Ultimately, this work facilitates dialogue among OAE companies, desalination experts, policymakers, and organisms for environmental control and protection.  

How to cite: Buceta, J. and Sdez, N.: Integration of Ocean Alkalinity Enhancement Processes with Coastal Industries: Ecotoxicity Assessment for Local Environmental Impacts, EGU General Assembly 2024, Vienna, Austria, 14–19 Apr 2024, EGU24-2483, https://doi.org/10.5194/egusphere-egu24-2483, 2024.

EGU24-6487 | ECS | Orals | OS3.5

Numerical dye tracer experiments in Bedford Basin in support of Ocean Alkalinity Enhancement research 

Bin Wang, Arnaud Laurent, and Katja Fennel

Ocean Alkalinity Enhancement (OAE) is considered as a potential technique to mitigate ocean acidification and remove carbon dioxide (CO2) from the atmosphere. In this study, a suite of numerical tracer experiments was conducted using a high-resolution nested model to support ongoing OAE field trials in Halifax Harbor and Bedford Basin. We first estimated the residence time, which provides an overall description of the circulation, for different seasons over the past 20 years (2003-2022). Results show a clear seasonal pattern in residence time which is longest in July and shortest in January. Particles with different dissolution rates and sinking velocities were then added continuously through the cooling outfall of a local power plant for three months to simulate the dissolution, dispersion, and movement of different alkaline mineral feedstocks. To account for inter-annual variability, the years with the longest and shortest residence time in each season were selected to perform these simulations. Furthermore, tracer simulations will be compared with ongoing Rhodamine WT field trials. Results obtained thus far show that the surface alkalinity signal due to OAE is most likely to be detected near the cooling outfall but depends on the tidal stage and the local circulation and weather conditions. Detectability is highest in July because the residence time is longest. In addition, the detectability increases with faster dissolution rate and slower sinking velocity.


How to cite: Wang, B., Laurent, A., and Fennel, K.: Numerical dye tracer experiments in Bedford Basin in support of Ocean Alkalinity Enhancement research, EGU General Assembly 2024, Vienna, Austria, 14–19 Apr 2024, EGU24-6487, https://doi.org/10.5194/egusphere-egu24-6487, 2024.

EGU24-6536 | Orals | OS3.5

A high-resolution nested model to study the effects of alkalinity additions in a mid-latitude coastal fjord 

Arnaud Laurent, Bin Wang, Qiantong Pei, Kyoko Ohashi, Jinyu Sheng, Edmundo Garcia Larez, Caroline Fradette, Subhadeep Rakshit, Dariia Atamanchuk, Kumiko Azetsu-Scott, Chris Algar, Doug Wallace, Will Burt, and Katja Fennel

Surface ocean alkalinity enhancement (OAE), through the release of alkaline materials, is an emerging carbon dioxide removal (CDR) technology that could increase the storage of anthropogenic carbon in the ocean. Although essential, evaluating the effects of alkalinity additions on the carbonate system and ultimately on air-sea CO2 fluxes is not straight forward. Observations, even with autonomous platforms, are inherently sparse and limited, and therefore cannot provide a comprehensive quantification of the effects of OAE. Numerical models are important complementary tools. They can help guide fieldwork design, provide forecasts of the ocean state, and simulate the effects of alkalinity additions on the seawater carbonate system. Here we describe a coupled physical-biogeochemical implementation of ROMS in a nested grid configuration that reaches a very high spatial resolution in Bedford Basin (51m), a coastal fjord in eastern Canada that is chosen as a test site for OAE. The biogeochemical model simulates oxygen dynamics and the carbonate system, including air-sea gas exchange. We present a multi-year hindcast validated against the long-term weekly time series available at the Compass Buoy station in the centre of the Basin as well as recent simulations carried out during alkalinity addition trials. We will discuss the model’s capabilities with respect to OAE and the challenges ahead.

How to cite: Laurent, A., Wang, B., Pei, Q., Ohashi, K., Sheng, J., Garcia Larez, E., Fradette, C., Rakshit, S., Atamanchuk, D., Azetsu-Scott, K., Algar, C., Wallace, D., Burt, W., and Fennel, K.: A high-resolution nested model to study the effects of alkalinity additions in a mid-latitude coastal fjord, EGU General Assembly 2024, Vienna, Austria, 14–19 Apr 2024, EGU24-6536, https://doi.org/10.5194/egusphere-egu24-6536, 2024.

EGU24-7748 | ECS | Orals | OS3.5

Quantification of seawater total alkalinity measurement uncertainty to support the evaluation of ocean alkalinity enhancement 

Gaëlle Capitaine, Paola Fisicaro, and Thibaut Wagener

Ocean alkalinity enhancement is one approach being considered to contribute to marine Carbon Dioxide Removal techniques. It relies on the addition of alkalinity to the marine environment, either under the form of crushed-rock feedstocks or under a dissolved form. This conducts to the decrease of seawater partial pressure of CO2 (pCO2) allowing seawater, by equilibrium with air, to absorb more CO2 from the atmosphere.

In order to determine the amount of CO2 removed from the atmosphere, a monitoring, reporting, and verification (MRV) system of marine carbon dioxide removal needs to be designed. The evaluation of ocean alkalinity enhancement will depend on the monitoring of measurable variables of the marine carbonate system, as well as on numerical simulations. In this context, acquiring accurate and robust data of seawater total alkalinity is highly relevant in order to quantify the background state alkalinity and to check that alkalinity has efficiently been added.

In that goal, the application of the three pillars of metrology: metrological traceability, measurement procedure harmonization and validation, and uncertainty estimation, are required. However, up to date, the total alkalinity measurement method lacks of a rigorously established uncertainty budget.

The establishment of measurement results uncertainty can be realised by the mean of two approaches. The “bottom-up” approach is the most rigorous way to thoroughly establish an uncertainty budget. It relies on the identification and quantification of each source of uncertainty involved at every step of the measurement process, as described by the Guide to the expression of Uncertainty in Measurements. The “top-down” approach relies on an experimental assessment of the uncertainty, from repeatability, reproducibility and trueness estimates.

The presentation will focus on the evaluation of the uncertainty of seawater total alkalinity measurement results using the two approaches aforementioned. The sources of uncertainty originating from the potentiometric titration measurement method, and the mathematical model used for data treatment, will be presented and quantified. This study will also allow identifying which sources have the major contribution to the overall uncertainty budget, and thus the ones we should focus on to lower the uncertainty. The estimation of the uncertainty with the “top-down” approach is determined from an inter-laboratory comparison involving five laboratories, conducted on reference solutions. The developed artificial and natural seawater reference solutions, as well as the results of the inter-laboratory comparison, will be presented. Comparison, advantages and limitations of the two uncertainty estimation methods will be discussed. Finally, the level of uncertainty estimated will be discussed in the frame of MRV system in supporting the evaluation of ocean alkalinity enhancement.

How to cite: Capitaine, G., Fisicaro, P., and Wagener, T.: Quantification of seawater total alkalinity measurement uncertainty to support the evaluation of ocean alkalinity enhancement, EGU General Assembly 2024, Vienna, Austria, 14–19 Apr 2024, EGU24-7748, https://doi.org/10.5194/egusphere-egu24-7748, 2024.

EGU24-10853 | ECS | Orals | OS3.5

Interdisciplinary collaboration to develop a robust and implementable monitoring, reporting, and verification (MRV) protocol for Ocean Alkalinity Enhancement (OAE) 

Sophie Gill, Jing He, Jennifer Yin, Kevin Sutherland, Jonathan Lambert, and Neil Hacker

The marine carbon dioxide removal (mCDR) industry is undergoing rapid growth, with many stakeholders deploying mCDR pilot projects. In order to establish a scientific basis for environmental safety and carbon accounting in mCDR, there is a need for rigorous, transparent and scientifically robust monitoring, reporting, and verification (MRV) protocols. These protocols seek to ensure responsible scaling of mCDR projects that have demonstrable net-negative atmospheric impacts. One of the main MRV challenges facing the mCDR pathway of Ocean Alkalinity Enhancement (OAE) is that direct measurements in the marine environment can be difficult to obtain. Here, we present the highlights of the first version of the Isometric OAE MRV protocol and focus on the process for interdisciplinary collaboration that informed decision-making and iteration towards the current version. We focus specifically on the development of guidelines for quantifying additionality, durability and uncertainty in the open system OAE pathway, and elaborate on our modeling requirements and benchmarks, as well as guidance on how models should be validated with environmental data. Ultimately, we aim to receive feedback on the protocol and our approach in order to apply this method to new versions and additional protocols and modules across mCDR and other CDR pathways. 

How to cite: Gill, S., He, J., Yin, J., Sutherland, K., Lambert, J., and Hacker, N.: Interdisciplinary collaboration to develop a robust and implementable monitoring, reporting, and verification (MRV) protocol for Ocean Alkalinity Enhancement (OAE), EGU General Assembly 2024, Vienna, Austria, 14–19 Apr 2024, EGU24-10853, https://doi.org/10.5194/egusphere-egu24-10853, 2024.

Carbon dioxide (CO2) removal (CDR) methodologies have been proposed as essential measures to limit global warming and mitigate climate change. Carbon mineralisation, a natural process that involves the reaction of CO2 in the fluid form with reactive geologic formations to produce water-insoluble carbonates, when accelerated can permanently remove and sequester CO2 from the atmosphere at a scale of gigatons per year. The estimated storage capacity along mid-ocean ridges exceeds anthropogenic CO2 emissions by orders of magnitude but to date no offshore carbon capture storage (CCS) at ocean crust is performed. For offshore CCS, there are challenges in implementing accurate monitoring strategies and in developing robust and cost-effective technologies to support these strategies. Here we compare the sensitivities to leakage attribution and quantification of different approaches considered suitable for monitoring offshore CCS sites. As a proof of concept, we limited our target environment to the water column, specifically ocean waters below 1000 m. The effectiveness of the considered monitoring techniques and technologies was compared in terms of spatial and temporal coverage, reliability, costs and technology readiness level. A theoretical monitoring system design was proposed in order to provide guidelines for prompt detection of CO2 leakages into deep ocean waters. Appropriate monitoring tools and solid protocols for the assessment of potential environmental impacts will enhance public confidence and support efficient management of CCS operations in deep water ocean crust.

How to cite: Esposito, M., Bhattacharya, S., and Achterberg, E.: Monitoring tools and best practice guidelines for attribution and quantification of potential CO2 leakages into deep waters at ocean crust CCS sites, EGU General Assembly 2024, Vienna, Austria, 14–19 Apr 2024, EGU24-10915, https://doi.org/10.5194/egusphere-egu24-10915, 2024.

EGU24-11672 | Posters virtual | OS3.5

Bacterial response to alkalinity enhancement in intertidal environments: results of one-year field experiment  

Isabel Mendes, Julia Lübbers, Joachim Schönfeld, and Alexandra Cravo

Marine Carbon Dioxide Removal (mCDR), in particular alkalinity enhancement, is considered a promising measure to increase oceanic uptake and long-term storage of CO2 from the atmosphere. This may be affected by spreading of fine-grained, mafic minerals and rocks in coastal areas, where the weathering of these substrates produces excess alkalinity and thus increases the CO2 consumption. Before marine alkalinity enhancement can be considered as a large-scale mCDR measure, the biogeochemical and ecological impacts are to be evaluated under natural conditions in field experiments. The response of the bacterial community to alkalinity enhancement is of prime importance, because of their high biomass, low trophic levels, and relevance for the nutrient cycle.

An experiment was installed and monitored for one-year in the intertidal pioneer vegetation zone of the saltmarsh at Ria Formosa Coastal Lagoon, southern Portugal. The experimental plot comprised three replicate deployments of fine and coarse-grained olivine and basalt, and an untreated control site. The pore water properties (e.g., temperature, salinity, pH, alkalinity) of the substrates and the control were analysed every month. Sediment samples were collected from each treatment and the control every three months, starting the day after substrate deployment in September 2022 until June 2023, thus covering a one-year seasonal cycle. Bacterial dynamics were monitored using a metagenomic full-length 16S gene approach conducted by AppGenomics Lda, Faro. DNA was extracted from the sediment samples. The 16S region was amplified and sequenced using the Oxford Nanopore Technologies (ONT) Promethion P2 solo sequencerlibrary and equipments. After quality control and filtering, the generated reads were analysed regarding the taxonomic content using the Kraken2 and Bracken tools coupled with the database RefSeq 16S database of NCBI. The results were analysed using the Phyloseq R package. Proteobacteria (54 to 36%), Bacteroidota (23 to 7%), Cyanobacteria (19 to 3%) and Planctomycetota (16 to 8%) were the most abundant phyla in all samples. Bacteriodota increased in abundance with high alkalinities in the treatments with fine olivine while the Proteobacteria were suppressed by the high pH and ensuing alkalinities in the olivine treatments. There was no response to the basalt treatments, although alkalinity was also increased compared to the control. The bacterial Shannon Diversity Index (H) of the four treatments and the control ranged from 5.66 to 6.44 and no significant differences on the bacterial diversities in the different treatments were found.

Acknowledgement. Research supported by the Portuguese Science Foundation, with the projects RECAP - PTDC/CTA-CLI/1065/2021 (https://doi.org/10.54499/PTDC/CTA-CLI/1065/2021), UID/00350/2020CIMA (https://doi.org/10.54499/UIDP/00350/2020, https://doi.org/10.54499/UIDB/00350/2020), LA/P/0069/2020ARNET and contracts DL57/2016/CP1361/CT0009, CEECINST/00052/2021/CP2792/CT0012.

How to cite: Mendes, I., Lübbers, J., Schönfeld, J., and Cravo, A.: Bacterial response to alkalinity enhancement in intertidal environments: results of one-year field experiment , EGU General Assembly 2024, Vienna, Austria, 14–19 Apr 2024, EGU24-11672, https://doi.org/10.5194/egusphere-egu24-11672, 2024.

EGU24-11674 | ECS | Posters on site | OS3.5

Enhanced silicate weathering in permeable sediments from the North Sea – a laboratory study using flow-through reactors 

Male Köster, Alexander Diehl, Wolfgang Bach, and Sabine Kasten

The Earth’s climate is increasingly warming due to ongoing anthropogenic carbon dioxide (CO2) emissions. In order to mitigate the human-made climate change and to meet the Paris Agreement goals of limiting the warming below 2°C, active carbon dioxide removal (CDR) from the atmosphere is of great importance in addition to massive CO2 emission reductions. A possible CDR method is rock weathering and the associated dissolution of silicate minerals in the ocean, which leads to marine alkalinity enhancement and, thus, an enhanced flux of CO2 from the atmosphere into the ocean. In the framework of the project RETAKE, a consortium of the German Marine Research Alliance (DAM) research mission CDRmare, we investigate the potential, feasibility and side effects of silicate mineral dissolution in high-energy coastal environments where strong currents and advection of seawater through permeable sediments have been proposed to accelerate weathering of silicate rocks [1]. Permeable sediments are generally characterized by advective pore-water flow. Under advective conditions, higher weathering rates than those found in diffusion-controlled depositional settings are expected since the reaction products are rapidly removed and the formation of authigenic mineral coatings on mineral grains is prevented. Using flow-through sediment columns, advective pore-water fluxes through the sediment as they prevail in natural permeable beach and coastal deposits can be simulated [2,3].

Here, we present data from laboratory experiments with flow-through reactors that are filled with permeable sandy sediments from the North Sea, Germany, amended with fine-grained dunite (0.063-0.180 mm), mainly composed of olivine (~ 90 %). The flow-through experiments are conducted under oxic conditions whereby air-saturated natural seawater is continuously pumped through the reactors for 160 days. Our results demonstrate an increase in both alkalinity and dissolved inorganic carbon (DIC) of up to 4 mM in the reactors with dunite addition while the alkalinity and DIC concentrations in the control reactors (without dunite addition) are close to background seawater values of 2.3 mM. However, since dunite contains relatively high amounts of nickel (0.3 wt%), enhanced weathering may also be associated with an increased release of this potentially toxic trace metal. Indeed, the nickel concentrations in the effluent water of the dunite-amended sediment columns are increased by up to 900 nM. Silica and phosphate concentrations are elevated compared to the seawater values in both the control and the dunite-amended reactors. While the silica concentrations in the dunite-amended reactors are higher by up to 10 µM compared to the control, the opposite pattern is observed for phosphate. The slightly lower phosphate concentrations in the dunite reactors might be related to the precipitation of authigenic minerals, for example, iron phosphates or to adsorption of phosphate onto mineral grains. To identify possible authigenic minerals as potential sinks for the reaction products, the solid phase will be sampled and the chemical and mineralogical composition is analyzed after the experiments are terminated.


[1] Meysman and Montserrat, 2017. Biol. Lett. 13: 20160905.

[2] Ahmerkamp et al., 2020. Sci. Rep. 10: 3573.

[3] Zhou et al., 2023. Sci. Total Environ. 865: 161168.

How to cite: Köster, M., Diehl, A., Bach, W., and Kasten, S.: Enhanced silicate weathering in permeable sediments from the North Sea – a laboratory study using flow-through reactors, EGU General Assembly 2024, Vienna, Austria, 14–19 Apr 2024, EGU24-11674, https://doi.org/10.5194/egusphere-egu24-11674, 2024.

EGU24-12132 | Posters on site | OS3.5

Detectability of alkalinity plumes during the OAE field trial: A Bedford Basin case study 

Dariia Atamanchuk, Arnaud Laurent, Bin Wang, Katja Fennel, Ruth Musgrave, Douglas Wallace, Caroline Fradette, Robert Izett, and Will Burt

In the Fall of 2023, in collaboration with Dalhousie University researchers, Planetary Technologies completed a first-of-a-kind series of alkalinity releases in the Bedford Basin/Halifax Harbour (Canada) using several alkalinity sources at varying dosing rates. These OAE trials aimed to test the detectability of alkalinity plumes resulting from the addition of varying amounts of alkalinization material and the different types of material - dissolved or particulate. Detectability of the released alkalinity was examined by observing the changes in the carbonate system of seawater measured in the water samples and by the sensor-equipped in situ platforms - fixed and mobile – before, during and after the trials. The collected data was used to test and validate the regional biogeochemical model (ROMS) available for the Bedford Basin, which largely informed the sampling design during the trial.

We will present the challenges encountered, results and insights gained during the field trials in the Bedford Basin/Halifax Harbour in the Fall of 2023, particularly focusing on improvements to the observational component in 2024. We will discuss the utility of the moored and profiling assets, surface and underwater vehicles, and various water sampling methods in tracking and characterizing alkalinity plumes during the OAE trials

How to cite: Atamanchuk, D., Laurent, A., Wang, B., Fennel, K., Musgrave, R., Wallace, D., Fradette, C., Izett, R., and Burt, W.: Detectability of alkalinity plumes during the OAE field trial: A Bedford Basin case study, EGU General Assembly 2024, Vienna, Austria, 14–19 Apr 2024, EGU24-12132, https://doi.org/10.5194/egusphere-egu24-12132, 2024.

EGU24-12196 | ECS | Posters on site | OS3.5

The use of trace metal-rich Greenlandic glacial rock flour for ocean enrichment experiments 

Clara R. Vives, Jørgen Bendtsen, Kristina Vallentin Larsen, Niels Daugbjerg, Katherine Richardson, and Minik Thorleif Rosing

In order to keep global warming below 2ºC, it is imperative not only to reduce future carbon dioxide (CO2) emissions but also to adopt negative emissions technologies (NETs) to remove approximately 600 Gt of CO2 from the atmosphere by the end of the twenty-first century. Among NETs, ocean alkalinity enhancement and ocean enrichment emerge as promising strategies for Carbon Dioxide Removal (CDR), leveraging the immense carbon-absorbing capacity of oceans.

Glacial rock flour (GRF), an ultra fine-grained silicate mineral originating beneath the Greenland Ice Sheet, holds potential as a contributor to large-scale marine CO2 removal (mCDR). As it is transported into coastal waters, the dissolution of GRF in seawater naturally releases mineral components into the ocean. As a silicate-rich substance with micronutrients like iron and manganese, GRF has the dual capacity to enhance alkalinity and promote phytoplankton growth, presenting a viable avenue for mCDR. In a field study from the Kangerlussuaq fjord and glacier near the Greenland Ice Sheet (summer 2023) we observed that melt- and seawater contained an array of trace metals in high concentrations, including iron, manganese, zinc, copper, and cobalt, and the concentrations increased towards the fjord and away from the source. We explore the response to varying treatments with GRF, iron, manganese and zinc using laboratory incubation experiments with an Arctic phytoplankton diatom species (Coscinodiscus radiatus). We identify the relative mobilization rate of these trace metals in the GRF that can support phytoplankton growth and hypothesise that GRF can alleviate the co-limitation of iron and manganese on phytoplankton growth.

How to cite: R. Vives, C., Bendtsen, J., Vallentin Larsen, K., Daugbjerg, N., Richardson, K., and Thorleif Rosing, M.: The use of trace metal-rich Greenlandic glacial rock flour for ocean enrichment experiments, EGU General Assembly 2024, Vienna, Austria, 14–19 Apr 2024, EGU24-12196, https://doi.org/10.5194/egusphere-egu24-12196, 2024.

EGU24-12290 | ECS | Orals | OS3.5

Ocean Alkalinity Enhancement efficiency in the North Pacific under influence of the Pacific Decadal Oscillation 

Andrea van Langen Rosón, Ana C. Franco, Raffaele Bernardello, Jörg Schwinger, David Keller, and Hao-Wei Wey

Carbon Dioxide Removal (CDR) technologies are imperative for achieving net zero emissions, a crucial feat to meet the 2º target set in the Paris Agreement. Ocean Alkalinity Enhancement (OAE) is a marine CDR technology that consists of increasing the Total Alkalinity (TA) of the ocean by depositing alkaline minerals to ocean surface waters. The increase in TA reduces the sea surface partial pressure of CO2 (pCO2), thereby enhancing oceanic CO2 uptake or reducing oceanic CO2 outgassing. Despite the potential of OAE to reduce atmospheric CO2 concentrations, the realistic implementation of OAE faces substantial impediments, including logistical feasibility and the lack of international ocean governance for its deployment in open waters. To address these obstacles and incentivize the development of a policy framework for OAE, we set forward optimal conditions that maximize the efficiency of OAE in the North Pacific Ocean, leveraging natural climatic variability induced by the Pacific Decadal Oscillation (PDO). The addition of TA at high Dissolved Inorganic Carbon (DIC) concentrations has the potential to induce a stronger decrease in pCO2 than at lower DIC concentrations. Therefore, natural temporal increases in surface DIC concentrations could potentially predispose the system for enhanced OAE efficiency. The PDO induces multi-decadal variations in the carbonate system, with the potential to influence the spatiotemporal variability in OAE efficiency. PDO phases have been shown to be predictable up to a decade ahead, thereby providing a practical indication for logistical planning of OAE deployment. We analyze the influence of the PDO on OAE efficiency in the North Pacific Ocean through four Earth System Model simulations under a high emission scenario (RCP8.5) spanning from 2020 to 2100. Using theoretical CO2 uptake efficiencies, as defined by Tyka et al. (2022) and Renforth and Henderson (2017), we describe how PDO states modulate variability in uptake efficiency via their control on DIC and TA concentrations. Subsequently, we analyze the realized uptake efficiency by contrasting oceanic air-water CO2 fluxes (FCO2) in simulations with continuous and homogenous global OAE deployment against simulations without CDR intervention per unit of added TA. Early results show regional differences in OAE efficiency rates during different PDO phases. During positive PDO phases, theoretical CO2 uptake efficiencies decrease in the Northeast Pacific while increasing in the central Western Pacific, corresponding to respectively lower and higher DIC concentrations. The inverse responses are observed during negative PDO phases. We discern differences between theoretical and realized CO2 uptake efficiencies, indicating the role of additional influential variables. Our study provides new insights into the impact of the PDO on OAE efficiency and the potential to optimize CDR strategies by aligning them with natural climatic variations.

How to cite: van Langen Rosón, A., C. Franco, A., Bernardello, R., Schwinger, J., Keller, D., and Wey, H.-W.: Ocean Alkalinity Enhancement efficiency in the North Pacific under influence of the Pacific Decadal Oscillation, EGU General Assembly 2024, Vienna, Austria, 14–19 Apr 2024, EGU24-12290, https://doi.org/10.5194/egusphere-egu24-12290, 2024.

EGU24-12695 | ECS | Orals | OS3.5

Considering hydrous carbonates for ocean alkalinity enhancement 

Stefan Baltruschat, Laura Bastianini, Rachel Millar, Boriana Mihailova, Spyros Foteinis, Pranav Thoutam, Xuesong Lu, Jens Hartmann, Aidong Yang, and Phil Renforth

Ocean Alkalinity Enhancement (OAE) emerges as a promising strategy capable of sequestering several gigatons of CO2 annually from the atmosphere and store it in the ocean for extended periods (>1000 years). To achieve this objective, artificial alkalinity is introduced into the surface ocean through alkaline solutions or the spontaneous dissolution of alkaline solids. When contemplating alkaline solids for OAE, a primary challenge lies in generating substantial quantities of fine grained (<10 µm), soluble solids at low energy and cost. The hydration of carbonates presents a potentially less energy-intensive method, yielding products that exhibit favorable thermodynamics leading to their spontaneous dissolution in seawater1.

We investigated the stability and dissolution kinetics of two hydrous carbonates, Ikaite (CaCO₃·6H₂O) and water-bearing amorphous calcium carbonate (CaCO3.nH2O), labelled hereafter as w-ACC. Both phases can be created from dissolving limestone at high CO2 pressures. An engineering concept using a CO2 pressure swing in a reactor has been recently published1. Once created,  the hydrous carbonate phases are unstable at temperatures higher than the formation temperature and transform to anhydrous polymorphs after a certain period of time. Thus, we have investigated the temporal stability of either phase at different temperatures in order to contribute to their life cycle assessment. Moreover, the transformation of ikaite and w-ACC to an anhydrous polymorph obliterates the effect of releasing alkalinity during spontaneous dissolution, which needs to be avoided. Our results show that at room temperature both phases dehydrate within hours when stored as wet powders after simple filtration. However, their stability extends to days when the physical adsorbed water is removed e.g. by rinsing with ethanol. A quantitative estimate of the kinetic rate of the hydrous-to-anhydrous phase transformation is currently being analyzed by Raman spectroscopy .

Our results also indicate that w-ACC has a higher dissolution rate than ikaite in seawater due to its higher specific surface area (>90m2/g). However, the efficiency of both hydrated carbonates in releasing alkalinity will be further analyzed to elucidate the effect of particle coagulation, particle sinking, and secondary precipitation phenomena. Nonetheless, our pilot results demonstrate that both ikaite and w-ACC are promising candidates for OAE, considering their potential in augmenting ocean alkalinity and CO2 sequestration.


1             Renforth, P., Baltruschat, S., Peterson, K., Mihailova, B. D. & Hartmann, J. Using ikaite and other hydrated carbonate minerals to increase ocean alkalinity for carbon dioxide removal and environmental remediation. Joule 6, 2674-2679 (2022). https://doi.org/10.1016/j.joule.2022.11.001

How to cite: Baltruschat, S., Bastianini, L., Millar, R., Mihailova, B., Foteinis, S., Thoutam, P., Lu, X., Hartmann, J., Yang, A., and Renforth, P.: Considering hydrous carbonates for ocean alkalinity enhancement, EGU General Assembly 2024, Vienna, Austria, 14–19 Apr 2024, EGU24-12695, https://doi.org/10.5194/egusphere-egu24-12695, 2024.

EGU24-13093 | Posters virtual | OS3.5

The impact of ocean liming on phytoplankton size-structure and the balance of photosynthesis and respiration in two contrasting environments 

Pablo Serret, Daniela Basso, Paraskevi Pitta, Iordanis Magiopoulos, Paulo Alcaraz, Alejandro Penín, Anastasia Tsiola, Filomena Romano, Arianna Azzelino, Piero Macchi, Silvia Valsecchi, Selene Varliero, and Jose González

Current efforts to reduce CO2emissions are being insufficient to decrease its atmospheric concentration and to avoid exceeding the warming threshold in the Paris agreement. Although reducing emissions remains essential, additional tools to limit global warming are being actively searched. These include methods to reduce the concentration of atmospheric CO2 by capturing it from the air (the so-called Negative Emissions Technologies, NET). Ocean Alkalinity Enhancement (OAE) is a potentially viable NET that consists on the addition of alkaline substances, including slaked lime (calcium hydroxide), to the ocean, which enhances the ocean’s capture of atmospheric CO2 and raises the pH of the seawater, thus countering ocean acidification. Beyond technological challenges to cost-effective OAE methods, a rigorous assessment of potential ecological and geochemical impacts is necessary. Ocean liming on the wake of ships is proposed as one of the most efficient ways for OAE. The discharge of slaked lime as a side activity of maritime traffic avoids the need of dedicated boats thus increasing the efficiency of OAE by reducing the amount of CO2 emitted to perform this technique. Nevertheless, this procedure can cause local pH peaks, which may have temporary and local effects on the pelagic ecosystem, e.g. by selecting less sensitive plankton species and promoting the growth of calcifiers, thus shifting the phytoplankton composition and the functioning of the whole plankton community. The impact of OAE on the structure and functioning of plankton communities is however poorly known.

Here we present results of the impact on phytoplankton biomass and plankton community metabolism (photosynthesis and respiration) of repeated additions of slaked lime (Ca(OH)2) during two mesocosm experiments in two contrasting coastal environments: the highly productive upwelling system of the Ría de Vigo (NW Spain) and the ultraoligotrophic eastern Mediterranean in Crete (Greece). The same experimental design was conducted at the CIM-ECIMAT (University of Vigo) and CRETACOSMOS (Hellenic Centre for Marine Research) facilities. Nine mesocosms were filled with natural coastal seawater. Three served as control, and Ca(OH)2 slurry additions were repeated on days 1,3,5 (Vigo) and 1,3,5,7,9,11 (Crete) to simulate the chronic disturbance expected from repeated discharges from ships. Two different concentrations of calcium hydroxide were used, with three replicates each. pH, O2, salinity, and temperature were recorded with a ten-minutes frequency. Size-fractionated chlorophyll a (0.2-2, 2-20, >20 μm) results indicate a dose-dependent effect on the phytoplankton community, with a differential response depending on the phytoplankton size-fraction. Gross primary production (GPP), community respiration (CR) and net community production (NCP) were determined from in vitro changes in O2 concentration after 24 h light and dark incubations. Preliminary results indicate that the trophic functioning of the plankton community was impacted only by the high slurry addition treatment (H), and more notably in the eutrophic ecosystem of the Ría de Vigo. The response, however, was similar in both experiments, with GPP decreasing to a greater extent than CR, which caused a reduction of NCP in the H with respect to the L and control mesocosms.

How to cite: Serret, P., Basso, D., Pitta, P., Magiopoulos, I., Alcaraz, P., Penín, A., Tsiola, A., Romano, F., Azzelino, A., Macchi, P., Valsecchi, S., Varliero, S., and González, J.: The impact of ocean liming on phytoplankton size-structure and the balance of photosynthesis and respiration in two contrasting environments, EGU General Assembly 2024, Vienna, Austria, 14–19 Apr 2024, EGU24-13093, https://doi.org/10.5194/egusphere-egu24-13093, 2024.

EGU24-13100 | Orals | OS3.5

Glacial rock flour is a potential source for marine carbon dioxide removal by stimulating phytoplankton growth 

Jørgen Bendtsen, Niels Daugbjerg, Kristina Vallentin Larsen, Clara R. Vives, Rasmus Dyrberg Dahms, Katherine Richardson, and Minik Thorleif Rosing

Glacial rock flour (GRF) is a fine-grained silicate mineral formed below the Greenland Ice Sheet where the bedrock is abraded to a fine powder. GRF is transported by meltwater into fjords and coastal waters and its dissolution in seawater is part of the natural cycling of material between continents and the ocean. It is present in large sedimentary deposits along the coast of Greenland. However, due to the relatively small size distribution of GRF (d50 ~ 2-5 µm) it has a relatively long residence time in the coastal surface layers and significant amounts reach the open ocean as suspended particulate material. As a silicate-rich material, also containing substantial amounts of micronutrients (e.g., iron and manganese), dissolution of GRF has the potential to both increase alkalinity and support phytoplankton growth. Therefore, it may be considered a source for large-scale marine CO2 removal (mCDR). In this presentation we focus on its potential for supporting phytoplankton growth. We present results from incubation experiments in the field with natural phytoplankton communities and from climate-regulated laboratory experiments with a single-species phytoplankton culture. Field-incubations (6 days) with a subtropical phytoplankton community showed a significant increase in photosynthetic activity (Fv/Fm) in treatments with GRF. Similar field-experiments with natural communities from an Arctic fjord in Greenland, with a high natural background concentration of GRF, showed a modest or a neutral response to further addition of GRF. Long laboratory incubation experiments (3 weeks) with an Arctic green alga showed a significant increase in both growth rate and photosynthetic activity in treatments with GRF. The growth increased gradually with increasing concentrations of GRF until saturation was reached. This response was consistent with a simple model of trace-metal limited growth where micronutrients (e.g., iron) is biologically mobilized from GRF during the incubation period. These results show that substances in GRF, likely trace metals, can be biologically mobilized on timescales of days to weeks and thereby support growth of phytoplankton. Thus, GRF may be a source for large-scale mCDR due to its potential for increasing ocean productivity and strengthening the biological pump.


How to cite: Bendtsen, J., Daugbjerg, N., Vallentin Larsen, K., R. Vives, C., Dyrberg Dahms, R., Richardson, K., and Thorleif Rosing, M.: Glacial rock flour is a potential source for marine carbon dioxide removal by stimulating phytoplankton growth, EGU General Assembly 2024, Vienna, Austria, 14–19 Apr 2024, EGU24-13100, https://doi.org/10.5194/egusphere-egu24-13100, 2024.

EGU24-13685 | Orals | OS3.5

Ocean liming in eutrophic vs. ultraoligotrophic environments and the response of algal calcifiers 

Daniela Basso, Pietro Bazzicalupo, Selene Varliero, Jose González, Pablo Serret, Paraskevi Pitta, Paulo Alcaráz, Alejandro Penín, Piero Macchi, Guido Raos, Eleonora Barbaccia, Iordanis Magiopoulos, Anastasia Tsiola, Filomena Romano, Silvia Valsecchi, and Arianna Azzellino

Our commitments to limit future global warming to below 2°C of the pre-industrial level are clashing with demonstrably insufficient present-day efforts to reduce CO2 emissions. The development and implementation of Negative Emission Technologies (NETs), enabling a massive and fast CO2 Removal (CDR), represent the most promising strategy to support an effective mitigation of the ongoing climate change within the next decade. Marine CDR (m-CDR) encompasses those technologies exploiting the ocean CO2 storage potential, and there is an increasing number of international initiatives aimed at assessing their possible impact on marine communities. Ocean liming consists in spreading alkaline substances, such as calcium hydroxide (slaked lime), on surface ocean waters. Slaked lime reacts with surface marine waters by triggering m-CDR from the atmosphere and ocean alkalinity enhancement, thus contrasting ocean acidification. Although ocean liming has already been assessed as chemically effective and economically sustainable, the scientific scrutiny of its potential impacts on the ocean biota has just started. Previous laboratory and mesocosm experiments showed the occurrence of transient pH peaks, which may impact the pelagic ecosystem by selecting less sensitive species, and runaway precipitation of aragonite particles after concentrated and repeated liming, which reduces the efficiency of CDR and negatively affects both plankton and benthos by mechanical clogging and choking. Nutrients exert a major control on primary producers, and higher salinity may affect the carbonate kinetics by facilitating CaCO3 precipitation. For these reasons, two mesocosm experiments of liming, funded by the EU2020 project AQUACOSM-plus and the OACIS-initiative of the Fondation-Prince-Albert-II-de-Monaco, were conducted with a comparable experimental design at the CIM-ECIMAT (University of Vigo) and CRETACOSMOS (Hellenic Centre for Marine Research) facilities. The aim was to contrasting the response to ocean liming of the eutrophic Ría de Vigo upwelling system (eastern Atlantic) and the eastern Mediterranean ultraoligotrophic and more saline setting. The preliminary results of repeated additions of slaked lime in the two different types of marine coastal waters, and the response of calcareous nannoplankton and benthic calcareous red algae (coralline algae) to the observed chemical changes are presented here, suggesting the need to optimize and modulate the mCDR techniques, in order to meet the specific geochemical and biological characteristics of the different water bodies.

How to cite: Basso, D., Bazzicalupo, P., Varliero, S., González, J., Serret, P., Pitta, P., Alcaráz, P., Penín, A., Macchi, P., Raos, G., Barbaccia, E., Magiopoulos, I., Tsiola, A., Romano, F., Valsecchi, S., and Azzellino, A.: Ocean liming in eutrophic vs. ultraoligotrophic environments and the response of algal calcifiers, EGU General Assembly 2024, Vienna, Austria, 14–19 Apr 2024, EGU24-13685, https://doi.org/10.5194/egusphere-egu24-13685, 2024.

EGU24-13727 | ECS | Posters on site | OS3.5

The effects of near-surface turbulence on CO2 flux at the ocean-atmosphere boundary  

Josiane Ostiguy, Ruth Musgrave, Graigory Sutherland, Douglas Wallace, and Anneke ten Doeschate

Ocean alkalinity enhancement (OAE) seeks to store carbon in the ocean as bicarbonate or carbonate ions and thus accelerates CO2 uptake from the atmosphere. Near-surface ocean turbulence is an important driver of CO2 uptake by the ocean as it affects the rate at which air-sea gas exchange occurs. Turbulent mixing can also cause high alkalinity water to sink out of the mixed layer, where it will no longer be in contact with the atmosphere. In this presentation we will show the results of high resolution numerical simulations in which alkalinity and dissolved inorganic carbon are advected in a turbulent mixed layer. By coupling the physics to a simple carbonate system solver, we evaluate the potential impact of surface turbulence on CO2 flux into the ocean. We explore the impact of ocean surface processes on the evolution and downwards diffusion of a surface alkalinity addition as influenced by different wind, temperature and precipitation conditions. The CO2 flux is computed according to both an empirical and a physically derived parameterization, and an estimate of the sensitivity of the total CO2 flux to the choice of parameterization is presented.

How to cite: Ostiguy, J., Musgrave, R., Sutherland, G., Wallace, D., and ten Doeschate, A.: The effects of near-surface turbulence on CO2 flux at the ocean-atmosphere boundary , EGU General Assembly 2024, Vienna, Austria, 14–19 Apr 2024, EGU24-13727, https://doi.org/10.5194/egusphere-egu24-13727, 2024.

EGU24-14865 | Posters on site | OS3.5

Model-based assessment of the environmental impact of deployment of captured carbon (wood chips and calcium carbonate) on the bottom biogeochemistry in the Norwegian Sea 

Evgeniy Yakushev, Anfisa Berezina, Nicholas Roden, Andrew King, Tore Waaland, Anna Savage, and Alison Tune

The ocean is the largest natural carbon sink on our planet and provides a range of biological and chemical pathways by which this natural fast-to-slow carbon transfer occurs. This allows the elaboration of carbon removal systems aiming to shift carbon between the fast carbon cycles (years to decades) and slow carbon cycles (100s millions of years). An idea behind this project is to produce the carbon-containing “biomass” consisting of mixtures of sustainably sourced forestry residues (both hardwood and softwood), calcium carbonate, lime kiln dust, and water that is mixed and passively cured. This “biomass” should be deployed to the deep ocean bottom (Norwegian Sea); therefore, containing carbon should be excluded from the fast carbon cycle.

To investigate the spatial and temporal scales of the “biomass” potential negative impact on the water column and benthic biogeochemistry, we used a coupled model consisted from the FABM family C-N-P-Si-O-S-Mn-Fe biogeochemical model BROM and 2-dimensional benthic-pelagic transport model (2DBP), considering vertical and horizontal transport in the water and upper sediments along a transect centered on a impacted region. The model describes in detail the processes of organic matter mineralization in oxygen-depleted conditions that are vitally important for assessing biogeochemical impacts (i.e., denitrification, metal reduction, sulfate reduction). This model was previously used to investigate the impact of fish farming waste on the bottom biogeochemistry (Yakushev et al., 2020). In this study, we evaluated the maximum amount of the “biomass” that can be accumulated on the bottom surface without dramatic changes in the oxygen regime, acidification, and biogeochemistry that can negatively affect the ecosystem.

The work was supported by the Running Tide (https://www.runningtide.com/).

References:

Yakushev E., Wallhead Ph., Renault P., Ilinskaya A., Protsenko E., Yakubov Sh., Pakhomova S. Sweetman A., Dunlop K., Berezina A., Bellerby R., Dale T. 2020.Understanding the Biogeochemical Impacts of Fish Farms using a Benthic-Pelagic Model. Water, 2020, 12, 2384; doi:10.3390/w12092384

How to cite: Yakushev, E., Berezina, A., Roden, N., King, A., Waaland, T., Savage, A., and Tune, A.: Model-based assessment of the environmental impact of deployment of captured carbon (wood chips and calcium carbonate) on the bottom biogeochemistry in the Norwegian Sea, EGU General Assembly 2024, Vienna, Austria, 14–19 Apr 2024, EGU24-14865, https://doi.org/10.5194/egusphere-egu24-14865, 2024.

EGU24-15533 | Posters on site | OS3.5

Monitoring, reporting and verification for a marine carbon dioxide removal process: a case study 

Federico Comazzi, Stefano Cappello, Francesco Campo, Mario Grosso, and Stefano Caserini

To achieve ambitious climate change goal as the one set by the Paris Agreement, Carbon Dioxide Removal (CDR) processes should be deployed in addition to rapid emission reductions. The process of Monitoring, Reporting, and Verification (MRV) is pivotal to certifying the effectiveness of carbon removal technologies for a voluntary or regulated CDR market.

The MRV process consists of monitoring the amount of greenhouse gas removed by a CDR activity and reporting the results of the monitoring to a third party. The third party then verifies the reporting of the results.

MRV applied to marine CDR (mCDR) that are facing challenges to precisely count the positive impact of those technologies ensuring the additionality and the long term durability of the CO2 removal.

Here, the development and the application of a new mMRV protocol for a new approach to Ocean Alkalinity Enhancement (OAE) with equilibrated pH. The challenges faced and still to be addressed will be analyzed for all the steps of MRV, and the advantages in the discharge of a pH-equilibrated alkaline solution, compared to the traditional  OAE approach where a reactive substance such as slaked lime is discharged, are discussed.

A specific measuring procedure is established for assessing the net carbon removal through specific sensors for measuring parameters, i.e., pH, Turbidity, Suspended Solid, Conductivity, CO2 detector.

The procedure for the reporting phase, where data will be automatically managed by the process internal software are presented, as well as the Verification procedure, performed by a third-party certifier that will evaluate and verify the compliance of the process to the process’ specs.

How to cite: Comazzi, F., Cappello, S., Campo, F., Grosso, M., and Caserini, S.: Monitoring, reporting and verification for a marine carbon dioxide removal process: a case study, EGU General Assembly 2024, Vienna, Austria, 14–19 Apr 2024, EGU24-15533, https://doi.org/10.5194/egusphere-egu24-15533, 2024.

EGU24-15549 | ECS | Orals | OS3.5

Assessing the Mitigation Potential and Ecological Impacts of Carbon Dioxide Removal Technologies on Ocean Ecosystems 

Giang Tran, Aurich Jeltsch-Thömmes, David Keller, Andreas Oschlies, and Fortunat Joos

Climate change poses a critical threat to global ecosystems and human well-being, necessitating innovative solutions for carbon dioxide (CO2) mitigation. This study employs the UVic-ESCM, an Earth system model of intermediate complexity, to investigate the potential and possible side effects of two marine-based CO2 removal techniques, namely ocean alkalinity enhancement and macroalgae farming and sinking. Additionally, simulations from Bern3D-LPX for ocean alkalinity enhancement provide a model comparison.

Focusing on not only warming but also acidification and deoxygenation, the research aims to compare the theoretical deployment of these techniques in an emission-driven overshoot scenario (SSP5-3.4).To encompass uncertainty due to model parameters, we analyzed a perturbed parameter ensemble constrained by observations. Preliminary findings indicate that both techniques show promise in mitigating atmospheric CO2 concentrations, with variations in their effects on climate and oceanic conditions. Both techniques show small cooling potential despite the large-scale theoretical deployment. While they do not provide an alternative to emission reductions, they could be beneficial in combating other human-induced stressors in the marine ecosystem. Both techniques demonstrate a potential to counteract ocean acidification, but we find that macroalgae farming and sinking contributes to localized deoxygenation.

This study contributes to the ongoing discourse on so-called ‘nature-based’ solutions for climate change mitigation by offering a nuanced evaluation of the theoretical upper potential in multiple mitigation dimensions as well as side effects of ocean alkalinity enhancement and macroalgae farming and sinking. The outcomes aim to inform future research directions and decision-making processes towards the development of effective and ecologically sustainable carbon dioxide removal strategies.

How to cite: Tran, G., Jeltsch-Thömmes, A., Keller, D., Oschlies, A., and Joos, F.: Assessing the Mitigation Potential and Ecological Impacts of Carbon Dioxide Removal Technologies on Ocean Ecosystems, EGU General Assembly 2024, Vienna, Austria, 14–19 Apr 2024, EGU24-15549, https://doi.org/10.5194/egusphere-egu24-15549, 2024.

EGU24-15887 | ECS | Orals | OS3.5

Experimental studies on the stability of bicarbonate-enriched seawater solutions 

Selene Varliero, Federico Comazzi, Francesco Pietro Campo, Stefano Cappello, Giovanni Cappello, Stefano Caserini, Piero Macchi, and Guido Raos

The deployment of carbon dioxide storage is a challenge that must be overcome in order to reach the net zero emissions objective. Ocean alkalinity enhancement (OEA) is a promising method for removing carbon dioxide from the atmosphere and storing it pemanently in seawater as bicarbonates, with the co-benefit of counteracting ocean acidification. The challenge for future applications is ensuring a stable storage, avoiding adverse side effects on the environment or phenomena that can reduce efficiency, such as degassing of carbon dioxide and precipitation of alkaline minerals.

The work presented in this study investigates the stability of the carbonate system of seawater, after adding alkalinity by two different pathways. One is the simple addition of NaHCO3 to artificial seawater, on a laboratory scale. The other is a test on a more complex system, consisting of a pilot plant that uses natural seawater, CO2 and calcium hydroxide and produces a carbon-enriched solution at the same pH of natural seawater. We suggest safe levels for the increase of alkalinity and considering the dilution of the solution with seawater in natural environments. The results represent important steps towards the achievement of safe and efficient ocean-based carbon storage and OAE.

How to cite: Varliero, S., Comazzi, F., Campo, F. P., Cappello, S., Cappello, G., Caserini, S., Macchi, P., and Raos, G.: Experimental studies on the stability of bicarbonate-enriched seawater solutions, EGU General Assembly 2024, Vienna, Austria, 14–19 Apr 2024, EGU24-15887, https://doi.org/10.5194/egusphere-egu24-15887, 2024.

EGU24-16102 | ECS | Orals | OS3.5

First assessment of the impact of pH equilibrated Ocean Alkanlinity Enhancement technology on marine biota in the Gulf of La Spezia (north-west Italy) 

Davide Calvi, Sara Groppelli, Francesco Campo, Federico Comazzi, Daniela Basso, and Stefano Cappello

Throughout the past decades, the rise of atmospheric carbon dioxide (CO2) levels has been one of the most important global issues. Higher CO2 concentrations contribute to a strengthened greenhouse effect, resulting in elevated temperatures and a severe acidification of the oceans.

Recently, the Intergovernmental Panel on Climate Change (IPCC) highlighted the need to develop CO2 removal approaches, as an essential support to mitigate the ongoing climate change. To this purpose, Negative Emission Technologies (NETs) are capable of extracting CO2 from the atmosphere, keeping it stored in geological reservoirs for long periods.

Among NETs, Limenet s.r.l. is proposing a pH equilibrated Ocean Alkalinity Enhancement (OAE) process which involves the permanent storage of carbon dioxide in seawater in the form of bicarbonates using calcium hydroxide and releasing a carbon enriched solution at the same pH of natural seawater. The life cycle assessment conducted on this process demonstrated that the advantages of CO2 capture and storage outweigh the greenhouse gas emissions produced by the entire process.

Although this technology is economically promising and the chemical analysis has shown that CO2 stored in the form of bicarbonates in the seawater is quite stable, it’s necessary to assess any possible impact of the pH equilibrated OAE on marine organisms. In light of this, the aims of this project are:

1) To assess the short-term response of the biota after the treatment.

2) To study the effects of a prolonged exposure to the treated water on planktonic and benthic communities through mesocosms experimentation.

All experiments are conducted in the Gulf of La Spezia (North-West Italy).

How to cite: Calvi, D., Groppelli, S., Campo, F., Comazzi, F., Basso, D., and Cappello, S.: First assessment of the impact of pH equilibrated Ocean Alkanlinity Enhancement technology on marine biota in the Gulf of La Spezia (north-west Italy), EGU General Assembly 2024, Vienna, Austria, 14–19 Apr 2024, EGU24-16102, https://doi.org/10.5194/egusphere-egu24-16102, 2024.

EGU24-17408 | Posters on site | OS3.5

Reactive transport modeling of the effects of seafloor sediment hydrodynamics on ocean alkalinization 

Murugan Ramasamy, Thorben Amann, and Nils Moosdorf

Coastal environments are pivotal in the global carbon cycle. Introducing alkaline materials, like olivine-rich rocks, for enhanced weathering and ocean alkalinity enhancement (OAE) holds promise for atmospheric carbon sequestration. Material weathering is incomplete in the water column but occurs significantly after deposition on the ground. This study elucidates the intricate geochemical processes that occur after deposition of the introduced olivine along coastal seabeds, focusing on the impact of mixing zones between terrestrial groundwater and saltwater in the sediment. These zones, where diverse water compositions converge, may promote rock dissolution, influencing OAE. The collective interaction of these factors with OAE remains insufficiently explored. 
Utilizing a 2D modeling approach with FEFLOW coupled with piChem software, our research comprehensively simulates dynamic coastal systems. The model, incorporating multi-component transport, assesses factors like flow rates, groundwater and seawater composition, alkaline material concentration, and sediment permeability, impacting carbon sequestration efficacy. Results showcase olivine settling dynamics, revealing varying times for different-sized grains to reach the seafloor. Notably, 10 µm olivine grains take about a month to settle in 1000 m water depth, while 100 µm grains settle within days. Preliminary findings highlight substantial mineral weathering on the seafloor, emphasizing hydrological conditions' significant influence. Discussions focus the implications of alkalinity transfer into the sediment, crucial for understanding overall process efficiency. This ongoing research emphasizes the need for a holistic understanding of geochemical dynamics in coastal environments to optimize carbon sequestration through OAE.

How to cite: Ramasamy, M., Amann, T., and Moosdorf, N.: Reactive transport modeling of the effects of seafloor sediment hydrodynamics on ocean alkalinization, EGU General Assembly 2024, Vienna, Austria, 14–19 Apr 2024, EGU24-17408, https://doi.org/10.5194/egusphere-egu24-17408, 2024.

EGU24-18243 | ECS | Posters on site | OS3.5

Seasonal Variability in the Ocean Carbonate System under Ocean Alkalinity Enhancement  

Sandy Avrutin, Andreas Oschlies, and David Keller

Limiting global warming to 1.5°C requires comprehensive strategies that combine robust reductions in emissions with carbon dioxide removal techniques, such as ocean alkalinity enhancement (OAE). Ensuring effective implementation of OAE requires a thorough framework for monitoring, reporting, and verification (MRV). However, the natural variability of partial pressure of carbon dioxide (pCO2) in the ocean overshadows the changes anticipated from OAE (Ho et al. 2023), and seasonal variability is expected to escalate with ongoing warming (Gallego et al. 2018). This presents a challenge for MRV, and highlights the need to dissect the influences of both warming and OAE on seasonal carbonate chemistry, particularly in areas undergoing OAE. We examine how OAE alters the amplitude of these seasonal shifts compared to a control scenario with no OAE. Using an Earth System Model (FOCI; Matthes et al. 2020; Chien et al. 2022), We compare the impact on seasonal dynamics of CO2 flux, pCO2, pH, Alkalinity, and Dissolved Inorganic Carbon (DIC) when OAE is implemented in coastal areas vs open ocean and regions of upwelling vs regions of downwelling, with background emissions following either SSP126 or SSP370. In an example of uniformly and continuously deployed OAE on the European coastline, there is a reduction in the seasonal variance of ocean carbonate chemistry in comparison to the baseline, in both scenarios, for alkalinity, DIC, pH and fCO2. The amplitude in the seasonal cycle of air-sea CO2 flux is greater when OAE is implemented (66% difference between baseline and OAE scenarios by 2100 following SSP126, 60% following SSP370). Outside of the region where OAE is implemented, there is minimal difference on the amplitude of seasonal fluctuations in CO2 flux between the baseline and OAE scenarios, implying that in this case, the impacts of OAE are not far-reaching. This has important implications for MRV and national accounting strategies, with influx of CO2(and therefore air-sea flux) being one way of providing the basis to calculate carbon credits for OAE deployment (Bach et al. 2023).

David T. Ho et al. (2023). Monitoring, reporting, and verification for ocean alkalinity enhancement (A. Oschlies, A. Stevenson, L. T. Bach, K. Fennel, R. E. M. Rickaby, T. Satterfield, R. Webb, & J.-P. Gattuso, Eds.). https://doi.org/10.5194/sp-2-oae2023

Angeles Gallego et al. (2018). Drivers of future seasonal cycle changes in oceanic pCO2. Biogeosciences, 15(17), 5315–5327. https://doi.org/10.5194/bg-15-5315-2018

Matthes, K., et al. (2020). The Flexible Ocean and Climate Infrastructure version 1 (FOCI1): Mean state and variability. Geoscientific Model Development, 13(6), 2533–2568. https://doi.org/10.5194/gmd-13-2533-2020

Chien, C. te et al. (2022). FOCI-MOPS v1 - integration of marine biogeochemistry within the Flexible Ocean and Climate Infrastructure version 1 (FOCI 1) Earth system model. Geoscientific Model Development, 15(15), 5987–6024. https://doi.org/10.5194/gmd-15-5987-2022

Bach, L. T. et al. (2023). Toward a consensus framework to evaluate air–sea CO2 equilibration for marine CO2 removal. Limnology And Oceanography Letters, 8(5), 685–691. https://doi.org/10.1002/lol2.10330

How to cite: Avrutin, S., Oschlies, A., and Keller, D.: Seasonal Variability in the Ocean Carbonate System under Ocean Alkalinity Enhancement , EGU General Assembly 2024, Vienna, Austria, 14–19 Apr 2024, EGU24-18243, https://doi.org/10.5194/egusphere-egu24-18243, 2024.

EGU24-18363 | Orals | OS3.5

CO2 Removal Potential of Two Ocean-based NETs in Earth System Models in a Realistic Deployment Scenario 

Tommi Bergman, Timothée Bourgeois, Jörg Schwinger, Spyros Foteinis, Phil Renforth, Miriam Seifert, Judith Hauck, David Keller, Helene Muri, and Antti-Ilari Partanen

Negative emission technologies (NETs) are an integral part of most climate change mitigation scenarios limiting global warming to 1.5 °C above pre-industrial levels. Several different NETs have been proposed, including ocean alkalinization and direct CO2 removal which have been considered as methods with high carbon removal potential. In ocean alkalinization partial pressure of CO2 sea surface is reduced by spreading alkaline material and in direct removal of CO2 it is extracted from sea water and transported to permanent reservoir. To date, most studies on ocean-based NETs with Earth System Models have been
 based on idealized scenarios where atmospheric carbon is either simply removed by prescribed amount or some NET is deployed at magnitudes that would be extremely challenging to reach if any economic, technical, or political constraints were considered.

In this work, we present Earth System Model simulations using a more realistic global deployment scenario for ocean alkalinization with CaO dispersed at ocean surface in the exclusive economic zones of US, Europe, and China. The dispersion scenario is based on current excess capacities in the lime and cement industries in these three regions, and high-end projections on how they could evolve until 2100. We use the high-overshoot SSP5-3.4-OS as the socioeconomic background scenario. We simulate the deployment scenarios with several Earth System Models. We will show results from simulations with alkalinity enhancement deployment initiated in 2030 and 2040. Furthermore, we compare these results with simulations of direct removal of CO2. Here, the direct removal is calculated from the added alkalinity using approximation for CO2 uptake factor using the relation between alkalinity and dissolved inorganic carbon.

The results show that the CO2 is being removed from the atmosphere to oceans after the alkalinity deployment. Compared to the control simulation the global CO2 concentration is reduced by about 7 ppm in the deployment scenario starting in 2030 and about 4 ppm in the deployment scenario starting 2040 by end of the century. For real life deployment the efficacy and detectability of the alkalinity enhancement is a major concern. We will show that the temperature change in the earlier deployment scenario (higher removal potential) cannot be distinguished from the annual variability illustrating the problem in detectability. Furthermore, the simulations show the deployment must be constrained in regions with low oceanic transport to inhibit the precipitation of CaCO3 to retain the CO2 removal potential.

Using a more realistic scenario for ocean alkalinization we can give a more realistic assessment of its climate effects and explore new research questions such as detectability of local changes in pH or carbon fluxes with slowly increasing deployment rates. In the realistic deployment scenario, ocean alkalinization decreases the CO2 concentration but does not produce a large signal in the temperature. Therefore, this method can be seen as having potential but its role in removing carbon from the atmosphere is limited, according to these scenarios. Furthermore, the wider effects on the Earth system still require more analysis.

How to cite: Bergman, T., Bourgeois, T., Schwinger, J., Foteinis, S., Renforth, P., Seifert, M., Hauck, J., Keller, D., Muri, H., and Partanen, A.-I.: CO2 Removal Potential of Two Ocean-based NETs in Earth System Models in a Realistic Deployment Scenario, EGU General Assembly 2024, Vienna, Austria, 14–19 Apr 2024, EGU24-18363, https://doi.org/10.5194/egusphere-egu24-18363, 2024.

EGU24-18538 | Orals | OS3.5

Ocean liming in the oligotrophic Eastern Mediterranean: impact on the planktonic microbial food web 

Paraskevi Pitta, Iordanis Magiopoulos, Filomena Romano, Anastasia Tsiola, Christos Chantzaras, Jose Gonzalez, Pablo Serret, Silvia Valsecchi, Selene Varliero, Daniela Basso, Arianna Azzellino, Eleonora Barbaccia, Claudia Traboni, Ariadna C. Nocera, Justine Courboules, and Manolis Tsapakis

Ocean Alkalinity Enhancement (OAE) allows for active removal of atmospheric CO2, therefore is considered as one of the most promising Carbon Dioxide Removal (CDR) technologies. OAE could be obtained by discharging alkaline material in the wake of ships, however very little is known on potential negative effects on marine communities. We report here the first study focusing on the response of the entire pelagic microbial food web to the addition of calcium hydroxide in real oligotrophic conditions. In a mesocosm experiment performed at the CretaCosmos facility in Crete, Greece, in May-June 2023, we tested the response of the eastern Mediterranean oligotrophic waters to two different treatments of calcium hydroxide slurry addition (SL; High and Low concentrations, three replicate mesocosms each), while three more mesocosms served as Controls (no addition). Mesocosms, filled with natural coastal seawater, were treated with slurry on days 1, 3, 5, 7, 9, 11 to simulate the chronic disturbance, expected from repeated discharge of SL from ships; while the possible precipitation of carbonate crystals was assessed by putting a sediment trap at the bottom of each mesocosm. The carbonate-equilibrium and dissolution-kinetics were monitored by measuring temperature, solution-conductivity, and changes in pH. Photosynthetically-Active-Radiation and visible light were monitored by sensors in each mesocosm. Plankton productions (bacterial, viral, secondary) as well as community composition of all plankton groups from viruses to copepods were assessed by optical microscopy, flow cytometry and metagenomics; chlorophyll was also measured. Although an important alteration of pH was observed in the High lime addition, only heterotrophic bacteria production was found to be negatively affected and only in the second half of the experiment. The rest of the plankton groups presented different patterns and not a clear response to the lime addition. This first attempt to study the effect of lime addition on the complex pelagic food web will serve as a first step to an extensive testing needed before any application of ocean liming at a large scale.

How to cite: Pitta, P., Magiopoulos, I., Romano, F., Tsiola, A., Chantzaras, C., Gonzalez, J., Serret, P., Valsecchi, S., Varliero, S., Basso, D., Azzellino, A., Barbaccia, E., Traboni, C., Nocera, A. C., Courboules, J., and Tsapakis, M.: Ocean liming in the oligotrophic Eastern Mediterranean: impact on the planktonic microbial food web, EGU General Assembly 2024, Vienna, Austria, 14–19 Apr 2024, EGU24-18538, https://doi.org/10.5194/egusphere-egu24-18538, 2024.

EGU24-20226 | Posters on site | OS3.5

On the emission-scenario dependence of the efficiency of ocean alkalinity enhancement 

Jörg Schwinger, Timothée Bourgeois, and Wilfried Rickels

Ocean alkalinity enhancement (OAE) deliberately modifies the chemistry of the surface ocean to enhance the uptake of atmospheric CO2. Although it is known that the efficiency of OAE (the amount of CO2 sequestered per unit of alkalinity added) depends on the chemical background state of the surface ocean, the consequences of this dependency for simulated OAE scenarios have never been systematically explored. Here we show, using idealized and scenario simulations with an Earth system model (ESM), that under quadrupling of pre-industrial atmospheric CO2 concentrations, the simulated efficiency of OAE increases by about 30% from 0.76 to 0.98. We find that only half of this effect can be explained by changes in the sensitivity of CO2 sequestration to alkalinity addition itself. The remainder is due to the larger portion of anthropogenic emissions taken up by a high alkalinity ocean. Importantly, both effects are reversed if atmospheric CO2 concentrations were to decline due to large scale deployment of land-based (or alternative ocean-based) carbon dioxide removal (CDR) methods. By considering an overshoot pathway that relies on large amounts of land-based CDR, we demonstrate that OAE efficiency indeed shows a strong decline after atmospheric CO2 concentrations have peaked. Our results imply that methodological choices must be made if carbon credits for OAE are to be allocated based on simulated efficiencies.

How to cite: Schwinger, J., Bourgeois, T., and Rickels, W.: On the emission-scenario dependence of the efficiency of ocean alkalinity enhancement, EGU General Assembly 2024, Vienna, Austria, 14–19 Apr 2024, EGU24-20226, https://doi.org/10.5194/egusphere-egu24-20226, 2024.

EGU24-369 | ECS | Posters on site | ERE4.8 | Highlight

Potential lithium enrichment in pyrites from organic-rich shales 

Shailee Bhattacharya, Michael C. Dix, Shikha Sharma, Albert S. Wylie, and Tom Wagner

In order to meet the technological needs of the energy transition, batteries of all scales, particularly those that power electrical vehicles, have become increasingly important. Lithium-ion batteries are in wide use at present, and continued research to improve them has been a focus of energy engineering. This, in turn, has greatly increased the demand for lithium (Li) as a natural resource. While the primary ores of Li (pegmatite, salar brine, and volcanic-associated clay) are generally well-understood, it would be desirable to identify additional Li sources that could be safely and economically exploited. Using material from previous industrial operations (e.g., mine tailings or drill cuttings) as a source of additional Li would be attractive as it would generate little or no new waste material.

Our study was carried out on 15 Devonian shale samples of varying organic richness from wells drilled in the Appalachian basin (USA). Sequential extraction of the samples was performed to measure Li recovery from targeted rock-forming phases, namely the carbonates, Fe-Mn oxyhydroxides, pyrites, and organic matter. The mineralogy of the post-leaching residue was found to be dominated by silicates and anatase, suggesting the target phases were successfully leached out of the whole rock.

Unsurprisingly, the data shows higher whole-rock Li values are observed in samples with a higher total clay content. The lowest whole-rock Li contents correspond to samples having higher contents of total organic carbon (TOC) and pyrite. Unexpectedly, however, samples with relatively lower Li contents (22 ppm) can liberate up to 54% of the total lithium from pyrite alone. Furthermore, we observe a positive correlation between pyrite content and %Li recovery in the pyrite leachate (r2= 0.732). These initial findings suggest that pyrite in conjunction with organic matter may play a previously unrecognized role in the Li distribution in organic-rich shales. The geochemical processes that might cause Li enrichments associated with pyrite are not well-understood. However, since Li mobility is highly sensitive to small increases in temperature, the very high thermal maturation of the studied shale sequence may have significantly impacted Li remobilization during the smectite-to-illite clay-mineral transformation. The common Li-mineral that can coexist with different phases of FeS is Li2S at temperatures ⩽ 75°C – 135°C. Several reaction mechanisms have been proposed, but there is little known about the rate kinetics and reaction steps involved in Li association with pyrite in shales.

This study suggests the possibility that some Li may be sequestered in pyrite in organic-rich shales. As pyrite is a common mineral in the Appalachian Basin, this has implications for exploiting shale pyrite in the Devonian sequence if the Li proves economically extractable. Drill cuttings from past and current oil and gas operations are a ready material upon which to test the feasibility of this concept.

How to cite: Bhattacharya, S., Dix, M. C., Sharma, S., Wylie, A. S., and Wagner, T.: Potential lithium enrichment in pyrites from organic-rich shales, EGU General Assembly 2024, Vienna, Austria, 14–19 Apr 2024, EGU24-369, https://doi.org/10.5194/egusphere-egu24-369, 2024.

EGU24-3754 | Posters on site | ERE4.8

Evaluating the potential source of contamination from sulfide minerals in major rocks in South Korea 

Gil-Jae Yim, Seung-Jun Youm, Hyeop-Jo Han, Seon-Yong Lee, and Jin-Young Lee

The utilization of surrounding rocks is required in human living areas, and these development activities create large cut slopes and generate large amounts of cut rocks as construction materials. If these development areas are strata containing sulfide minerals (pyrite, etc.), contamination may occur, causing environmental pollution problems in the development site and surrounding areas. Several methods have been studied for the preliminary identification of potentially contaminated rocks, including Acid Base Accounting (ABA), Modified ABA procedures, Carbonate Neutralization Potential determinations, Humidity cell tests, Column tests, Batch reactor (Shake flask) tests, and Field tests (Orava, 1997; USEPA and Hardrock Mining, 2003). Studies on rock samples have resulted in most of the samples being classified as Non-Acid Forming (NAF), with some samples containing sulfide minerals (such as pyrite) being classified as Potentially Acid Forming (PAF). It can be expected that future development of these rocky areas may affect the surrounding environment or rock utilization. Therefore, these rock areas are considered to be in need of management. It would be desirable to investigate the occurrence of pollution sources caused by mineral sulfides in advance and take appropriate countermeasures. It is expected to reduce the economic losses that may occur in the future, and it is judged that the pollution problem of the surrounding environment can be further reduced.

How to cite: Yim, G.-J., Youm, S.-J., Han, H.-J., Lee, S.-Y., and Lee, J.-Y.: Evaluating the potential source of contamination from sulfide minerals in major rocks in South Korea, EGU General Assembly 2024, Vienna, Austria, 14–19 Apr 2024, EGU24-3754, https://doi.org/10.5194/egusphere-egu24-3754, 2024.

The assessment in accordance with the Water Framework Directive and the EU Water Framework Directive continues to show poor chemical status for around one third of groundwater bodies in Germany due to excessive nitrate concentrations. In many regions, this is due to high nitrogen fertiliser intensities that have been applied to agricultural land for decades.

Nitrate input and degradation processes in aquifers are modelled using step-by-step hydrogeochemical continuous stirred tank reactors (CSTR) sequences with PHREEQC. This makes it possible to show how the overall water quality is characterised by the interaction of hydrogeochemical sub-processes such as nitrogen and lime fertilisation, substance releases from grassland ploughing, denitrification via organic carbon (heterotrophic degradation) and most importantly pyrite (lithotrophic degradation) and sulphate reduction, but also nitrate breakthroughs and well clogging.

CSTR models are not discretised spatially or temporally; their focus is on identifying and quantifying the relevant hydrogeochemical reactions. The advantage of this method is much shorter and more manageable calculation times than with fully coupled reactive transport models. They provide the user with a comprehensive hydrogeochemical understanding of nitrate degradation by pyrite oxidation processes in groundwater. In addition to reaction kinetic aspects, this also includes the effects of a loss of nitrate degradation capacity [1]. In the focus is the dissolution of pyrite and its re-precipitation and a reaction front developing into the system [2]. Moreover, concentrations of pyrite dissolution products (iron, sulphate, trace metals) can be understood.

Hydrogeochemical modelling in this sense is initially retrospectively oriented based on measurements and the longest possible time series. However, a hydrogeochemical CSTR sequence has been checked for plausibility and validated with sensitivity and parameter studies can then also be used to forecast water quality [3]. This provides a "tool" with which the effects of anthropogenic interventions in a geosystem can be calculated with regard to the effects on groundwater and raw water quality.


[1] Wilde, S., Hansen, C. & Bergmann, A. Nachlassender Nitratabbau im Grundwasser und deren Folgen – abgestufte modellgestützte Bewertungsansätze. Grundwasser 22, 293–308 (2017). https://doi.org/10.1007/s00767-017-0373-0

[2] Kübeck, C., Hansen, C., König, C. et al. Ableitung der Reaktivität von organisch gebundenem Kohlenstoff in redoxzonierten Grundwasserleitern – Hydrogeochemische Modellierung kinetisch angetriebener Reaktionssysteme. Grundwasser 15, 103–112 (2010). https://doi.org/10.1007/s00767-009-0136-7

[3] Jesußek, A., Hansen, C. & Wilde, S. Identifikation und Regionalisierung von Nitratabbauprozessen in einem Grundwasserleiter – Möglichkeiten und Nutzen für die Wassergewinnung. Grundwasser 21, 333–344 (2016). https://doi.org/10.1007/s00767-016-0337-9

How to cite: Hansen, C. and Kühn, M.: Pyrite and its role in the development of nitrate pollution and raw water quality in water catchment areas, EGU General Assembly 2024, Vienna, Austria, 14–19 Apr 2024, EGU24-5822, https://doi.org/10.5194/egusphere-egu24-5822, 2024.

EGU24-6083 | ECS | Posters on site | ERE4.8

Pyrite-based trace element fingerprints for methane and oil seepage 

Daniel Smrzka, Zhiyong Lin, Patrick Monien, Wolfgang Bach, Jörn Peckmann, and Gerhard Bohrmann

Pyrite forms at marine hydrocarbon seeps as the result of the microbial oxidation of methane, organic matter, and crude oil coupled to sulphate reduction. Redox sensitive and nutrient trace elements in pyrite may hold valuable information on present and past seepage events, the evolution of fluid composition, as well as the presence of heavy hydrocarbon compounds from crude oil. This study uses the trace element compositions of pyrite that formed at methane seeps and crude oil-dominated seeps to constrain element mobilities during the sulphate reduction processes, and to which degree specific trace elements are captured by pyrite. Pyrite forming at oil seeps shows high Mn/Fe ratios and high Mo content compared to pyrite from methane seeps. These patterns suggest either more intense or persistent sulphidic conditions, or an intensified manganese (oxy)hydroxide shuttle process at oil seeps. Copper and Zn are enriched in oil seepage-derived pyrite while Ni and V enrichment is less pronounced, suggesting either a selective uptake of specific elements by pyrite, or varying trace element compositions of organic compounds oxidized via microbial reduction.   

How to cite: Smrzka, D., Lin, Z., Monien, P., Bach, W., Peckmann, J., and Bohrmann, G.: Pyrite-based trace element fingerprints for methane and oil seepage, EGU General Assembly 2024, Vienna, Austria, 14–19 Apr 2024, EGU24-6083, https://doi.org/10.5194/egusphere-egu24-6083, 2024.

EGU24-8617 | ECS | Orals | ERE4.8

What can we learn from pyrite about the hydrogeology of argillaceous formations? 

Marie Bonitz, Theresa Hennig, Anja Schleicher, Christof Kusebauch, David Jaeggi, and Michael Kühn

Argillaceous rock formations provide favourable properties to act as geological barriers for the disposal of high-level radioactive waste. Opalinus Clay is the chosen host rock in Switzerland and is also being considered in Germany. Pyrite is an ubiquitous mineral found in most argillaceous rock formations, and is also present in the Opalinus Clay and its adjacent units. For the long-term integrity of the disposal site, temporally and spatially stable geochemical conditions are essential. Pyrite might be one essential indicator how the sediment formation is influenced by surrounding aquifers. The appearance and composition of pyrite has been used to investigate different geological processes, such as depositional and diagenetic settings, paleoredox conditions and enrichment processes. The geochemical and mineralogical changes in rock formations provide information about processes in the past, and thus enable an assessment for the future. In this context the detailed analysis of pyrite might be a useful tool.

In May 2023, two boreholes were drilled (15 and 25 m deep) in the Mont Terri underground laboratory to investigate the water-bearing members of the Staffelegg Formation (Toarcian-Sinemurian) underlying the Opalinus Clay (Toarcian). The focus was hereby on the transition zones between the permeable and non-permeable rocks to detect alteration reactions and mobilisation processes. In addition to the analysis of the bulk mineralogy and geochemistry, pathways of groundwater and fracture zones have been investigated by analysing thick sections with X-ray and microscopic methods.

Two groundwater paths have been identified in the Staffelegg Formation with fracture zones and their fillings. Calcite and barite are distinguishable and represent two generations, revealing a change of the groundwater composition with supersaturation at different points in time. Therefore, the hydrogeological system experienced at least two events of advective transport. The analysis of pyrite addresses the question to which extent these events have altered and infiltrated the formations.

Pyrite has been formed diagenetically and potentially syngenetically and is present in varying morphologies: μm- to cm-sized euhedral crystals, framboids and nodules. The size and morphology of diagenetic pyrites provide information about the transport processes in the sediment. Euhedral crystals are found in diffusion dominated systems. Accumulations of microcrystals reflect conditions providing an initial nucleation burst, but further crystal growth is limited by restricted supply of Fe and S as it occurs in diffusion-limited regimes with minor advection. Nodules can form in gently advective or stagnant systems with good nutrient supply. The types of pyrite close to fractures and transition zones is used to characterize the predominant transport process at this position.

Diagenetic carbonates and sulphide or sulphate minerals control the concentration of major cations, and redox reactions. Therefore, they provide information about the succession of processes from deposition, to diagenesis, mobilisation and alteration. Their analysis has the potential to assess the long-term integrity of the Opalinus Clay as a host rock and the surrounding formations. The gained understanding of the hydrogeological influence on the geochemical conditions is to be transferred to other potential disposal sites in argillaceous formations.

How to cite: Bonitz, M., Hennig, T., Schleicher, A., Kusebauch, C., Jaeggi, D., and Kühn, M.: What can we learn from pyrite about the hydrogeology of argillaceous formations?, EGU General Assembly 2024, Vienna, Austria, 14–19 Apr 2024, EGU24-8617, https://doi.org/10.5194/egusphere-egu24-8617, 2024.

EGU24-9060 | Orals | ERE4.8

Quantifying key drivers of marine pyrite content and isotopic composition 

Jordon Hemingway, Cornelia Mertens, and Sarah Paradis

Microbial sulfate reduction (MSR) and subsequent pyrite burial in marine sediments plays a crucial role in Earth’s long-term carbon and oxygen budgets; by reducing sulfate and producing alkalinity, this process effectively increases atmospheric O2 and lowers CO2 levels. Given that MSR exhibits a large and reduction-rate-dependent sulfur-isotope fractionation, changes in pyrite sulfur-isotope compositions (δ34S values) through geologic time have long been interpreted to reflect global signals such as marine sulfate reduction rates, microbial community behavior, and the amount of sulfur buried as pyrite vs. evaporite minerals. However, recent research has demonstrated that marine MSR fractionation likely operates near an equilibrium limit regardless of reduction rate. These studies instead implicate local environmental and sedimentological factors as drivers of pyrite δ34S values. Despite this advancement, the sensitivity of pyrite formation rate and δ34S value to changes in environmental and sedimentological variables—both today and through geologic time—remains unconstrained due to the complex interactions between controlling variables.

To provide mechanistic and quantitative constraints, we developed and applied a non-dimensional diagenetic model that extracts the natural variables governing pyrite formation. Assuming equilibrium MSR isotope fractionation and using only locally measured or globally interpolated boundary values as inputs (i.e., no free parameters), our model accurately predicts all available modern observations (n = 216 cores) with an average root-mean square error of 0.3 wt % for pyrite content and 16.5 ‰ for δ34S. Extrapolating this result, we estimate global pyrite burial flux to be ~1.3 × 10¹² mol FeS2 yr−1 with a weighted-average δ34S value of ~-21 ‰ VCDT.This flux is statistically identical to independent estimates of total riverine sulfate input (i.e., pyrite-oxidation and evaporite-dissolution derived), indicating the sulfur cycle currently operates in steady state. However, calculated pyrite burial exceeds pyrite-oxidation derived inputs, suggesting net atmospheric O2 release and CO2 consumption by the sulfur cycle.

Mechanistically, we conclude that pyrite formation rate is highly sensitive to local reactive iron input, whereas δ34S value is primarily controlled by organic carbon reactivity-to-sedimentation rate ratio (termed Da*, a modified Damköhler number) and organic carbon-to-sulfate ratio (termed Γ0). In contrast to previous models, we show that pyrite δ34S is largely insensitive to bioturbation due to counter-balancing impacts on Da* and Γ0. Rather, when combined with a geologic pyrite δ34S record, our interpretation requires an increase in Da* and decrease in Γ0 since the Paleozoic, possibly driven by changing organic matter reactivity and sulfate concentration through geologic time.

How to cite: Hemingway, J., Mertens, C., and Paradis, S.: Quantifying key drivers of marine pyrite content and isotopic composition, EGU General Assembly 2024, Vienna, Austria, 14–19 Apr 2024, EGU24-9060, https://doi.org/10.5194/egusphere-egu24-9060, 2024.

EGU24-14930 | ECS | Posters on site | ERE4.8 | Highlight

Microbial Pyrite Oxidation and Chemical Weathering to a Typhoon Precipitation and Discharge Event in Taiwan 

Jui-Ming Chang, I-Feng Wu, Li-Hung Lin, Aaron Bufe, Pei-Ling Wang, Hsi-Ling Chou, Niels Hovius, and Tung-Chou Hsieh

Microbially mediated pyrite oxidation is considered a crucial element of the global weathering engine. However, observations of bacterial pyrite oxidation in nature remain scarce due to limited field sampling, particularly during typhoon precipitation and discharge events. In this study, we present a time series of water chemistry at three-hour intervals from the Sinwulyu River, southeast Taiwan, across the typhoons Nesat (0-27th hours) and Haitung (30th-60th hours) in 2017. The cumulative precipitation for the two typhoons ranged from 18 to 78 mm and 59 to 227 mm in the catchment, resulting in discharge increases from 6 to 122 c.m.s. and 53 to 1,207 c.m.s. at the catchment's outlet. The Sinwulyu River drains a catchment underlain by metamorphosed passive-margin sediments that are rapidly exhuming. Integrating measurements of major ions, δDH2O, δ18OH2O, δ34SSO4, δ18OSO4, and simulations of discharge, we find dynamic changes in the source of solutes to the stream water across the typhoons. Our findings indicate that all chemical solutes experienced dilution by 30-80% during typhoon discharge. δDH2O and δ18OH2O values were more negative with increasing discharge, suggesting that the discharge is driven by a combination of precipitation and groundwater injection into the river. δ34SSO4 and  δ18OSO4 ranged from -3.9 ‰ to -7.1 ‰ and from -1.9 ‰ to -6.5 ‰, respectively, suggesting that the majority of riverine sulfate is sourced from oxidative weathering of pyrite. In addition to variations of the water chemistry, we also found substantial changes in the concentrations of sulphur-oxidizing bacteria, Thiobacillus and, Sulfuricurvum (anaerobic microorganisms) emerged as the dominant genera during typhoons. The peak concentration of Thiobacillus occurred at the first typhoon at the 27th hour (1.17×10⁷ copies/L), while Sulfuricurvum peaked at the 48th hour during the second typhoon (2 hours before peak discharge) with a concentration of 2.32×10⁸ copies/L, coinciding high ranges of sediment concentrations and representing 241 and 1,570 times the background level before typhoons, respectively. Both peak concentrations were sudden appearances, indicating that some pools of concentrated microorganisms were quickly depleted by typhoon precipitation/discharge. Notably, the highest abundance of Sulfuricurvum coincided with an increase in chemical solutes. As the discharge rose from 714 to 1,092 c.m.s. (45-48th hour), the concentration of sulfuricurvum increased around tenfold, coupled with an 8%, 7%, and 7% increase in the concentrations of SO4-2, Ca+2, and Mg+2, respectively. However, other chemical solutes maintained a similar concentration. These observations suggest the typhoon mobilized a specific reservoir of elevated pyrite oxidation for carbonate weathering under anaerobic conditions. Through discharge simulation, the high concentration of solute and Sulfuricurvum mobilized substantially at hourly precipitation rates of over 20 mm/hr. We propose that an ample amount of precipitation is essential to flush out the previously inaccessible pool with anaerobic bacterial pyrite oxidation and subsequent carbonate weathering in the stream.

How to cite: Chang, J.-M., Wu, I.-F., Lin, L.-H., Bufe, A., Wang, P.-L., Chou, H.-L., Hovius, N., and Hsieh, T.-C.: Microbial Pyrite Oxidation and Chemical Weathering to a Typhoon Precipitation and Discharge Event in Taiwan, EGU General Assembly 2024, Vienna, Austria, 14–19 Apr 2024, EGU24-14930, https://doi.org/10.5194/egusphere-egu24-14930, 2024.

EGU24-15524 | ECS | Orals | ERE4.8

Pyrite trace element proxies for magmatic volatile influx in submarine subduction-related hydrothermal systems 

Jan J. Falkenberg, Manuel Keith, Karsten M. Haase, Reiner Klemd, Martin Kutzschbach, Anna Grosche, Maria Rosa Scicchitano, Harald Strauss, and Jonguk Kim

Seafloor massive sulfides represent modern analogues to ancient volcanogenic massive sulfide deposits, which can be particularly enriched in volatile and precious metals (e.g., Te, Au, Ag, Cu, Bi, Se) in subduction-related systems. However, it remains unclear whether the influx of magmatic volatiles has a systematic control on the metal endowment of submarine hydrothermal mineralization on the plate-tectonic scale. Using a novel microanalytical approach based on the coupling of SIMS δ34S with trace element LA-ICP-MS on a scale of ~25 µm in pyrite from 11 submarine hydrothermal systems, we could demonstrate for the first time that the Te, As, and Sb contents and the ratios of these elements vary systematically with the δ34S composition of hydrothermal pyrite and native S. In contrast to trace element concentrations, Te/As and Te/Sb show a more significant correlation with δ34S in pyrite, indicating that element ratios provide a more robust record of metal sourcing. On this basis, we define a quantitative trace element threshold of high Te/As (>0.004) and Te/Sb (>0.6) ratios in pyrite that can be used to identify the influx of magmatic volatiles to submarine subduction-related hydrothermal systems independent of δ34S isotope measurements. Two-component fluid mixing simulations further suggest that even small amounts (<0.5 to ~5%) of magmatic volatile influx drastically change the Te/As (and Te/Sb) ratio of the modelled fluid, but only slightly modify its δ34S composition. Hence, Te/As and Te/Sb ratios are more sensitive in recording the influx of magmatic volatiles into submarine hydrothermal systems than S isotope systematics, which are typically influenced by seawater-derived S leading to ambiguous δ34S signatures. We conclude that Te/As and Te/Sb systematics in pyrite provide a robust proxy to evaluate the metal sources in submarine hydrothermal systems from the grain to plate-tectonic scale.

How to cite: Falkenberg, J. J., Keith, M., Haase, K. M., Klemd, R., Kutzschbach, M., Grosche, A., Scicchitano, M. R., Strauss, H., and Kim, J.: Pyrite trace element proxies for magmatic volatile influx in submarine subduction-related hydrothermal systems, EGU General Assembly 2024, Vienna, Austria, 14–19 Apr 2024, EGU24-15524, https://doi.org/10.5194/egusphere-egu24-15524, 2024.

EGU24-15652 | ECS | Orals | ERE4.8

The role of pyrite surface area and thermochemical sulfate reduction in clastic-dominant Zn Deposits.  

Peter Berger, Joseph Magnall, Michael Kühn, and Sarah Gleeson

It is vital to keep up with the demand for critical minerals during the transition to sustainable energy systems. Doing so requires expanding our knowledge of ore depositional processes. Pyrite is a common gangue mineral in clastic dominated (CD) deposits, which are the highest value Zn deposits. In CD-type deposits, pyrite is often part of the pre-, syn-, and post-ore paragenesis and can therefore provide an important redox buffer and potentially a source of sulfur during ore deposition. The distribution of syn-ore pyrite beyond economic mineralization can also form an important mineralogical halo around CD-type deposits.

In this study we investigate the role of fluid interaction with different types of pyrite on ore formation in the Teena deposit (Australia). The host unit for the Teena deposit is an organic rich, variably pyritic, dolomitic siltstone. We created a series of 2D, reactive transport models using the software X2t (Geochemists Workbench) to investigate the role of pyrite surface area as a major control on ore deposition.

Similar to many CD-type deposits, the main type of pre-ore diagenetic pyrite in the host unit is framboidal, which has a high surface area, whereas syn-ore generations of pyrite tend to be coarser grained. In the models, pyrite surface area was varied from 100 (syn-ore) to 10,000 cm2/g (diagenetic). Organic matter provided a drive for thermochemical sulfate reduction (TSR) in the models, and TSR rates were varied over several orders of magnitude in accordance with laboratory measured values.

As the incoming hydrothermal fluid reacted with the host unit, pyrite and dolomite are dissolved and sphalerite is precipitated. The surface area of pyrite evolved as it dissolved and reprecipitated in the form of a more massive, lower surface area, hydrothermal pyrite.

Models using the higher surface area values for diagenetic pyrite resulted in more compact and higher grade ore deposition. The pyrite at the inlet in this scenario dissolved completely. As the pyrite reprecipitated, it formed more extensive halo ahead of the sphalerite reaction front than in models using the lower hydrothermal surface area. Slower rates of TSR also broadened the pyrite halo and decreased the sphalerite ore grade. Low pyrite surface area coupled with low TSR rates resulted in a disseminated deposit. Based on these results, the paragenetic evolution of pyrite over the course of hydrothermal alteration and the resulting changes in surface area are an important control on ore grade and the extent of halo formation.

How to cite: Berger, P., Magnall, J., Kühn, M., and Gleeson, S.: The role of pyrite surface area and thermochemical sulfate reduction in clastic-dominant Zn Deposits. , EGU General Assembly 2024, Vienna, Austria, 14–19 Apr 2024, EGU24-15652, https://doi.org/10.5194/egusphere-egu24-15652, 2024.

EGU24-21083 | Orals | ERE4.8 | Highlight

The shelf life of pyrite - effects of pyrite weathering in exposed continental shelves on global CO2 and O2 

Martin Kölling, Ilham Bouimetarhan, and Matthias Zabel

During times of low sea-levels in glacials there is evidence of large-scale pyrite oxidation on exposed continental shelves. While this process directly reduces atmospheric oxygen levels, acid drainage generated by this reaction increases the release of CO2 through carbonate buffering within the previously marine shelf sediments. Although this scenario is expected to result in negative feedback, sea-level and atmospheric CO2 levels have co-varied throughout most of the last 800 thousand years (ka) for which direct records of CO2 exist. Only during peak glacial conditions with sea-levels as low as 125 m lower than today, CO2 levels have reached an apparent lower limit around 190 ppm independent of decreasing sea-levels. Here we show that pyrite driven release of CO2 and decline of O2 during six of the last nine glacial-interglacial cycles are focussed in 10 ka to 40 ka-long periods preceding glacial terminations.

Using a sea-level driven model of pyrite weathering in drained continental shelves, we demonstrate that repeated sea-level low-stands force pyrite oxidation to ever greater depths. This occurs whenever the duration of an interglacial is insufficient to restock the shelf pyrite inventory through sulphate reduction in the shelf sediments. During the Quaternary, the decreasing amount of pyrite in the exposed shelf sediments represents a discharging 'acid capacitor' (Kölling et al., 2019). This model was inspired by experience from modelling pyrite weathering in open-pit lignite mine overburden material which may be interpreted as a scaled-down model of glacial continental shelf exposure during sea-level low-stands.

If pyrite oxidation forced CO2 release specifically at low sea-levels was sufficient to amplify the orbitally driven climate forcing and trigger glacial terminations, the absence of CO2 release caused by exposed pyrite rather than an astronomically controlled '100 ka pacing' might have extended the length of glacial-interglacial cycles from one to two or three obliquity cycles. Future ocean drilling specifically aiming to recover long cores on shelves could reveal the existence of a 'pyrite gap' that should exist between surficial young pyritic layers and deeper old pyritic sequences with indications of acid leaching.


Kölling, M., Bouimetarhan, I., Bowles, M.W. et al. Consistent CO2 release by pyrite oxidation on continental shelves prior to glacial terminations. Nat. Geosci. 12, 929–934 (2019). https://doi.org/10.1038/s41561-019-0465-9

How to cite: Kölling, M., Bouimetarhan, I., and Zabel, M.: The shelf life of pyrite - effects of pyrite weathering in exposed continental shelves on global CO2 and O2, EGU General Assembly 2024, Vienna, Austria, 14–19 Apr 2024, EGU24-21083, https://doi.org/10.5194/egusphere-egu24-21083, 2024.

The formation of pyrite has been extensively studied because of its abundance in many anoxic environments such as marine and river sediments, groundwater aquifers, and peat lands, and hence its importance in both iron and sulfur cycling. It forms over a wide pH interval, ranging from acidic to alkaline. It is generally regarded that sulfide reacting with iron-containing minerals forms metastable iron sulfide minerals before eventually transforming into pyrite in the presence of different sulfur.

In this contribution, I will discuss the importance of sulfidation of ferric (oxy)hydroxides (FeOOH), i.e. the reaction between aqueous sulfide and the surface of FeOOH, to stimulate pyrite formation and compare this process with other pathways and kinetics of pyrite formation described in the literature. Sulfidation of FeOOH initially leads to formation of surface bound FeS-species and its transformation to pyrite is controlled by either the availability of FeOOH or the supply rate of sulfide. These kinetic constraints define the environments were rapid pyrite formation occurs to be suboxic, rich in FeOOH and shaped by cryptic sulfur cycling. Under these conditions, highly reactive pyrite precursor species are forming that also affect trace metal cycling.

How to cite: Peiffer, S.: Controls on recent pyrite formation in aquatic systems and its relevance for environmental processes, EGU General Assembly 2024, Vienna, Austria, 14–19 Apr 2024, EGU24-21260, https://doi.org/10.5194/egusphere-egu24-21260, 2024.

EGU24-21310 | Posters on site | ERE4.8

Partitioning of trace elements between hydrothermal fluids and pyrite 

Christof Kusebauch, Joseph Michael Magnall, and Sarah Gleeson

Pyrite is the most abundant sulfide on Earth and can host a large variety of trace elements including Au, Co, Mo, Cu, Pb, As, Se, Te, Bi and Sb. Trace element variations in pyrite have been used to study various processes during ore formation, to reconstruct paleo-seawater composition and to understand hydrothermal systems. Furthermore, element enrichment in pyrite can reach high enough concentrations that pyrite itself becomes an ore mineral and can be mined. For example, the enrichment of Au in As-bearing pyrite can reach up to several thousand ppm in the giant Au deposits of the Carlin trend (Nevada, USA). In this case the coupled partitioning of Au and As is considered to be an ore forming process1. The high variability of trace elements in pyrite makes it potentially a powerful tool for the reconstruction of fluid compositions in hydrothermal settings. Nevertheless, the lack of partition coefficients of trace elements between hydrothermal fluids and coexisting/newly forming pyrite hinders a wider use of pyrite as a fluid proxy. Also, the underlying processes controlling the incorporation into the crystal structure and the interplay of different trace elements during partitioning are not well understood.

Here, we present results of hydrothermal batch experiments at 200°C studying the partitioning of Co, Cu, Pb, Se, Bi, As and Sb between aqueous solutions and newly formed pyrite. We use the replacement of siderite to crystalize euhedral pyrites large enough to be measured by LA-ICPMS for their trace element content2. The initial trace element concentration in the experimental fluid varied from 0.1 to 10 ppm. To study the influence of As in pyrite on the D values, As concentration in the experiments was varied independently, whereas all other tracers had a constant ratio. 

Concentrations of trace elements in hydrothermal pyrite range between 10 ppm and 1200 ppm, and depend strongly on the initial fluid composition. Partition coefficients for Sb and Se are in the range of 20-300. Co, Cu, Pb, Bi have lower but more variable D values ranging from 0.1 up to 50. Almost all studied elements show a high compatibility in the pyrite structure, replacing most likely either S (i.e, Se, Sb) or Fe (i.e., Co, Cu, Bi, Pb) in the crystal lattice. Unlike Au, partitioning of studied trace metals is not coupled to the As concentration of newly formed pyrite. Nevertheless, D values of Co, Cu, Se and Sb from experiments with a high concentration of trace elements (i.e., 10 ppm) decrease compared to D values from experiments done at lower concentrations (i.e. 0.1 and 1 ppm). This behavior indicates either a solubility limit of the particular element in the pyrite structure or results from an over-occupation of the potential crystal sites by other trace elements. The partition data from our experiments will help to unlock the potential to use the pyrite composition as a proxy for hydrothermal fluids.      


References:

1 Kusebauch et al., (2019) SciAdvances; 10.1126/sciadv.aav5891

2 Kusebauch et al., (2018) Chemical Geology; 10.1016/j.chemgeo.2018.09.027

How to cite: Kusebauch, C., Magnall, J. M., and Gleeson, S.: Partitioning of trace elements between hydrothermal fluids and pyrite, EGU General Assembly 2024, Vienna, Austria, 14–19 Apr 2024, EGU24-21310, https://doi.org/10.5194/egusphere-egu24-21310, 2024.

EGU24-21650 | ECS | Orals | ERE4.8

Geochemical interactions of Np and Pu with pyrite heterogeneities in Opalinus Clay in the context of deep geological repositories 

Markus Breckheimer, Samer Amayri, Dario Ferreira Sanchez, Daniel Grolimund, and Tobias Reich

The safety case for the final disposal of high-level radioactive waste in a deep geological repository involves a thorough understanding of the geochemical interactions of the potentially mobilized waste inventory with components of a proposed multi-barrier concept.

Argillaceous rock is considered as a potential host rock and final barrier to the biosphere. Opalinus Clay (OPA) from the Mont Terri rock laboratory (St-Ursanne, Switzerland) serves as a reference material for a natural clay rock. As a sedimentary rock and porous medium, OPA exhibits characteristic properties such as a low hydraulic conductivity, limiting the transport of solutes to diffusion, as well as structural and compositional heterogeneities in a range of length scales [1].

To address the influence of the potentially reactive microstructure on solute transport, spatially resolved sorption and diffusion studies of Np(V) and Pu(V,VI) with bulk OPA samples were performed, utilizing synchrotron-based microscopic chemical imaging at the microXAS beamline (Swiss Light Source, Paul Scherrer Institute, Villigen, Switzerland), simultaneously obtaining chemical information about the OPA microstructure as well as the distribution and transport patterns of Np and Pu [2-5].

In these studies, domains of pyrite, contained in OPA to about 1 wt. % as microstructural, Fe(II)-bearing heterogeneities, were identified exhibiting an enhanced reactivity regarding redox transformation and immobilization of the solute species as reduced, predominantly tetravalent and therefore less mobile species.

Further sorption studies with isolated pyrite heterogeneities, extracted from the OPA matrix as sub-100 µm sized particles, indicate a reactivity depending on the morphology of the heterogeneities, including the crystallite size distribution (framboidal) and cementing phase of these pyrite aggregates.

The results of these studies should add to an enhanced understanding of reactive transport in a natural clay rock in the context of a deep geological repository.


References

[1] Nagra (2002). Tech. Ber. 02-03. Projekt Opalinuston. Wettingen, Switzerland.

[2] Fröhlich, D.R., Amayri, S., Drebert, J., Grolimund, D., Huth, J., Kaplan, U., Krause, J. and Reich, T. (2012). Speciation of Np(V) uptake by Opalinus Clay using synchrotron microbeam techniques. Anal. Bioanal. Chem. 404: 2151-2162.

[3] Kaplan, U., Amayri, S., Drebert, J., Rossberg, A., Grolimund, D. and Reich, T. (2017). Geochemical interactions of Plutonium with Opalinus Clay studied by spatially resolved synchrotron radiation techniques. Environ. Sci. Technol. 51: 7892-7902.

[4] Börner, P.J.B. (2017). Sorption and diffusion of Neptunium in Opalinus Clay. PhD thesis. Johannes Gutenberg-Universität Mainz, Mainz, Germany.

[5] Kaplan, U., Amayri, S., Drebert, J., Grolimund, D. and Reich, T. (2024). Plutonium mobility and reactivity in a heterogeneous clay rock barrier accented by synchrotron-based microscopic chemical imaging. Sci. Rep., accepted.


Acknowledgements

Funding from the German Federal Ministry of Education and Research (BMBF) under contract number 02NUK044B, from the Federal Ministry for the Environment, Nature Conservation, Nuclear Safety and Consumer Protection (BMUV) under contract numbers 02E11415A and 02E11860A, and from the European Union’s Horizon 2020 project EURAD (WP FUTuRE), EC Grant agreement no. 847593, is acknowledged.

How to cite: Breckheimer, M., Amayri, S., Ferreira Sanchez, D., Grolimund, D., and Reich, T.: Geochemical interactions of Np and Pu with pyrite heterogeneities in Opalinus Clay in the context of deep geological repositories, EGU General Assembly 2024, Vienna, Austria, 14–19 Apr 2024, EGU24-21650, https://doi.org/10.5194/egusphere-egu24-21650, 2024.

EGU24-21668 | ECS | Orals | ERE4.8

Pyrite oxidation rates and timing of weathering in supergene deposits: new insights from XPS approach 

Julien Poot, Alexandre Felten, Julien L. Colaux, Rachel Gouttebaron, Guillaume Lepêcheur, Gaëtan Rochez, and Johan Yans

Pyrite is one of the most common sulfides on Earth and occurs in many Cu, Pb and Zn sulfides (hypogene) ore deposits. By using XPS (X-ray Photoelectron Spectroscopy) surface and depth analyses, we propose a new experimental approach to determine the oxidation rate of pyrite in three exposure/conditions: i) air, ii) water and iii) water drip (Figure 1). Pyrite samples are almost pure and were collected from the Danube–Bouchon quarry (Hautrage, Belgium), in Barremian black clays of the Wealden facies sediments in the Mons Basin. These pyrites are nodules with cubic aggregates on the surface which were used for the different experiments.

The results reveal a maximum oxidation rate of 11.7 ± 1.8 nm day−1 for drip exposure associated with the precipitation of Fe-sulfates or/and oxides depending on the experimental conditions. These data can be extrapolated to the different zones of weathering profiles (gossan, saprolite and cementation zone). The extrapolation shows a maximum rate of 4.3 ± 0.6 m Ma−1, values consistent with those obtained by other methods such as isotope dating of weathering profiles (e.g. [1,2]). The oxidation in natural systems can vary following different factors, such as the nature of the host rock (protore) and the primary mineralogy, the porosity/permeability and fractures, the presence of an oxidizing environment, climate change over time, the action of bacteria as catalysts, …

Figure 1 - Macroscopic evolution of pyrite oxidation over time in the different experiments [3]


References

[1] De Putter T, Ruffet G, Yans J, Mees F (2015) Ore Geol Rev 71:350–362. https://doi.org/10.1016/J.OREGEOREV.2015.06.015

[2] Vasconcelos PM, Conroy M (2003) Geochim Cosmochim Acta 67:2913–2930. https://doi.org/10.1016/S0016-7037(02)01372-8.

[3] Poot J, Felten A, Colaux JL, Gouttebaron R, Lepêcheur G, Rochez G, Yans J (2024) Environ Earth Sci 83:9. https://doi.org/10.1007/s12665-023-11325-z

How to cite: Poot, J., Felten, A., Colaux, J. L., Gouttebaron, R., Lepêcheur, G., Rochez, G., and Yans, J.: Pyrite oxidation rates and timing of weathering in supergene deposits: new insights from XPS approach, EGU General Assembly 2024, Vienna, Austria, 14–19 Apr 2024, EGU24-21668, https://doi.org/10.5194/egusphere-egu24-21668, 2024.

EGU24-21967 | Posters on site | ERE4.8

Pyrite in Dutch peat - influence of  paleoenvironment and current land use  

Alwina Hoving, Josh Guyat, Thilo Behrends, and Jasper Griffioen

Peatlands in the Netherlands contain high amounts of sulfur (S). Drainage of these peatlands has led to oxidation of the peat, more recently enhanced through extended drought periods from the result of climate change. Oxidation of peat leads to the mobilization of S and elevated sulfate levels in surface waters. High sulfate concentrations are considered a water quality problem and can enhance eutrophication. In this study, the S content and S speciation in Dutch peats were investigated and their relation to paleoenvironment and current land-use.

Peat samples from eight locations in an east-west section, varying over paleoenvironment, peat type, proximity to the River Rhine and the North Sea, and current land‑use were analyzed. Sequential sulfur extraction was performed to fractionate iron-monosulfide, pyrite and organic-bound sulfur. Porewater was analyzed for sulfate, iron and nitrate concentrations to investigate their influence on the S speciation.

The analytical results could be split into 3 groups. The first group consisted of peats of marine paleoenvironment which had the highest total S content. Due to limited availability of iron (Fe), sulfur was predominantly present as organic-S and <10% of S was present as pyrite. Group 2 consisted of peat from fluvial paleoenvironment origin. In these groundwater fed, nutrient rich, minerotrophic fens, pyrite made up a larger portion of total S. In group 3, the peat was influenced by the river ‘Oude Rijn’. This river was polluted with higher sulfate concentrations, relative to rain water, and also carried clay particles rich in ferrous iron. Flooding events brought Fe to the peat-forming system resulting in pyrite formation. The influence of land-use was only visible in the top layers; high concentrations of nitrate in combination with a low pyrite content and elevated sulfate concentrations were likely caused by the input of fertilizer and subsequent denitrification and oxidation of pyrite.

Overall, paleoenvironment was found to be the predominant factor controlling S content and S speciation in Dutch peats in the Western Netherlands. Particularly the presence of pyrite was related to the presence of fen reed peats and dependent on a nearby Fe source during peat formation.

How to cite: Hoving, A., Guyat, J., Behrends, T., and Griffioen, J.: Pyrite in Dutch peat - influence of  paleoenvironment and current land use , EGU General Assembly 2024, Vienna, Austria, 14–19 Apr 2024, EGU24-21967, https://doi.org/10.5194/egusphere-egu24-21967, 2024.

EGU24-5864 | Posters on site | CL5.9

Investigation of the Suess effect in the South-West Indian Ocean over the last two decades – A model-data study 

Claire Waelbroeck, Coraline Leseurre, Pearse J. Buchanan, Gilles Reverdin, Nicolas Metzl, Virginie Racapé, Claire Lo Monaco, Catherine Pierre, Jérôme Demange, and Jonathan Fin

Measurements of dissolved inorganic carbon (DIC) concentration and its isotopic composition (δ13CDIC) are essential to study chemical and biological processes involved in the ocean carbon cycle, including photosynthesis, respiration, and air-sea CO2 fluxes. Anthropogenic CO2 emissions from fossil fuel combustion have caused an increase in DIC accompanied by a decline in δ13CDIC (called the Suess effect). δ13CDIC is thus a useful tracer to assess the oceanic uptake of anthropogenic CO2.

Annual assessments of the Global Carbon Budget (e.g. Friedlingstein et al., 2023) have revealed a growing deviation over the last 10 to 15 years between the estimates of the ocean carbon sink based on observations and models, with the growth of the observation-based ocean CO2 sink being larger compared to the models. Discrepancies in the multi-decadal trend originate from all latitudes but are greatest in the Southern Ocean.

Here, we present DIC and δ13CDIC measurements from surface and water column samples collected in the South-West Indian Ocean during repeated summer cruises over the last two decades (1998-2021) conducted on board the RV Marion Dufresne within the French monitoring program OISO (Océan Indien Service d’Observation). We compare these measurements with the DIC and δ13CDIC simulated over the same period by the δ13C-enabled version of the NEMO-PISCES ocean-biogeochemical model.

We use different methods to separate the natural and anthropogenic signals over the last 20 years. Our analysis reveals some inconsistencies between simulated and observed DIC and δ13CDIC, as well as between other simulated and observed biogeochemical parameters, whereas physical parameters are generally well reproduced by the model. Identifying the cause for this mismatch bears the potential to explain all or part of the divergence between the observation-based and model-based estimates of oceanic carbon uptake.

How to cite: Waelbroeck, C., Leseurre, C., Buchanan, P. J., Reverdin, G., Metzl, N., Racapé, V., Lo Monaco, C., Pierre, C., Demange, J., and Fin, J.: Investigation of the Suess effect in the South-West Indian Ocean over the last two decades – A model-data study, EGU General Assembly 2024, Vienna, Austria, 14–19 Apr 2024, EGU24-5864, https://doi.org/10.5194/egusphere-egu24-5864, 2024.

EGU24-10048 | Posters on site | CL5.9

The Amazon plume in 2020-2023: its shelf carbon budget and water origin revisited  

Gilles Reverdin, Léa Olivier, Jacqueline Boutin, Claire Waelbroeck, Coraline Leseurre, Patrice Bretel, Jérôme Demange, Jonathan Fin, Stéphane Pesant, Paula Huber, Hugo Sarmento, Doug Vandemark, Chris Hunt, Daniele Iudicone, Aline Govin, and Sabrina Speich

The Amazon shelf of South America is known to be highly contrasted in its surface carbon dioxide concentrations, from very high concentrations near the estuary, and very low concentrations downstream in the saltier Amazon plume, which results in a great contrast in carbon dioxide exchange with the atmosphere. During three cruises in 2020-2023 (Eurec4A-OA, Tara-Microbiomes legs 5, 6 and 7, Amaryllis), dissolved inorganic carbon (DIC) concentration, its isotopic composition (δ13C-DIC), the water isotopic composition (d18O-H2O and d2H-H2O), as well as inorganic nutrients and surface CO2 partial pressure (pCO2) were measured on the Amazon shelf of South America during three cruises in different seasons. These data are used to better understand mixing in the continuum between river water and open-ocean waters, and the biogeochemical processes taking place on the shelf close to the Amazon and Para river estuaries. The water isotopes are furthermore used to identify different freshwater origins.

The accuracy of the data is discussed as well as its representativeness. The data are then combined to first identify large variations of the river freshwater sources, compatible with 2021 being a year of very large discharge, and 2023 a year of exceptional low discharge. In addition, the data mostly from August and September 2021 identify a smaller influence of sources and sinks of dissolved inorganic carbon in the mixing shelf region than what had been earlier observed during the Amasseds cruise data in November-December 1991, a much lower river discharge period. This indicates that there might be a larger seasonal and/or interannual variability of these processes than what was earlier assessed. Measured pCO2 data on the Amazon shelf in 2021 are then discussed in this context.

How to cite: Reverdin, G., Olivier, L., Boutin, J., Waelbroeck, C., Leseurre, C., Bretel, P., Demange, J., Fin, J., Pesant, S., Huber, P., Sarmento, H., Vandemark, D., Hunt, C., Iudicone, D., Govin, A., and Speich, S.: The Amazon plume in 2020-2023: its shelf carbon budget and water origin revisited , EGU General Assembly 2024, Vienna, Austria, 14–19 Apr 2024, EGU24-10048, https://doi.org/10.5194/egusphere-egu24-10048, 2024.

EGU24-10260 | Posters on site | CL5.9

Hydrogen and Oxygen Isotopes as Mass Proxies Along the South Atlantic Ocean 

Jose Marcus Godoy, Loes Gerringa, and Micha Rijkenberg

It was determined the values of δ(D) and δ(18O) on 432 seawater samples from 18 depth profiles collected during the Geotraces West Atlantic cruise leg 3; JC057 on RRS James Cook, 03/2011-04/2011. The first sampling station was located north of Falkland Island and the last one near the Equator line. The samples were collected using a 24 bottles rosette and storage on 2 mL glass vials, kept at 3-4 oC until the measurement. The measurements were carried out applying a PICARRO water analyzer, using IAEA VSMOW2, SLAP2 and GISP reference materials as standards, each batch consisted of the three standards and six samples, with seven injections each and the sample result represent the mean value of the three last injections.

The delta values ranged from -0.91 (station 9, 1250 m) to 1.46 (station 7, 250 m) for δ(18O) and -4.5 (station 5, 5150 m) to 8.2 (station 13, 10 m).

The δ(18O)-salinity relationship varies with the depth range with a slope of 0.37 (R=0.845) for (10- 100 m), 0.39 (R=0.747) for (100-250 m), 0.53 (R=0.813) for (250-1000 m) but poor correlated (R = 0.506) for deeper samples (>1000 m). Similar figure was observed for the δ(D)-salinity relationship with a slope of 3.04 (R=0.938) for (10- 100 m), 3.02 (R=0.879) for (100-250 m), 4.21 (R=0.898) for (250-1000 m) and poor correlated (R = 0.610) for deeper samples (>1000 m).

The δ(18O)-temperature presented a similar figure as observed for the salinity although constant for the depths higher than 1000 m changing for deeper samples. The δ(18O)-temperature relationship had a slope of 0.053 (R=0.820) for (10- 100 m), 0.054 (R=0.739) for (100-250 m), 0.048 (R=0.716) for (250-1000 m) but poor correlated (R = 0.582) for deeper samples (>1000 m). The δ(D)-temperature relationship has also quite constant until 1000 m with a slope of 0.45 (R=0.933) for (10- 100 m), 0.43 (R=0.886) for (100-250 m) and 0.41 (R=0.850) for (250-1000 m) changing the slope to 0.82 (R=0.710) for deeper samples (>1000 m).


How to cite: Godoy, J. M., Gerringa, L., and Rijkenberg, M.: Hydrogen and Oxygen Isotopes as Mass Proxies Along the South Atlantic Ocean, EGU General Assembly 2024, Vienna, Austria, 14–19 Apr 2024, EGU24-10260, https://doi.org/10.5194/egusphere-egu24-10260, 2024.

EGU24-10953 | Posters on site | CL5.9

Observation of Oxygen-18 in Ocean Waters in the Vicinity of Iceland  

Arny Sveinbjornsdottir, Jon Olafsson, and Solveig Olafsdottir

The goal of the present project is to use oxygen-18 to map water masses North of Iceland. Here we report on findings from field campaigns carried out over the period from 1988 to 2019. The samples were collected on Icelandic vessel cruises from waters that currents bring from the south and from the north and are found west and north of Iceland.  An emphasis was placed on low salinity waters that characterize the Polar Water of the East Greenland Current. The data cover all seasons and a salinity range from 29.1 to 35.3.  The observations generally also include biogeochemical constituents: dissolved oxygen and the nutrients phosphate, nitrate, and silicate (Olafsson, Olafsdottir et al. 2010).   

Oxygen isotope measurements were carried out at the Science Institute, University of Iceland. Prior to 2007 we used a Finngan MAT 251 Mass-spectrometer and extracted oxygen from the water by equilibrating degassed water with a small amount of CO2 gas (Epstein and Mayeda, 1953). After 2007 the measurements were performed on a continuous flow Delta V Advantage mass-spectrometer, with a Gas bench device. The accuracy of the measurements is better than 0.05‰. 

We examine the δ18O -S relationships for variations with seasons and time. The surface waters of the observed regions are seasonally productive but with different winter nutrient concentrations to support phytoplankton spring blooms. We examine variations in the seasonal δ18O-nutrient relationships.


Epstein, S. and Mayeda, T.K. (1953). Variation in O18 content of waters from natural sources. Geochim Cosmochim. Acta 4:213-224. 

Olafsson, J., S. R. Olafsdottir, A. Benoit-Cattin and T. Takahashi (2010). "The Irminger Sea and the Iceland Sea time series measurements of sea water carbon and nutrient chemistry 1983–2008." Earth Syst. Sci. Data 2(1): 99-104.

How to cite: Sveinbjornsdottir, A., Olafsson, J., and Olafsdottir, S.: Observation of Oxygen-18 in Ocean Waters in the Vicinity of Iceland , EGU General Assembly 2024, Vienna, Austria, 14–19 Apr 2024, EGU24-10953, https://doi.org/10.5194/egusphere-egu24-10953, 2024.

EGU24-11848 | Posters on site | CL5.9

Monitoring hydrographic changes in the mid-latitudinal Northeast Atlantic Ocean using seawater stable isotope data 

Antje H. L. Voelker, Emilia Salgueiro, Gilles Reverdin, Marcos Fontela, Fatima Abrantes, and Robert van Geldern

Since 2010 seawater samples for stable carbon and water isotope measurements were collected during various hydrographic cruises in the NE Atlantic between 29° and 60°N and 9° and 33°W, including pluriannual sampling in the Madeira basin, along the western Iberian margin and along the OVIDE/BOCATS (A25) transect between Portugal and Greenland. The samples cover the complete depth range at the respective station. For all samples δ18O was analyzed, whereas δ2H (δD) measurements were more limited and mainly focused on the wide range of water masses encountered along the OVIDE/BOCATS transect. Carbon isotope values for the dissolved inorganic carbon (δ13C-DIC) was monitored over several years at selected stations of the OVIDE/BOCATS transect and in the waters along the Portuguese margin. For some stations along the OVIDE/BOCATS transects, the results of intercomparison measurements between the laboratories at the GeoZentrum Nordbayern (Erlangen) and at LOCEAN (Paris) will also be presented.

The δ13C-DIC profiles show a clear signal of anthropogenic carbon entering the water column in the NE Atlantic and leading to lower isotopic values. Whereas data obtained for samples collected in 2010 more or less agree with the data from previous decades compiled in the GLODAP database, shifts to lower values became apparent in the subsurface waters already in 2012. The signal transfer is accelerated in the subsequent years with data from 2016 onwards showing penetration of anthropogenic carbon down to 2000 m and already all the way south to 31°N (Madeira basin). New data from a cruise to the southwestern Portuguese margin in 2022 indicate that the changes now already penetrate down to 2200 m.

Changes in the δ18O/ δ2H data are less obvious and mostly linked to the subpolar gyre and water mass changes associated with the “North Atlantic cold blob” between winter 2013-2014 and 2016. The presence of surface and subsurface waters with lower isotopic signals clearly tracks the eastward displacement of the subarctic front in 2014 and 2016. Likewise, the front’s subsequent retraction to the west is reflected in the data from 2018 and 2021. Low δ18O and  δ2H values in depths down to 300 m in the region between the Rockall Plateau and the Reykjanes ridge also clearly distinguish the subpolar mode water formed during the previous “cold blob” winters. On the other hand, and in agreement with the δ13C-DIC evidence, hardly any isotope signal changes are observed in the depths of the North Atlantic Deep Water (NADW) and the Northeast Atlantic Bottom Water (NEABW).

How to cite: Voelker, A. H. L., Salgueiro, E., Reverdin, G., Fontela, M., Abrantes, F., and van Geldern, R.: Monitoring hydrographic changes in the mid-latitudinal Northeast Atlantic Ocean using seawater stable isotope data, EGU General Assembly 2024, Vienna, Austria, 14–19 Apr 2024, EGU24-11848, https://doi.org/10.5194/egusphere-egu24-11848, 2024.

EGU24-12179 | Posters on site | CL5.9 | Highlight

Uncovering 'Hidden' Insights from the Ocean in the PAGES CoralHydro2k Seawater δ18O Database  

Alyssa R Atwood, Andrea L Moore, Sylvia Long, Raquel Pauly, Emilie Dassie, Jessica Hargreaves, Kristine L DeLong, Chandler Morris, Sara C Sanchez, Amy J Wagner, and Thomas Felis

The oxygen isotope ratio (δ18O) of seawater is a powerful tracer of the global water cycle, providing valuable information on the exchange of water between the ocean, atmosphere, and cryosphere as well as on ocean mixing processes. As such, observational seawater δ18O data place powerful constraints on hydrologic changes in the modern ocean, are essential for calibrating paleoclimate proxies based on the δ18O of marine carbonates, and are an increasingly critical diagnostic tool for assessing model performance and skill in isotope-enabled global climate models. In recognition of the broad value of seawater δ18O data to the Earth science community and the growing number of new seawater δ18O data sets that have been generated over the last decade, we launched the PAGES CoralHydro2k Seawater δ18O Database Project in 2020 to recover ‘hidden’ seawater oxygen isotope data sets. We have collated these records and combined them with public data to create a new, machine-readable, and metadata-rich database that aligns with findability, accessibility, interoperability, and reusability (FAIR) standards for digital assets.

Here, we present a summary of our crowdsourcing efforts and description of the database to date, and report initial findings from the new database. The database consists of over 19,000 observations of seawater δ18O with more than 50 metadata fields. We compare seawater δ18O variability from the database to that simulated by a suite of isotope-enabled climate models and to seawater δ18O reconstructions derived from coral records and find substantial differences at annual to decadal timescales across different data sets. Lastly, we discuss the potential for future investments in water isotope observation networks to tackle 21st century science questions related to ocean changes in the past, present, and future.

How to cite: Atwood, A. R., Moore, A. L., Long, S., Pauly, R., Dassie, E., Hargreaves, J., DeLong, K. L., Morris, C., Sanchez, S. C., Wagner, A. J., and Felis, T.: Uncovering 'Hidden' Insights from the Ocean in the PAGES CoralHydro2k Seawater δ18O Database , EGU General Assembly 2024, Vienna, Austria, 14–19 Apr 2024, EGU24-12179, https://doi.org/10.5194/egusphere-egu24-12179, 2024.

Precise and accurate measurements of the stable isotope composition of water with cavity ring down laser spectrometers require post-processing and calibration of raw analytical signals that involves a number of critical procedures to counteract instrumental drift, inter-sample memory effects, and the quantification of total uncertainty. Due to advent of off-the-shelf water isotope analyzers, there is an increased demand from a variety of new, often smaller labs to obtain guidance and assistance when performing such tasks.

Here we present a new, lightweight, free software tool for the post-processing and calibration of water isotope data files from Picarro-brand cavity ring-down spectrometers. It is developed at the Facility for Advanced Isotopic Research and Monitoring of Weather, Climate and Biogeochemical Cycling (FARLAB) at the University of Bergen. FLIIMP1 (FARLAB liquid water isotope measurement processor) is written in MATLAB, but also exists as downloadable precompiled code and runs on Windows, MacOS and Linux. In its current version 2.1, FLIIMP facilitates sample processing by a graphical user interface that guides the user along the processing steps from corrections for memory effects, drift, and mixing ratio to calibration. FLIIMP provides detailed memory correction procedures, creates calibration reports and data files, and includes tools to monitor long-term measurement system behavior. Being an open-source software for the major operating systems, users can adapt FLIIMP to their laboratory environment, and the community can contribute to the software development. We hope that adoption of FLIIMP at other laboratories will lead to its further development into a mature set of calibration and correction routines for consistent, accurate, well-documented measurements of the stable isotope composition in liquid water samples.


1 Sodemann, H, Mørkved, PT, and Wahl, S. (2023) FLIIMP - a community software for the processing, calibration, and reporting of liquid water isotope measurements on cavity-ring down spectrometers. Methods X 11:2023 DOI:https://doi.org/10.1016/j.mex.2023.102297


How to cite: Mørkved, P. T., Sodemann, H., and Wahl, S.: FLIIMP - a free, open source software for the processing, calibration and reporting of liquid water isotope measurements on cavity-ring down spectrometers, EGU General Assembly 2024, Vienna, Austria, 14–19 Apr 2024, EGU24-16217, https://doi.org/10.5194/egusphere-egu24-16217, 2024.

EGU24-17734 | Posters on site | CL5.9

Implementing and simulating the water isotopes (δ18O and δD) distribution in the Mediterranean Sea using a high-resolution oceanic model  

Mohamed Ayache, Jean-Claude Dutay, Anne Mouchet, Kazuyo Tachikawa, Camille Risi, and Gilles Ramstein

Water isotopes are one of the most widely used proxies in ocean climate research. However, there are still gaps in our understanding of the processes that control their composition.  Compared to other large ocean basins, the Mediterranean is ideally suited to improve our understanding of the processes influencing and driving oxygen isotopic variability, and to refine the current modelling approach. For the first time in a high-resolution Mediterranean dynamical model (NEMO-MED12), stable water isotopes (δ18O and δD) were successfully implemented and simulated in the whole basin. The well-known east-west gradient of δ18O in Mediterranean water masses is successfully simulated by the model. Results also show good agreement between simulated and observed δD. δD shows a strong linear relationship with δ18O (r2 = 0.98) and salinity (r2 = 0.94) for the entire Mediterranean basin. Furthermore, the modelled δ18O/salinity relationships are in good agreement with observations, with a weaker gradient simulated in the eastern basins than in the western basins. We investigate the relationship of the isotopic signature of the CaCO3 shell (δ18Oc) with temperature and the influence of seasonality. Our results suggest a more quantitative use of δ18O records, combining reconstruction with modelling approaches. This opens up broad perspectives for paleoclimate-related applications.

How to cite: Ayache, M., Dutay, J.-C., Mouchet, A., Tachikawa, K., Risi, C., and Ramstein, G.: Implementing and simulating the water isotopes (δ18O and δD) distribution in the Mediterranean Sea using a high-resolution oceanic model , EGU General Assembly 2024, Vienna, Austria, 14–19 Apr 2024, EGU24-17734, https://doi.org/10.5194/egusphere-egu24-17734, 2024.

EGU24-19941 | ECS | Posters on site | CL5.9

Investigating upper ocean salinity changes over the past three decades in the Indian sector of the Southern Ocean 

Camille Akhoudas, Jean-Baptiste Sallée, Matthis Auger, Gilles Reverdin, Alexander Haumann, Claire Lo Monaco, Nicolas Metzl, and Christian Stranne

The Southern Ocean is undergoing rapid transformations, marked by significant regional shifts in salinity that carry widespread and irreversible consequences. While the most noticeable changes are observed in the upper ocean, changes in deeper water masses have been identified and are expected to intensify over time. Changes in upper-ocean water mass salinity can be influenced by multiple drivers, and play a crucial role in changing ocean dynamics. However, the underlying causes of these characteristic changes remain poorly understood. In this study, we present a unique three-decade time-series focusing on salinity and oxygen isotopes in the upper 1200 m of the Indian sector of the Southern Ocean. Two regions emerge with pronounced surface ocean salinity trends: freshening of subpolar waters and salinification of subtropical waters. These robust changes in surface salinity are associated with an observed freshening of intermediate and winter waters in the subpolar sector of the Indian sector over the past three decades. Our findings reveal salinity changes of comparable magnitude to those reported in other regions of the upper-ocean water masses in the Southern Ocean. The oxygen isotope data allows for discriminating between different freshwater processes, showing that in the subpolar region, surface freshening is largely caused by the increase in net precipitation, while the decrease in sea ice melt is largely offset by the contribution of glacial meltwater at these latitudes. These changes strengthen the growing evidence of an acceleration of the hydrological cycle and a melting cryosphere resulting from human-induced climate change, which affect Southern Ocean water mass characteristics.

How to cite: Akhoudas, C., Sallée, J.-B., Auger, M., Reverdin, G., Haumann, A., Lo Monaco, C., Metzl, N., and Stranne, C.: Investigating upper ocean salinity changes over the past three decades in the Indian sector of the Southern Ocean, EGU General Assembly 2024, Vienna, Austria, 14–19 Apr 2024, EGU24-19941, https://doi.org/10.5194/egusphere-egu24-19941, 2024.

EGU24-21082 | ECS | Posters virtual | CL5.9

Simultaneous Onboard Analysis of Seawater Dissolved Inorganic Carbon (DIC) Concentration and Stable Isotope Ratio (δ13C-DIC) 

Zhentao Sun, Xinyu Li, Zhangxian Ouyang, Qian Li, Charles Featherstone, Eliot Atekwana, Najid Hussain, Yiwen Pan, and Wei-Jun Cai

Dissolved inorganic carbon (DIC) concentration and stable carbon isotope value (δ13C-DIC) are valuable for studying aquatic carbon cycles. These parameters reveal significant geochemical insights, such as the discernible effect of ocean anthropogenic CO2 uptake, the primary control of surface δ13C-DIC distribution by photosynthesis and respiration against a meridionally variable air-sea equilibrium background, and the notable impact of terrestrial carbon inputs in estuarine environments. However, one cannot take full advantage of this coupled pair as only 15% or less of water samples during past ocean cruises and very few coastal ocean samples have been analyzed for δ13C-DIC as the traditional isotope analytical technology is labor-intensive and limited in shore-based laboratories. This study reports a rapid and cost-effective method based on Cavity Ring-Down Spectroscopy (CRDS) for automatically and simultaneously analyzing DIC concentration and δ13C-DIC on shipboard. Compared to traditional techniques, our analyzer is more portable and operational-friendly. We also prepared and preserved a set of stable in-house NaHCO3 standards for seawater δ13C-DIC calibration during long cruises. This work represents the first effort to collect a large dataset of δ13C-DIC onboard on any oceanic transect; here along the North American eastern ocean margins in summer 2022. We efficiently processed 30 samples daily per analyzer over a 40-day expedition with excellent on-site uncertainty of ±1.1 μmol kg-1 for the DIC concentration and ±0.03‰ for the δ13C-DIC value (1σ). The duplicates taken from varying depths demonstrated high consistency with average standard deviations of 1.6 μmol kg-1 for DIC concentrations ranging between 1900 and 2300 μmol kg-1 and 0.04‰ for δ13C-DIC from -0.5‰ to 1.8‰. The DIC concentration measurements of CRM displayed average discrepancies of 1.4±1.7 μmol kg-1 for Batch #188 and 1.0±1.1 μmol kg-1 for Batch #195 against certified values, indicating reliable accuracy. Our δ13C-DIC analysis of CRM from Batch #188 yielded an average of -0.20±0.04‰, closely matching the reference value of -0.19±0.02‰ obtained by Isotope Ratio Mass Spectrometry (IRMS). Consistent standard deviations for δ13C-DIC of CRM from Batch #188 (0.04‰, n = 36) and Batch #195 (0.03‰, n = 7) further affirmed the potential utility of CRM as a viable liquid standard for δ13C-DIC measurements in seawater. An interlaboratory comparison of DIC analysis with NOAA/AOML revealed an average offset of 2.0±3.8 μmol kg-1 between onboard CRDS measurements and Coulometry results. Moreover, the cross-validation of δ13C-DIC against historical deep-ocean data exhibited a mean difference of only -0.04±0.06‰, emphasizing the high quality of our data.

How to cite: Sun, Z., Li, X., Ouyang, Z., Li, Q., Featherstone, C., Atekwana, E., Hussain, N., Pan, Y., and Cai, W.-J.: Simultaneous Onboard Analysis of Seawater Dissolved Inorganic Carbon (DIC) Concentration and Stable Isotope Ratio (δ13C-DIC), EGU General Assembly 2024, Vienna, Austria, 14–19 Apr 2024, EGU24-21082, https://doi.org/10.5194/egusphere-egu24-21082, 2024.

It has been advocated that nitrogen (N) availability plays an essential role in mediating plant and microbial growth in cold environment, and could thus regulate the direction and magnitude of permafrost carbon (C)-climate feedback. However, compared to widely concerned N, little is known about soil phosphorous (P) availability and its biological acquisition strategies in permafrost environment. Here we explored soil microbial P acquisition strategies using shotgun metagenomics across the Tibetan permafrost area, encompassing a large scale survey spanning 1,000 km. In contrast to the traditional opinion that microorganisms in cold area usually obtain P mainly through mineralization process, our results revealed that the P cycling genes responsible for solubilization, mineralization and transportation were widespread, illustrating multiple microbial strategies for acquiring P in permafrost regions. Moreover, the higher gene abundance related to solubilization and mineralization as well as an increased ration of MAGs carrying these genes were detected in the active layer, while the greater abundance of low affinity transporter gene (pit) and proportions of MAGs harbouring pit gene were observed in permafrost deposits, reflecting a stronger potential for P activation in active layer but an enhanced P transportation potential in permafrost deposits. Taken together, these results highlight that besides microbial P mineralization, multiple P-related acquisition strategies and their differences among various soil layers should be considered simultaneously to improve model prediction for the responses of biogeochemical cycles in permafrost ecosystems to climate change.

How to cite: Wang, L. and Yang, Y.: Divergent microbial phosphorous acquisition strategies between active layer and permafrost deposits, EGU General Assembly 2024, Vienna, Austria, 14–19 Apr 2024, EGU24-2973, https://doi.org/10.5194/egusphere-egu24-2973, 2024.

EGU24-3208 | ECS | Orals | BG1.4 | Highlight

Seagrasses' role as a reverse sedimentary phosphate pump 

Neta Soto, Gilad Antler, and Avner Gross

Seagrasses are marine-flowing plants that form an important coastal ecosystem. Although occupying less than 0.2% of the ocean’s surface, seagrasses store over 15% of the accumulated global carbon storage in the ocean’s sediments. Thus, Seagrass meadows play a pivotal role in mitigating climate change by carbon sequestration. Seagrasses are widely distributed in oligotrophic tropical waters despite the low nutrient levels in the water column due to their ability to absorb nutrients from the sediment porewater. Moreover, seagrasses can actively mobilize unavailable nutrients e.g., iron and phosphorus in the rhizosphere via multiple biogeochemical interactions. This provides them with an important advantage over pelagic photoautotrophs, which are limited by the availability of nutrients in the water column. Despite their ability to transport nutrients from sinks e.g., sediments to the water column where they can be recycled trough grazing or decomposition, the potential role of seagrass as a revers sedimentary phosphate pump remains unclear. The aim of this study is to examine the effect of seagrass disappearance on phosphate flux in marine coastal environments. In a series of incubation experiments, the change in the phosphate release was examined in different tissues of seagrass Halophila stipulacea. The results showed that the while the highest decomposition rate of the rhizomes was the fastest, the highest phosphate release rate was measured in the leaves, despite having similar phosphate content. Since the leaves mostly decompose in the water column, the released phosphate is made available to planktonic photoautotrophs and further enhances more carbon fixation. Overall, we suggest that in oligotrophic environments seagrasses act as a reverse phosphate pump by accessing phosphate in the sediment and later translocating it to the aboveground parts and releasing in the water column, thus fertilizing planktonic photoautotrophs and enhancing further carbon sequestration.

How to cite: Soto, N., Antler, G., and Gross, A.: Seagrasses' role as a reverse sedimentary phosphate pump, EGU General Assembly 2024, Vienna, Austria, 14–19 Apr 2024, EGU24-3208, https://doi.org/10.5194/egusphere-egu24-3208, 2024.

EGU24-3472 | Orals | BG1.4

Elevated atmospheric CO2 increased soil plant available and soil organic phosphorus in a mature temperate oak (Quercus robur L.) forest 

Amin Soltangheisi, Adam Pinder, Keegan Blazey, Robert T. Grzesik, Miles Marshall, Angeliki Kourmouli, Carolina Mayoral, Kris M. Hart, Sami Ullah, Iain P. Hartley, A. Robert MacKenzie, and Andy R. Smith

Enhanced productivity of forest ecosystems in response to rising levels of anthropogenically generated atmospheric carbon dioxide (CO2) has the potential to mitigate against climate change by sequestering carbon in woody biomass and soils. However, the physiological response of trees to elevated atmospheric CO2 may be constrained by the availability of soil nutrients, predominantly nitrogen and phosphorus (P). Here, we assess the impact of elevated atmospheric CO2 on P cycling in a temperate 180-year-old oak (Quercus robur L.) forest exposed to free-air CO2 enrichment (ambient + 150 ppm) for six years. Soil cores were collected to a depth of 1 m in July 2023 and separated into three horizons and three layers (O, A, B, 30-50, 50-70, 70-100 cm) before analysis using the Hedley1 sequential P fractionation and the DeLuca2biological based P extraction techniques. Plant available P in soil pore water and total organic P from the O horizon increased by 84 and 128%, respectively, whilst organic P extracted with phosphatase increased by 62% under elevated CO2. Total organic P in soil horizons beyond the B horizon (> 15 cm) decreased under elevated CO2 in comparison with ambient CO2. As soil organic P is derived from the turnover of both vegetation and microbial biomass, increased soil organic P in the O horizon may be due to the faster turnover of organic matter or an increase in the net primary productivity of the forest. Soil P cycling in this forest ecosystem appears to be predominantly influenced by biological rather than chemical processes, since elevated CO2 only affected the organic P and not inorganic P fractions. Forest productivity may be constrained by P limitation in future elevated CO2 environments, if there is faster organic matter turnover which is probably the case in our study.

1Hedley, M. J., Stewart, J. W. B., & Chauhan, B. (1982). Changes in inorganic and organic soil phosphorus fractions induced by cultivation practices and by laboratory incubations. Soil Science Society of America Journal, 46(5), 970-976.

2DeLuca, T. H., Glanville, H. C., Harris, M., Emmett, B. A., Pingree, M. R., de Sosa, L. L., Cerdá-Moreno, C. & Jones, D. L. (2015). A novel biologically-based approach to evaluating soil phosphorus availability across complex landscapes. Soil Biology and Biochemistry, 88, 110-119.

How to cite: Soltangheisi, A., Pinder, A., Blazey, K., Grzesik, R. T., Marshall, M., Kourmouli, A., Mayoral, C., Hart, K. M., Ullah, S., Hartley, I. P., MacKenzie, A. R., and Smith, A. R.: Elevated atmospheric CO2 increased soil plant available and soil organic phosphorus in a mature temperate oak (Quercus robur L.) forest, EGU General Assembly 2024, Vienna, Austria, 14–19 Apr 2024, EGU24-3472, https://doi.org/10.5194/egusphere-egu24-3472, 2024.

EGU24-4491 | Posters on site | BG1.4

Silicone availability and NaCl water type enhances the phosphorus release from sediments in coastal forest catchments in Akita, Japan 

Atsushi Hayakawa, Yuka Kuroe, Ayumi Kawata, Kazuya Nishina, Yuichi Ishikawa, and Tadashi Takahashi

[Background] Phosphorus (P) availability in soils and sediments is a critical parameter influencing primary production in terrestrial and aquatic ecosystems, controlled by both P chemical fractions in solid phase and solution composition. A recent study using Arctic soils reported that the addition of Si to the soil released P bound to Fe(II) compounds, but reports on other soils and sediments are limited. In our previous study, we detected higher P concentrations in stream water and iron-bound P content in river sediments in the marine sedimentary rock catchments of the Akita coastal area compared to catchments in the adjacent igneous rock area. Furthermore, high-P stream waters were NaCl water type with relatively lower Ca2+ and higher SiO2 concentrations. In this study, we evaluated the effects of different solution compositions and amorphous Si addition on P solubilization in sediments using river sediments from marine sedimentary and igneous rock regions. [Method] We tested each five river sediments (<2 mm) in the headwaters of western Akita Prefecture, Japan, where the surface geology is composed of marine sedimentary rocks and igneous rocks. Available Si (easily water-soluble Si) was measured by a long-term flooded incubation in distilled water at 30°C for 30 days. In the P dissolution incubation, four types of treatment solutions (distilled water, 1 mM NaCl and NaHCO3 solutions, and 0.5 mM CaCl2 solution) were added to 0.5 g sediment and in the Si addition treatment, amorphous Si (hydrophilic fumed silica, AEROSIL300) was also added. SRP, DOC and pH in the solution were measured after shaking for 48 hours. A statistical analysis was performed using a linear mixed model (LMM) with SRP, DOC and pH in the liquid phase as objective variables. The surface geology, four types of solutions, and the Si addition as explanatory variables. Additionally, each five sediment was treated as a random effect. [Results and discussion] Easily water-soluble Si content in sediments was significantly higher in marine sedimentary rock areas (p < 0.001), indicating that the easily soluble Si causes higher SiO2 concentration in stream water. The incubation results showed Si addition significantly increased P concentration in the liquid phase (p < 0.001), and combined Si addition with NaHCO3 treatment further increased P concentration. Conversely, CaCl2 treatment significantly decreased the liquid-phase P concentration. The influence of surface geology on extracted P concentration was not significant. Si addition did not affect pH (p = 0.58) and DOC (p = 0.90), while the effects of solution composition on pH and DOC were also significant; NaHCO3 solution increased pH and DOC while CaCl2 solution decreased pH and DOC. In conclusion, in marine sedimentary rock areas in coastal Akita with NaCl water type where Ca2+ concentration is relatively low and sediments have higher easily soluble Si, P release from sediments easily occurs and a high P concentration keeps in the liquid phase.

How to cite: Hayakawa, A., Kuroe, Y., Kawata, A., Nishina, K., Ishikawa, Y., and Takahashi, T.: Silicone availability and NaCl water type enhances the phosphorus release from sediments in coastal forest catchments in Akita, Japan, EGU General Assembly 2024, Vienna, Austria, 14–19 Apr 2024, EGU24-4491, https://doi.org/10.5194/egusphere-egu24-4491, 2024.

EGU24-6352 | ECS | Posters on site | BG1.4

Phosphorous in the seabed sediments of the Gulf of Riga, Baltic Sea: Fe-Mn concretions as main carriers of mobile phosphorous  

Markus Ausmeel, Martin Liira, Päärn Paiste, Aivo Lepland, and Sten Suuroja

Baltic Sea is a geologically young semi-enclosed brakish-water body which water exchange with the ocean has been gradually declining. Approximately 85 million people live in the Baltic Sea's catchment area, resulting in significant human impact on the basin's ecosystem. Eutrophication due to anthropogenic discharge of nutrients is considered to be the most serious environmental problem which leads to a greater growth of phytoplankton and algae, deterioration of water quality, and lack of oxygen in near-bottom water masses. As a result of recent large-scale input of nutrients, phosphorus has accumulated in the seabed sediments from where it can be remobilized and released into the water column under favorable conditions (hypoxic or anoxic). Marine sediments contain phosphorus in various components i.e. fractions, but not all of them are affected by remobilization. Therefore, knowing how phosphorus fractions are distributed in seabed sediments is important.

One part of the Baltic Sea that has received little attention, but will significantly affect the entire Baltic Sea in the future, is the Gulf of Riga. The Gulf of Riga accounts for less than 5% of the total area of the Baltic Sea and less than 2% of the total water volume. Due to its shallowness and limited connection with the open Baltic Sea, the Gulf of Riga is strongly influenced by riverine input. Intense agriculture, rapid development of industry, and urbanization have resulted in high loads of nutrients into the Gulf of Riga already since the 1960s.

Phosphorus fractions and their vertical distribution were studied from the sea-bottom sediments from the Gulf of Riga and other coastal areas of western Estonia. The amount of potentially mobile phosphorus stored in the surface sediments of the Gulf of Riga is several times higher than in other accumulation areas of the Baltic Sea, with concentrations as high as 980 mg/kg(dw). A strong correlation between Mn and mobile phosphorus concentration suggests that Fe-Mn concretions control the amount of phosphorus in the sediments of the Gulf of Riga. Although the bottom waters of the Gulf of Riga are currently predominantly oxic, a decreasing trend of deep-layer oxygen concentrations and more frequent hypoxia in the Gulf of Riga during previous decades have been documented. Considering the large amount of potentially mobile phosphorus in the sediments of the Gulf of Riga, surpassing the annual total phosphorus input to the Baltic Sea, a substantial release of phosphorus could be inevitable, possibly impacting the entire Baltic Sea ecosystem.

How to cite: Ausmeel, M., Liira, M., Paiste, P., Lepland, A., and Suuroja, S.: Phosphorous in the seabed sediments of the Gulf of Riga, Baltic Sea: Fe-Mn concretions as main carriers of mobile phosphorous , EGU General Assembly 2024, Vienna, Austria, 14–19 Apr 2024, EGU24-6352, https://doi.org/10.5194/egusphere-egu24-6352, 2024.

EGU24-7212 | ECS | Orals | BG1.4

Vivianite verified in early Cambrian strata in northwestern China: Implications for phosphorus recycling in ancient anoxic oceans 

Xuyang Cao, Pengcheng Ju, Yigui Han, Lihui Lu, and Dong Shao

In modern low sulfate and anoxic (euxinic) waters, the precipitation of mineral vivianite (an easily oxidized hydrated ferrous-iron phosphate) has played a crucial role in restraining the limiting nutrient element phosphorus (P) recycling back to the water column and consequently decreasing primary productivity. Although such low sulfate and anoxic conditions were widespread in ancient coastal oceans, vivianite has not been directly discovered in the paleo-sediments, which hampers the understanding of P cycling in ancient anoxic environments. Here, we combined techniques of scanning electron microscopy-energy dispersive X-ray spectroscopy, focused ion beam-transmission electron microscopy and P K-edge X-ray absorption near edge structure spectroscopy to analyze samples of P-bearing siliceous rocks and shales from the early Cambrian Yurtus Formation in the Tarim Craton, northwest China. Our results have demonstrated that micron- to nano-scale vivianite crystals are well preserved in the rocks and the vivianite dominates the P phase in some samples. The cherty matrix of the rocks most likely increased the chances of preservation of the oxidation-sensitive vivianite. In light of recent advances, we suggest that vivianite was a crucial P phase in ancient continental margin sediments, spanning most time from the Neoarchean to the early Cambrian. During this interval, the precipitation of vivianite was likely aided by the prevalent dynamic ocean euxinic conditions linked with the seawater sulfate reservoir and the flux of organic matter settling. We propose a negative feedback mechanism in which vivianite precipitation from ancient euxinic waters restricted P availability for biota, reduced marine primary productivity, and possibly abated the rate of Earth's oxygenation and associated evolution of life. This work was financially supported by NSFC projects (grants 42072264, 41730213) and Hong Kong RGC GRF (17307918).

How to cite: Cao, X., Ju, P., Han, Y., Lu, L., and Shao, D.: Vivianite verified in early Cambrian strata in northwestern China: Implications for phosphorus recycling in ancient anoxic oceans, EGU General Assembly 2024, Vienna, Austria, 14–19 Apr 2024, EGU24-7212, https://doi.org/10.5194/egusphere-egu24-7212, 2024.

EGU24-9578 | ECS | Posters on site | BG1.4

Lithology-constrained phosphorus (P) releasement 

Shenghui Ouyang

Phosphorus (P), as an indispensable nutrient element in Earth’s biological system, exerts a pivotal role on the burial of organic carbon over million-year time scales. By producing oxygen and consuming carbon dioxide, organic carbon burial may have paved the path for multicellular organisms by reforming the anoxic atmosphere to an oxic one. Organic carbon burial, on long time scales, is ultimately limited by continental P influx released by chemical weathering of P-bearing minerals. As crystalline rocks characterized by prominent discrepancy in P-bearing mineral composition undergoing various dominant weathering forces on surficial environment, P availability for organic carbon burial could be controlled by lithology. To decipher the conundrum of P releasement, a catchment scale case study was conducted, encompassing a series of lithologies following the crystalline rock order. Preliminary data suggests that the P release efficiency is lithology-constrained, indicating an enhanced P releasement in felsic catchment. The result gives us a hint that felsic crust would export more P to the ocean and promote the organic carbon burial, the lithology-constrained P releasement also enlightens us a new perspective to understand the coevolution among crust, atmosphere and life.

How to cite: Ouyang, S.: Lithology-constrained phosphorus (P) releasement, EGU General Assembly 2024, Vienna, Austria, 14–19 Apr 2024, EGU24-9578, https://doi.org/10.5194/egusphere-egu24-9578, 2024.

EGU24-9674 | ECS | Orals | BG1.4

Linking phosphorus research to impact: advances and challenges in mapping soil phosphorus pools 

Julian Helfenstein, Bruno Ringeval, Federica Tamburini, Daniel S. Goll, Xianjin He, Vera Mulder, Yingping Wang, Edwin Alblas, and Emmanuel Frossard

Improved management of phosphorus (P) is essential for achieving a range of Sustainable Development Goals (SDGs), including maintaining food security, preserving water quality, and mitigating climate change. This requires an integration of comprehensive mechanistic understanding with accurate spatial data. In this interdisciplinary review, we combine insights from empirical P research, digital soil mapping, biogeochemical modeling, and environmental law to critically examine the current state, pinpoint challenges and propose novel pathways for desperately needed P maps. We first elucidate the relevance of spatial data on P for different SDGs. Subsequently, we summarize the current efforts in mapping P pools at regional to global scales, and discuss the challenges of mapping “available P” due to substantial local scale variability and poor correlation with predictors relative to other soil properties. The practical applicability of these recently published maps is tested by evaluating them with independent measurement data. Finally, we outline ways forward to enhance the accuracy and reliability of P maps, as a basis for science-informed management of P resources.

How to cite: Helfenstein, J., Ringeval, B., Tamburini, F., Goll, D. S., He, X., Mulder, V., Wang, Y., Alblas, E., and Frossard, E.: Linking phosphorus research to impact: advances and challenges in mapping soil phosphorus pools, EGU General Assembly 2024, Vienna, Austria, 14–19 Apr 2024, EGU24-9674, https://doi.org/10.5194/egusphere-egu24-9674, 2024.

EGU24-14368 | Orals | BG1.4

Phosphorus Cycling and Transport in Phosphorus Saturated Soils of the Chesapeake Bay Watershed, USA 

Gurpal Toor, Jesse Radolinski, Emileigh Lucas, Charles Burgis, Bradley Kennedy, Fajun Sun, and Patricia Steinhilber

Long-term application of organic products (manure, biosolids, other wastes) and inorganic phosphatic fertilizers have created hot spots of phosphorus (P) saturated soils in intensive animal production regions worldwide. In such regions, P losses from P-saturated (i.e., legacy P) soils continue to plague efforts to improve water quality. Understanding the P cycling and fluxes from these P-saturated soils is critical to advancing our knowledge and developing strategies to manage P in soils and curb P losses. This presentation will discuss P cycling and transport in agricultural catchments (with Maize-Soybean rotation) from the lenses of P chemistry in soils and hydrologic responses from soils to further advancements in managing the P cycle in the soil-plant-water continuum for agricultural sustainability and environmental protection.

How to cite: Toor, G., Radolinski, J., Lucas, E., Burgis, C., Kennedy, B., Sun, F., and Steinhilber, P.: Phosphorus Cycling and Transport in Phosphorus Saturated Soils of the Chesapeake Bay Watershed, USA, EGU General Assembly 2024, Vienna, Austria, 14–19 Apr 2024, EGU24-14368, https://doi.org/10.5194/egusphere-egu24-14368, 2024.

EGU24-14436 | ECS | Orals | BG1.4

Balancing crop production, water quality and the use of finite P reserves by using the soil P sorption capacity in revised fertilizer recommendations 

Maarten van Doorn, Debby van Rotterdam-Los, Gerard H. Ros, and Wim de Vries

Phosphorus (P) is an essential nutrient for plant growth and is applied to agricultural soils in the form of organic manure or inorganic fertilizer. To guide farmers in achieving optimal crop yields, P fertilizer recommendations are in place with the rationale to bring soils to a “target soil P status” following the classic build-up and maintenance approach. The target soil P status where crop yield is not limited by P deficiencies is generally operationalized as the soil P status at which 90-99% of the potential crop yield is found in long-term fertilization field experiments. Though these fertilizer recommendations allow for an economic optimization of crop yield versus P inputs, environmental objectives are barely considered. In our research, we revised the classic build-up and maintenance approach to balance crop production, water quality and the use of finite P reserves. This revision requires insights into the P sorption capacity of soils (PSC) and its saturation with P. We identify the oxalate extraction method as a key component of this approach since it quantifies the PSC from the combined measurement of amorphous iron- and aluminium-(hydr)oxides and the total pool of reversibly bound P. For the Netherlands, we show the implications of the approach for P fertilizer use. We quantified soil amorphous iron- and aluminium(hydr)oxides contents at a 25m resolution across the soil depth profile using a Digital Soil Mapping approach and used these predictions to translate agronomic soil P data to new insights to optimize P fertilizer use. We finally argue that agronomic P target levels should be lowered in soils with a low PSC to decrease the risk of P leaching and in soils with a high PSC to ensure judicious use of finite P reserves.

How to cite: van Doorn, M., van Rotterdam-Los, D., Ros, G. H., and de Vries, W.: Balancing crop production, water quality and the use of finite P reserves by using the soil P sorption capacity in revised fertilizer recommendations, EGU General Assembly 2024, Vienna, Austria, 14–19 Apr 2024, EGU24-14436, https://doi.org/10.5194/egusphere-egu24-14436, 2024.

EGU24-16417 | ECS | Orals | BG1.4

31P NMR Reveals Predominance of Small Molecules in Organic Phosphorus within NaOH-EDTA Soil Extracts 

Lenny Haddad, Andrea Vincent, Reiner Giesler, and Jürgen Schleucher

Organic phosphorus (P) plays a crucial role in maintaining the health and productivity of soils. Understanding the composition of organic phosphorus in soils is thus relevant to a range of disciplines, spanning from agricultural sciences to ecology. Over the past few decades, efforts have been directed towards characterizing and quantifying various soil organic P compounds and determining their turnover rates. Despite these efforts, the precise nature of soil organic P remains unclear, particularly that of orthophosphate monoesters, which dominate 31P NMR spectra of NaOH-EDTA extracts globally.

Typically, the monoester region of 1D 31P NMR spectra appears as a series of sharp signals "sitting" on a broad background where the broad background can account for a substantial part of the monoester region. This is prompting questions about how to integrate and identify these signals and to what extent this fraction may be ecologically important. To investigate this monoester background, we employed 1D 31P NMR and 2D 1H-31P NMR1, along with 31P transverse relaxation (T2)2 measurements to calculate intrinsic linewidths. We related this linewidth to molecular weight to unveil the nature of the observed background. Analysing seven soils from different ecosystems, we observed linewidths ranging from 0.5 to 3 Hz for both resolved monoester signals and the background. This suggests that the background comprises numerous, possibly exceeding 100, sharp signals associated with small (<1.5 kDa) organic P molecules.

Organic P in the form of nucleic acids, phospholipids, P-containing metabolites, and phosphorylated proteins dominate the P content of live leaves, leaf litter and microbial tissues. Furthermore, P-containing metabolites are exuded by roots and are present in a vast array of organisms. Evidence that the background potentially can contain a large number of small metabolites is thus not surprising and may account for an important part of the organic P pool given that the background accounts for about 55% of the monoester region. Our findings warrant further research specifically addressing to what extent this pool may play for plant and microbial P nutrition.

We provide recommendations for treating 31P NMR spectra to accurately quantify phosphomonoester species, representing a crucial step in linking observed P speciation to its bioavailability. Our findings align with previous 31P NMR studies detecting background signals in soil-free samples and new evidence suggesting that alkali-soluble soil organic matter consists of self-assemblies of small organic compounds mimicking large molecules.

1Vestergren, J.; Vincent, A. G.; Jansson, M.; Persson, P.; Ilstedt, U.; Gröbner, G.; Giesler, R.; Schleucher, J. High-Resolution Characterization of Organic Phosphorus in Soil Extracts Using 2D 1H–31P NMR Correlation Spectroscopy. Environmental Science & Technology 2012, 46 (7), 3950–3956. https://doi.org/10.1021/es204016h.

2Vincent, A. G.; Schleucher, J.; Gröbner, G.; Vestergren, J.; Persson, P.; Jansson, M.; Giesler, R. Changes in Organic Phosphorus Composition in Boreal Forest Humus Soils: The Role of Iron and Aluminium. Biogeochemistry 2012, 108 (1), 485–499. https://doi.org/10.1007/s10533-011-9612-0.

How to cite: Haddad, L., Vincent, A., Giesler, R., and Schleucher, J.: 31P NMR Reveals Predominance of Small Molecules in Organic Phosphorus within NaOH-EDTA Soil Extracts, EGU General Assembly 2024, Vienna, Austria, 14–19 Apr 2024, EGU24-16417, https://doi.org/10.5194/egusphere-egu24-16417, 2024.

EGU24-16549 | ECS | Posters on site | BG1.4

A meta-analysis of global soybean plant growth and yield improvement in response to phosphorus addition 

Hannah Walling, Mariana Rufino, Jose Rotundo, Lucas Borras, Shane Rothwell, John Quinton, and Phil Haygarth

Application of phosphorus (P) fertiliser to soybean accounts for a large proportion of the global consumption of P as an agricultural fertiliser. Despite this key a knowledge gap exists surrounding the mechanisms of P fertiliser uptake and how it interacts with nitrogen fixation processes and yield improvements.

This paper aims to improve the understanding of P cycling in global cropping systems and will present a global meta-analysis of published data quantifying the effect of P fertiliser application on soybean above- and below-ground plant response variables. 790 paired observations (P fertiliser treatment and control treatment) were synthesised from 81 peer-reviewed articles that reported soybean response, including seed yield and nodulation, to P addition under a range of different environmental conditions.

We tested the hypothesise that:

  • soybean productivity will increase following P addition, with this response being driven by below-ground processes;
  • environmental conditions, particularly soil chemical properties would explain the variance in the observed response.

Analysis of these observations showed an overarching increase in soybean plant response following P addition. We found that several environmental and experimental conditions, particularly soil phosphorus status and phosphorus fertiliser rate influence the response of soybean to phosphorus addition, highlighting the complexities of sustaining P use across such a globally cultivated crop.

We recommend further experimental work needs to be conducted, which controls for such factors and allows for the improved mechanistic understanding of below-ground processes, to inform better use of finite P resources.

How to cite: Walling, H., Rufino, M., Rotundo, J., Borras, L., Rothwell, S., Quinton, J., and Haygarth, P.: A meta-analysis of global soybean plant growth and yield improvement in response to phosphorus addition, EGU General Assembly 2024, Vienna, Austria, 14–19 Apr 2024, EGU24-16549, https://doi.org/10.5194/egusphere-egu24-16549, 2024.

EGU24-17700 | ECS | Posters on site | BG1.4

Vivianite as a phosphorus sink in estuarine systems: The case study of the Brillantes mudflat, Loire, France 

Mohammed Barhdadi, Aurélia Mouret, Christine Barras, Guillaume Morin, Grégoire Maillet, Matthieu Durand, Meryem Mojtahid, Eric Bénéteau, Nicolas Dubosq, and Edouard Metzger

Phosphorus (P) is a key nutrient controlling primary production in aquatic systems. In coastal systems, the P cycle involves dynamic interactions between terrestrial, aquatic and sedimentary compartments. Over the last century, human activities such as deforestation, intensive agricultural practices and the disposal of municipal and industrial wastes have increased P inputs to coastal ecosystems. As a result, this increase in P inputs has led to an increase in the occurrence of algal blooms and higher oxygen demand in estuaries. In the Loire estuary, dissolved oxygen deficits have been a recurrent and worrying issue for several decades despite the improvement of water quality over the last 30 years due to reduced wastewater discharge and better effluent treatment. In this context, the burial of bioavailable P may influence the recovery of waters from eutrophication. The major P burial phases are apatite, organic P and iron-bound P. The results of sequential chemical extraction and pore water analysis carried out over a 5m-long sediment core from the intertidal Brillantes mudflat in the Loire estuary indicated a greater abundance of the iron-bound P compared to other phases. Iron-bound P occurs in two different forms: phosphorus bound to iron oxides and in the iron phosphate mineral known as vivianite. Vivianite is a ferrous iron phosphate mineral formed under reducing and low sulphate conditions in sediments where organic matter serve as electron donor for ferric iron reduction. Results of sequential chemical extraction of freeze-dried sediment samples combined with pore water data and scanning electron microscope–energy dispersive x-ray spectroscopy (SEM-EDXS) on resin-embedded sediment samples indicated that vivianite-type minerals may act as an important sink for P at the studied site. Authigenic vivianite crystals were found below the shallow sulphate/methane transition zone (SMTZ) at 94 cm depth and contain significant amounts of manganese, as observed in freshwater sediments. We therefore hypothesise that anthropogenic over-fertilization of coastal regions in the last century may have increased the importance of vivianite authigenesis in surface sediments. Consequently, vivianite is likely to be an important sink for P in estuarine systems worldwide.

This study is part of a PhD financed by the European Project Life REVERS’EAU.

How to cite: Barhdadi, M., Mouret, A., Barras, C., Morin, G., Maillet, G., Durand, M., Mojtahid, M., Bénéteau, E., Dubosq, N., and Metzger, E.: Vivianite as a phosphorus sink in estuarine systems: The case study of the Brillantes mudflat, Loire, France, EGU General Assembly 2024, Vienna, Austria, 14–19 Apr 2024, EGU24-17700, https://doi.org/10.5194/egusphere-egu24-17700, 2024.

EGU24-19011 | Orals | BG1.4

Microbial phosphorus limitiation with soil age along a chronosequence on the Galapagos Islands 

Katharina Maria Keiblinger, Sebastian Socianu, Maria Rechberger, Martin Gerzabek, and Franz Zehetner

The Galápagos archipelago, a volcanic island chain, is comprised of a series of progressively older islands with increasingly weathered soils away from the volcanic hotspot. Volcanic soils are known for their high phosphate sorption capacity. In this study, we explore differences in soil microbial abundance and activity across a soil age gradient (1.5 to 1070 ka) to understand how soil microorganisms are affected by soil development, shifting soil characteristics and P sorption over extensive periods.

Basal respiration, substrate-induced respiration and microbial biomass P decreased with soil development, suggesting increasing nutrient limitation for soil microbes. Also, soil enzymatic stoichiometry revealed a limitation driven mainly by P and not by N or C. C- and N-acquiring exoenzyme activities peaked at 26 ka with lower activities in younger and older soils. Phosphatase activity increased with soil age, indicating microbial P limitation in the older soils. This is only partly in line with  P sorption-desorption characteristics along the studied weathering sequence. Phosphate sorption capacity was high in the 4.3 ka soils likely due to amorphous soil constituents. A change towards 2:1-type crystalline clays after 26 ka of soil weathering led to weaker P sorption and stronger desorption, and acidification and increased P occlusion in Al and Fe (hydr)oxides became an important factor for microbial P limitation in the older soils.

Our results reveal striking differences in soil properties on the Galápagos Islands, suggesting relatively little nutrient constraints for soil microbes, despite strong P sorption, in the younger volcanic soils but growing P limitation in the older, highly weathered soils. These observations have important bearings on nutrient cycling and may therefore also affect the evolution of plant and animal species on this unique archipelago.

How to cite: Keiblinger, K. M., Socianu, S., Rechberger, M., Gerzabek, M., and Zehetner, F.: Microbial phosphorus limitiation with soil age along a chronosequence on the Galapagos Islands, EGU General Assembly 2024, Vienna, Austria, 14–19 Apr 2024, EGU24-19011, https://doi.org/10.5194/egusphere-egu24-19011, 2024.

EGU24-20517 | Posters on site | BG1.4

A spatial perspective on internal phosphorus cycling in morphologically complex eutrophic lakes: the importance of stratification 

Tom Jilbert, Siqi Zhao, Jussi Vesterinen, and Juha Niemistö

Many eutrophic lakes suffer from long term accumulation of legacy phosphorus (P) in sediments. Repeated cycling of P between sediments and water column leads to delayed recovery from eutrophication even after abatement of external loading. Moreover, in complex multi-basin lake systems, legacy P can be internally redistributed over time, leading to spatial heterogeneity in regeneration and burial of P and consequent impacts on water quality. Few studies have attempted to map such internal variability in individual lakes in the context of understanding long term recovery from eutrophication. Here we use a combination of sediment trap deployments through one full stratification cycle (May-October 2021), sediment core biogeochemical analyses, and mass balance calculations, to quantify P cycling in Lake Hiidenvesi, a dimictic lake with 5 sub-basins in southern Finland. We show that exchange of P between sediments and water column is more intense in shallow (approximately 0-10 m depth) non-stratified sub-basins, due to both sediment resuspension and diffusive fluxes across the sediment-water interface. In contrast, deeper stratified sub-basins serve as P sinks by promoting sedimentation in relatively quiescent conditions. Due to lateral exchange of water and suspended materials between sub-basins, P is shuttled towards long term burial in deeper, downstream sub-basins. Budget calculations show that net sediment P burial exceeds external loading on the whole-lake scale, indicating a long-term trend towards recovery from eutrophication. However, temporary retention and repeated recycling of legacy P in the shallower upstream sub-basins continues to impact negatively on water quality, despite external loading reductions. The results have implications for understanding the timescales of recovery and for targeting restoration actions aimed at modifying internal P cycling to improve water quality.

How to cite: Jilbert, T., Zhao, S., Vesterinen, J., and Niemistö, J.: A spatial perspective on internal phosphorus cycling in morphologically complex eutrophic lakes: the importance of stratification, EGU General Assembly 2024, Vienna, Austria, 14–19 Apr 2024, EGU24-20517, https://doi.org/10.5194/egusphere-egu24-20517, 2024.

EGU24-21673 | Posters on site | BG1.4

Beyond “Redfield ratio”: Oxygen exchange between water and phosphate can provide insights into carbon dynamics in soils 

Federica Tamburini, Maja Siegenthaler, and Chiara Pistocchi

Phosphorus (P) is essential for cellular metabolism. Many metabolic pathways and processes depend on it, including energy production through ATP, DNA and RNA synthesis, and protein phosphorylation during post-translational signaling adaptation.

In marine sediments and oceanic water, the stoichiometric ratio between carbon and phosphorus has been found to vary with latitude, but in algae and phytoplankton, which are responsible for primary production and CO2 uptake from the atmosphere, this ratio is relatively constant. This constant ratio is known as the Redfield ratio and  it is often used as a constraint in modeling.

In soils, where microorganisms control nutrient cycling and consequent carbon sequestration, the C:P is more variable both in soil and microbial biomass. First, microorganisms exhibit a wide range of metabolic adaptations to environmental pressure, and the physical and mineralogical properties of the soil play a significant role in nutrient control, e.g. through sorption/desorption reactions. Due to these complexities, using nutrient ratios for modeling soil organic carbon dynamics and predicting the impact of anthropogenic influences on global changes is challenging. Is it possible to find a connection between carbon and phosphate that encompasses the "Redfield" ratio and reflects their tight link in cellular metabolism?

By examining the oxygen isotope composition in inorganic phosphate (δ18O-Pi), we can determine the extent of oxygen exchange between water and phosphate, which is controlled by biological processes. Intracellularly, this exchange occurs through phosphoryl transfer, a fundamental process in cellular phosphate cycling. 

During the last 10 years, we conducted a series of incubation experiments where we measured CO2 respiration and δ18O in resin and microbial cytosolic phosphate in soils from different environments. These incubations were performed with waters of varying 18O isotopic composition. By analyzing δ18O in microbial cytosolic phosphate at the beginning and end of the incubation, we could measure the level of oxygen exchange between water and phosphate.

Comparing the results from these incubations, we observed a significant correlation between the percentage of oxygen exchange and the cumulative CO2 respired during the incubation. This correlation was consistent  through different soil ages, mineralogy, phosphate levels, and incubation length. When normalizing the percentage of oxygen exchange to moles of oxygen exchanged per moles of carbon respired, it appears that for every mole of oxygen exchanged due to phosphoryl transfer, there is a nearly fixed amount of carbon respired. This suggests that the moles of oxygen exchanged through phosphoryl transfer recorded in soil microbial phosphate can provide information about metabolic carbon expenditure.

This finding would provide new insights on the link between P and C in soil microbial biomass. The controlled nature of the incubation experiments may not fully reflect the biological activity in soil environments, so it would be necessary to perform field-based incubation experiments to confirm the link between carbon respiration and phosphorus microbial cycle. This information could potentially improve our understanding of carbon dynamics and be used for further modeling purposes.

How to cite: Tamburini, F., Siegenthaler, M., and Pistocchi, C.: Beyond “Redfield ratio”: Oxygen exchange between water and phosphate can provide insights into carbon dynamics in soils, EGU General Assembly 2024, Vienna, Austria, 14–19 Apr 2024, EGU24-21673, https://doi.org/10.5194/egusphere-egu24-21673, 2024.

EGU24-21972 | Posters on site | BG1.4

Exploring spatial distribution and characterization of inorganic and organic phosphorus in temperate soils using NanoSIMS  

Kaiyu Lei, Franziska Barbara Bucka, Carmen Höschen, Yahan Hu, and Ingrid Kögel-Knabner

For a comprehensive understanding of the phosphorus (P) storage and cycling in temperate soils, it is necessary to explore further the bonding pathways of organic P (Po) and inorganic P (Pi) to mineral surfaces and soil organic matter (SOM), and their interconnections with organic carbon (OC) at a micro-scale other than conventional bulk analysis. In the past decade, nanoscale secondary ion mass spectrometry (NanoSIMS) has been increasingly recognized as a promising imaging technique to understand soil biogeochemical processes, particularly in exploring organo-mineral associations in soils at the microscale (Mueller et al., 2023). However, its application in studying P, and the identification and distinction of Po and Pi remains challenging, hindering a comprehensive understanding of the P cycling in soils.

In our study, four temperate soil types, including Cambisol, Luvisol, Phaeozem and Fluvisol, were taken from Bavarian Forest in South-East Germany. The pH of these soils ranges from 5.4 to 6.3, with poor to medium P stocks but distinct Po stocks in fine fractions (<20 μm). Previous bulk studies have hinted at different pathways in P bonding to mineral surfaces and SOM. NanoSIMS was employed to further explore and visualize these bonding pathways. Recent advancements in NanoSIMS technology, particularly improved O- sources for cation detection and the capability for 31P- and 31P16O2- detection enable us to identify and distinguish Po and Pi at a microscale by 31P16O2-/31P- ratio, in which a lower ratio in specific areas corresponds to a more dominant presence of Po, and vice versa.

From NanoSIMS images, preliminary results reveal that a proportion of Po associates with either clay minerals or Fe (hydr)oxdies without assimilating into SOM. This Po fraction is suspected to originate from highly decomposed SOM, where N has either been assimilated by microorganisms or leached away, and Po is stabilized to mineral surfaces due to strong bonding strength. In contrast, the Po assimilated into SOM is associated with various cations, including Ca, Al and Fe, which may suggest the origin from particulate organic matter. Interestingly, the fine plant residue is depleted in Po in the fine fraction.

In conclusion, our study provides valuable insights into distinguishing different bonding pathways of these P forms within clay minerals, Fe (hydro)oxides, and SOM by using advanced NanoSIMS data, and emphasizes the interconnection with OC and Po and Pi in the fine fraction.

Reference: Mueller, C. W., Hoeschen, C., Koegel-Knabner, I., 2023. Understanding of soil processes at the microscale—Use of NanoSIMS in soil science. Encyclopedia of Soils in the Environment (Second Edition). Elsevier. 10.1016/B978-0-12-822974-3.00045-8

How to cite: Lei, K., Bucka, F. B., Höschen, C., Hu, Y., and Kögel-Knabner, I.: Exploring spatial distribution and characterization of inorganic and organic phosphorus in temperate soils using NanoSIMS , EGU General Assembly 2024, Vienna, Austria, 14–19 Apr 2024, EGU24-21972, https://doi.org/10.5194/egusphere-egu24-21972, 2024.

EGU24-22214 | Orals | BG1.4

Heterogeneous Dissolved Organic Phosphorus Composition and Bioavailability in Marine Systems 

Sonya Dyhrman, Kathleen Ruttenberg, Danielle Hull, and Sherril Leon Soon

The critical role of Dissolved Organic Phosphorus (DOP) in supporting primary production has spurred efforts to characterize DOP composition so that insight may be gained into its bioavailability and cycling in aquatic systems. The degree to which DOP is bioavailable to primary producers will determine, in part, the extent of carbon uptake and sequestration.  Ascertaining DOP composition has proven to be an analytically challenging endeavor.  As a consequence, the DOP pool remains poorly characterized, and our predictive power relative to DOP-bioavailability, and coupled carbon cycling, remains limited. Analytical impediments to characterizing DOP composition in natural waters include its low concentration, requiring pre-concentration before compositional features can be probed via spectroscopy, and the fact that organic phosphorus compounds are not easily amenable to standard organic geochemical approaches, such as chromatographic or mass spectrophotometric methods, particularly in salt water. While 31-Phosphorus Nuclear Magnetic Resonance (31P-NMR) spectroscopy has provided intriguing information on the distribution of the 2 major DOP compound types (phosphoesters, phosphonates), the crucial question of DOP bioavailability cannot be addressed by this method. We present novel DOP molecular weight distribution and bioavailability data, generated using a coupled sequential ultrafiltration-bioavailability approach from a marine water column depth profile and locations across a gradient in phosphate concentration in the Atlantic and Pacific Oceans.  There is substantial compositional variability in the marine DOP pool, both in the pattern of DOP molecular weight distribution at different sites, as well as the distribution of bioavailable mono- and diesters of phosphate across molecular weight fractions.  In some cases, a substantial fraction of DOP in different molecular weight size classes is non-reactive to the two enzymes used to assay potential bioavailability, raising the interesting possibility of non-bioavailable DOP. The significance of recognizing that the oceanic DOP pool is compositionally heterogeneous, and variably bioavailable, lies in that fact that such information is a prerequisite to building ecosystem models that capture the influence of P biogeochemistry on primary production and carbon cycling in aquatic systems.

How to cite: Dyhrman, S., Ruttenberg, K., Hull, D., and Leon Soon, S.: Heterogeneous Dissolved Organic Phosphorus Composition and Bioavailability in Marine Systems, EGU General Assembly 2024, Vienna, Austria, 14–19 Apr 2024, EGU24-22214, https://doi.org/10.5194/egusphere-egu24-22214, 2024.

EGU24-625 | ECS | Posters on site | BG4.2

Developing the First National Blue Carbon Inventory for the Isle of Man 

Hannah Muir, Jacqui Keenan, Rowan Henthorn, James Strong, David G. Reading, Peter Duncan, Martin W. Skov, Jan G. Hiddink, Richard K. F. Unsworth, Phillip E. Warwick, and Claire Evans

Temperate coastal ecosystems including seagrass, saltmarsh, and shelf-sea sediments are natural, long-term ‘blue carbon’ (BC) sinks, with the potential to be managed for carbon storage and sequestration. These BC hotspots could help offset unavoidable greenhouse gas emissions and contribute to nations' Net Zero ambitions. The Isle of Man, a self-governing British Crown Dependency situated in the Irish Sea, has territorial waters equivalent to approximately 85% of its total jurisdiction. The island's Government is actively developing a comprehensive BC management plan aimed at maximising carbon sequestration and restoring seabed biodiversity and ecosystem services.

To inform the management plan, sediment cores were collected from three major BC habitats around the Isle of Man: seagrass, saltmarsh, and shelf-sea sediments. The cores were analysed using elemental analysis and isotope ratio mass spectrometry to quantify organic and inorganic carbon stores. Radioanalytical methods were employed to measure radionuclides (137Cs, 210Pb, 241Am, and 210Po), which were used to determine sedimentation rates and subsequently carbon accumulation rates. Complementary analyses, including grain size analysis, X-ray fluorescence, X-ray scans, and high-resolution imagery, provide a holistic understanding of the chemical, physical, and biological attributes of the sedimentary cores, illuminating the processes influencing BC storage. Furthermore, side scan sonar, drop-down video, and drone imagery have been used to assess the extent of existing seagrass meadows, which is central to informing spatial-management strategies, particularly in the establishment of seagrass conservation zones.

Our findings will help to develop the first national BC inventory for the Isle of Man and set a precedent for co-designed, collaborative, evidence-informed approaches for the sustainable management of coastal ecosystems.

How to cite: Muir, H., Keenan, J., Henthorn, R., Strong, J., Reading, D. G., Duncan, P., Skov, M. W., Hiddink, J. G., Unsworth, R. K. F., Warwick, P. E., and Evans, C.: Developing the First National Blue Carbon Inventory for the Isle of Man, EGU General Assembly 2024, Vienna, Austria, 14–19 Apr 2024, EGU24-625, https://doi.org/10.5194/egusphere-egu24-625, 2024.

EGU24-636 | ECS | Orals | BG4.2

Abandoned tidal channels as hotspots of Blue Carbon 

Alice Puppin, Davide Tognin, Massimiliano Ghinassi, Andrea D'Alpaos, and Alvise Finotello

Tidal marshes, recognized as “Blue Carbon ecosystems” for their high carbon sequestration rates, owe their carbon storage potential to primary production and rapid surface accretion driven by complex feedbacks among hydrodynamic, morphological, and biological processes. Tidal channel networks cutting through tidal wetlands exert a first-order control on ecogeomorphological dynamics by critically controlling fluxes of nutrients, sediments, and particulate matter. Although these networks have been traditionally seen as stable features, recent studies have shown that they are in fact highly dynamic systems. In particular, lateral channel migration, coupled with high drainage density, leads to frequent channel abandonment through meander cutoffs and channel piracies (i.e., stream captures). These processes significantly impact sediment dynamics, since reduced flow velocities within abandoned channels promote particle settling and channel infill, thereby providing ideal conditions for rapid organic matter deposition and trapping.

To characterize the depositional processes occurring in abandoned tidal channels and investigate their role in blue carbon sequestration and storage, we analysed several sediment cores retrieved from abandoned tidal channels in the microtidal Venice Lagoon, Italy. Cores were sampled every 5 cm for soil dry bulk density, organic matter, and organic carbon content. Organic matter content was estimated as the difference in weight before and after the Loss-On-Ignition (LOI), while organic carbon was directly measured using an elemental analyser. Sedimentary facies analyses allowed for identifying the deposits accumulated during the abandonment phase, while aerial and satellite image analyses facilitated the evaluation of the temporal evolution of the channel infill process, enabling the estimation of the related infill rate. Combining infill rate and organic carbon density, we estimated the carbon accumulation potential of abandoned tidal channels, as well as its variability, comparing it to surrounding marshes.

Preliminary results show that even if channel fill deposits are characterized by slightly lower organic matter content relative to marsh deposits, they feature significantly higher carbon accumulation rates owing to higher sediment deposition rates. These findings suggest that abandoned tidal channels could represent key hotspots for blue carbon accumulation. Consequently, a better understanding of depositional processes and carbon accumulation in abandoned tidal channels, as well as their characteristic spatiotemporal dynamics, can critically enhance the assessment of blue carbon sequestration and stock in coastal wetlands, providing crucial insights for effective conservation and restoration strategies.

How to cite: Puppin, A., Tognin, D., Ghinassi, M., D'Alpaos, A., and Finotello, A.: Abandoned tidal channels as hotspots of Blue Carbon, EGU General Assembly 2024, Vienna, Austria, 14–19 Apr 2024, EGU24-636, https://doi.org/10.5194/egusphere-egu24-636, 2024.

EGU24-863 | ECS | Orals | BG4.2

Exploring Macroalgal Carbon Dynamics in a Changing Climate of Arctic Fjords 

Mayuri Rabha, Biswajit Roy, and Archana Singh

The rapidly warming Arctic, exceeding global averages, experiences heightened macroalgal growth in high Arctic fjords due to rising seawater temperatures and reduced sea ice. However, uncertainties surround the consequences of climate-induced changes in the carbon cycle resulting from extensive macroalgal growth and increased carbon flux dynamics in these fjords. This study examines the fate of macroalgal-derived fatty acids (Saturated Fatty Acid: SFA, Monounsaturated Fatty Acids: MUFA and Polyunsaturated Fatty Acids: PUFA) across Kongsfjorden and Krossfjorden (Ny-Alesund) in response to Arctic amplification. For this study, dominant brown, green, and red macroalgal species (n=20), along with sediment samples (n=18) across the fjords, were collected during summer 2022. Brown algae dominated with the highest average fatty acid concentration 435.72 ±534.14 μg/g, while red and green algae had lower concentrations 72.84 ±52.75 μg/g and 90.25 ± 84.67 μg/g, respectively. Brown algae exhibited a concentration trend of SFA>MUFA>PUFA, while green and red showed SFA>PUFA>MUFA. The primary PUFA in these algae were n-C18 and n-C20, and filamentous growth forms exhibited higher levels compared to thallus or short/dwarf forms in green and red algae. However, brown algae, except for the genus Chorda, did not exhibit clear trends for these compounds. The distinct phylogenetic position of brown algae from red and green algae likely accounts for these divergent patterns. The filamentous form having the highest concentration of fatty acids could result from increased resistance to degradation, attributed to their minimized surface-to-volume ratio. Macroalgal species outside their natural habitat (ex-situ) had higher PUFA, MUFA, and SFA concentrations, likely due to unfavourable conditions of growth in intertidal regions, suggesting enhanced adaptation for growth across the arctic fjords. While in the sediments, a significant (~50%) reduction in the PUFA and MUFA fraction concerning SFA was observed. The transport of the algal material was more towards the outer fjord and was possibly favoured by glacial melting and runoff activities. The decrease in fatty acids derived from algae, coupled with the presence of iso- and anteiso- branched-chain fatty acids, implies limited residence and faster turnover of algal matter into intermediate metabolites by microorganisms, possibly bacteria. Such observation suggests a potential release of carbon fluxes into the atmosphere through degradation of lipids, and contributing to a negative trend in the macroalgal-induced carbon storage in fjords.


How to cite: Rabha, M., Roy, B., and Singh, A.: Exploring Macroalgal Carbon Dynamics in a Changing Climate of Arctic Fjords, EGU General Assembly 2024, Vienna, Austria, 14–19 Apr 2024, EGU24-863, https://doi.org/10.5194/egusphere-egu24-863, 2024.

EGU24-1793 | Orals | BG4.2

Impacts of demersal fishing on sedimentary organic matter: a global meta-analysis. 

Marija Sciberras, Sarah Paradis, Justin Tiano, Emil De Borger, Clare Bradshaw, Claudia Morys, Antonio Pusceddu, Claudia Ennas, Karline Soetaert, Pere Puig, and Pere Masque

Marine sediments represent a hot spot of ecosystem services, but their integrity is increasingly put at risk by anthropogenic disturbance, most notably by demersal fisheries. The need for global action to minimize the impacts of destructive fishing techniques on the marine environment is urgent. The urgency to act, however, needs to be met with caution, as scientists are pushed for action, global predictions of trawling impacts are tempting, yet poor validation and oversimplified assumptions can lead to large uncertainties. We visit the scientific literature on trawl studies to map out current evidence from the literature and report on a global meta-analysis to quantify the effects of demersal fishing on sedimentary and biogeochemical properties. 

Studies examining the direct impacts of bottom fishing revealed significant reductions in total organic carbon (TOC; -10%), chlorophyll-a (Chl-a, -10%), phaeopigments (-21%) and proteins (-24%), and largest impact was detected on surficial sediment (0-2 cm). Implications of methodological biases as a result of inappropriate sampling in trawl studies and the importance of context-dependency for effect size is flagged up. Environmental parameters such as bottom current velocity and surface primary productivity significantly influenced both the direction and magnitude of fishing effects. We highlight where the lack of evidence lies that might create bias in regional and global models that require empirical data for validation. The objective is to summarize current knowledge and to direct future studies towards more robust analysis of the impacts of bottom trawling, which will provide a basis of sound advice to fisheries managers and policy makers.

How to cite: Sciberras, M., Paradis, S., Tiano, J., De Borger, E., Bradshaw, C., Morys, C., Pusceddu, A., Ennas, C., Soetaert, K., Puig, P., and Masque, P.: Impacts of demersal fishing on sedimentary organic matter: a global meta-analysis., EGU General Assembly 2024, Vienna, Austria, 14–19 Apr 2024, EGU24-1793, https://doi.org/10.5194/egusphere-egu24-1793, 2024.

EGU24-3088 | ECS | Orals | BG4.2

Effect of addition of organic carbon on greenhouse gas release and subsurface biogeochemistry in salt marshes 

Nora Kainz, Franziska Raab, Andreas Kappler, and Prachi Joshi

Vegetated coastal wetlands – comprising mangroves, salt marshes, and seagrass meadows – play an important role in the global carbon cycle due to their high sequestration rates of carbon (annual organic carbon burial rate 114-131 Tg C). The decomposition of organic carbon by microorganisms in these ecosystems causes greenhouse gas releases such as carbon dioxide (CO2) and methane (CH4). Understanding the rate and extent of microbially mediated greenhouse gas formation from coastal wetlands under current climate conditions is needed to predict greenhouse gas fluxes from these ecosystems with future climate change. Here, we investigate the processes that control the microbial decomposition of organic carbon at the Wadden Sea, northern Germany. Our preliminary field and laboratory results indicate that the degradation of organic carbon is not limited by the availability of electron acceptors such as sulfate, but rather by the concentrations and composition of the organic carbon itself. The objective of this project was therefore to test how the microbially mediated degradation of organic carbon and thus greenhouse gas fluxes change as a consequence of organic carbon input to the sediment. To do this, we conducted a field experiment in which we injected two different organic carbon sources separately into the sediment of the Wadden Sea and measured greenhouse gas fluxes over the course of six weeks. We choose acetate as a relatively labile organic carbon source and humic acids (purchased from the International Humic Substance Society) as a recalcitrant source. The in situ experiment was performed at two locations with differing tidal influence: (i) tidal flats, which are inundated twice a day during high tide, and (ii) pioneer marshes, which are inundated twice a month during spring tide. In addition to flux measurements, porewater, and sediment were sampled and used to study geochemical processes. For both marsh zones, an enhanced CO2 flux was measured for the plots where labile organic carbon was injected relative to control plots in which no organic carbon was added. However, the addition of the recalcitrant organic carbon only caused an increase in the CO2 flux in the tidal flat. Porewater data showed that the addition of the labile organic carbon promoted iron(III) reduction, especially in the pioneer marsh, while for the tidal flat, enhanced sulfate reduction was observed for both organic carbon sources. Overall, a significantly higher CO2 flux was measured from plots enriched with labile organic carbon. The gained knowledge is important in the context of predicting how such an ecosystem reacts to an additional input of organic matter e.g., caused by eutrophication or mobilization of organic matter. Furthermore, it is also relevant for estimating the extent and rate of greenhouse gas fluxes from these ecosystems.

How to cite: Kainz, N., Raab, F., Kappler, A., and Joshi, P.: Effect of addition of organic carbon on greenhouse gas release and subsurface biogeochemistry in salt marshes, EGU General Assembly 2024, Vienna, Austria, 14–19 Apr 2024, EGU24-3088, https://doi.org/10.5194/egusphere-egu24-3088, 2024.

EGU24-5089 | Orals | BG4.2 | Highlight

Substantial amounts of organic carbon are accumulated and stored in surface sediments of the Norwegian continental margin 

Markus Diesing, Sarah Paradis, Henning Jensen, Terje Thorsnes, Lilja Bjarnadóttir, and Jochen Knies

To keep the global average temperature rise well below 2°C requires drastic emission reductions and a removal of carbon dioxide (CO2) from the atmosphere. It has been suggested that part of the CO2 removal could be achieved by nature itself, if ecosystems that remove substantial amounts of carbon from the atmosphere are protected, managed, or restored. In the marine environment, the focus has so far been placed on coastal ecosystems with rooted vegetation (saltmarshes, mangroves, and seagrass beds), as they sequester carbon at high rates, are threatened by human activities and are amenable to management. Collectively, these are called actionable Blue Carbon ecosystems. More recently, other ecosystems such as marine sediments have been put forward, but these are currently considered emerging Blue Carbon ecosystems, as knowledge gaps do not allow us to decide yet, whether they are actionable or not. To help close some of the existing knowledge gaps we applied machine learning to spatially predict the amount of organic carbon that is stored in sediments of the Norwegian continental margin and the rates at which it is accumulated. We found that Norway has 100 times more organic carbon stored in its surficial (0 – 0.1 m sediment depth) seabed sediments than in its vegetated coastal ecosystems (0 – 1 m sediment depth). Rates of organic carbon accumulation vary spatially and are highest in depressions of the continental shelf that were carved out by glaciers during the last ice age. These so-called glacial troughs are found on the formerly glaciated continental margins of North America, Eurasia, south America, and Antarctica, covering an area ten times larger than that we mapped and might be important places of organic carbon accumulation globally. To improve our estimates of how much carbon accumulates in marine sediments at a global scale will require a) data on organic carbon content, dry bulk density and sediment accumulation rates of sufficient quality and quantity, b) relevant predictor variables of global coverage and sufficient resolution, and c) predictive spatial models that consider the complex nature of continental margins, where centres of organic carbon accumulation and cycling might be found in close proximity to each other. Based on improved global estimates of organic carbon stocks, accumulation rates and the release of CO2 due to anthropogenic disturbance (demersal fisheries, seafloor cables, offshore wind farms, deep-sea mining etc.) it should be possible to decide whether marine sediments can be considered actionable Blue Carbon ecosystems.

How to cite: Diesing, M., Paradis, S., Jensen, H., Thorsnes, T., Bjarnadóttir, L., and Knies, J.: Substantial amounts of organic carbon are accumulated and stored in surface sediments of the Norwegian continental margin, EGU General Assembly 2024, Vienna, Austria, 14–19 Apr 2024, EGU24-5089, https://doi.org/10.5194/egusphere-egu24-5089, 2024.

EGU24-5362 | Posters on site | BG4.2 | Highlight

A global inventory of shelf sea carbon 

Sophie Ward, James Scourse, Zoe Roseby, and Sarah Bradley

The ocean is known to be a vast and globally important carbon sink and there is an urgent need to better understand the role played by shelf sea sediments in the ocean carbon cycle. Organic carbon is preferentially stored in marine muds, the deposition of which has predominantly been dictated by bottom currents controlled by waves and tides. Through numerical modelling to predict carbon accumulation, alongside data mining and synthesis, we aim to make a first-order approximation of global carbon stocks in shelf sea sediments. We are developing new high resolution numerical models to simulate the timing and distribution of carbon-rich mud accumulations across global shelf seas. These models will reconstruct current flows near the seabed driven by the tides and waves, for the period since the Last Glacial Maximum (approximately 22,000 years ago). We incorporate dynamic palaeo-topographies from the latest regional glacial isostatic adjustment models, as well as adopting the novel approach of palaeo-wave modelling (forced by palaeo-wind datasets). The simulated hydrodynamics will be used to estimate where accumulation of fine sediments may occur on shelf seas. These synthetic maps of fine sediment deposits will be constrained and validated using observational data from sediment samples (e.g., data on sediment grain size and carbon content). Radiocarbon age-constrained samples from shelf sea sediment cores will then be used to test the validity of the model predictions for estimating accumulations of carbon-rich sediments over thousands of years. As this work considers potential mud accumulation – and carbon stocks - within muddy basin fills, it builds upon existing works which to date have primarily focused on surface sediment. This novel global inventory of shelf sea carbon stocks will inform global carbon budgets and protection- and restoration efforts of these globally significant blue carbon stocks.

How to cite: Ward, S., Scourse, J., Roseby, Z., and Bradley, S.: A global inventory of shelf sea carbon, EGU General Assembly 2024, Vienna, Austria, 14–19 Apr 2024, EGU24-5362, https://doi.org/10.5194/egusphere-egu24-5362, 2024.

There is ongoing debate on the influence of human activities on the marine carbon cycle, their potential impacts on climate and resulting implications for marine spatial management. In order to gauge the efficacy of different management options, we estimate the contributions of three direct human impacts on particulate organic carbon in the North Sea: material dumping, marine aggregate mining and bottom trawling. While dumping and mining are considered in a budgetary manner based on existing data, the impacts of bottom trawling are simulated using a high-resolution 3D ocean and sediment models. Several future scenarios of fishing closures and redistribution of effort are considered and their potential climate impacts discussed. Our results indicate that the impacts of sand mining are negligible, while both material dumping and bottom trawling can alter the sequestration capacity of carbon in the North Sea significantly. In the case of bottom trawling, we show that through targeted design of fishing closure zones, the impacts could be greatly reduced without the need to change the overall trawling effort.

How to cite: Porz, L. and Zhang, W.: Estimates of human influence on North Sea sedimentary carbon - Current impacts and future scenarios , EGU General Assembly 2024, Vienna, Austria, 14–19 Apr 2024, EGU24-5772, https://doi.org/10.5194/egusphere-egu24-5772, 2024.

EGU24-5777 | ECS | Posters on site | BG4.2

Sedimentation rate decrease in the Skagerrak and its implication for human and natural impacts in the North Sea 

Timo Spiegel, Andrew W. Dale, Nina Lenz, Mark Schmidt, Michael Fuhr, Habeeb Thanveer Kalapurakkal, Matthias Moros, Sebastian Lindhorst, Hendrik Wolschke, Sabine Kasten, Martin Butzin, Gesine Mollenhauer, Daniel Mueller, and Klaus Wallmann

Since industrial times, human and natural processes have affected the sediment system of the North Sea. As a substantial proportion of the suspended sediment in the North Sea is ultimately deposited in the Skagerrak, it offers a representative archive for reconstructing the temporal variability of the North Sea sediment system. However, little is known about how sedimentation rates in the Skagerrak may have changed over time. In this study, we present high-resolution age-depth models based on the natural radionuclide 210Pb and the anthropogenic time markers 137Cs, 14C and mercury to determine average sedimentation rates before and after the year 1963 at six stations in the Skagerrak. This year was selected because its age-depth relationship was clearly reflected by peak activities or concentrations in the sedimentary data of the time markers. The main result of this study is a consistent decrease in sedimentation rates at all stations. On average, sedimentation rates decreased from 0.36 to 0.15 cm yr-1, suggesting a substantial alteration of the North Sea sediment system. We tentatively discuss possible driving factors including a shift in the North Sea circulation pattern, increased sediment deposition in the Wadden Sea, and reduced sediment inputs into the North Sea due to coastal protection and river damming. In terms of the overall North Sea sediment cycle, these processes may outweigh the effects of sediment resuspension by human activities and storm events, as well as temperature, humidity and sea level rise caused by climate change.

How to cite: Spiegel, T., Dale, A. W., Lenz, N., Schmidt, M., Fuhr, M., Kalapurakkal, H. T., Moros, M., Lindhorst, S., Wolschke, H., Kasten, S., Butzin, M., Mollenhauer, G., Mueller, D., and Wallmann, K.: Sedimentation rate decrease in the Skagerrak and its implication for human and natural impacts in the North Sea, EGU General Assembly 2024, Vienna, Austria, 14–19 Apr 2024, EGU24-5777, https://doi.org/10.5194/egusphere-egu24-5777, 2024.

EGU24-6380 | Orals | BG4.2

Locally refined spatial predictions of marine sediment carbon stocks from legacy data 

Mark Chatting, Markus Diesing, Anthony Grey, Brian Kelleher, and Mark Coughlan

The recent “30 by 30” global initiative to protect 30% of the world’s land and ocean by 2030 has increased the need for marine spatial planning decisions to be grounded in locally relevant empirical evidence. Continental shelves play a key role in the cycling of carbon, where marine sediments can act as an important sink of organic carbon (OC). As a result, marine sediments storing carbon have attracted recent scientific attention to elucidate the amount of OC stored and mechanisms influencing its sequestration. Spatial models of marine sediment OC stocks have previously been developed and provide preliminary estimates of standing stocks over wide geographical scales. However, these broad-scale predictions are derived from models of broad scale environmental regimes, which makes them unlikely to capture local spatial variations in environmental conditions and subsequently local variations in OC, reducing their utility for local scale marine spatial planning decisions. This study aims to determine whether legacy data could be used to produce local scale spatial predictions of OC relevant for policy makers. To achieve this aim, local scale predictors relevant for OC were produced/sourced in order to predict local-scale marine sediment OC in the Irish Sea. Legacy data of bottom water temperature (BWT) and bottom water salinity (BWS) measurements were used to bias correct and downscale global models of BWT and BWS. Recently developed high resolution sediment properties (% mud, % sand and % gravel) and locally developed Sediment Mobility and Sediment Disturbance Indices (SMI and SDI, respectively) were also sourced as potential predictors. Public-good, environmental consultancy and government agency repositories were also searched for OC-content data. A Random Forest model was trained to predict OC-content on localised predictors as well as previously identified important predictors of marine sediment OC. The outputs from the localised model were compared to one that was trained on broad-scale predictors to determine the change in model performance and utility for making local scale predictions. This study highlights the value of legacy data in contributing to locally refined spatial predictions of OC-content relevant for marine spatial planning decisions.

How to cite: Chatting, M., Diesing, M., Grey, A., Kelleher, B., and Coughlan, M.: Locally refined spatial predictions of marine sediment carbon stocks from legacy data, EGU General Assembly 2024, Vienna, Austria, 14–19 Apr 2024, EGU24-6380, https://doi.org/10.5194/egusphere-egu24-6380, 2024.

EGU24-7002 | Orals | BG4.2

Carbon Stocks and Greenhouse Gas Emissions (CO2 and CH4) in Mangrove Forests and Aquaculture Ponds in East Kalimantan, Indonesia   

Nisa Novita, Adibtya Asyhari, Chandra Agung Septiadi Putra, Adi Gangga, Rasis Ritonga, Aji Anggoro, Topik Hidayat, Yiwei Yang, Allison Lewin, and Muhammad Ilman

Mangroves, as part of the blue carbon ecosystem, are considered a cost-effective nature-based solution pathway to help mitigate climate change and achieve the Paris Agreement’s aim to limit warming to 1.5˚C. The accurate quantification of greenhouse gas (GHG) emissions and carbon accounting has become a key challenge for policymakers and scientists addressing climate change.  Globally, Indonesia emits the highest potential CO2 emissions from soils in the mangrove ecosystems because of its high rates of mangrove losses in recent decades. Unfortunately, there are limited studies on carbon and GHG emissions from Indonesian mangroves. This study aims to quantify carbon loss due to mangrove conversion due to aquaculture development by combining carbon stocks and GHG emissions data located in Tabalar Muara Village, Berau, East Kalimantan, Indonesia. We collected data from aboveground (vegetation, downwood) and belowground (roots and soil) carbon stocks in five and three transects of mangrove forests and aquaculture ponds, respectively. Soil bulk density and carbon concentration in various soil depth intervals were also analyzed. In addition, we conducted three consecutive days of regular monthly monitoring of CO2 and CH4 fluxes associated with soil physicochemical properties in mangrove forests and aquaculture ponds from January – December 2023. Total ecosystem carbon stocks in mangrove forests and aquaculture ponds were 926 ± 20 and 658 ± 45 Mg C ha−1, respectively. Thus, it implies 984 Mg CO2 ha−1 of potential carbon loss during mangrove forest conversion to aquaculture ponds. Soil carbon stocks between 0 and 300 cm depth varied significantly, where carbon stock in aquaculture ponds (658 Mg C ha−1) was 18% lower than in mangrove forests (777 Mg C ha−1). Soil carbon dominates total ecosystem carbon stocks by up to 88% in mangrove forests.  For GHG fluxes, mangrove forests have six times higher heterotrophic CO2 emissions (79.44 ± 4.47 Mg CO2 ha-1 yr-1) compared to that from the aquaculture ponds (13.88 ± 0.88 Mg CO2 ha-1 yr-1). The annual total CH4 flux was 17 times higher in mangrove forests (7.72 ± 0.50 Mg CO2e ha-1 yr-1) than in aquaculture ponds  (0.46 ± 0.04 Mg CO2e ha-1 yr-1). The results of this research are useful to refine GHG emissions accounting on mangroves by providing higher Tier of emission factors to fulfill Indonesia’s Enhanced Nationally Determined Contributions.

How to cite: Novita, N., Asyhari, A., Putra, C. A. S., Gangga, A., Ritonga, R., Anggoro, A., Hidayat, T., Yang, Y., Lewin, A., and Ilman, M.: Carbon Stocks and Greenhouse Gas Emissions (CO2 and CH4) in Mangrove Forests and Aquaculture Ponds in East Kalimantan, Indonesia  , EGU General Assembly 2024, Vienna, Austria, 14–19 Apr 2024, EGU24-7002, https://doi.org/10.5194/egusphere-egu24-7002, 2024.

EGU24-8634 | ECS | Posters on site | BG4.2

Assessing the influence of consolidation in marine sediment cores for Blue Carbon quantification 

Phoebe Walsh, Mike Long, Anthony Grey, Rasmus Svendsen, and Mark Coughlan

Blue Carbon traditionally refers to carbon buried and stored in coastal or terrestrial environments such as mangrove forests and seagrass meadows. However, marine sediments, like clays and sands, found on continental shelves, are increasingly being recognised as important Blue Carbon settings and are being included in national marine management plans.  To fully understand the importance of such environments and its potential to mitigate against climate change, a thorough understanding of the quantification of the carbon stored is required. This is performed through the analysis of marine sediment cores. 


Marine sediment cores are typically extracted by forcing a PVC pipe into the seafloor through varied methodologies. During the extraction process, the method itself can have adverse effects  on the sediment, including causing changes in profile integrity resulting in a shortening of the core profile through consolidation. This can increase the dry bulk density of the sediment, which is an important parameter in calculating carbon stock, resulting in an overestimation of results. There is a paucity of studies regarding the impacts these effects can have on the quantification of Blue Carbon in marine sediments. 


In this study, a set of cores were gathered from the same geographical location using three different offshore coring techniques, namely: gravity coring, vibro coring and box coring. These techniques are standard in offshore site investigations. Samples from these cores were used to assess the extent of the impact of consolidation on quantifying carbon stock measurements in marine sediments through several geotechnical techniques. These include evaluating parameters that directly influence consolidation in marine sediments, such as moisture content, Atterberg limits and particle size. Additionally, compressibility measurements, through oedometer testing, can help elucidate to what degree compaction may have taken place. Carbon stocks are calculated using total organic carbon and loss on ignition measurements, which will be compared across profiles from different coring techniques. Similarly, accumulation rates calculated using gamma spectrometry (e.g. 210Pb) allow for comparison across core profiles. These tests were performed across the three offshore coring techniques to determine which method of core extraction is optimal for Blue Carbon quantification.

How to cite: Walsh, P., Long, M., Grey, A., Svendsen, R., and Coughlan, M.: Assessing the influence of consolidation in marine sediment cores for Blue Carbon quantification, EGU General Assembly 2024, Vienna, Austria, 14–19 Apr 2024, EGU24-8634, https://doi.org/10.5194/egusphere-egu24-8634, 2024.

EGU24-9903 | ECS | Posters virtual | BG4.2

Understanding the methane cycle in heavily populated semi-closed Bays: a case study of Tokyo Bay and the Baltic Sea 

Satoko Owari, Marcelo Ketzer, Alexis Gilbert, Christian Stranne, Cheng Chang, and Changxun Yu

Methane is an important greenhouse gas, and global methane emission has been estimated separately from the perspective of anthropogenic and natural factors. However, in heavily populated semi-closed bays, methane emissions may be governed by both or even significantly amplified by human activities. One of the main factors mitigating methane emission from marine sediments to seawater and the atmosphere is the anaerobic oxidation of methane (AOM). The sulfate-rich zone acts as a barrier to methane release from the subseafloor because sulfate-dependent AOM removes sulfate and methane dissolved in interstitial water in a 1:1 molar ratio. Due to significant riverine inputs of freshwater and restricted water exchange, the seawater in some of the semi-closed bays is potentially fresher and has lower sulfate concentration, leading to a less effective AOM barrier for methane. Furthermore, the influx of nutrient-rich wastewater to densely populated semi-enclosed bays frequently leads to severe eutrophication, greatly enhancing biological productivity, anoxia, and the accumulation of organic-rich sediments in these systems. The objective of this study is to gain a deeper understanding of how the methane cycle is changed by anthropogenic activities in two case studies, with geochemical datasets collected from Tokyo Bay and the Baltic Sea, both known as heavily populated semi-closed bays.

We conducted sediment coring at the entrance of Tokyo Bay and offshore Stockholm in the Baltic Sea. Two cores (2.5 m in length) from Tokyo Bay and six cores (4 to 6 m in length) from the Baltic Sea were recovered, respectively. Organic matter in the surface of 1 m of sediment, which may have been strongly influenced by recent anthropogenic activities, showed 1.5 to 2% and 1.5 to 3.6% of total organic carbon (TOC) in Tokyo Bay and the Baltic Sea, respectively. These results indicate the Baltic Sea has a higher potential to generate more methane than the Tokyo Bay. The sulfate concentration at the seafloor was 27 mM in Tokyo Bay and 4 mM in the Baltic Sea and decreased with depth due to the AOM reaction reaching 0 mM at 2.5 mbsf in both bays. The thickness of the sulfate reduction zone was the same in both bays, even though they have a large difference in sulfate concentration in the bottom seawater. The iodine concentration, which has been used as a tracer for methane due to its close association with organic matter, increased with depth up to 74 µM at 2.5 mbsf in Tokyo Bay and 63 µM at 4.5 mbsf in the Baltic Sea. The iodine flux in Tokyo Bay was two times higher than in the Baltic Sea, indicating the possibility of strong methane flux from deeper sediments, which may not directly derive from Anthropocene organic-rich sediment. We will discuss and compare the details of the geochemical datasets in both Bays in the presentation.

How to cite: Owari, S., Ketzer, M., Gilbert, A., Stranne, C., Chang, C., and Yu, C.: Understanding the methane cycle in heavily populated semi-closed Bays: a case study of Tokyo Bay and the Baltic Sea, EGU General Assembly 2024, Vienna, Austria, 14–19 Apr 2024, EGU24-9903, https://doi.org/10.5194/egusphere-egu24-9903, 2024.

EGU24-10123 | ECS | Posters on site | BG4.2 | Highlight

Carbon storage and accumulation across the United Kingdom’s saltmarsh habitat.  

Craig Smeaton, Cai Ladd, Ed Garrett, Martha Hall, Lucy Miller, Lucy McMahon, Glen Havelock, William Blake, Natasha Barlow, Martin Skov, Roland Gehrels, and William Austin

Saltmarshes play a key role in the coastal carbon cycle through the capture and storage of organic carbon. Assessments of both organic carbon (OC) stocks and rates of OC accumulation are vital for quantifying saltmarsh contributions to climate-change mitigation and for guiding efforts to protect and restore coastal ecosystems. Current assessments of the magnitude of the store and rate of OC accumulating in UK saltmarshes are based on a small and spatially limited dataset. To address this knowledge gap, we collected sediment cores to quantify the OC stored in the soil and biomass of 26 saltmarshes and estimate OC accumulation rates for 22 saltmarshes distributed around the UK.

Across the saltmarshes, the estimated average store is 11.55 ± 1.56 kg C m-2 with values ranging between 2.24 kg C m-2 and 40.51 kg C m-2. These saltmarshes accumulate OC at a rate of 110.88 ± 43.12 g C m-2 yr-1 with values ranging from 27.57 g C m-2 yr-1 to 343.68 g C m-2 yr-1. These highly variable OC stocks and accumulation rates are dependent on interlinked factors, including local geomorphology, organic carbon source, sediment type (mud vs sand), sediment supply, and relative sea-level history.

By upscaling these estimates to all UK saltmarshes, it is calculated that these systems currently store 5.20 ± 0.65 Mt of OC and accumulate 46563 ± 4353 tonnes of OC annually. The low OC accumulation rates indicate that UK saltmarshes have relatively low additional Greenhouse Gas (GHG) abatement potential, but that they contain significant stores of OC within the ecosystem. This highlights the crucial need for the protection and restoration of existing OC stores within UK saltmarshes, providing climate benefits several times more significant than the annual accumulation of OC in these ecosystems.

How to cite: Smeaton, C., Ladd, C., Garrett, E., Hall, M., Miller, L., McMahon, L., Havelock, G., Blake, W., Barlow, N., Skov, M., Gehrels, R., and Austin, W.: Carbon storage and accumulation across the United Kingdom’s saltmarsh habitat. , EGU General Assembly 2024, Vienna, Austria, 14–19 Apr 2024, EGU24-10123, https://doi.org/10.5194/egusphere-egu24-10123, 2024.

EGU24-10812 | ECS | Orals | BG4.2

Rates and pathways of organic carbon mineralisation in different sedimentary environments of the Helgoland Mud Area, SE German Bight 

Daniel Müller, Bo Liu, Moritz Holtappels, Walter Geibert, Susann Henkel, and Sabine Kasten

Fine-grained coastal and continental margin sediments are the largest permanent sink for carbon on our planet. They are typically rich in organic matter and often characterised by high sedimentation rates – favouring the burial of carbon. The ultimate processes that control the preservation of organic matter (OM) and its burial to deeper sediment layers are the different aerobic and anaerobic microbial OM mineralisation pathways that occur in surface sediments. In order to assess the rates and pathways of OM degradation in fine-grained sediments of the North Sea, we have chosen the Helgoland Mud Area (HMA), which represents the most important mud depocenter in the German Bight. The HMA is located at water depths between 11 and 27 m and covers an area of about 500 km2 southeast of the island of Helgoland. We present a high spatial and vertical resolution pore-water dataset for the HMA of surface sediments retrieved using a multi-corer (MUC). This dataset includes oxygen profiles, pore-water profiles of sulfate, sulfide, nitrate, ammonia, dissolved iron, dissolved manganese, dissolved inorganic carbon and its stable carbon isotopic composition. A full diagenetic model for the uppermost 25 cm of the sediments was applied to estimate the rates of the different OM mineralisation pathways and the respective diffusive fluxes towards and across the sediment-water interface. The organic carbon burial flux and organic matter mineralisation rates range from 2.6 to 9.9 mmol m-2 d-1 and 1.9 to 9.1 mmol m-2 d-1, respectively. The highest remineralisation rates are attributed to aerobic respiration and account for up to 86 % of total OM mineralisation in the investigated surface sediments. Sulfate reduction is shown to be the second-most important mineralisation pathway of OM in the study area – except for three sites which are characterised by iron reduction and denitrification as the dominant mineralisation process after aerobic respiration. These results will be discussed in the context of the different depositional conditions, variations in particulate organic carbon (POC) accumulation and POC origin across the HMA.

How to cite: Müller, D., Liu, B., Holtappels, M., Geibert, W., Henkel, S., and Kasten, S.: Rates and pathways of organic carbon mineralisation in different sedimentary environments of the Helgoland Mud Area, SE German Bight, EGU General Assembly 2024, Vienna, Austria, 14–19 Apr 2024, EGU24-10812, https://doi.org/10.5194/egusphere-egu24-10812, 2024.

EGU24-10923 | ECS | Orals | BG4.2

Landscape properties, habitat dynamics, and the carbon storage potential of seagrass meadows in the Wadden Sea 

Svenja Reents, Laura Hommes, Nele Schildt, Nicola Camillini, and Lasse Sander

Vegetated coastal ecosystems of the Wadden Sea, such as salt marshes and seagrass meadows, are important habitats and provide various ecosystem services. Efforts to protect and restore these valuable coastal systems are currently paralleled with an interest to better understand and quantify their carbon sequestration potential. Intertidal seagrass meadows comprise an area of more than 20,000 ha in the Wadden Sea, which might lead to the assumption that significant amounts of carbon are stored in these ecosystems. At present, however, very little data exists on carbon storage and dynamics in seagrass environments in the German Wadden Sea. Seagrasses declined massively about a century ago, but over the last decades underwent a process of unassisted recovery in the Wadden Sea of Schleswig-Holstein (northern Germany). Nevertheless, the two seagrass species, Zostera marina and Zostera noltii, are still mostly absent in similar coastal environments in western Germany and in The Netherlands – providing an example for the potential to enhance both ecosystem quality and carbon storage capacity.

In an ongoing study, we investigate characteristics of the tidal landscapes (e.g., surface elevation and geomorphology, adjacent landscape elements, and anthropogenic structures) and specific habitat properties (biomass productivity, sediment characteristics, hydrodynamic conditions, pore-water nutrients) at seven seagrass sites, located on tidal flats along dike-forelands of the North Sea coast of Schleswig-Holstein, northern Germany.

The aims are to (A) deliver a first assessment of the current carbon stocks, (B) quantify intra-site differences in realized seagrass habitats, and (C) understand differences in parameters that locally drive or inhibit the long-term build-up of carbon in seagrass meadows and their associated sedimentary systems. In this presentation, we will show and discuss our first preliminary results and interpretations.

How to cite: Reents, S., Hommes, L., Schildt, N., Camillini, N., and Sander, L.: Landscape properties, habitat dynamics, and the carbon storage potential of seagrass meadows in the Wadden Sea, EGU General Assembly 2024, Vienna, Austria, 14–19 Apr 2024, EGU24-10923, https://doi.org/10.5194/egusphere-egu24-10923, 2024.

EGU24-11348 | ECS | Orals | BG4.2

Organic carbon burial and degradation in estuarine sediments in Europe's largest port area (Port of Rotterdam, The Netherlands) 

Guangnan Wu, Bingjie Yang, Klaas Nierop, Gert-Jan Reichart, Julia Gebert, and Peter Kraal

Estuaries are highly active biogeochemical environments at the land-sea interface. They release approximately 0.25 Pg C y−1 on a global scale, which is equivalent to 17% of the total oceanic uptake despite occupying an area that is only 0.03% of the global oceans (Li et al., 2023). This disproportionate impact underlines the importance of understanding the processing of riverine and coastal carbon in estuarine systems. This processing, particularly the breakdown to form the greenhouse gases CO2 and CH4, is controlled by the properties (e.g. source and composition) of organic matter (OM) and the depositional conditions. In this respect, harbors are profoundly human-impacted estuaries that continuously supply vast quantities of organic-rich dredged sediment, the environmental footprint of which is of prime concern for sustainable coastal and port management. While sources and composition are essential parameters with respect to CO2 (and CH4) generation, these are challenging to determine in the dynamic setting of a harbor with strong tidal influence. Here, we use detailed organic chemical analyses to investigate how OM composition and depositional conditions control the release of greenhouse gases from (dredged) Port of Rotterdam sediment.

The Port of Rotterdam (PoR) is located in the Rhine-Meuse estuary, with sediment and OM composition controlled by the interaction between river, sea, and human activities. During a sampling campaign in 2021, both bulk surface sediments and intact sediment cores were collected at different geographical locations throughout the harbor. A general west-to-east gradient of marine influence was presented, which coincided with the changes of organic carbon and nitrogen content and their isotope abundance. The macromolecular organic matter (MOM) was isolated and analyzed with pyrolysis-GC-MS, revealing it to be of mixed terrestrial, marine, and potential anthropogenic origins. Particularly, the abundance of terrestrial pyrolytic biomolecules (e.g. guaiacols, syringols, polysaccharides) decreased as the depositional environment became increasingly marine. Despite of OM composition changes along the salinity gradient, similar organic matter degradation rates were measured in short-term (8-hour) whole-core incubations at two sites with contrasting bulk OM signatures. This was likely attributed to the rapid degradation of fresh OM at the sediment surface. In comparison, 6-week aerobic incubation suggested marine sediments possessed a larger labile carbon pool than riverine sediments. Our results indicated that PoR sediments are characterized by large spatial variability in OM quantity and quality, further determining the carbon stock and stability. OM source seems to play a crucial role in influencing the carbon stability. Considerable attention still needs to be given to link OM characterization and degradability. However, OM degradation results from OM properties governing degradability in combination with environmental conditions (e.g. electron acceptors, microbial activities, and temperature). This was witnessed by a significantly larger benthic methane efflux in riverine sediment than marine sediment. Besides, the relative significance of OM composition influencing on degradation also depends on the timescale of interest. Nevertheless, the spatial heterogeneity in OM stability between different depositional environments highlights the need for applying ‘carbon-sensitive’ management of sediments in relation to their reactive carbon fraction when exposed to human pressure and climate change.

How to cite: Wu, G., Yang, B., Nierop, K., Reichart, G.-J., Gebert, J., and Kraal, P.: Organic carbon burial and degradation in estuarine sediments in Europe's largest port area (Port of Rotterdam, The Netherlands), EGU General Assembly 2024, Vienna, Austria, 14–19 Apr 2024, EGU24-11348, https://doi.org/10.5194/egusphere-egu24-11348, 2024.

EGU24-11523 | ECS | Posters on site | BG4.2

Intertidal blue carbon ecosystems and their socio-economic value at Lindisfarne, northern England  

Rebecca Dunn, Paul Hudson, and Ed Garrett

Coastal Blue carbon ecosystems offer a range of ecosystem services including, for example, carbon sequestration, feeding grounds for birds and flood defence. Therefore, the conservation and management of these ecosystems can act as a nature-based solution that contributes to multiple ecological and climate goals. Blue carbon ecosystems achieve this due to their multifaceted nature and how the communities surrounding these ecosystems interact with them. 


An example of blue carbon ecosystems can be found in Lindisfarne national nature reserve (NNR) located on the Northumberland coastline in the Northeast of England. The Lindisfarne NNR contains saltmarshes, seagrass meadows and sandflats in close proximity to each other. Moreover, Lindisfarne not only has value as a source of blue carbon but has further human value due to it being a destination for pilgrimages, bird watchers and holiday makers, as well containing a residential population with a small-scale fishery. Therefore, they represent locations of both natural and cultural capital.


The close proximity of multiple blue carbon ecosystems and various human interactions provides an opportunity for a significant comparative analysis of the above blue carbon ecosystems under similar socio-environmental conditions. We do so in terms of both their carbon sequestration potential as well as their socio-economic importance.


Through our comparative analysis we present two strands of work. The first is our findings regarding the estimated total sediment and vegetative carbon stock within the Lindisfarne NNR, including two seagrass meadows with contrasting sediment profiles. Additionally, we quantify the various pools of carbon storage: labile, refractory and organic; and the carbon accumulation rates of each studied ecosystem, using 210Pb and 137Cs dating analysed within a Bayesian framework. We also consider factors associated with carbon sequestration, such as vegetation coverage, surface elevation and sediment profile, in our analysis. In doing so this project will be one of the first to calculate carbon accumulation rates and carbon pools in UK seagrass meadows. The second strand of work is generated through a survey of the perceptions and values that people have towards coastal environments via discrete choice experiment survey. 


Taken together these results will provide insight into the design of coastal  management plans which focus on using the above blue carbon ecosystems as a tool for climate change mitigation through their long-term carbon sequestration as further contextualised through the priorities and values identified via the social survey.

How to cite: Dunn, R., Hudson, P., and Garrett, E.: Intertidal blue carbon ecosystems and their socio-economic value at Lindisfarne, northern England , EGU General Assembly 2024, Vienna, Austria, 14–19 Apr 2024, EGU24-11523, https://doi.org/10.5194/egusphere-egu24-11523, 2024.

Marine sediments play a crucial role in the global carbon cycle by acting as the gateway from short- to long-term reservoirs of both terrestrial and marine organic carbon (OC). To understand the spatiotemporal variability, sources, composition and reactivity of OC in marine sediments, a curated and harmonized database of OC content and associated parameters is needed, especially considering the logistical challenges and costs of retrieving samples at sea. This has prompted the development of the Modern Ocean Sediment Archive and Inventory of Carbon (MOSAIC) database. Here we present an updated version, MOSAIC v.2.0, which stores variables such as OC content, its isotopic composition (δ13C, Δ14C), sedimentological parameters (e.g., grain size, mineral surface area), and associated molecular signatures (e.g., lignin, fatty acid, alkane biomarkers). MOSAIC v.2.0 offers a broad spatiotemporal coverage, with data from more than 21’000 individual sediment cores collected since the 1950s, providing a key tool to assess the role of coastal and marine sedimentary organic carbon in the global carbon cycle. A new and interactive open-access web-interface to the database will be presented, along with Python and R packages that allow users to integrate MOSAIC in their data processing workflows. Finally, initial applications of MOSAIC (v.2.0) to understand spatial patterns in the geochemical composition of marine sediment on regional and global scales will also be illustrated.

How to cite: Paradis, S. and Eglinton, T. I.: Introducing the Modern Ocean Sedimentary Inventory and Archive of Carbon (MOSAIC v.2.0) database and its initial applications, EGU General Assembly 2024, Vienna, Austria, 14–19 Apr 2024, EGU24-12461, https://doi.org/10.5194/egusphere-egu24-12461, 2024.

EGU24-12798 | ECS | Posters on site | BG4.2

Trawling Impacts on Benthic Carbon Sequestration, Storage, and Processing: A Systematic Review 

Stacey Felgate, Michel Kaiser, and Marija Sciberras

Marine sediments are a significant sink for anthropogenic carbon dioxide (CO2)1. Bottom trawl fisheries constitute the most widespread physical disturbance to carbon-rich seabed habitats2. Recent research has sparked concern that this disturbance can turn marine sediments into a large source of CO23, but this is subject to ongoing debate4,5,6. Uncertainties exist regarding the effect of bottom trawling on carbon sequestration, remineralisation, and storage. To address this, we conducted a systematic review and meta-analysis of the existing literature to assemble a comprehensive, up-to-date database looking at how demersal mobile fishing affects: (i) the amount and type of carbon found in benthic sediments; (iii) the geochemical, biological, and physical parameters which control the fate of benthic carbon; (iii) the magnitude and direction of benthic-pelagic carbon fluxes; and (iv) the geochemical, biological, and physical parameters which control the fate of resuspended carbon. Here we present methodological details alongside preliminary findings of the resultant meta-analysis. We highlight the parameters which carry the greatest and least uncertainties and suggest key knowledge gaps to help target future field and laboratory studies to help better constrain the effect of bottom trawling on the benthic-pelagic carbon fluxes and processing.

1. Atwood et al., 2020. Global patterns in marine sediment carbon stocks. Frontiers in Marine Science; 2. Hiddink et al., 2017. Global analysis of depletion and recovery of seabed biota after bottom trawling disturbance. PNAS; 3. Sala et al., 2021. Protecting the global ocean for biodiversity, food and climate. Nature; 4. Hilborn and Kaiser, 2022. A path forward for analysing the impacts of marine protected areas. Nature; 5. Hiddink et al., 2023. Quantifying the carbon benefits of ending bottom trawling. Nature; 6. Atwood et al., 2023. Reply to: Quantifying the carbon benefits of ending bottom trawling. Nature.

How to cite: Felgate, S., Kaiser, M., and Sciberras, M.: Trawling Impacts on Benthic Carbon Sequestration, Storage, and Processing: A Systematic Review, EGU General Assembly 2024, Vienna, Austria, 14–19 Apr 2024, EGU24-12798, https://doi.org/10.5194/egusphere-egu24-12798, 2024.

EGU24-14217 | Posters on site | BG4.2

Isotopic mapping of sedimentary organic matter in the northwestern Pacific marginal sea (Yellow Sea, East China Sea, East Sea) 

Seung-Hee Kim, Dong-Hun Lee, Huitae Joo, Seok-Hyun Youn, and Young-Shin Go

We investigated physio-chemical properties, sedimentary bulk elements (C, N, S contents and heavy metals concentration), and isotopic compositions (δ13C, δ15N, 87Sr/86Sr) in the northwest Pacific marginal sea (Yellow Sea, East China Sea and East Sea; R/V Tamgu 3 and 9, February in 2019) to trace the distribution, origin, and reactivity of sedimentary organic matter (OM). Together with hydrodynamic influence (mainly freshwater input) near Yellow Sea and East China Sea, the spatial patterns of sedimentary bulk elements consider that there may be the potential accumulation of natural/anthropogenic derived-OMs transported from regional (Korea-China) river systems. Furthermore, δ13C and δ15N values in surface sediments may be characteristic of the mixture of autochthonous (e.g., algae)/allochthonous (e.g., C3 plant, soil, fertilizer) origins, suggesting the discriminative source contribution on the sedimentary OM distributions. Especially, compared to the isotopic end-members reported from Korean and China river estuaries, isotopic signatures of sedimentary OM may be regarded as the discriminative contribution of various terrestrial derived-origins within the Yellow Sea and East China Sea. Further, 87Sr/86Sr ratio indicated discriminative weathering impact and terrestrial origin OM transportation within the Korean and China river estuaries. Hence, with respect to the increase of anthropogenic activities near northwest Pacific marginal sea, the source tracing approach estimated via the multi-isotopic mapping may provide important insights for effectively understanding dramatic change of biogeochemical OM cycles from water column to sediments.

How to cite: Kim, S.-H., Lee, D.-H., Joo, H., Youn, S.-H., and Go, Y.-S.: Isotopic mapping of sedimentary organic matter in the northwestern Pacific marginal sea (Yellow Sea, East China Sea, East Sea), EGU General Assembly 2024, Vienna, Austria, 14–19 Apr 2024, EGU24-14217, https://doi.org/10.5194/egusphere-egu24-14217, 2024.

EGU24-15773 | Orals | BG4.2

Blue carbon burial along intertidal mudflats 

Christian Sanders and Faming Wang

Coastal blue carbon habitats perform many important environmental functions, including long-term carbon storage. These carbon storage estimates are typically limited to the sediments within specific types of coastal vegetation. However, recent studies have shown that large fluxes of organic carbon originating from traditional and non-traditional blue carbon systems are being buried along the margins and intertidal mudflats. For example, our recent study in China showed that over 75% of the blue carbon burial occurred in unvegetated tidal flats. Further, in Brazil, organic carbon burial rates along mudflats were found to be almost 3 times greater than the flux from within coastal vegetated systems. The implications of this research are that there is an underestimation of carbon burial from blue carbon systems as a result of the large burial rates along adjacent unvegetated regions.

How to cite: Sanders, C. and Wang, F.: Blue carbon burial along intertidal mudflats, EGU General Assembly 2024, Vienna, Austria, 14–19 Apr 2024, EGU24-15773, https://doi.org/10.5194/egusphere-egu24-15773, 2024.

EGU24-16476 | Orals | BG4.2

Sedimentary ancient DNA connects land carbon sources and marine carbon sinks 

Ulrike Herzschuh, Josefine Weiß, Kathleen Stoof-Leichsenring, Lars Harms, Dirk Nuernberg, and Juliane Mueller

Marine sediments contain abundant organic matter which forms a major carbon sink. About one third of it originates from land plants. The main source taxa and source region as well as the large-scale translocation are hitherto poorly understood, mainly because we lack a proxy that can identify the source taxa with high taxonomic resolution. Here, we investigate the land plant component of sedimentary ancient DNA in six globally distributed marine sediment cores as a proxy for the terrestrial organic matter quantity and preservation as well as the source taxa. The spatial and temporal plant composition reflects mainly the vegetation composition and dynamics from the nearby continents as revealed by pollen records. However, we also find indications of a global north-to-south translocation of organic matter. The plant composition shows that upland vegetation is strongly underrepresented compared to riverine and coastal sources and there is a high contribution from mosses and ferns, particularly at high latitudes during the Holocene. We find that plant matter has a higher share and is better preserved in samples from the Late Glacial, which is characterized by high runoff and mineral load. Our results suggest that plant DNA in marine sediments may provide the missing proxy that links terrestrial plant sources to marine sedimentary carbon sinks. This represents the basis of how climate change and land-use change translates into carbon-sink dynamics and also informs about natural carbon-capture solutions.

How to cite: Herzschuh, U., Weiß, J., Stoof-Leichsenring, K., Harms, L., Nuernberg, D., and Mueller, J.: Sedimentary ancient DNA connects land carbon sources and marine carbon sinks, EGU General Assembly 2024, Vienna, Austria, 14–19 Apr 2024, EGU24-16476, https://doi.org/10.5194/egusphere-egu24-16476, 2024.

EGU24-16727 | ECS | Orals | BG4.2

Particulate organic carbon dynamics of a depositional area in a high-energy shelf environment 

Ulrike Hanz, Bingbing Wei, Vera Fovonova, Lasse Sander, Robert Kopte, Henning Schröder, Sabine Kasten, and Moritz Holtappels

The marine carbon pump can sequester CO2 from the atmosphere in marine sediments. Much of the carbon is taken up from the atmosphere in productive coastal waters, whereas carbon deposition often takes place in deeper areas. Tidal- and wave activity in shallow waters are producing a high energy environment where constant resuspension counteracts sinking and prevents accumulation of organic matter at the seafloor, a process that is reflected by the ubiquitous presence of non-accumulating sands covering more than 50% of the shelf areas. Nevertheless, in some shallow coastal areas, we find organic matter accumulation even under high energy conditions. One example is a 500km2 region in the German North Sea, called the Helgoland Mud Area, where local hydrodynamic conditions cause the trapping of suspended particulate matter (SPM) and subsequent sedimentation. In this study we describe the particle transport dynamics over a diurnal tidal cycle, observed via a benthic lander deployment, repeat CTDs and analysis of reactivity and isotopic composition of the particulate organic matter (POM). Driven by tidal currents, we found SPM concentrations in the bottom water fluctuating between 35 and 130 mg/l, resulting in a total amount of suspended particles within the water column of up to 400 g /m2. The constant resuspension and thus remineralisation of associated POM led to a one order of magnitude decreased carbon specific mineralization rate, compared to the upper water column. From eddy covariance measurements, the SPM resuspension flux was calculated and counteracting SPM sinking velocities of around 6 x 10⁻⁴ m/s were derived. Interestingly, the POM background under stagnant current conditions showed more terrestrial d13C values compared to the resuspended POM during strong current conditions, suggesting distinct particle size classes and transport conditions for marine and terrestrial POM, respectively. The locally observed resuspension dynamics helps to understand the larger hydrodynamic regime that controls sediment accumulation, and ultimately the carbon sequestration in the area. 

How to cite: Hanz, U., Wei, B., Fovonova, V., Sander, L., Kopte, R., Schröder, H., Kasten, S., and Holtappels, M.: Particulate organic carbon dynamics of a depositional area in a high-energy shelf environment, EGU General Assembly 2024, Vienna, Austria, 14–19 Apr 2024, EGU24-16727, https://doi.org/10.5194/egusphere-egu24-16727, 2024.

Seagrasses are marine flowering plants that play an important role in mitigating climate change by carbon sequestration. While only covering 0.2% of the ocean floor, seagrasses store over 15% of accumulated global carbon in the ocean’s sediments. The oxidizing microenvironments around their roots create strong and complex redox gradients which greatly affect microbial carbon mineralization rates in marine sediments. Despite seagrasses’ enormous ecological services as habitat and climate regulators, they are rapidly degrading around the world at alarming rates. Therefore, understanding the chemical changes and feedback that occur in sediments following the disappearance of seagrasses holds ecological importance.

We incubated different compartments of the tropical seagrass Halophila stipulacea (old and young leaves, rhizomes, or roots) with two sediment types from the northern tip of the Gulf of Aqaba. We measured the chemical changes in major ions (DIC, Fe2+, H2S, SO42-) and sulfur isotope ratios in sulfate within the water. We used these measurements to calculate the remineralization rate of each seagrass compartment. Our results aid us in predicting the potential effects of H. stipulacea disappearance on key microbial processes in the marine environment.

We show that the rhizomes had the fastest decomposition rates, followed by the young leaves, roots, and old leaves. This indicates the preservation potential of belowground biomass. Moreover, high hydrogen sulfide concentrations were only detected in the slurries containing rhizomes and young leaves. High sulfide concentrations can lead to enhanced seagrass mortality and a positive feedback loop where seagrass loss generates sulfide, leading to more seagrass loss. These results emphasize the importance of a deeper understanding of biogeochemical pathways following seagrass disappearance.

How to cite: Antler, G., Neta, S., and Winters, G.: The effect of anaerobic remineralization of the seagrass Halophila stipulacea on porewater biogeochemistry in the Gulf of Aqaba, EGU General Assembly 2024, Vienna, Austria, 14–19 Apr 2024, EGU24-17164, https://doi.org/10.5194/egusphere-egu24-17164, 2024.

EGU24-17590 | Orals | BG4.2

Assessing the sedimentary carbon sink for climate change mitigation - the need for transdisciplinary cooperation 

Moritz Holtappels, Ute Daewel, Jannis Kuhlmann, Lucas Porz, Bettina Taylor, Klaus Wallmann, Wenyan Zhang, Nadja Ziebarth, and Sabine Kasten

Shelf sediments represent one of the largest natural carbon sinks on earth. At the same time, shelf regions are increasingly affected by human activity, disturbing sediment reservoirs directly by bottom trawling and offshore construction, or altering the carbon supply by changing river discharge, sediment management and the trophic status and food web of the sea. As global warming progresses, the sedimentary carbon sinks are becoming increasingly important in climate change mitigation measures. Thus, there is a need for in-depth knowledge of both, the dynamics and vulnerabilities of the sedimentary carbon sinks, as well as the legal and political options to protect their sequestration efficiency from human disturbances. Here we report on the transdisciplinary research project APOC, which addresses the Anthropogenic impacts on the cycling of Particulate Organic Carbon in the North Sea. Important results of the project include the quantification of sedimentation rates in the accumulation areas of the German Bight and the Skagerrak, assessing the factors that enhance organic carbon storage and the determination of the sources of deposited carbon. As major anthropogenic disturbances, the effects of bottom trawling and wind farm construction on benthic carbon storage were investigated and assessed. Bottom trawling in particular was significantly decreasing the benthic carbon storage due to a multitude of coupled physical and ecological effects. However, at the environmental policy level, it became clear that sedimentary deposits are not sufficiently recognized as valuable carbon sinks, although their storage capacity is believed to be much higher than that of blue carbon ecosystems at similar latitudes. While the project was staffed mainly with natural scientists, important expertise in environmental policies was provided by the marine protection office of the BUND, one of the largest environmental NGOs in Germany. As a fully-fledged project partner, BUND made it possible to recognize the relevance of the various project focal points for the environmental policy arena throughout the entire project. In turn, the policy experts were able to distribute the latest scientific findings to the relevant political decision makers. In effect, the transdisciplinary cooperation within the project not only produced valuable scientific results, but also numerous expert briefings for environmental policy at all levels, from local authorities to the EU Parliament, emphasizing the importance of protecting sedimentary carbon sinks for climate change mitigation measures. Key to this outcome was the continuous exchange of scientific findings and practical environmental policy knowledge, which kept all participants focused on the societal relevant objectives that were originally pursued with the project funding.

How to cite: Holtappels, M., Daewel, U., Kuhlmann, J., Porz, L., Taylor, B., Wallmann, K., Zhang, W., Ziebarth, N., and Kasten, S.: Assessing the sedimentary carbon sink for climate change mitigation - the need for transdisciplinary cooperation, EGU General Assembly 2024, Vienna, Austria, 14–19 Apr 2024, EGU24-17590, https://doi.org/10.5194/egusphere-egu24-17590, 2024.

EGU24-18005 | Orals | BG4.2

Predicting Global Seafloor Organic Carbon Burial Rates: A Deep Learning Approach with Uncertainty Quantification 

Naveenkumar Parameswaran, Ewa Bur­wicz-Galerne, Everardo Gonzalez, Klaus Wallmann, David Greenberg, and Malte Braack
Sediment accumulation rate is recognized as the primary parameter influencing the burial rate of organic carbon and other compounds in marine sediments. The prediction of a global map for burial rates is challenging due to the limited availability of measurements for total organic carbon (TOC) and sediment accumulation rates from the seafloor. Recent advancements in machine learning, including techniques such as K nearest Neighbours and Random Forests, have demonstrated promise in producing comprehensive predictions utilizing global maps of oceanic properties.
 
In this study, we introduce a sophisticated approach based on a newly developed deep neural network (DNN) model tailored for geospatial predictions. Employing few-shot learning techniques, such as the incorporation of prior physical knowledge into the model, along with strategies like multi-task learning and semi-supervised learning, enhances predictions amidst sparse data availability. Moreover, p​​​​​redictions of the global distribution of seafloor TOC and sediment accumulation rates presented here are coupled with uncertainty maps computed using Monte Carlo Dropout, a Bayesian approximation method that effectively inform about the degree of the model predictibility. With our results, we not only explore the global distribution of burial rates of organic carbon but also offer insights into the global carbon stocks in various marine regions.

How to cite: Parameswaran, N., Bur­wicz-Galerne, E., Gonzalez, E., Wallmann, K., Greenberg, D., and Braack, M.: Predicting Global Seafloor Organic Carbon Burial Rates: A Deep Learning Approach with Uncertainty Quantification, EGU General Assembly 2024, Vienna, Austria, 14–19 Apr 2024, EGU24-18005, https://doi.org/10.5194/egusphere-egu24-18005, 2024.

EGU24-18616 | ECS | Posters on site | BG4.2

Towards a sedimentary organic carbon inventory of the Western Mediterranean Sea 

Blanca Ausín, Gina Bossert, Nicola Krake, Sarah Paradis, Negar Haghipour, Xavier Durrieu de Madron, Belén Alonso, and Timothy Eglinton

Regional studies on the origin and fate of organic carbon (OC) in marine sediments are scarce due to limited spatial data coverage and the complex interplay among biological, physicochemical, and geological processes that can influence OC content and geochemical signatures on different spatial scales. Yet, such studies are vital to constrain global carbon inventories for ocean sediments.

To shed light on the controls on the origin, distribution, and fate of sedimentary OC in continental margins and adjacent deep-sea basins, we investigate the geochemical and sedimentological characteristics of organic matter (OM) in the semi-enclosed Western Mediterranean Sea. Here, we analyze 149 core-top samples from the Western Mediterranean Sea and the adjacent Atlantic Ocean sector and explore the spatial distribution of OC content, OC-ẟ13C, OC-Δ14C, C/N, grain size, and mineral surface area, among others.

Most geochemical parameters depict a clear SW-NE gradient between the westernmost and the easternmost basins. This gradient reverses in the Gulf of Lions (NW Mediterranean). Thus, OC is younger and of primarily marine origin in samples from the Atlantic sector and the Alboran Sea (SW Mediterranean). In the Algerian Basin, the Balearic Sea, and the Algero-Provencal Basin the influence of terrestrial OC input increases towards the NE characterized by the presence of highly 13C- and 14C-depleted (aged) sedimentary OC. Finally, samples from the Gulf of Lions show a larger influence of fresh and young OC compared to other northeastern basins.

The interplay between marine primary productivity and delivery of terrestrial OC is the main factor that determines the observed gradient. Primary productivity decreases from the southwestern basins towards the NE and increases again northeasternmost basin, the Gulf of Lions. By contrast, the terrestrial OC carbon delivered by rivers and channeled to the deeper basin by canyons has an increasing influence on sedimentary OC toward the NE.

When explored from a sedimentological context, our results reveal that lateral transport of OC and OM protection by mineral surfaces potentially act as secondary controls on the OC fate in surface sediments of the Western Mediterranean Sea.

This integrated study contributes to a better knowledge of the interplay of biological, chemical, and hydrological factors that influence the amount and geochemical characteristics of sedimentary OC in the land-sea continuum and the deeper ocean, a fundamental consideration to constraining global carbon inventories.

How to cite: Ausín, B., Bossert, G., Krake, N., Paradis, S., Haghipour, N., Durrieu de Madron, X., Alonso, B., and Eglinton, T.: Towards a sedimentary organic carbon inventory of the Western Mediterranean Sea, EGU General Assembly 2024, Vienna, Austria, 14–19 Apr 2024, EGU24-18616, https://doi.org/10.5194/egusphere-egu24-18616, 2024.

EGU24-19779 | ECS | Orals | BG4.2

The QUANTIFICATION, CHARACTERISATION, SOURCE AND FATE OF PAST AND PRESENT CARBON STORAGE IN COASTAL AND OFFSHORE SEDIMENTS FOR EFFECTIVE MARINE MANAGEMENT (QUEST) 

Anthony Grey, Brian Kelleher, Mark Chatting, Mike Long, Phoebe Walsh, Markus Diesing, and Mark Coughlan

Globally, continental shelf environments, and the marine sediments therein, have been recognised as having significant roles to play in the sequestration, cycling and storage of. Recently, shelf sediments have been identified as the largest, but most uncertain, stock of carbon stored on the continental shelf, citing a lack of empirical data. Moreover, seabeds are coming under increased pressure through anthropogenic impacts, such as offshore renewable energy development, trawling and dredging, and climate change effects. To fully understand, and effectively manage the seabed in terms of maximising this Blue Carbon potential requires a thorough understanding of carbon cycling in the marine environment over time, physical processes at the seafloor and high-quality spatial mapping. The QUEST project scope aims to conduct a multidisciplinary research programme to qualify, quantify and elucidate the provenance of carbon stocks in offshore marine sediments in Irelands EEZ. Furthermore, the research will examine and characterise threats to the stability of Blue Carbon in these settings and support the development of long-term management strategies. This programme will comprise spatial predictive modelling along with offshore surveying and sampling, laboratory analysis and hydrodynamic modelling, with past and new data to deliver comprehensive geochemical, geological, geotechnical, environmental and morphodynamical assessments of Blue Carbon ‘hotspots’ in the Irish offshore, as identified in the National Marine Planning Framework.

To date, this programme has worked with a variety of stakeholders to collate historical data relevant as predictors for sediment OC and generated new geochemical data sets through analysis of legacy sediment samples. The combined data sets have been used to produce spatial predictive modelling maps providing preliminary baselines for sediment OC stocks in Ireland’s EEZ.

Spatial mapping has identified knowledge gaps in the spatial extent and resolution of available sediment data. Additionally, the data collation and mapping exercise has highlighted a sparsity of physio-geochemical data essential for the accurate estimation and upscaling of OC stocks including OC content, Bulk density, and grain size analysis. Likewise, the paucity of available data extends to deeper sediments, consequently inhibiting the determination of OC stocks to the desired standard of 1 meter depth in assessment of BC ecosystems.  The first off-shore sampling survey for QUEST was completed in October 2023 providing a selection of grab (surface ~10cm depth), gravity (1-2m depth ), Vibro- ( 2-5m) and box core ( 10-25cm) samples from a series of near to off-shore transects from Ireland’s East coast encompassing the high sedimentary region of the Western Irish Sea Mudbelt (WISMB). Initial work carried out on cores has generated data describing updated OC stocks for Irish Sea sediments up to a 1m depth. Furthermore, data sets have been used to produce a region-specific conversion equation to calculate OC content using values attained from Loss on ignition analysis (LOI). This conversion factor has been applied to convert historical data LOI data for spatial predictive modelling.


How to cite: Grey, A., Kelleher, B., Chatting, M., Long, M., Walsh, P., Diesing, M., and Coughlan, M.: The QUANTIFICATION, CHARACTERISATION, SOURCE AND FATE OF PAST AND PRESENT CARBON STORAGE IN COASTAL AND OFFSHORE SEDIMENTS FOR EFFECTIVE MARINE MANAGEMENT (QUEST), EGU General Assembly 2024, Vienna, Austria, 14–19 Apr 2024, EGU24-19779, https://doi.org/10.5194/egusphere-egu24-19779, 2024.

EGU24-19812 | ECS | Posters on site | BG4.2

Do root exudates stabilize in coastal wetland soils? 

Clarisse Gösele and Peter Müller

Salt marshes are highly effective long-term carbon sinks. The capacity of these ecosystems to sequester carbon is controlled by the balance of plant primary production and microbial decomposition. Besides the input of litter, plants are able to excrete organic carbon into the soil by transporting recently fixed carbon compounds from the living roots into the surrounding soil. Despite playing an important role in the global carbon cycle, studies on root exudates in tidal wetlands are rare. This study reports findings on (1) the detection and (2) the stabilization of root exudates in a wetland plant-soil system. Conducting a 13CO2 pulse-labeling study, we (1) tested if Spartina anglica Hubb. supplies a relevant (i.e. detectable) flux of recently fixed carbon via root exudates to the soil environment. The biogeochemical conditions of a typical wetland were simulated by planting S. anglica, a dominant grass in large parts of the European salt marsh area, in waterlogged mesocosms. The aboveground biomass was labeled by acidifying 0.1 g of 13C-pure bicarbonate inside a cylindric transparent acrylic glass chamber. Labeling was conducted once daily over a period of ten days. Isotope-ratio mass-spectrometry was used to track the 13C label through different compartments of the plant-soil system, including leaves, roots and bulk soil. We found a rapid translocation of recently fixed carbon to belowground plants tissues. (2) Subsamples of the labeled bulk soil were used to study the decay and stabilization of root exudates in the soil. A full factorial pot experiment (labeled vs. unlabeled x vegetated vs. non-vegetated) was conducted, where a total of 12 mesocosms were sampled over approx. 15 months and the bulk soil was analyzed for its δ13C-signature. This long-term approach showed that root exudates stabilize in coastal wetland soils under anoxic soil conditions and thereby could play an important role in their carbon sequestration capacity.

How to cite: Gösele, C. and Müller, P.: Do root exudates stabilize in coastal wetland soils?, EGU General Assembly 2024, Vienna, Austria, 14–19 Apr 2024, EGU24-19812, https://doi.org/10.5194/egusphere-egu24-19812, 2024.

EGU24-22145 | Orals | BG4.2

A toolbox approach to measuring carbon stocks and sequestration in the North Sea 

Claire Powell, Carolyn Graves, Franck Dal-Molin, Clement Garcia, Clare Hynes, Caroline Limpenny, Claire Mason, Paul Nelson, Craig Smeaton, and Ruth Parker

Understanding the capacity of marine sediments to store and sequester atmospheric carbon is an essential first step in assessing the possibilities for the management of these stores, including management of pressure such as bottom contacting fisheries, and addressing policy questions such as their potential as nature-based solutions to climate change. Using a toolbox of complimentary techniques for determining carbon abundance, provenance and reactivity, accumulation rates and vulnerability we have analysed a total of 18 sediment cores taken from sites across the North Sea during February and December 2021. Additionally, we have preliminary results from an additional 40 cores taken from a range of sites across the North Sea in June 2023, including across trawling gradients.

We present results from our toolbox approach, measuring the carbon stock and sequestration for the cores using a suite of complimentary analyses: from novel techniques such as alkane biomarkers and thermogravimetric analysis (TGA), to radiometric determination of sedimentation rates by lead-210 and stable carbon isotopes (δ13C) in bulk organic carbon, to the more routine techniques such as particle size distribution (PSA), organic & inorganic carbon and nitrogen, porosity, chlorophyll/phaeopigment, and black carbon. We show how viewing the results together can increase the understanding of how carbon is processed in the seabed at a regional scale, and how this can inform where management measures would be most appropriately applied.

How to cite: Powell, C., Graves, C., Dal-Molin, F., Garcia, C., Hynes, C., Limpenny, C., Mason, C., Nelson, P., Smeaton, C., and Parker, R.: A toolbox approach to measuring carbon stocks and sequestration in the North Sea, EGU General Assembly 2024, Vienna, Austria, 14–19 Apr 2024, EGU24-22145, https://doi.org/10.5194/egusphere-egu24-22145, 2024.

EGU24-22261 | ECS | Orals | BG4.2

The effect of man-made structures on sedimentary blue carbon dynamics  

Hugo Woodward-Rowe, Frank Dal Molin, Ben Gregson, Claire Mason, Ruth Parker, and Natalie Hicks

Continental shelf sediments contain significant carbon stocks while being increasingly subject to anthropogenic pressures such as trawling, oil and gas extraction and more recently the introduction of offshore wind farms. Despite extensive research on the effect of man-made structures on the marine environment, there remains a research gap regarding their effect on shelf sediment carbon storage through their installation, operation and following decommissioning. This is the first study to explicitly study sediment carbon dynamics surrounding man-made structures. This talk presents carbon data from two decommissioned oil and gas platforms (Northwest Hutton and Miller) in the North Sea, from sediment cores taken at increasing distances away from the decommissioned sites. Understanding the carbon dynamics includes presenting the carbon stocks, sediment composition, and carbon accumulations rates using radiochemistry techniques. This research is important for determining the role of MMS on carbon dynamics, and has implications for decommissioning practice across the North Sea.

How to cite: Woodward-Rowe, H., Dal Molin, F., Gregson, B., Mason, C., Parker, R., and Hicks, N.: The effect of man-made structures on sedimentary blue carbon dynamics , EGU General Assembly 2024, Vienna, Austria, 14–19 Apr 2024, EGU24-22261, https://doi.org/10.5194/egusphere-egu24-22261, 2024.

EGU24-756 | ECS | Posters on site | BG8.4

Influence of Enhanced Silicate Weathering on Streamwater Quality: A Watershed Experiment 

Rob Rioux, Fengchao Sun, Wyatt Tatge, Quinn C. Zacharias, William Miller-Brown, James B. Shanley, Noah Planavsky, Peter A. Raymond, and James Saiers

Enhanced Mineral Weathering (EMW), a Carbon Dioxide Removal approach, is of growing interest to scientists and practitioners due to its scalability, low technological demand, and co-benefits to farmers and soil health. Enhanced Silicate Weathering (ESW) is distinguished from EMW by grinding silicate rocks (e.g., basalt) into dust and applying it across a landscape, primarily agricultural land. After application, the silicate minerals react with carbonic acid (H2CO3) present in rainwater and soil pore water to generate weathering products such as base cations (Ca2+, Mg2+, Na+), alkalinity, trace elements (Al, Fe, Mn), and clays. These weathering products are used by plants or transported from the land to surface water. These weathering products influence streamwater chemistry by increasing in-stream pH, salinity, and alkalinity, which may worsen water quality and impair aquatic ecosystem function. Previous research has described the adverse water quality impacts of increased stream pH, salinity, and alkalinity at the continental scale across North America. The sources driving this change in freshwater quality have been identified as road salt, agricultural lime, and strong acids derived from anthropogenic activities (e.g., fertilizer and acid mine drainage). We are interested in understanding how ESW deployed at large scales may contribute to ongoing changes in freshwater quality. Here, in a small agricultural watershed in Northeastern Vermont, United States, we monitor water quality pre- and post-application of basalt at high-frequency intervals at two stream locations (measuring temperature, pH, specific conductance, dissolved oxygen, chlorophyll-a, and CDOM). In addition, we collected weekly baseflow water samples and stormwater samples across 19 rain events. All water samples were measured for a suite of chemical parameters, including DOC, alkalinity, major anions, cations, trace elements, and water isotopes. We analyze this data through multiple lenses, estimating changes to water quality, describing concentration-discharge dynamics, and analyzing aquatic ecosystem response via community respiration.

How to cite: Rioux, R., Sun, F., Tatge, W., Zacharias, Q. C., Miller-Brown, W., Shanley, J. B., Planavsky, N., Raymond, P. A., and Saiers, J.: Influence of Enhanced Silicate Weathering on Streamwater Quality: A Watershed Experiment, EGU General Assembly 2024, Vienna, Austria, 14–19 Apr 2024, EGU24-756, https://doi.org/10.5194/egusphere-egu24-756, 2024.

EGU24-928 | ECS | Posters on site | BG8.4

Reactive transport modelling reveals changes in properties of tropical soils subjected to enhanced silicate weathering 

Juliette Glorieux, Yves Goddéris, Sylvain Kuppel, and Pierre Delmelle

Applied regionally to cropland soils, enhanced silicate weathering (ESW) is advocated as a viable technology for enhancing the consumption of atmospheric CO2, while also providing ancillary benefits to soil fertility and crop growth. However, important uncertainties remain regarding the short- and long-term effects of silicate addition on weathering rate and soil properties. To address this issue, we adapted and used the reactive transport model WITCH1 to simulate weathering in a tropical soil (Oxisol) amended annually with 50 t ha-1 of crushed basalt over five years. We monitored the changes in the soil chemical properties, primary and secondary mineralogy and CO2 consumption rate over a 10-year period. The modelling results confirm that the instantaneous CO2 consumption rate increases with basalt application. Basalt weathering increases the pH of the soil solution, from acidic to alkaline values, and releases Ca, Mg and K in solution, thus serving as a plant nutrient source. We also found that allophanes may form in the Oxisol in response to dissolution of the basalt’s glass and plagioclases. As evidenced in volcanic soils, allophanes typically exhibit a significant potential for organic carbon stabilisation. The formation of allophanes in the Oxisol treated with basalt may improve aggregation processes, water retention and hydraulic conductivity, but may decrease phosphate availability further. Our modelling study highlights that the intentional application of basalt to a tropical soil affects various soil properties significantly. The short and long-term impacts of these changes on soil functioning will need to be assessed.

1Goddéris et al., 2006. GCA 70:1128-1147

How to cite: Glorieux, J., Goddéris, Y., Kuppel, S., and Delmelle, P.: Reactive transport modelling reveals changes in properties of tropical soils subjected to enhanced silicate weathering, EGU General Assembly 2024, Vienna, Austria, 14–19 Apr 2024, EGU24-928, https://doi.org/10.5194/egusphere-egu24-928, 2024.

EGU24-972 | ECS | Posters on site | BG8.4 | Highlight

Role of unfavorable impurities in CO2 mineralization process of industrial solid waste: Uncertainties in decarbonization potential  

Yikai Liu, Qiusong Chen, Maria Chiara Dalconi, Luca Valentini, Xinyi Yuan, Simone Molinari, Yunming Wang, and Gilberto Artioli

Using industrial solid waste to capture CO2 by mineral carbonation is considered one of the promising technologies to prevent waste disposal while combating global anthropogenic CO2 emissions. Especially, the carbonation reaction is spontaneous and the carbonated products are relatively stable; thus, mineral carbonation is an effective means of stabilizing CO2 and valorizing industrial solid waste. Previous estimations report that a 4.02 Gt per year mitigation potential can be facilitated through CO2 mineralization of industrial solid waste. However, existing estimates do not take into account the impacts of unfavorable impurities, which have broad uncertainty and variability due to different industrial processes and ore sources. The existence of certain impurities might influence the rate of the carbonation reaction and therefore, the amount of CO2 captured and carbonates formed. For instance, some elements (e.g., Pb, Cd, and Mn in mine tailings) can enhance the CO2 capture capacity due to the precipitation of heavy metal carbonates. While some organics (e.g., organic matter in sludge) and anions (e.g., phosphates in phosphogypsum) can influence the carbonation reactions negatively. Especially, the questionable releasing behavior of these potentially toxic elements can bring about new environmental issues when the deposited body reaches groundwater or aquifer resources. Therefore, in this work, we have attempted to clarify the roles of impurities in the mineralization process and the afterward usage period, including the accelerating or retarding effects of impurities in carbonation and the leaching behavior of potentially toxic elements. Industrial solid wastes from different sectors, such as typical mine tailings (e.g., copper mine tailings and nickel mine tailings), industrial by-products (e.g., phosphogypsum, fly ash, red mud, and coal gasification slag), and construction and demolition waste, are used for accelerated and atmospheric carbonation at ambient temperatures. Our study reveals that although mineralization and in-stu storage could turn industrial solid wastes into a global carbon mitigation sink, unfavorable impurities may curb abatement potential.

How to cite: Liu, Y., Chen, Q., Dalconi, M. C., Valentini, L., Yuan, X., Molinari, S., Wang, Y., and Artioli, G.: Role of unfavorable impurities in CO2 mineralization process of industrial solid waste: Uncertainties in decarbonization potential , EGU General Assembly 2024, Vienna, Austria, 14–19 Apr 2024, EGU24-972, https://doi.org/10.5194/egusphere-egu24-972, 2024.

EGU24-1421 | Orals | BG8.4 | Highlight

Initial agronomic benefits of enhanced weathering using basalt: A study of spring oat in a temperate climate 

Kirstine Skov, Jez Wardman, Matthew Healey, Amy McBride, Tzara Bierowiec, Julia Cooper, Ifeoma Edeh, Dave George, Mike E. Kelland, Jim Mann, David Manning, Melissa J. Murphy, Ryan Pape, Yit A. Teh, Will Turner, Peter Wade, and Xinran Liu

Addressing soil nutrient degradation and global warming requires novel solutions. Enhanced weathering using crushed basalt rock is a promising dual-action strategy that can enhance soil health and sequester carbon dioxide. This study examines the short-term effects of basalt amendment on spring oat (Avena sativa L.) during the 2022 growing season in NE England. The experimental design consisted of four blocks with control and basalt-amended plots, and two cultivation types within each treatment, laid out in a split plot design. Basalt (18.86 tonnes ha −1 ) was incorporated into the soil during seeding. Tissue, grain and soil samples were collected for yield, nutrient, and pH analysis. Basalt amendment led to significantly higher yields, averaging 20.5% and 9.3% increases in direct drill and ploughed plots, respectively. Soil pH was significantly higher 256 days after rock application across cultivation types  (direct drill: on average 6.47 vs. 6.76 and ploughed: on average 6.69 vs. 6.89, for control and basalt-amended plots, respectively), likely due to rapidly dissolving minerals in the applied basalt, such as calcite. Indications of growing season differences in soil pH are observed through direct measurement of lower manganese and iron uptake in plants grown on basalt-amended soil. Higher grain and tissue potassium, and tissue calcium uptake were observed in basalt-treated crops. Notably, no accumulation of potentially toxic elements (arsenic, cadmium, chromium, nickel) was detected in the grain, indicating that crops grown using this basaltic feedstock are safe for consumption. This study indicates that basalt amendments can improve agronomic performance in sandy clay-loam agricultural soil under temperate climate conditions. These findings offer valuable insights for producers in temperate regions who are considering using such amendments, demonstrating the potential for improved crop yields and environmental benefits while ensuring crop safety.

How to cite: Skov, K., Wardman, J., Healey, M., McBride, A., Bierowiec, T., Cooper, J., Edeh, I., George, D., Kelland, M. E., Mann, J., Manning, D., Murphy, M. J., Pape, R., Teh, Y. A., Turner, W., Wade, P., and Liu, X.: Initial agronomic benefits of enhanced weathering using basalt: A study of spring oat in a temperate climate, EGU General Assembly 2024, Vienna, Austria, 14–19 Apr 2024, EGU24-1421, https://doi.org/10.5194/egusphere-egu24-1421, 2024.

EGU24-2598 | Posters on site | BG8.4

Impact of Enhanced Rock Weathering on Soil Organic Carbon Dynamics through Microbial Activity 

Ye Lim Park, Junge Hyun, Yejee Ok, and Gayoung Yoo

Enhanced Rock Weathering (ERW) is a method for capturing carbon dioxide from the atmosphere and turning it into inorganic carbon, which is then stored in soil or oceans. While ERW is typically acclaimed for its influence on inorganic carbon cycling, its interactions with soil organic carbon (SOC) - mainly formed through biological processes like plant and microbial activity - are less explored. This study aims to investigate the impact of ERW application on SOC dynamics, particularly through modifications in microbial activity. We tested two hypotheses: (1) The change in soil pH and micro-nutrient levels by ERW amendments could boost soil microbial activity, which then accelerate breakdown of easily decomposable SOC, and 2) Higher labile SOC content could increase SOC stabilization within soil aggregates or bound to minerals, which further contribute to an increase in long lasting SOC stock by ERW. In this study, to analyze SOC dynamics under the influence of ERW, we applied olivine, a common ERW material, to soil and conducted a four-month pot experiment with alfalfa. After experiment, soil samples from each pot were analyzed using size and density fractionation to distinguish SOC into four forms: light fraction carbon (LFC), particulate organic carbon in macroaggregates (Macro_oPOC), particulate organic carbon in microaggregates (Micro_oPOC), and mineral-associated organic carbon (MAOC). Additionally, to assess microbial activity, we measured microbial biomass carbon (MBC), extracellular enzyme activities (three hydrolases and two oxidases) associated with C decomposition, and glomalin-related soil protein (GRSP), thus providing insights into microbial processes influenced by ERW. As a result, the increased soil pH and supply of minerals from ERW are expected to boost microbial activities, potentially leading to a higher rate of labile SOC decomposition. This could result in decreases in LFC and Macro_oPOC and increases in both Micro_oPOC and MAOC. This research underscores the multifaceted role of ERW in carbon management strategies, demonstrating its potential not only in mitigating climate change through inorganic carbon sequestration but also in influencing SOC sequestration.

How to cite: Park, Y. L., Hyun, J., Ok, Y., and Yoo, G.: Impact of Enhanced Rock Weathering on Soil Organic Carbon Dynamics through Microbial Activity, EGU General Assembly 2024, Vienna, Austria, 14–19 Apr 2024, EGU24-2598, https://doi.org/10.5194/egusphere-egu24-2598, 2024.

EGU24-2602 | ECS | Posters on site | BG8.4

Assessing the Impact of Enhanced Rock Weathering on Soil Biological Interactions with Comprehensive Carbon Dioxide Removal Index 

Yejee Ok, Junge Hyun, Ye Lim Park, and Gayoung Yoo

Enhanced Rock Weathering (ERW) is emerging as a promising Carbon Dioxide Removal (CDR) strategy. While existing research predominantly measures dissolved inorganic carbon (DIC) and soil inorganic carbon (SIC) to evaluate CDR effects, the significance of plants and their influence on soil organic carbon (SOC) within the ERW process remains underexplored. Our study aims to investigate the impact of ERW amendments on SOC sequestration when applied to soils with planted vegetation. The variation in SOC sequestration due to ERW depends on factors such as the composition of ERW materials, soil conditions, and the presence of plants and microorganisms. Under these interactions, stable SOC storage for at least several decades needs to be considered a CDR effect, although the increase in plant growth may not be considered a CDR effect due to the short carbon storage time. Additionally, we propose the inclusion of non-CO2 greenhouse gas emissions, particularly N2O emissions resulting from microbial activity changes, in our comprehensive CDR Index. Here, we suggest a comprehensive CDR Index for ERW, encompassing direct effects on SIC and DIC, indirect impacts on SOC, and N2O fluxes. To thoroughly investigate the CDR impact of ERW materials, we assessed the CDR Index for two distinct ERW materials: natural rock and industrial by-product silicate. Our four-month pot experiment involved control and two ERW amendments(olivine and blast furnace slag) alongside two planting scenarios(with alfalfa and without plants). We hypothesize that the CDR effect calculated using our comprehensive CDR Index will differ from that calculated using only DIC or SIC measurements. We anticipate significant increases in SIC and DIC for treatments, particularly with blast furnace slag due to its composition. In the plant-involved treatments, we anticipate both higher SIC, as plants accelerate weathering with their acidic exudates, and increased SOC, indicating improved plant growth and subsequent carbon sequestration. Variations in N2O fluxes are also anticipated with different ERW amendments. Initial data from three weeks shows significant DIC increases with blast furnace slag and modest increases with olivine. Greater plant biomass was observed in treatments compared to control, suggesting varied biological impacts. Throughout the remaining four-month experiment, we aim to document changes in SIC, DIC, SOC, and differences in N2O fluxes. These results are anticipated to vary based on the type of amendment and the planting options. This research is expected to underscore the significance of the biological effect in a comprehensive CDR assessment and contribute to identifying the most effective conditions for CDR with ERW when considering biological impacts. The findings are expected to guide future research and the implementation of ERW strategies, contributing to global climate change mitigation efforts.

How to cite: Ok, Y., Hyun, J., Park, Y. L., and Yoo, G.: Assessing the Impact of Enhanced Rock Weathering on Soil Biological Interactions with Comprehensive Carbon Dioxide Removal Index, EGU General Assembly 2024, Vienna, Austria, 14–19 Apr 2024, EGU24-2602, https://doi.org/10.5194/egusphere-egu24-2602, 2024.

EGU24-5560 | ECS | Posters on site | BG8.4

Maximizing limestone dissolution rate and alkalinity enhancement in an open-system benchtop reactor  

Noga Moran, Yonaton Goldsmith, and Eyal Wurgaft

Reducing CO2 emissions is crucial for mitigating climate change and its environmental impacts. A promising strategy for CO2 reduction involves enhancing limestone dissolution in seawater by reacting it with industrial CO2 waste gas to form dissolved bicarbonate, which prevents the CO2 from being released into the atmosphere. This process of limestone dissolution and atmospheric CO2 reduction occurs naturally over time-scales of 105 – 106 years and serves as “Earth's thermostat”. Enhancing this natural process could serve as an efficient way to remove man-made atmospheric CO2. To adapt this process to perform at industrial scales and rates suitable for mitigating climate change it is essential to scrutinize limestone dissolution rates and assess the parameters governing this process under controlled laboratory conditions. To assess the potential of limestone dissolution rates and characterize the conditions required to maximize dissolution rates and CO2 removal, we constructed a versatile benchtop reactor that mimics the natural limestone dissolution process and allows for experimenting with different materials and dissolution conditions. This experimental setup affords control over gas and recycled gas flow rates, as well as the mineralogy and grain size of the utilized limestones—parameters known to influence dissolution rates. The reactor is a 22 x 110 (cm) circular tube filled with a limestone medium. A continuous stream of seawater and CO2 gas is introduced into the reactor where it reacts with the limestone. An air pump recycles CO2 gas from the reactor head-space, in order to enhance the efficiency of CO2 dissolution in seawater. Excess gas and seawater are removed continuously from the reactor, creating an open, through-flowing system. The system is monitored online using temperature, pCO2 and pH meters. Total alkalinity (TA), dissolved inorganic carbon (DIC) and Calcium concentrations of the sea water in the reactor are sampled throughout the experiments and measured offline. To identify the parameters that achieve maximum limestone dissolution rates we performed experiments under different grain sizes, gas to seawater flows ratio, and recycled gas flow rate. Comparing our findings with previous studies reveals that a significant amount of limestone dissolution occurred in our system, leading to alkalinity enhancement in the sea water and removal of CO2. In the presentation, we will discuss the effects of the different parameters on the final total dissolution rate and suggest the set of parameters that maximize the limestone dissolution rate.

How to cite: Moran, N., Goldsmith, Y., and Wurgaft, E.: Maximizing limestone dissolution rate and alkalinity enhancement in an open-system benchtop reactor , EGU General Assembly 2024, Vienna, Austria, 14–19 Apr 2024, EGU24-5560, https://doi.org/10.5194/egusphere-egu24-5560, 2024.

EGU24-7456 | Posters on site | BG8.4

Olivine Fertilization for Carbon Dioxide Removal: Field Demonstrations and Insights in Diverse Forest Ecosystems in a Tropical Monsoon Climate 

Ci-Jian Yang, Chun-Wei Tseng, Chiu-Hsien Wang, Xinye Shi, and Chi-Wang Tsui

A novel geoengineering technique aims to counteract global warming caused by anthropogenic CO2 through artificially enhanced silicate weathering, achieved by the dissolution of olivine. Unlike other geoengineering concepts, CDR (carbon dioxide removal) techniques not only mitigate ocean acidification but also efficiently draw down atmospheric CO2. Models predict that we can sufficiently enhance silicate weathering enough for it to be a useful CDR strategy. The models typically rely on kinetic rate constants derived from benchtop experiments conducted under conditions far from equilibrium. Hence, empirical field demonstrations are crucial to validate the effectiveness of enhanced silicate weathering. Here, we implement additional olivine (Mg2SiO4) fertilization in three plots with the same dimensions but various forest forms, grassland, Chinese fir, and mixed woodlands. The olivine doses were equivalent to 200 tons ha-1 in this study. Combining monthly samplings of runoff chemistry with hourly runoff measurement, this study aims to delineate the chemical weathering flux. Preliminary findings reveal the concentration of Si4+,Mg2+, and Ca2+ within runoff at varying soil depths and forest forms. Specifically, in the Chinese fir plot, the concentration of Si4+ increased from 5.58 to 17.47 mg L-1 within the initial three months, subsequently diminishing to 5.54 mg L-1 after one year. Conversely, the grassland exhibited a decline from 4.20 to 2.46 mg L-1 in the same period. For mixed woodlands, Si4+ concentration elevated from 4.16 to 10.87 mg L-1 at three months, followed by a reduction to 5.54 mg/L after one year. The concentrations of Si4+ within the 30 to 85 cm depth exhibited minimal variation, fluctuating between 5–8 mg L-1. The initial concentrations of Mg2+ for the Chinese fir, grassland and mixed woodlands were 2.70, 0.19, and 1.19 mg L-1, escalating to 2.90, 1.76, and 2.14 mg L-1, respectively. Correspondingly, initial Ca2+ concentrations were 42.87, 37.13, and 24.07 mg L-1, increasing to 147.70, 49.40, and 45.58 mg L-1, subsequently declining to 21.70, 7.04, and 11.78 mg L-1. The observed trends suggest that nutrient deficiency in experimental plots prompts preferential Mg uptake by plants upon excess olivine addition, resulting in the release of Ca. These insights imply that olivine fertilization necessitates a minimum of three months and persists for at least 30 months in our case. Disparities in concentrations at different depths underscore the predominance of weathering in surface layers. While silicate weathering is more pronounced in forests compared to grasslands, excessive Mg addition may disrupt the equilibrium in plant nutrient uptake.

How to cite: Yang, C.-J., Tseng, C.-W., Wang, C.-H., Shi, X., and Tsui, C.-W.: Olivine Fertilization for Carbon Dioxide Removal: Field Demonstrations and Insights in Diverse Forest Ecosystems in a Tropical Monsoon Climate, EGU General Assembly 2024, Vienna, Austria, 14–19 Apr 2024, EGU24-7456, https://doi.org/10.5194/egusphere-egu24-7456, 2024.

EGU24-9664 | ECS | Orals | BG8.4

Carbon sequestration uncertainties: bridging the model-data gap for enhanced weathering 

Salvatore Calabrese, Matteo Bertagni, Giuseppe Cipolla, Leonardo V. Noto, and Amilcare Porporato

Enhanced weathering (EW) is a promising strategy for sequestering CO2 by amending cropland and forest soils with crushed silicate materials. However, current model-based estimates suffer from numerous uncertainties resulting from the incomplete representation of the weathering process in soils and a lack of model-data comparisons. Here, we address this gap by improving and validating an ecohydrological and biogeochemical soil model that captures the EW dynamics in the upper soil layers. We present a systematic model-experiment comparison leveraging four experiments with different degrees of complexity, ranging from simple closed incubation systems to fully open mesocosm experiments. The comparison reveals an encouraging observation-model agreement for the primary variables of interest, such as rock alkalinity release and CO2 sequestration. The comparison also demonstrates that the weathering rates consistently fall below those of flask dissolution experiments, underlining the need to update mineral weathering rate formulations in soils. As measurements from field trials become available, further model-data comparisons will help refine the model in support of large-scale EW deployments.

How to cite: Calabrese, S., Bertagni, M., Cipolla, G., Noto, L. V., and Porporato, A.: Carbon sequestration uncertainties: bridging the model-data gap for enhanced weathering, EGU General Assembly 2024, Vienna, Austria, 14–19 Apr 2024, EGU24-9664, https://doi.org/10.5194/egusphere-egu24-9664, 2024.

EGU24-9670 | ECS | Posters on site | BG8.4

Feeling the “pulse”: long-term studies are key to understanding carbon dynamics in bio-weathering 

Lucilla Boito, Laura Steinwidder, Patrick Frings, Arthur Vienne, Jet Rijnders, Jasper Roussard, and Sara Vicca

Besides rapid and deep greenhouse gas emission reductions, atmospheric Carbon Dioxide Removal strategies (CDRs) will be necessary to mitigate anthropogenic climate change. A promising CDR is Enhanced rock Weathering (EW), deployed on croplands. So far, most research focused on lab-based weathering and sequestration rates, but these might differ substantially in field settings, where biota may have a strong effect on EW processes (e.g., via bio-weathering). Additionally, these studies are mostly short-term, thus limiting our knowledge on the long-term effects of silicate addition on croplands.

Here, we set up a mesocosm experiment to quantify the carbon (C) sequestration of EW and how this is affected by biota. The experiment consisted of soils applied with basalt and combinations of corn and/or earthworms. It spanned over two growing seasons, for a total duration of 16 months. We measured i) Soil CO2 Efflux (SCE) , ii) porewater and leachate water alkalinity, Dissolved Inorganic Carbon (DIC), pH and other elemental chemistry, and iii) soil pH and elemental chemistry in order to determine weathering rates.

Our data shows that basalt had a different effect on SCE in the two growing seasons. In both seasons, the effect of basalt depended on plant presence, though in two different directions. In the first growing season, basalt increased emissions significantly compared to controls, but only when plants were present. In contrast, during the second growing season basalt significantly decreased SCE over time compared to controls, but only in absence of plants. Here, there was no effect of basalt on SCE whenever plants were present. These contrasting results suggest an initial stimulation of SCE (“pulse”) due to basalt application, especially prominent in the presence of plants and possibly involving changes in soil organic carbon dynamics. These findings highlight the need for long-term studies that outlast that initial “pulse” and elucidate the fate of organic carbon in order to accurately quantify the CDR potential of EW, as well as the role of biota therein.

How to cite: Boito, L., Steinwidder, L., Frings, P., Vienne, A., Rijnders, J., Roussard, J., and Vicca, S.: Feeling the “pulse”: long-term studies are key to understanding carbon dynamics in bio-weathering, EGU General Assembly 2024, Vienna, Austria, 14–19 Apr 2024, EGU24-9670, https://doi.org/10.5194/egusphere-egu24-9670, 2024.

EGU24-10324 | ECS | Orals | BG8.4

Destabilization of carbon in tropical peatlands by enhanced rock weathering 

Alexandra Klemme, Tim Rixen, Moritz Müller, Justus Notholt, and Thorsten Warneke

Southeast Asian peatlands represent a globally significant carbon store. Recent land use changes destabilize the peat, causing increased leaching of peat carbon into rivers. Despite resulting high river organic carbon concentrations, field data suggests only moderate carbon dioxide (CO2) emissions from rivers. We offer an explanation for this phenomenon by showing that carbon decomposition is hampered by the low pH in peat-draining rivers, and we find that enhanced input of carbonate minerals increases CO2 emissions by counteracting this pH limitation. One potential source of carbonate minerals to rivers is the application of enhanced weathering, a CO2 removal strategy that accelerates weathering-induced CO2 uptake from the atmosphere via the dispersion of rock powder. The effect of enhanced weathering on peatland carbon stocks is poorly understood. We present estimates for the response of CO2 emissions from tropical peat soils, rivers and coastal waters to enhanced weathering induced changes in soil acidity. The potential carbon uptake associated with enhanced weathering is reduced by 18−60 % by land-based re-emission of CO2 and is potentially offset completely by emissions from coastal waters. These findings suggest that, in contrast to the desired impact, enhanced weathering may destabilize the natural carbon cycle in tropical peatlands.

How to cite: Klemme, A., Rixen, T., Müller, M., Notholt, J., and Warneke, T.: Destabilization of carbon in tropical peatlands by enhanced rock weathering, EGU General Assembly 2024, Vienna, Austria, 14–19 Apr 2024, EGU24-10324, https://doi.org/10.5194/egusphere-egu24-10324, 2024.

EGU24-11274 | ECS | Posters on site | BG8.4

Concrete application in enhanced weathering: Investigating the effect of concrete on barley and oat under field conditions 

Christos Chondrogiannis, Katie O’Dea, Maurice Bryson, Ruadhan Magee, and Frank McDermott

Weathering, the breakdown of rock into its elements, is a carbon sequestering process and a significant component of the Earth’s long-term carbon cycle. As rock is weathered, atmospheric CO2 reacts with elements released, forming bicarbonates. These compounds are transported to the ocean where they are stored for thousands of years.

The above mechanism has garnered much attention in recent years for its use as a potential negative emissions technology to advance efforts in climate change mitigation. Enhanced weathering (EW) aims to accelerate carbon sequestering reactions of rock weathering by applying crushed rock onto vegetated surfaces. It’s also believed this practice could provide secondary benefits of improving crop yields and soil conditions. A variety of rocks, such as basalt and olivine, have been applied to different crops all over the world in an attempt to test their potential as a CO2 removal technique and natural fertilizer.

This study aims to build upon previous attempts by employing a novel material, crushed concrete. Concrete is abundant in fast-weathering minerals such as portlandite and amorphous calcium silicates, making it an ideal candidate for EW. By harnessing the same bicarbonate forming and carbon sequestering reactions but using a waste by-product of the construction industry, the sustainability and circularity of EW technology could be further increased.

In this study, crushed concrete was applied to fields of oat (Avena sativa) and barley (Hordeum vulgare) in Co. Wexford, Ireland, during the spring growing season. Physiological (chlorophyll fluorescence and stomatal conductance) and morphological (dry mass and plant height) parameters were measured through multiple stages of the plant growth to assess the impact of concrete application on crop health and yield. Our results showed an increase in the dry mass (specifically seed dry mass) of barley, suggesting that barley may benefit from concrete application. No significant changes were observed in oat. Our results suggest that concrete does not negatively impact crop yields and could even improve yields in certain crop species.

How to cite: Chondrogiannis, C., O’Dea, K., Bryson, M., Magee, R., and McDermott, F.: Concrete application in enhanced weathering: Investigating the effect of concrete on barley and oat under field conditions, EGU General Assembly 2024, Vienna, Austria, 14–19 Apr 2024, EGU24-11274, https://doi.org/10.5194/egusphere-egu24-11274, 2024.

EGU24-11347 | ECS | Orals | BG8.4

Scaling up enhanced rock weathering: field trials and ecohydrological modelling in a temperate forest  

Gregory Jones, Athanasios Paschalis, and Bonnie Waring

Enhanced Rock Weathering (ERW) utilizing basalt in forest ecosystems has emerged as a potentially scalable strategy for carbon dioxide removal (CDR) in the context of anthropogenic climate change. Despite a robust theoretical understanding of weathering processes across geological timescales, a critical lack of empirical ERW data exists for assessing its efficacy in climate mitigation at relevant timescales. Here, we present the first large-scale, replicated field trial of ERW coupled with tree planting at an afforestation experiment in mid-Wales. The factorial experimental design integrates basalt application and tree functional types (broadleaf vs. coniferous), examining key parameters such as soil pore water pH, alkalinity, soil respiration and aboveground tree biomass. By employing novel sampling techniques, we quantify ERW extent, providing nuanced insights. Over the first three years, initial observations highlight nutrient cycling perturbations post-basalt addition, offering immediate insights into ERW effects in a forested ecosystem. To mechanistically elucidate these observations, we introduce a novel ERW module within the Tethys-Chloris ecohydrological model framework, integrating a microbially explicit soil biogeochemical component. This integrated model aims to provide a robust foundation for understanding how ERW dynamics influence ecosystem carbon sequestration and guide best sampling practices.

How to cite: Jones, G., Paschalis, A., and Waring, B.: Scaling up enhanced rock weathering: field trials and ecohydrological modelling in a temperate forest , EGU General Assembly 2024, Vienna, Austria, 14–19 Apr 2024, EGU24-11347, https://doi.org/10.5194/egusphere-egu24-11347, 2024.

EGU24-12216 | ECS | Orals | BG8.4

Climate change mitigation? Interactions between bio-weathering and soil organic carbon dynamics  

Laura Steinwidder, Lucilla Boito, Arthur Vienne, Jet Rijnders, Patrick Frings, and Sara Vicca

There are two main processes acting as carbon sinks for CO2 on land: Silicate weathering and photosynthesis. The former creates bicarbonates which can be stored in soils or leached out and stored in the oceans, the latter leads to the formation of plant tissue which can be stored as soil organic matter. Soils are thus at the foundation of both of these land sinks and could therefore play a crucial role in tackling climate change. Either via enhanced silicate weathering (acceleration of the naturally extremely slow weathering process by finely grinding silicate rock and applying it on soils) or via improved management of soil organic carbon stocks.

However, there are still knowledge gaps regarding both, the natural weathering process and, more notably, the enhanced weathering process:

  • Does the presence of plants (further) accelerate the weathering rates?
  • Does an active weathering process increase soil organic carbon (SOC) stability?
  • Is there an interaction effect between the weathering process, plants and SOC?

Addressing these questions is crucial to evaluate effectiveness and safety of enhanced silicate weathering. For example, increased weathering rates due to the presence of plants, could increase the climate change mitigation effect, while increased organic matter decomposition could drastically reduce the mitigation potential of enhanced silicate weathering.

In an enhanced weathering experiment we investigated weathering rates, mineralogical changes, inorganic and organic carbon dynamics and greenhouse gas emissions. First findings provide evidence of bio-weathering; soil planted with maize displayed higher dissolved inorganic carbon and alkalinity concentrations as compared to unplanted soil. These findings are also supported by mineralogical analyses which revealed more pronounced changes in the mineral composition of planted treatments. So far, we have not only found compelling evidence of bio-weathering but we have also identified a potential connection between bio-weathering and SOC dynamics. Soil analyses showed that there was no clear change in SOC contents in planted pots. Unplanted pots, however, displayed an increase in SOC contents when silicates were added.

How to cite: Steinwidder, L., Boito, L., Vienne, A., Rijnders, J., Frings, P., and Vicca, S.: Climate change mitigation? Interactions between bio-weathering and soil organic carbon dynamics , EGU General Assembly 2024, Vienna, Austria, 14–19 Apr 2024, EGU24-12216, https://doi.org/10.5194/egusphere-egu24-12216, 2024.

EGU24-12257 | ECS | Posters on site | BG8.4

Potential for atmospheric carbon dioxide removal in mafic quarries via enhanced rock weathering of basalt fines 

Amanda Stubbs, Faisal Khudur, John MacDonald, Linzi McDade, and Mark Friel

Enhanced rock weathering (ERW) is a recognized carbon dioxide removal (CDR) strategy that uses crushed silicate rock (e.g., basalt) to capture atmospheric CO2, offering co-benefits such as improved soil health and increased crop production [1]. One of the main disadvantages of ERW includes the production of energy needed to crush and transport rocks to their application site [2]. Basalt quarries might be capable of removing CO2 on-site by optimizing the management of their quarry fines. This approach would reduce transport-related emissions while repurposing valuable and previously underutilized material. To test this possibility, basalt and dolerite fines from Breedon’s Orrock Quarry and Tarmac’s Cairneyhill Quarry in Scotland are used as potential feedstocks for on-site CDR, respectively. These samples show initial evidence of on-site weathering as secondary minerals are present in some areas of the fines at both the quarries. Thermogravimetric analysis (TGA) on these samples corroborates field observations as 0.75% and 1.76% CO2 were detected at Orrock and Cairneyhill, respectively. It is estimated that 10 kg CO2/ t Orrock fines and 23 kg CO2/ t Cairneyhill fines have been sequestered passively. Based on the CaO and MgO content, the carbonation potential is 190 kg CO2/ t Orrock fines and 160 kg CO2/ t Cairneyhill fines. Due to the challenge of accessing this potential under ambient conditions, it's essential to evaluate various on-site basalt management practices. To test this, ex-situ, column-based experiments were performed in the following manner. Fines from both sites were placed into columns with varying thicknesses (1 cm and 5 cm) and grain sizes (bulk and <75 μm). These columns were then subjected to ambient UK conditions (10 °C, 0.04% CO2) in an environmental chamber and intensified carbonation conditions (50 °C, 20% CO2) in a CO2 incubator. Both sets of experiments were in place for three months, with monthly water addition to facilitate natural wetting and drying. Secondary precipitates were visible on the surface of bulk fines from both sites regardless of thickness or chamber conditions with mass increases up to 0.5 g by the end of experiments. Sieved Orrock fines (<75 μm) in the CO2 incubator exhibit secondary precipitation, irrespective of sample thickness, displaying white patches on the surface and mass increases up to 1.5 g. Energy dispersive spectroscopy reveals that calcite has begun to fill in the pore spaces. Under ambient conditions, the bulk fines generally have the most significant carbon increase at greater depths, while the sieved fines show the greatest carbonation on the surface. This research has important implications for how fines are managed at quarries in the context of CO2 sequestration and may offer new opportunities for removing CO2 on-site at quarries.

[1] Beerling, D.J. et al., 2020. Potential for large-scale CO2 removal via enhanced rock weathering with croplands. Nature, 583(7815): 242-+. [2] Edwards, D.P. et al., 2017. Climate change mitigation: potential benefits and pitfalls of enhanced rock weathering in tropical agriculture. Biology Letters, 13(4).

How to cite: Stubbs, A., Khudur, F., MacDonald, J., McDade, L., and Friel, M.: Potential for atmospheric carbon dioxide removal in mafic quarries via enhanced rock weathering of basalt fines, EGU General Assembly 2024, Vienna, Austria, 14–19 Apr 2024, EGU24-12257, https://doi.org/10.5194/egusphere-egu24-12257, 2024.

EGU24-12948 | ECS | Orals | BG8.4 | Highlight

Comparing Potential Carbon Dioxide Removal Fluxes from Enhanced Rock Weathering with Baseline Fluxes in the UK 

Kirsty Harrington, Gideon Henderson, and Robert Hilton

Enhanced Rock Weathering (ERW) - the addition of crushed alkaline rocks onto agricultural land - has emerged as a promising approach for atmospheric carbon dioxide removal (CDR). Evaluating the global and UK CDR potential and environmental implications of ERW prior to widespread implementation is essential. Accurate quantification of CDR via ERW requires an understanding of the baseline CO2 flux due to existing natural and anthropogenic influences on weathering. Understanding these baseline weathering fluxes is also important for predicting the capacity of UK rivers to accommodate additional material from ERW, because natural weathering controls river geochemistry.  However, uncertainty exists regarding baseline values and their variability across UK catchments, which have varying lithological, climate, and anthropogenic influences. In this study, we quantify the annual baseline CO2 consumption due to natural weathering in the UK using historical river geochemical data, and a geochemical inversion technique to separate fluxes derived from weathering of silicate and carbonate rocks.

Results reveal that baseline silicate and carbonate weathering contributes up to 6.3 Mt CO2 yr-1 as dissolved inorganic carbon (DIC) to UK rivers combined. Within this total, silicate weathering, vital for long- term carbon removal, contributes up to 1.3 Mt CO2 yr-1. Normalising the CDR by catchment area highlights significant variability across the UK, with Midlands and southeastern catchments exhibiting the highest weathering CO2 yields. Increased DIC from baseline weathering in southeastern catchments brings riverine calcite saturation close to saturation thresholds. Consequently, these heightened weathering rates are expected to limit the rivers’ capacity to accommodate additional DIC from ERW. Conversely, our findings suggest that Midlands catchments may offer optimal conditions for ERW implementation- displaying favourable weathering conditions and increased riverine storage capacity to store ERW by-products. Therefore, the suitability of a catchment for ERW application hinges on achieving a balance between favourable weathering conditions and adequate riverine capacity for surplus weathering products. Consequently, a uniform approach to EW implementation may be unsuitable for widespread use in the UK. Instead, we propose a catchment specific approach, involving calculations of the potential river chemistry impacts based on intended spreading rate and arable land area.  Although more demanding, this ensures the safe implementation of ERW without compromising riverine chemical thresholds.

The baseline weathering CDR (6.3 MtCO2 yr-1) aligns with the lower end of that proposed achievable through widespread ERW implementation across the UK (6 -30 Mt CO2 yr-1)1. If this anticipated CDR is achieved and evenly distributed within UK rivers as DIC, the background riverine DIC flux would at least double. However, given the heterogenous distribution of arable land, our findings suggest that catchments with extensive arable land may experience a substantial DIC flux from ERW. This flux, especially in regions with high baseline values, could trigger carbonate precipitation, potentially reducing CDR potential by 16- 27%2.

References

1Kantzas et al (2022) ‘Substantial Carbon Drawdown Potential from Enhanced Rock Weathering in the United Kingdom’, 2Harrington et al (2023), Implications for the Riverine Response to Enhanced Weathering to CO2 Removal in the UK,


How to cite: Harrington, K., Henderson, G., and Hilton, R.: Comparing Potential Carbon Dioxide Removal Fluxes from Enhanced Rock Weathering with Baseline Fluxes in the UK, EGU General Assembly 2024, Vienna, Austria, 14–19 Apr 2024, EGU24-12948, https://doi.org/10.5194/egusphere-egu24-12948, 2024.

EGU24-15291 | ECS | Posters on site | BG8.4

Assessing the spatial expansion of plants in an Earth System model 

Khushboo Gurung, Benjamin Mills, and Dongyu Zheng

The emergence of land plants and their expansion across the Earth's surface has helped shape the climate of the Phanerozoic. Land plants are a major contributor to global photosynthetic biomass which in turn influences atmospheric CO2 and O2 levels. They also amplify continental weathering processes, which are a critical component of many global biogeochemical cycles. The inclusion of spatially-resolved vegetation within climate-biogeochemical models that predict paleo-CO2 and O2 levels can create a more accurate picture of the paleo-Earth [Gurung et al., in revision], however these applications have been limited by the availability of climate model simulations at high time resolution, which makes continuous spatial modelling difficult. Here, we use a new machine learning approach [Zheng et al., in revision] to build a 1-Myr climate emulator for the SCION climate-biogeochemcial model, and couple this to a deep-time vegetation model [FLORA; Gurung et al., 2022]. This allows us to re-run the plant colonisation of the land over the Paleozoic in detail and to view the global impact of changes in land occupation and productivity between early and more complex plants. By integrating simplified evolutionary and competition dynamics into the model, we can compare the effects on weathering, carbon burial and climate to help us better understand the dynamics that influence the expansion of plants and the resulting long-term Earth system changes.

Gurung et al., Climate windows of opportunity for plant expansion during the Phanerozoic Nat Comms 13 (2022)

How to cite: Gurung, K., Mills, B., and Zheng, D.: Assessing the spatial expansion of plants in an Earth System model, EGU General Assembly 2024, Vienna, Austria, 14–19 Apr 2024, EGU24-15291, https://doi.org/10.5194/egusphere-egu24-15291, 2024.

EGU24-15573 | ECS | Posters on site | BG8.4

Enhanced weathering in building materials: Capturing CO2 with olivine-based façade plaster 

Arne Irmai, Maximilian Berndsen, Rauno Baese, and Katharina Alms

Carbon dioxide (CO2) is the main greenhouse gas emitted by human activity, and reducing its presence in the atmosphere is one of the major challenges of the 21st century. The building and construction sector is responsible for a significant proportion of current anthropogenic CO2 emissions. According to the “2022 Global Status Report for Building and Construction”, the sector accounted for approximately 37% of global CO2 emissions in 2021.  Reducing the carbon footprint of building materials is a challenging task, as some process-related CO2 emissions are unavoidable. The industry is currently developing methods to mitigate these emissions by capturing CO2 from flue gas streams. In this study, we investigate an alternative approach to reducing the carbon footprint of building materials by incorporating olivine into building materials such as façade plaster.

In nature, CO2 is removed from the atmosphere through silicate weathering and stored over geological time scales as carbonate minerals. Incorporating olivine powder into building materials exposes the mineral to increased weathering conditions, which is expected to accelerate the process of CO2 sequestration. Façade plaster is advantageous because it covers large areas of building walls that are in direct contact with the atmosphere. The method is similar to the original idea of enhanced weathering, where crushed olivine is spread over large areas of land. However, the crucial distinction is that olivine-based façade plaster is a marketable product, making its implementation more appealing.

In collaboration with Knauf Gips KG, two test stands were constructed to expose olivine-containing façade plaster to natural and accelerated weathering conditions. Knauf Gips KG is a company that specialises in drywall and flooring systems, plaster, and facades, and produced the olivine-plaster used in the experiments. This plaster is exposed to ambient weathering conditions for 12 months at an outdoor test stand. Rainwater runoff is collected and analysed for dissolved species. The fluid analyses are used to identify potential ecological hazards resulting from olivine weathering, such as the release of heavy metals into the environment. In addition to the outdoor test stand, laboratory experiments are conducted to accelerate weathering by exposing the olivine-plaster to a constantly moist CO2 atmosphere. The composition of the water and atmosphere is monitored throughout the experiment. Mineralogical and structural changes of the plaster samples are analysed using X-ray diffraction (XRD) and scanning electron microscopy (SEM). The extent of CO2 mineralisation will be assessed based on mass balance calculations with the experimental reactants and their products. This contribution reports interim results from the outdoor test stand after a 6-month period and presents the results of laboratory experiments on olivine and plaster alteration.

How to cite: Irmai, A., Berndsen, M., Baese, R., and Alms, K.: Enhanced weathering in building materials: Capturing CO2 with olivine-based façade plaster, EGU General Assembly 2024, Vienna, Austria, 14–19 Apr 2024, EGU24-15573, https://doi.org/10.5194/egusphere-egu24-15573, 2024.

In addition to rapid emissions reduction, different Carbon Dioxide Removal (CDR) processes are required to be deployed in the order of many Gt y-1 for limiting the global temperature increase to the ambitious target set by the Paris Agreement.

Enhanced Rock Weathering (ERW) and River Alkalinity Enhancement (RAE) are CDR approaches that mimic and accelerate the natural process of rock weathering. These processes remove CO2 from the atmosphere and store it permanently in the sea in the form of bicarbonates, thanks to the spread of grinded alkaline materials (e.g., limestone, slaked lime or dolomite) in different environments, e.g., on croplands or in rivers.

The use of limestone or dolomite involves a long time for their dissolution, which can be accelerated by reducing the size of the particles in the order of micrometres. Alternatively, using slaked lime (SL) decreases the energy requirement for grinding because SL dissolution is faster at larger particle size than limestone. On the other hand, the production of SL causes unavoidable process CO2 emission and energy consumption during the calcination (i.e., the thermal decomposition of limestone into lime).

Here, a process that produces decarbonized SL for ERW or RAE is analyzed. It consists of the use of renewable electric energy for the calcination of limestone and of the storage of CO2. Two alternative CO2 storage systems are considered: geological storage and marine storage in the form of bicarbonates. The former is more studied and currently deployed with an annual global capacity of about 50 MtCO2 per year. However, geological storage has some drawbacks, such as the long time required for the identification of a formation suitable for storage, and a high financial risk because of the money loss in case the formation will result unsuitable. Furthermore, suitable geological formations are unevenly geographically distributed in the world and the long-term sustainability of the injection rate is uncertain. The latter storage approach, still in the first phases of the development, consists of the formation of bicarbonates by reacting CO2 from the calcination with seawater. Then, part of the decarbonized SL is used for balancing the pH, so a carbon-enriched marine solution with the same pH of the seawater is released. Unlike geological storage, this storage methodology is modular with certain and constant injection rate and can be deployed in every site near the coast.

The potential environmental impacts of the process with the two different CO2 storage technologies are analyzed through the Life Cycle Assessment (LCA) methodology. In addition to climate change, 15 impact categories are assessed according to the Environmental Footprint method implemented in Simapro software. The impacts are calculated on the basis of the mass and energy balance of the processes.

The limitations of the LCA methodology for assessing the overall environmental impacts of these processes will also be investigated. In particular, the lack of an impact category able to assesses the potential river environment remediation or the contrast to ocean acidification when the added alkalinity reaches the sea.

How to cite: Campo, F. P., Grosso, M., and Caserini, S.: Assessment of potential environmental impacts of an Enhanced Rock Weathering process for carbon dioxide removal in the form of bicarbonates by means of Life Cycle Assessment, EGU General Assembly 2024, Vienna, Austria, 14–19 Apr 2024, EGU24-15982, https://doi.org/10.5194/egusphere-egu24-15982, 2024.

EGU24-16303 | ECS | Posters on site | BG8.4 | Highlight

Exploring the Synergy of Enhanced Weathering and Rhizobacteria in Sustainable Agriculture 

Harun Niron, Laura Steinwidder, Jet Rijnders, Lucilla Boito, and Sara Vicca

Enhanced Weathering (EW) is a promising negative emissions technology for atmospheric CO2 removal, particularly in agricultural setups. Spreading silicate rock powder, such as basalt, over extensive agricultural lands not only sequesters CO2 but also provides essential nutrients like K, Mg, and Fe to crops. However, the efficiency of carbon sequestration in this system varies strongly, posing a challenge to widespread adoption, particularly among stakeholders like farmers.

Climate change intensifies weather extremes, exacerbating crop drought and heat stress, with detrimental effects on production. To address these challenges, the use of Plant Growth-Promoting Rhizobacteria (PGPR), such as Bacillus subtilis, emerges as a nature-based strategy. In addition to inducing stress resistance, B. subtilis possesses Fe and P solubilizing features, potentially enhancing EW rates. Indeed, our previous study demonstrated B. subtilis efficacy in accelerating basalt weathering by increasing Ca, Mg, and Fe dissolution in bare soil.

In a maize mesocosm experiment combining B. subtilis, basalt, and water content as variables, we observed a significant impact of B. subtilis on plant biomass in treatments, while basalt showed no major effect. In treatments with reduced irrigation, plants that were amended with basalt and B. subtilis displayed elevated leaf chlorophyll levels and improved nitrogen balance compared to plants that were not amended with B. subtilis. Across both high and low watering conditions, plants amended with basalt and B. subtilis exhibited enhanced photosynthetic activity and improved stomatal regulation. These findings suggest a promising added effect of PGPR B. subtilis to basalt-based EW for efficient crop health management under varying environmental conditions. This synergy has the potential to address the challenge of variable carbon sequestration efficiency and can provide a robust basis for improving crop health under diverse settings.

How to cite: Niron, H., Steinwidder, L., Rijnders, J., Boito, L., and Vicca, S.: Exploring the Synergy of Enhanced Weathering and Rhizobacteria in Sustainable Agriculture, EGU General Assembly 2024, Vienna, Austria, 14–19 Apr 2024, EGU24-16303, https://doi.org/10.5194/egusphere-egu24-16303, 2024.

EGU24-17266 | ECS | Orals | BG8.4 | Highlight

Alignment of industry, regulation and academia for quantification of carbon dioxide removal by enhanced weathering 

Christina Larkin, Matthew Clarkson, Philip Swoboda, Tom Reershemius, T. Jesper Suhrhoff, Cara Maesano, and James Campbell

Terrestrial enhanced weathering (EW) is a promising emerging carbon dioxide removal technique which involves the acceleration of natural weathering processes via the deployment of crushed rock feedstocks, typically Ca- and Mg-rich silicates, in soils. While models predict this has the potential to remove multiple gigatonnes of CO2 annually1,2, as an open-system pathway, the measurement (monitoring), reporting, and verification (MRV) of carbon removal and storage is challenging3. We will review the current literature showing the state-of-play of different methods for monitoring EW, as well as outlining links between industry, regulation and academia. Additionally, we outline a set of enhanced weathering carbon definitions in order to align academic studies and emergent industry in this area with the established voluntary carbon offset market. 

We will discuss two main pathways for measuring EW, one focused on solid phase measurements4 and the other on the aqueous phase3,5. Additionally, gas phase measurements have been deployed to understand CO2 fluxes, but are dominated by short-term organic carbon cycling. We emphasise that, although there is complexity in tracing EW CDR in the natural field environment, established literature validates existing approaches, and each measurement approach has strengths and limitations. The complexity inherent in EW is navigable through redundant measurement strategies and well designed experiments, which we highlight are crucial in the nascent stages of the EW industry.

1Taylor, L. L. et al. Nat. Clim. Change 6, 402–406 (2016)

2Beerling, D. J. et al. Nature 583, 242–248 (2020)

3Clarkson, M. O. et al. preprint EarthArXiv (2023)

4Reershemius, T., Kelland, M.E., et al.. Environ. Sci. Technol. (2023) 

5Larkin, C. S. et al. Front. Clim. 4, (2022).

How to cite: Larkin, C., Clarkson, M., Swoboda, P., Reershemius, T., Suhrhoff, T. J., Maesano, C., and Campbell, J.: Alignment of industry, regulation and academia for quantification of carbon dioxide removal by enhanced weathering, EGU General Assembly 2024, Vienna, Austria, 14–19 Apr 2024, EGU24-17266, https://doi.org/10.5194/egusphere-egu24-17266, 2024.

EGU24-20481 | ECS | Posters on site | BG8.4

Assessing the biogeochemical impacts of terrestrial enhanced rock weathering on soil fertility 

Xavier Dupla, Romane Claustre, Emma Bonvin, Iris Graf, Claire Le Bayon, and Stéphanie Grand

Terrestrial enhanced rock weathering (ERW) is a promising carbon dioxide removal technology that consists in applying ground silicate rock on agricultural soils. ERW efficiency is based on the carbon dioxide sequestration associated with the chemical weathering of silicate minerals. On top of carbon sequestration, this chemical weathering can most notably raise the soil pH and release nutrients, thereby potentially improving soil fertility. Despite these possible cobenefits, potential drawbacks such as heavy metal pollution or soil structure damage have also been raised. Yet to our knowledge, these potential effects of ERW on soil fertility have not been simultaneously investigated.

This field trial assessed the impact of ERW on biological, physical, and geochemical dimensions of soil fertility. Overall, basalt addition had a predominantly positive to neutral effect on soil fertility. The majority of soil properties showed no significant change either 1 month or 1 year post basalt application. Nevertheless, our study highlighted a significant increase in earthworm biomass, soil respiration and sodium concentration as early as 1 month post application. These changes, suggestive of rapid initial weathering processes, require further investigation before enhanced rock weathering can be considered a viable and secure carbon dioxide removal technology.

How to cite: Dupla, X., Claustre, R., Bonvin, E., Graf, I., Le Bayon, C., and Grand, S.: Assessing the biogeochemical impacts of terrestrial enhanced rock weathering on soil fertility, EGU General Assembly 2024, Vienna, Austria, 14–19 Apr 2024, EGU24-20481, https://doi.org/10.5194/egusphere-egu24-20481, 2024.

EGU24-20843 | ECS | Posters on site | BG8.4

Application of an Innovative Centrifuge-Based Soil Pore Water Sampling Method in Basalt Enhanced Weathering Field Trials. 

Anezka Radkova, XinRan Liu, Tzara Bierowiec, Erin Chen, Ifeoma Edeh, Amy Frew, Matthew Healy, Lucy Jones, Amy Mc Bride, Mel Murphy, Robert Palmer, Kirstine Skov, Utku Solpuker, Will Turner, Villa de Toro Sanchez, Peter Wade, Jez Wardman, and Jim Mann

Basalt Enhanced Weathering as a Carbon Dioxide Removal (CDR) technology accelerates natural weathering, enhancing the CO2 removal from the atmosphere. The main objective of the ongoing field trials in Scotland and the UK is to combine geochemistry modelling with in-field measurement to most accurately quantify CO2 sequestration. To measure the weathering signal in the field, we track changes in indicators such as soil inorganic carbon (SIC), soil organic carbon (SOC), exchangeable cations, trace/immobile elements, and soil biomass. Pore water analysis is critical for directly quantifying CO2 sequestration. Bicarbonate in soil pore water is a  CO2 removal indicator, as it forms through the reaction of silicate minerals with dissolved CO2 during the initial weathering process. We analyze pore water for pH, alkalinity, Electrical Conductivity (EC), major cations, and anions. This task can be challenging due to sampling issues, the absence of rainfall, and the time-sensitive nature of alkalinity measurements. Analyses of pore water chemistry rely on the ability to separate water from solids with minimal modification of its chemistry. Rhizon samplers and ceramic lysimeters are commonly used for pore water extraction. They may not be ideal for parameters like pH and alkalinity due to certain limitations, such as degassing of dissolved gases, and biases in molecule diffusion through the membrane. In response, we are testing a centrifuge method for pore water sampling from basalt amended fields. In the initial trial, statistical significance tests were conducted to compare the pH and total alkalinity between control plot and Treatment 126 t/ha in both centrifuge and rhizon samples, revealing a statistically significant difference (p < 0.05) in values within the centrifuge samples. However, no significance was observed in the rhizon samples. We present the results of ongoing tests from different treatments and soil types conducted to investigate whether centrifuge would be a suitable method for pore water sampling and alkalinity measurement for the enhanced weathering field trials.

How to cite: Radkova, A., Liu, X., Bierowiec, T., Chen, E., Edeh, I., Frew, A., Healy, M., Jones, L., Mc Bride, A., Murphy, M., Palmer, R., Skov, K., Solpuker, U., Turner, W., de Toro Sanchez, V., Wade, P., Wardman, J., and Mann, J.: Application of an Innovative Centrifuge-Based Soil Pore Water Sampling Method in Basalt Enhanced Weathering Field Trials., EGU General Assembly 2024, Vienna, Austria, 14–19 Apr 2024, EGU24-20843, https://doi.org/10.5194/egusphere-egu24-20843, 2024.

EGU24-20871 | Posters on site | BG8.4 | Highlight

Enhanced Rock Weathering and Climate Mitigation: Prospects in Urban Farming  

Simon Redfern, Shang Ma, Yiwen Zhang, Zhaofeng Ouyang, and Chin-Hsien Cheng

As part of a study of enhanced rock weathering in tropical lowland soils in an agricultural setting we are embarking on an assessment of the role of ERW in urban farming scenarios. Here, we present an evaluation of key agricultural settings in which quantification may be best achieved. In the context of Singapore, which has an ambition of domestic production of 30% of its nutritional needs by 2030, this must include urban farming. We assess development of methods for geochemical analysis of cation mobility due to weathering in urban farming substrates. We have developed a matrix of key factors in enhancing soil and likely carbon drawdown; validation and testing of existing models. Finally, we conduct assessment of implications for agricultural productivity and economic viability.

How to cite: Redfern, S., Ma, S., Zhang, Y., Ouyang, Z., and Cheng, C.-H.: Enhanced Rock Weathering and Climate Mitigation: Prospects in Urban Farming , EGU General Assembly 2024, Vienna, Austria, 14–19 Apr 2024, EGU24-20871, https://doi.org/10.5194/egusphere-egu24-20871, 2024.

EGU24-21512 | Orals | BG8.4 | Highlight

Biological weathering in model systems across scales 

Katerina Dontsova

Plants and microorganisms derive mineral nutrients needed for their development and growth from dissolution of the minerals present in the soil. There is strong evidence that plants and microorganisms can increase the weathering and nutrient supply through active and passive mechanisms. However, biological weathering is challenging to quantify, particularly in natural systems, due to complex interactions between rock/parent material, hydrology of the site, and biota. Because of this, model experimental systems are often used to examine weathering in general and biological weathering in particular. This presentation focuses on several experiments that examined rock weathering as influenced by biota – non-vascular and vascular plants, free living microorganisms, and microorganisms in symbiotic relationships with plants – across different space and time scales from small mesocosm experiments to Landscape Evolution Observatory, a facility at the University of Arizona Biosphere 2 with three replicate 30 by 11 m hillslopes. The majority of these studies represent incipient weathering, where unweathered rock is used as a medium for plant growth. We will discuss evidence for biological weathering, partitioning of weathering products, and fluxes of CO2 related to weathering processes. Influence of natural succession and biological complexity on weathering will also be discussed.

How to cite: Dontsova, K.: Biological weathering in model systems across scales, EGU General Assembly 2024, Vienna, Austria, 14–19 Apr 2024, EGU24-21512, https://doi.org/10.5194/egusphere-egu24-21512, 2024.

EGU24-21707 | ECS | Posters on site | BG8.4

Concrete as a soil amendment for carbon capture: learnings from year one of an enhanced weathering field trial in County Wexford, Ireland. 

Ruadhan Magee, Maurice Bryson, Leo Hickey, Christos Chondrogiannis, Katie O'Dea, David van Acken, and Frank McDermott

In this study, we investigate the use of milled returned concrete as an enhanced weathering soil amendment, on two arable fields in County Wexford, Ireland. The applied concrete consists of portlandite (Ca(OH)2) cement with limestone (CaCO3) aggregate. The high cation concentration and rapid weathering kinetics of both components indicate good potential for carbonic acid neutralisation and atmospheric CO2 removal as soil-water dissolved bicarbonate (HCO3-). In spring 2023, prior to crop planting (oats and barley), both trial fields were divided into two sections. Milled returned concrete was applied to a ‘treatment’ section while no concrete was applied to a ‘control’ section. All other farming practices (ploughing, tilling, sowing and fertilisation) were equivalent across control and treatment. Twelve suction-cup lysimeters were installed in each field (6 control and 6 treatment) to collect soil-water samples across the growing season and the concentrations of bicarbonate, major cations and anions were measured to assess carbon removal. Preliminary results indicate that where nitrate (NO3-) levels are low in concrete amended sites, bicarbonate concentrations are elevated above control. However, where soil-nitrate levels are high, weathering liberated cations are balanced by nitrate, and bicarbonate production is suppressed. Our findings highlight the importance of fertiliser management for optimising CO2 removal outcomes of enhanced weathering.

How to cite: Magee, R., Bryson, M., Hickey, L., Chondrogiannis, C., O'Dea, K., van Acken, D., and McDermott, F.: Concrete as a soil amendment for carbon capture: learnings from year one of an enhanced weathering field trial in County Wexford, Ireland., EGU General Assembly 2024, Vienna, Austria, 14–19 Apr 2024, EGU24-21707, https://doi.org/10.5194/egusphere-egu24-21707, 2024.

EGU24-21731 | ECS | Orals | BG8.4 | Highlight

Tracking river responses to enhanced rock weathering 

Shuang Zhang, Christopher Reinhard, Shaoda Liu, Yoshiki Kanzaki, and Noah Planavsky

Enhanced Rock Weathering (ERW) is gaining prominence as a viable option among Carbon Dioxide Removal strategies, offering a sustainable way to reduce atmospheric CO₂ levels, along with additional benefits such as improved soil pH and nutrient release. However, a detailed understanding of how ERW affects river systems—a critical factor in assessing its net efficiency in consuming CO₂—is still lacking, impeding its broader acceptance as a consistent carbon management method. This study aims to bridge this gap using a comprehensive integrated approach that combines machine learning and numerical models, specifically targeting river systems in North America. A key element of our methodology is the implementation of an innovative dynamic river network model, designed to provide a thorough analysis of river responses to ERW application. Our research indicates relatively low carbon leakage in most river segments over a two-year period. Nevertheless, we also highlight significant spatial and seasonal variations in these responses, paving the way for a strategic plan to optimize ERW deployment by selecting the most suitable watersheds and optimal times for application.

How to cite: Zhang, S., Reinhard, C., Liu, S., Kanzaki, Y., and Planavsky, N.: Tracking river responses to enhanced rock weathering, EGU General Assembly 2024, Vienna, Austria, 14–19 Apr 2024, EGU24-21731, https://doi.org/10.5194/egusphere-egu24-21731, 2024.

OS4 – Global ocean processes and oceanographic techniques

EGU24-1149 | ECS | Orals | OS4.1

Mass transport induced by 5-th order nonlinear water waves 

Laura Grzonka and Witold Cieślikiewicz

Linear theory of water waves is reasonable to use only in the case of small waves. As the waves’ steepness increases, nonlinear effects start to play a role too significant to be neglected. One of the widely used and commonly accepted methods of calculating water wave kinematics is Fenton’s method (Fenton 1985). It allows one to find free surface elevation and velocity potential up to 5th order in wave steepness.

In case of wave-related phenomena, among quantities of interest is wave-induced mass transport as its knowledge is necessary to find tracer transport, like oil pollution, algae bloom, or plastic. Cieślikiewicz & Gudmestad (1994) introduced a method of calculating mass transport induced by harmonic and random water waves. A key contribution in this study was taking into account the emergence effect: in the Eulerian frame of reference, a fixed point in space in the vicinity of the free surface emerges and submerges under the water.


The primary objective of the present study was to integrate Fenton’s kinematics into the Cieślikiewicz & Gudmestad methodology for more accurately calculating the wave-induced mass transport. I used the perturbation scheme and the technique of transformation of random variables (Huang et al. 1983). The results demonstrate strong agreement with previous approaches.


Cieślikiewicz, W. & Gudmestad, O. T. (1994). Mass transport within the free surface zone of water waves. Wave Motion, 19(2), 145–158. https://doi.org/10.1016/0165-2125(94)90063-9

Fenton, J. D. (1985). A Fifth-Order Stokes Theory for Steady Waves. Journal of Waterway, Port, Coastal, and Ocean Engineering, 2(111), 216–234

Huang, N. E., Long, S. R., Tung, C.-C., Yuan, Y., & Bliven, L. F. (1983). A Non-Gaussian Statistical Model for Surface Elevation of Nonlinear Random Wave Fields. Journal of Geophysical Research, 88(C12), 7597–7606; Papoulis, A., & Pillai, S. U. (2002). Probability, Random Variables and Stochastic Processes. McGraw-Hill

How to cite: Grzonka, L. and Cieślikiewicz, W.: Mass transport induced by 5-th order nonlinear water waves, EGU General Assembly 2024, Vienna, Austria, 14–19 Apr 2024, EGU24-1149, https://doi.org/10.5194/egusphere-egu24-1149, 2024.

EGU24-1374 | Orals | OS4.1

Impact of submesoscale currents on surface waves: the U2H map 

Jacques Vanneste, Ana B. Villas Bôas, Han Wang, and William R. Young

Ocean turbulence at meso- and submesocales affects the propagation of surface waves through refraction and scattering. This induces spatial modulations in wave energy, with implications for air–sea exchanges, the likelihood of extreme waves, and remote sensing. We develop a theoretical framework that relates modulations in significant wave height (SWH) to the currents that induce them. We exploit the asymptotic smallness of the ratio of typical current speed to wave group speed (which holds for wavelengths above 10 m or so) to derive a linear map – the U2H map – that relates SWH anomalies to the surface current velocity. This map is a convolution, non-local in space but expressible as a product in Fourier space and, crucially, independent of the magnitude of the Fourier vector. The properties of the map show how the SWH anomaly responds differently to the vortical and divergent parts of the currents, and how the anisotropy of the wave spectrum is key to large current-induced SWH anomalies. Analysing the U2H map, in particular for swell-like, highly directional waves enables us to explain a series of earlier numerical observations. We implement the U2H map numerically and test its predictions against  WAVEWATCH III numerical simulations for both idealised and realistic current configurations. Our framework can be straightforwardly extended to relate characteristics of the wave field other than SWH such as Stokes drift to the currents.  

How to cite: Vanneste, J., Villas Bôas, A. B., Wang, H., and Young, W. R.: Impact of submesoscale currents on surface waves: the U2H map, EGU General Assembly 2024, Vienna, Austria, 14–19 Apr 2024, EGU24-1374, https://doi.org/10.5194/egusphere-egu24-1374, 2024.

EGU24-1403 | Orals | OS4.1 | Highlight

Global Tropical Cyclone Extreme Wave Climatology 

Ian Young and Guisela Grossmann-Matheson

In tropical and sub-tropical regions, tropical cyclones represent one of the most important sources of extreme meteorological events. The extreme ocean waves generated by such events have important engineering, oceanographic and societal impacts. This presentation outlines the results of the application of a computationally efficient parametric tropical cyclone ocean wave prediction model to each of the world’s tropical cyclone basins. The parametric model is based on present understanding of wind-wave physics in such systems and is formulated through more than 300 simulations of the Wavewatch III model covering the parameter range of typical tropical cyclones. The model is applied to synthetic tropical cyclone tracks for both historical and future projected periods. In each case, the equivalent of 1000 years of synthetic tropical cyclones is simulated for each basin. Extreme value analysis of the resulting data is used to estimate the 100-year return period significant wave height distribution across each basin. The results are explained in terms of the key tropical cyclone parameters. In addition to providing a comprehensive analysis of present day tropical cyclone wave extremes, the analysis describes how such extremes are projected to change under future climate change scenarios.

How to cite: Young, I. and Grossmann-Matheson, G.: Global Tropical Cyclone Extreme Wave Climatology, EGU General Assembly 2024, Vienna, Austria, 14–19 Apr 2024, EGU24-1403, https://doi.org/10.5194/egusphere-egu24-1403, 2024.

EGU24-2266 | ECS | Orals | OS4.1

The impact of the Airflow Separation on the Wind-Wave Momentum Flux 

Peisen Tan, Ivan Savelyev, Brian Haus, and Silvia Matt

In this laboratory investigation, a range of wind and wave conditions was sampled to visualize the airflow and to quantify the mechanisms through which the momentum is transferred towards a wavy surface. The experiments were conducted in the SUrge STructural AIr-sea INteraction facility located at the University of Miami. Three distinct background wave conditions were subjected to wind forcing U 10  of 7 and 14 m/s, to investigate the effects of wave amplitude, frequency, as well as wind forcing on the airflow regime and momentum transfer. We report that under the milder wind forcing (U 10 = 7 m/s ) and the least steep wave, no sign of sheltering was observed. The airflow streamlines follow the shape of surface waves, resulting in a wide area of lower-than-average pressure above the wave crest. In this regime, more than 90% of the air-sea momentum transfer comes from the viscous drag at the surface due to the smooth airflow tightly following a smooth wave surface. Meanwhile, such pressure distribution above the waves is mostly the result of the Bernoulli Effect due to the wave shape, with almost-symmetrical low pressure above the wave crest and high pressure above the wave trough. However, a sole increase in wave frequency, while maintaining the amplitude and the wind forcing, is enough to induce airflow sheltering on the leeward side of the wave due to the steepened wave crest. Further, an increase of wind forcing over the same steepened crest did not alter the airflow regime or the pattern of the airflow pressure distribution, while doubling the momentum transfer magnitude. Here, the sheltered airflow regime is further evidenced by the enhanced turbulent kinetic energy observed on the leeward side of the wave. In these conditions, the viscous drag weakens, and the form drag rises to become the dominant mechanism for the air-sea momentum flux, accounting for over 50% of the total stress. In this regime, the pressure distribution is the result of aerodynamic sheltering, with high pressure on the windward side and low pressure on the leeward side. The results of this work will serve as the first step within a larger effort to develop a new formulation for the wave model wind input function, which will account for the airflow separation physics.

How to cite: Tan, P., Savelyev, I., Haus, B., and Matt, S.: The impact of the Airflow Separation on the Wind-Wave Momentum Flux, EGU General Assembly 2024, Vienna, Austria, 14–19 Apr 2024, EGU24-2266, https://doi.org/10.5194/egusphere-egu24-2266, 2024.

EGU24-2475 | ECS | Posters on site | OS4.1

Assessing wave energy as extreme events propagate near the coast 

Reine Matar, Nizar Abcha, Emma-Imen Turki, and Nicolas Lecoq

Keywords

Physical modeling; Wave flume; Extreme waves; Wavelet transform; Machine Learning; MLP model

Physical modeling, spectral analysis, and artificial intelligence techniques were used to study extreme wave behavior and its evolution in shallow waters. A series of physical tests were conducted in a laboratory wave flume using different wave spectra, including JONSWAP (γ = 7), JONSWAP (γ = 3.3), and Pierson-Moskowitz, varying within a broad range of wave amplitudes. The dispersive focusing technique was used to generate these spectral waves. To account for the varying duration of extreme events, one, three, six, and nine wave trains were generated. A total of fifty-one wave gauges, located between 4 m and 14 m from the wave generator, provided comprehensive monitoring of the wave characteristics and their propagation along the wave flume [1]. The analysis incorporates wavelet transform to identify frequency components and their assigned energy using the Maximal Overlap Discrete Wavelet Transform (MODWT) method. The energy of the dominant frequency components, d5 and d4, which represent the peak frequency (fp = 0.75 Hz) and its first harmonic (2fp = 1.5 Hz), respectively, has significantly decreased. In contrast, the energy of the remaining components has increased. By investigating the energy of each frequency component along the wave flume, potential correlations between the dissipation of dominant frequency components and zones of higher energy dissipation are explored. Moreover, using the Multilayer Perceptron (MLP) machine learning algorithm [2], the study confirmed the repeatability of our findings regarding the energy of the frequency components with an accuracy of 98%. This study demonstrates the effectiveness of the MLP algorithm in improving wave prediction using field experimental data.

[1] Zhang, J., Benoit, M., Kimmoun, O., Chabchoub, A., & Hsu, H. C. (2019). Statistics of extreme waves in coastal waters: large scale experiments and advanced numerical simulations. Fluids, 4(2), 99.

[2] Abroug, I., Matar, R., & Abcha, N. (2022). Spatial Evolution of Skewness and Kurtosis of Unidirectional Extreme Waves Propagating over a Sloping Beach. Journal of Marine Science and Engineering, 10(10), 1475.

How to cite: Matar, R., Abcha, N., Turki, E.-I., and Lecoq, N.: Assessing wave energy as extreme events propagate near the coast, EGU General Assembly 2024, Vienna, Austria, 14–19 Apr 2024, EGU24-2475, https://doi.org/10.5194/egusphere-egu24-2475, 2024.

EGU24-2553 | Orals | OS4.1

Comparative assessment of VOS and model wind waves over the global oceans accounting for sampling effects 

Vitali Sharmar, Vika Grigorieva, and Sergey Gulev

Validation of the global model long-term wind wave hindcasts against wave observations from Voluntary Observing Ships (VOS) are of a high demand, as VOS observations provide separate estimates of wind sea and swell for a long period of about several decades. However, VOS data suffer from spatial and temporal inhomogeneity of sampling and direct comparisons with model output are difficult as there is no way of quantifying differences associated with model setting and with sampling uncertainties. In this study, we perform a validation of the 40-yr long (1980-2019) wave model hindcast performed with WAVEWATCH-III spectral wave model forced with ERA5 reanalysis against provisionally corrected global VOS wind wave archive, accounting for sampling density in VOS data. For this purpose, model output was subsampled according to the VOS observations using the space-time collocation technique. This allows for estimating the total sampling uncertainty of significant wave heights (SWH), wind sea and swell. Further, this allows for comparison of model data with VOS observations which is not influenced by sampling biases.

Sampling uncertainties in SWH are largely driven by sampling uncertainties in the wind sea, being quite close to each other. Total sampling error variability in SWH and wind sea provide considerable reduction of uncertainties along the major ship routes where sampling errors drop by several times compared to the areas outside of the dense ship traffic. The smallest sampling uncertainties are identified in the North Atlantic subtropics where relatively weak short-term variability of wind waves is collocated with the moderately high sampling associated by dense ship traffic between Europe and the North America. Estimates of sampling errors are separately developed for sea and swell providing hints on the accuracy of wea and swell portioning in spectral wave model. We also estimated the impact of sampling onto extreme wind waves and this impact regionally is not necessarily correlated with the effect of sampling on means. Finally analysis is performed for patterns of interannual variability, including long-term trends.

This study is funded by RSF project # 23-47-00030.

How to cite: Sharmar, V., Grigorieva, V., and Gulev, S.: Comparative assessment of VOS and model wind waves over the global oceans accounting for sampling effects, EGU General Assembly 2024, Vienna, Austria, 14–19 Apr 2024, EGU24-2553, https://doi.org/10.5194/egusphere-egu24-2553, 2024.

EGU24-3247 | ECS | Posters on site | OS4.1

Effect of waves on the magnitude and direction of wind stress over the ocean 

Carlos E. Villarreal-Olavarrieta, Francisco J. Ocampo-Torres, Pedro Osuna, and Rodney E. Mora-Escalante

Wind Stress plays a vital role in the sea-atmosphere interaction process, which affects climate, weather, and oceanic circulation models. Wind drag coefficient parameterizations are usually used to estimate wind stress; these relationships tend to overestimate or underestimate the momentum transfer, especially in weak to moderate wind regimes during swell conditions. Also, it is commonly presumed that the wind stress is always aligned with the wind, but this is only sometimes the case.

The wind stress and its turbulent and wave-coherent components were estimated through measurements of the free surface level and the wind speed using a spar buoy with a sonic anemometer and an array of six wave staffs. The state of the sea was also characterized by obtaining the directional spectrum of the waves. Continuous measurements were made for at least four months at three different sites (two in the Gulf of Mexico and one in the northern Mexican Pacific) with sampling rates of 10 Hz for free surface level and 100 Hz for wind speed. Multiple swell systems’ influence on the wave boundary layer is avoided by only analyzing events with a single dominant wave system.

 It was observed that during swell conditions with wind traveling in the same direction, the wave-coherent wind stress component has an opposite direction to the wind, which dampens the total wind stress magnitude. During counter-directional wind relative to swell traveling direction, the wave boundary layer is modified; it appears that swell accelerates wind near the surface without changing its direction, resulting in a wind stress magnitude more significant than expected.

Also, during the wind stress analysis, a reference frame oriented to the propagation direction of the primary wave system was found to be better for asses wind waves’ influence on the wind stress magnitude and direction. Using this frame of reference makes it possible to isolate wind wave influence on wind stress in its directional component aligned with the wave direction. The perpendicular directional component relative to the wave’s direction is primarily turbulent.

How to cite: Villarreal-Olavarrieta, C. E., Ocampo-Torres, F. J., Osuna, P., and Mora-Escalante, R. E.: Effect of waves on the magnitude and direction of wind stress over the ocean, EGU General Assembly 2024, Vienna, Austria, 14–19 Apr 2024, EGU24-3247, https://doi.org/10.5194/egusphere-egu24-3247, 2024.

EGU24-3679 | ECS | Posters on site | OS4.1

Assessment of different CMIP6 regional wind wave climate downscaling approaches – From a global to a local perspective 

Alberto Meucci, Matteo Lorenzo, Jin Liu, Jozef Syktus, Claire Trenham, Vanessa Hernaman, Ron Hoeke, Miguel Onorato, and Ian Young

Wind waves play a crucial role in coastal dynamics and can significantly impact coastal sea levels, especially during extreme events. Ocean winds are changing as the Earth is warming, and hence the waves. The Australian Climate Service (https://www.acs.gov.au/), recognised wind waves as a crucial element to support future coastal climate mitigation and adaptation strategies. Wind wave climate future projections are, however, plagued by uncertainties. One of the primary sources of uncertainty originates from the resolution of the Coupled Model Intercomparison Project (CMIP) General Circulation Model (GCM) surface wind speed products. We hereby assess different approaches to regional wind wave climate modelling, to understand the impact of the CMIP6 GCM wind speed resolution. We evaluate the Southeast Australia wave climate results from an unstructured grid regional wave model nested in a global wave model. We compare 30 years (1985-2014) of historical wave climate simulations using wind vectors from the CMIP6 Meteorological Research Institute (MRI) CMIP, AMIP, and HighResMIP experiments (nominal resolutions of ~150 km for CMIP and AMIP, and 25 km for HighResMIP). We then compare these results with the wave model forced by the MRI CMIP surface winds dynamically downscaled with the Conformal Cubic Atmospheric Model (CCAM) (~12.5 km resolution). The findings indicate that the wind wave climate models yield divergent results, particularly at the extremes where the most interest lies for future coastal sea level projections. We discuss the reasons for the differences and propose the best way forward for developing regional wind wave climate projections.

How to cite: Meucci, A., Lorenzo, M., Liu, J., Syktus, J., Trenham, C., Hernaman, V., Hoeke, R., Onorato, M., and Young, I.: Assessment of different CMIP6 regional wind wave climate downscaling approaches – From a global to a local perspective, EGU General Assembly 2024, Vienna, Austria, 14–19 Apr 2024, EGU24-3679, https://doi.org/10.5194/egusphere-egu24-3679, 2024.

EGU24-6797 | Orals | OS4.1 | Highlight

Wave statistics and spectral shape in the nearshore region 

Johannes Gemmrich

Human interaction with ocean surface waves occurs mainly in the nearshore region. Waves propagating towards the coast over gradually sloping bathymetry undergo fundamental transformations, resulting in statistics and spectral energy distributions that are substantially different to those of the incoming wave field in deep water. This is of particular importance to the generation of individual extreme waves.

This presentation will address our recent observational studies of spectral wave properties and surface elevation statistics at various nearshore locations ranging from normalized water depth of kH > 5 (deep water) to kH < 0.1 (beach-water interface). Data were obtained by surface following wave buoys, bottom-mounted pressure sensors, and an acoustic current profiler. The data reveal the dependence of skewness, kurtosis, and wave groupiness on normalized water depth, and on the position within the surf zone relative to the onset of depth-induced breaking. In the surf zone, skewness and groupiness are modulated coherently, whereas modulations of the kurtosis seem to be more random. In addition, the spectral change of the wave energy across the surf zone including the emerging infragravity wave signal will be discussed.

How to cite: Gemmrich, J.: Wave statistics and spectral shape in the nearshore region, EGU General Assembly 2024, Vienna, Austria, 14–19 Apr 2024, EGU24-6797, https://doi.org/10.5194/egusphere-egu24-6797, 2024.

EGU24-10064 | ECS | Orals | OS4.1

Potential of synthetic aperture radar wide swath acquisitions to map sea state variability of European seas 

Lisa Maillard, Antoine Grouazel, Frédéric Nouguier, Mickael Accensi, Robin Marquart, Jean-Marc Delouis, and Alexis Mouche

Copernicus Sentinel-1 Synthetic Aperture Radar (SAR) mission systematically acquires data in Interferometric Wide swath mode over European land and water. This study investigates the potential of this data processed into Level-1 (L1) Single Look Complex (SLC) to compute meaningful image cross-spectra over the ocean to retrieve ocean surface waves parameters. First, each L1 SLC is processed relative to a "tile'', a prescribed spatial division of the burst (a unitary acquisition sequence of Sentinel-1 TOPS mode) and SAR image cross-spectra are defined within the burst and between two adjacent bursts. Then, using a neural network approach based on SAR image cross-spectra and on the WaveWatch III® wave model, an algorithm is proposed to provide estimates of significant wave height, fractions of wave height due to wind sea, and mean wave period. As obtained, the algorithm yields to promising performances when validated against in situ and satellite data.

How to cite: Maillard, L., Grouazel, A., Nouguier, F., Accensi, M., Marquart, R., Delouis, J.-M., and Mouche, A.: Potential of synthetic aperture radar wide swath acquisitions to map sea state variability of European seas, EGU General Assembly 2024, Vienna, Austria, 14–19 Apr 2024, EGU24-10064, https://doi.org/10.5194/egusphere-egu24-10064, 2024.

EGU24-11273 | ECS | Posters on site | OS4.1

A study about the initial stages of wind-wave growth in the presence of mixed sea state conditions 

Rodney Eduardo Mora Escalante, Pedro José Osuna, Francisco Javier Ocampo-Torres, and Carlos Eduardo Villareal-Olavarrieta

It is well known that the swell modifies the wind stress or wind wave properties, but it is not considered in studies of wind-generated wave growth. In most of the world's oceans, swell is present. During the early stages of wave development, swell plays an essential role in modulating the transfer of heat, momentum, and gases. During a measurement campaign in the Gulf of Mexico (GoM), continuous, high temporal resolution measurements of the directional spectrum of wave and turbulent Reynolds stresses were recorded with a platform moving with the free surface. Events were selected under cold front or northerly conditions. These events are nearly ideal for studying wave growth because the wind is nearly homogeneous and stationary with a predominant direction. Using Hanson and Phillips (2001) method, the swell is separated from the wave's directional spectrum to analyze the wind-sea's evolution in mixed conditions. The wind wave conditions are defined based on two swell criteria: the swell index (R = Eswell / Etot) and the swell slope. The observations show that the swell dampens the energy of the young wind-sea. In the equilibrium region, the wind-sea energy is lower in the presence of the swell than in the absence. The physical process that explains this is that the swell reduces the surface roughness, i.e., the short waves have less slope, and therefore, their ability to extract momentum from the atmosphere is reduced. The swell modifies the Toba constant to a sub-saturated energy level. The spectral shape of the wind wave in the equilibrium region tends to have a more considerable spectral dip with a background swell. The transition frequency is shifted toward n times the spectral peak. There is no evidence of swell influence in the saturation spectral region of the wind-sea. It is concluded that the effect of the swell on the wind wave is a function of the direction of the swell, the ratio of the swell energy present in the spectrum, the slope of the swell, and the height of the swell. This research emphasizes the importance of swell inclusion in the analysis to better understand the physical processes of numerical wave models, the information processed by remote sensors, the modulation of swell on flow transfer, and the complexity of the wave field in hurricanes.

How to cite: Mora Escalante, R. E., Osuna, P. J., Ocampo-Torres, F. J., and Villareal-Olavarrieta, C. E.: A study about the initial stages of wind-wave growth in the presence of mixed sea state conditions, EGU General Assembly 2024, Vienna, Austria, 14–19 Apr 2024, EGU24-11273, https://doi.org/10.5194/egusphere-egu24-11273, 2024.

EGU24-12073 | ECS | Orals | OS4.1

Extremely large waves atop a depth-dependent background flow 

Yan Li and Amin Chabchoub

A Nonlinear Schrödinger (NLS) equation-based theoretical model is derived in Li & Chabchoub (2024) for deepwater waves in the presence of a background flow. The flow propagates in the horizontal plane with its profile magnitude and direction being depth-dependent (see, e.g., Li & Ellingsen 2019). A new interpretation of the roles of Stokes drift, Eulerian return flow, and background vertically sheared current in the modulational instability (MI) of Stokes waves has been provided. The results in particular show that a current opposing a long-crested wave group can enhance the oblique modulational instability while suppressing completely the modulational instability which arises from sideband waves in the directions parallel to the wave group.  This provides clear physical insights into the roles of a background flow on rogue waves, owing to that the MI has been well recognized as a plausible cause to their generation. Moreover, the relevance of the background flow suppression or enhancement of the modulation instability process to the Craik-Leibobvich type 2 instability in the presence of Langmuir circulation is discussed and quantified. This relevance suggests a plausible physical mechanism for the energy transfers between waves and currents in the open ocean.


References:

Li, Y., Ellingsen, S. ̊A.: A framework for modelling linear surface waves on shear currents in slowly varying waters. Journal of Geophysical Research:Oceans 124, 2527–2545 (2019).

Li, Y., Chabchoub, A.: How currents trigger extreme sea waves. The roles of Stokes drift, Eulerian return flow, and a background flow in the open ocean (2024). (submitted to Geophys. Res. Lett.).

How to cite: Li, Y. and Chabchoub, A.: Extremely large waves atop a depth-dependent background flow, EGU General Assembly 2024, Vienna, Austria, 14–19 Apr 2024, EGU24-12073, https://doi.org/10.5194/egusphere-egu24-12073, 2024.

EGU24-12541 | ECS | Orals | OS4.1

Discovering equations that govern wave breaking evolution using scientific machine learning 

Tianning Tang, Yuntian Chen, Paul Taylor, and Thomas Adcock

Artificial intelligence and machine learning are known to be excellent at empirical modelling of complex systems. These empirical models, however, usually can only provide limited physical explanations about the underlying systems. With a “knowledge discovery” scheme in machine learning, instead of being constrained by fitting the coefficients, can we now discover an equation that can shed light on the underlying physics? In this presentation, we will focus on a real fluid mechanics challenge as an example to demonstrate the potential of such a scheme – modelling wave breaking evolution.

In this ongoing study, we use symbolic regression to discover the equation that describes the wave breaking evolution from a large dataset of Direct Numerical Simulations of breaking waves. We found a new boundary equation that approximates the surface elevation (water-air interface) to evolve forward in time even during the breaking-in-progress stage, whereas traditional potential flow type equations will eventually become unstable when the overturning jet touches the crest. Unlike empirical models where the underlying dynamics are hidden in coefficients/matrixes, the physical meaning of each term of the discovered equation can be revealed successfully through math derivation and simulation. The new boundary equation suggests a new characteristic of breaking waves in deep water – a decoupling between the water-air interface and the fluid velocities. The current model is only limited to unidirectional spilling breaking waves in deep water but can be easily extended to accommodate more complex breaking behaviour.

How to cite: Tang, T., Chen, Y., Taylor, P., and Adcock, T.: Discovering equations that govern wave breaking evolution using scientific machine learning, EGU General Assembly 2024, Vienna, Austria, 14–19 Apr 2024, EGU24-12541, https://doi.org/10.5194/egusphere-egu24-12541, 2024.

EGU24-13039 | Posters on site | OS4.1

Ocean-Atmosphere Interaction Pilot Project in the Gulf of Mexico under CIGoM Buoy Network. 

Francisco J. Ocampo-Torres, Pedro Osuna, Nicolas G. Rascle, Héctor García-Nava, Guillermo Díaz Méndez, Bernardo Esquivel-Trava, Carlos F. Herrera-Vázquez, Carlos E. Villarreal-Olavarrieta, and Rodney Mora

CIGoM Buoy Network in the Gulf of Mexico was implemented and operated between 2016 and 2019. While two type of buoys were designed and built, in this work we focus on spar buoy (BOMM, as Spanish acronym for Oceanography and Marine Meteorology Buoy) to directly estimate ocean surface wave full directional spectrum as well as the momentum flux between the ocean and the atmosphere. A detailed description of the buoy and main characteristics of sensors deployed in three BOMM is given. We aim to better understand the O-A momentum flux under non-equilibrium conditions, specifically when sudden wind changes occurred typically associated with atmospheric fronts passages over the region of interest. The influence of swell is analyzed in detail for cases when locally generated waves are being developed under moderate wind speeds. Of particular importance is the remote observations of the wave field under those conditions, by means of Synthetic Aperture Radar images of the ocean surface. We approach the subject by making use of a quasi-linear inversion algorithm (Krogstad et al., 1994) with the procedure already advanced and proposed by Vachon et al. (1994), in order to estimate the directional wave spectrum. The relation between SAR derived wave spectra and the directly estimated momentum fluxes are addressed.

How to cite: Ocampo-Torres, F. J., Osuna, P., Rascle, N. G., García-Nava, H., Díaz Méndez, G., Esquivel-Trava, B., Herrera-Vázquez, C. F., Villarreal-Olavarrieta, C. E., and Mora, R.: Ocean-Atmosphere Interaction Pilot Project in the Gulf of Mexico under CIGoM Buoy Network., EGU General Assembly 2024, Vienna, Austria, 14–19 Apr 2024, EGU24-13039, https://doi.org/10.5194/egusphere-egu24-13039, 2024.

EGU24-13119 | Posters on site | OS4.1 | Highlight

In Situ Signatures and Features of Modulational Instability of Ocean Waves 

Alexander Babanin

Modulational instability of nonlinear waves in dispersive environments is known across a broad range of physical media, from nonlinear optics to waves in plasmas. Since it was discovered for the surface water waves in the early 60s, it was found responsible for, or able to contribute to the topics of breaking and rogue waves, swell, ice breakup, wave-current interactions and perhaps even spray production. Since the early days, however, the argument continues on whether the modulational instability, which is essentially a one-dimensional phenomenon, is active in directional wave fields (that is whether the realistic directional spectra are narrow enough to maintain such nonlinear behaviours).

In the presentation, we will discuss distinct features of the evolution of nonlinear surface gravity waves, which should be attributed as signatures to this instability in oceanic wind-generated wave fields. These include: wave-breaking threshold in terms of average steepness; upshifting of the spectral energy prior to breaking; oscillations of wave asymmetry and skewness; energy loss from the carrier waves in the course of the breaking. We will also discuss the linear/nonlinear superposition of waves which is often considered a counterpart (or competing) mechanism responsible for breaking or rogue waves in the ocean. We argue that both mechanisms are physically possible and the question of in situ abnormal waves is a problem of their relative significance in specific circumstances.

How to cite: Babanin, A.: In Situ Signatures and Features of Modulational Instability of Ocean Waves, EGU General Assembly 2024, Vienna, Austria, 14–19 Apr 2024, EGU24-13119, https://doi.org/10.5194/egusphere-egu24-13119, 2024.

EGU24-14162 | ECS | Posters on site | OS4.1

Estimates of wave attenuation from ICESat-2 observations 

Joey Voermans, Jill Brouwer, Alexander Fraser, Michael Meylan, Qingxiang Liu, and Alexander Babanin

Energetic waves originating from the Southern Ocean can propagate great distances into the Antarctic ice pack. Along the way, they can significantly alter the composition of the ice whilst, at the same time, sea ice can significantly alter the characteristics of the wave field. Importantly, sea ice attenuates wave energy, thereby reducing their capacity to break the ice. Understanding of the rate of attenuation of wave energy in sea ice is thus critical to achieve accurate representation of sea ice in operational forecasting models. Observations of wave attenuation are, however, sparse as logistics to the harsh and remote Antarctic Marginal Ice Zone are limited. To this end, satellite remote sensing provides significant opportunities as it can cover large spatial areas, albeit at relatively low temporal resolution.

Recent studies have shown the capabilities of ICESat-2 to not only measure surface height over land, ocean and sea ice at high accuracy, but also to distill wave field properties from these observations. Here, we use the quality-controlled data of Brouwer et al. (2022) to estimate the wave attenuation rate from ICESat-2 observations. We show that the magnitude of the estimated attenuation rates from ICESat-2 observations are largely consistent with those observed by others. As ICESat-2 provides a near-instantaneous snapshot of waves in sea ice, the data reveals unique spatial resolution of the attenuation rates across the Marginal ice Zone that cannot easily be obtained with surface buoys. Spatial variability of the estimated attenuation rates appears to be correlated with sea ice properties obtained from satellite derived products, such as sea ice thickness and sea ice concentration.

How to cite: Voermans, J., Brouwer, J., Fraser, A., Meylan, M., Liu, Q., and Babanin, A.: Estimates of wave attenuation from ICESat-2 observations, EGU General Assembly 2024, Vienna, Austria, 14–19 Apr 2024, EGU24-14162, https://doi.org/10.5194/egusphere-egu24-14162, 2024.

In this talk we examine  a higher order nonlinear Schr\"odinger equation with linear damping and weak viscosity, recently proposed as a model for deep water waves exhibiting frequency downshifting. Through analysis and numerical simulations, we discuss how the viscosity affects the linear stability of the Stokes wave solution, enhances rogue wave formation, and leads to permanent downshift in the spectral peak. The novel results in this work include the analysis of the transition  from the initial Benjamin-Feir instability to a predominantly oscillatory behavior, which takes place in a time interval when most rogue wave activity occurs. In addition, we propose new criteria for downshifting in the spectral peak and determine the relation between the time of permanent downshift and the location of the global minimum of the momentum and the magnitude of its second derivative.

How to cite: Schober, C.: The Effects of Viscosity on the Linear Stability of  Damped Stokes Waves, Downshifting,  and Rogue Wave Generation}, EGU General Assembly 2024, Vienna, Austria, 14–19 Apr 2024, EGU24-14258, https://doi.org/10.5194/egusphere-egu24-14258, 2024.

EGU24-14285 | Orals | OS4.1

Self-accelerating rogue waves 

Igor Shugan and Yang-Yih Chen

We present a theoretical study of bichromatic weakly non-collinear Airy-type waves propagating with various amplitudes in water of infinite
depth. The coupled nonlinear Schrödinger equations are invoked to study the behavior of self- and cross-interacting Airy wave packets. We
demonstrate that bichromatic pulses possess the main properties of single Airy wave packets—shape invariance and self-acceleration or selfdeceleration—
when propagating in a dispersive medium. Accounting for nonlinearity leads to a strong dependence of the structure, stability,
and propagation velocity of wave pulses on their amplitude. We show that interacting pulses of Airy-type waves can form giant accelerating
and decelerating waves. The study of accelerating and decelerating bichromatic wave pulses of the Airy type significantly expands the
set of scenarios for the occurrence of rogue waves in various physical media.

How to cite: Shugan, I. and Chen, Y.-Y.: Self-accelerating rogue waves, EGU General Assembly 2024, Vienna, Austria, 14–19 Apr 2024, EGU24-14285, https://doi.org/10.5194/egusphere-egu24-14285, 2024.

EGU24-14317 | ECS | Orals | OS4.1

Rogue wave occurrence over planar coastal bathymetries 

Ioannis Karmpadakis and Vasileios Bellos

Rogue waves have received considerable attention in recent years, with major advancements in their generation mechanisms having been defined. However, the focus of most investigations has been related to rogue wave occurrence in deep water. In contrast, far fewer results are available in shallower water depths. As such, the present work focuses on exploring the occurrence probabilities of rogue waves in coastal waters, as well as the physical mechanisms that lead to their formation. This is achieved by a thorough analysis of a very extensive experimental dataset of random waves propagating over planar beaches. More specifically, long simulations of realistic JONSWAP spectra arising in intermediate water depths have been generated at the deep end of the Coastal Flume at Imperial College London. These propagate over 3 uniform slopes with inclinations varying between 1:15 and 1:50, while being sampled by a dense array of wave gauges. The fine spatial resolution of wave gauges allows for a detailed description of large wave evolution as they travel towards the shoreline. Importantly, a parametric approach in defining the offshore forcing conditions has been adopted and covers a wide range of sea-state steepnesses and effective water depths. Taken together, 15 different storm conditions, each consisting of approximately 20,000 waves, have been considered for each bed slope configuration.

In analysing these results, the occurrence of rogue waves is examined at all spatial locations across the coastal zone. We observe a considerable increase in rogue wave occurrence for reducing water depths which has not been found previously. This is particularly the case for moderately mild offshore storms. In exploring the shape of rogue waves arising at different water depth regimes, the relative importance of dispersion and nonlinearity is defined. While rogue waves arising at the deeper end of the coast resemble NewWave type events, solitary-type events become more pronounced at the shallower end. The occurrence of rogue waves in shallow water is suppressed once extensive wave breaking arises. While this is expected as a result of depth-induced wave breaking, interesting results arise for the steepest offshore conditions. Evidence suggests that waves breaking at the outer edge of the surf zone, regroup and give rise to rogue waves closer to the shoreline.

Taken together, the rogue wave investigation within the present extensive experimental dataset provides evidence for their increased importance in coastal waters which has not been broadly considered so far.

How to cite: Karmpadakis, I. and Bellos, V.: Rogue wave occurrence over planar coastal bathymetries, EGU General Assembly 2024, Vienna, Austria, 14–19 Apr 2024, EGU24-14317, https://doi.org/10.5194/egusphere-egu24-14317, 2024.

EGU24-14457 | ECS | Orals | OS4.1

An acoustic method to measure sea spray spume droplets in-situ 

Joey Voermans

Sea spray spume, droplets generated through the interactions of wind and waves, can critically alter the heat, momentum, mass and gas exchanges between the ocean and atmosphere during extreme wind conditions. Most operational forecasting models, however, do not consider sea spray spume physics in their models as the uncertainty in sea spray parameterizations is simply too large (roughly three orders of magnitude). While this uncertainty is in part caused by the extreme complexity in the droplet generation physics, considerable uncertainty comes from the difficulty in measuring sea spray and, consequently, the near absence of field observations.

Here, we present a new method to measure sea spray spume droplets in extreme winds based on acoustics. Specifically, hydrophones are positioned in the air flow laden with droplets to record droplet impact acoustics. The hydrophones were initially exposed to monodisperse free-falling droplets in the absence of wind in a first set of experiments. We find that both the magnitude and duration of the acoustic response to droplet impact are a function of the droplet diameter and the impact velocity. A second set of experiments were performed in a high-speed wind tunnel to validate the hydrophone’s response in extreme winds and under continuous exposure of droplets. Droplets ranging from less than 100 µm to 3 mm were released using a spray nozzle in winds up to 30 m/s, and their speed and diameter were independently measured using multiple exposure photography. Droplet impact measurements in the wind tunnel were found to be consistent with the initial experiments of free-falling droplets in stagnant air and provide estimates of the accuracy of the developed method. The range of droplet sizes that can be measured was found to depend on the size and sensitivity of the hydrophone, and wind speed. The results show that this new method provides significant opportunities in measuring sea spray spume droplets in situ at close proximity to the ocean surface. Field experiments to do so are currently in planning.

How to cite: Voermans, J.: An acoustic method to measure sea spray spume droplets in-situ, EGU General Assembly 2024, Vienna, Austria, 14–19 Apr 2024, EGU24-14457, https://doi.org/10.5194/egusphere-egu24-14457, 2024.

EGU24-14895 | Posters on site | OS4.1

Development of the Atmosphere-Ocean-Wave Coupled Model in the Korean Integrated Model (KIM) 

Yong-Jae Han, Eunjeong Lee, and Myung-Seo Koo

The Korea Institute of Atmospheric Prediction Systems (KIAPS) has been developing an integrated model with predictive performance in an extended range (14 to 30 days) since 2020. To enhanced the performance of coupled model, it is necessary to examine the interaction and feedback among the components of the Earth system. This study introduces the current status and future plan of a KIAPS-developing coupled modeling system with a focus on atmosphere-ocean-wave coupling. 
The Korea Integrated Model (KIM), the operational atmospheric model of the Korea Meteorological Administration, was coupled with the Nucleus for European Modeling of the Ocean (NEMO) and the WAVEWATCH III (WW3) through a Model Coupling Toolkit, and the predicted variables are exchanged between the model components. The WW3 model receives the wind component from the first layer of the atmospheric model, and the surface currents and sea surface height are obtained from the ocean model. The Charnock coefficient and wave energy flux calculated by WW3 are sent to the ocean model. The Charnock coefficient impacts the air-side through a roughness length that is calculated using the bulk formula at the sea surface. Meanwhile, the wave energy flux into the ocean is applied as a surface boundary condition in the turbulent kinetic energy (TKE) model, which results in determining the ocean deepening. The presentation will focus on explaining the effects of the surface energy flux obtained from the wave model on the wave breaking in the TKE scheme of the coupled KIM in the medium-range forecasts and seasonal simulations. Furthermore, we plan to discuss strategies for improving the Coupled KIM based on preliminary results.

Acknowledgements. This work was carried out through the R&D project “Development of a Next-Generation Numerical Weather Prediction Model by the Korea Institute of Atmospheric Prediction Systems (KIAPS)”, funded by the Korea Meteorological Administration (KMA2020-02212).

How to cite: Han, Y.-J., Lee, E., and Koo, M.-S.: Development of the Atmosphere-Ocean-Wave Coupled Model in the Korean Integrated Model (KIM), EGU General Assembly 2024, Vienna, Austria, 14–19 Apr 2024, EGU24-14895, https://doi.org/10.5194/egusphere-egu24-14895, 2024.

EGU24-15131 | ECS | Posters on site | OS4.1

Airborne and in-situ measurements of wave-ice interactions in the Lower St. Lawrence Estuary 

Antoine Villefer, Peter Sutherland, Luc Lenain, and Dany Dumont

Decreasing sea ice cover in the Arctic Ocean is leading to an increase of surface wave energy.  This means that waves are becoming more important to Arctic dynamics, and so understanding their interactions with sea ice is a key question for Arctic oceanography. This work presents a unique set of simultaneous observations of wave-ice interactions during an episode of ice formation and wave generation. Airborne remote sensing observed the sea and ice surface using scanning lidar data, and infrared and hyperspectral imagery. Concurrently, an autonomous catamaran measured atmospheric fluxes, near-surface turbulence, temperature, and currents. During January 2023, this instrumentation was deployed in the fetch-limited natural laboratory of the Lower St. Lawrence Estuary in order to address the questions of how ice-forming conditions influence wave generation and how ice floes attenuate wave energy. These observations are used to develop understanding of the physics of wave-ice interactions and assess the ability of spectral wave models to reproduce them.  Implications for future models and larger-scale applications will be discussed.

How to cite: Villefer, A., Sutherland, P., Lenain, L., and Dumont, D.: Airborne and in-situ measurements of wave-ice interactions in the Lower St. Lawrence Estuary, EGU General Assembly 2024, Vienna, Austria, 14–19 Apr 2024, EGU24-15131, https://doi.org/10.5194/egusphere-egu24-15131, 2024.

EGU24-15480 | ECS | Posters on site | OS4.1

In-situ Airflow Measurements over Surface Waves using Particle Image Velocimetry 

Janina Tenhaus, Marc Buckley, and Jeffrey Carpenter

The input of wind energy by wave growth into the upper ocean is an important process for the global energy budget. However, observing and measuring the near surface physics that control these fluxes remains challenging, especially in field experiments.

We were able to capture small-scale motions in the airflow above surface waves. A high resolution 2D Particle Image Velocimetry (PIV) system was developed for velocity measurements within the first micrometers to centimeters above the air-water interface. The system, installed on a single pile platform in the Szczecin Lagoon (Baltic Sea coast, Germany) at a fetch of approximately 20 to 25 km, was remotely operated and could be rotated to measure the airflow velocities in a range of wind directions. In this study, we focus on a peak wave age (cp/u*) of 14.2, classified as "growing sea", with a slope (akp) of 0.08 and a 10-m wind speed of 5.7 m/s.

We observe modulations of the airflow by locally generated wind waves, including small sheltering events downwind of sharp wave crests. The pattern of the vertical wave-coherent velocity field shows a critical layer where the wind speed equals the wave speed. The phase of the observed vertical velocity eigenfunction is in agreement with the linear theory of Miles (1957, J. Fluid Mech., doi: 10.1017/S0022112057000567). In addition, we find a dimensionless wave growth rate using wave slope, wave age, and wave-coherent momentum flux, which is consistent with other studies.

How to cite: Tenhaus, J., Buckley, M., and Carpenter, J.: In-situ Airflow Measurements over Surface Waves using Particle Image Velocimetry, EGU General Assembly 2024, Vienna, Austria, 14–19 Apr 2024, EGU24-15480, https://doi.org/10.5194/egusphere-egu24-15480, 2024.

EGU24-16319 | ECS | Orals | OS4.1

On coherent vortical structures in wave breaking 

Simone Di Giorgio, Sergio Pirozzoli, and Alessandro Iafrati


Figure 1: Underwater vortical structures generated during the breaking: vortex-tubes and vortex-sheets are drawn in yellow and gray, respectively.

The breaking of ocean waves is of significant interest due to its implications in various physical, chemical, and biological processes that occur at the ocean-atmosphere interface.  Wave breaking generates free-surface turbulence, dissipates wave energy, and enhances momentum, heat, and gas transfer between air and water. Over the years, a number of review articles and monographs have been published on the subject (Banner & Peregrine 1993; Melville 1996; Duncan 2001; Babanin 2011; Kiger & Duncan 2012; Perlin, Choi & Tian 2013; Lubin & Chanson 2017; Deike 2022), and these works call for more research into nearly every aspect of wave breaking. For these reason, the flow generated by the breaking of free-surface waves in a periodic domain is simulated numerically by means of a gas-liquid multiphase Navier Stokes solver. The solver relies on the Volume-of-Fluid (VOF) approach, and interface tracking is carried out by using a novel algebraic scheme based on a tailored TVD limiter (Pirozzoli et al., 2019). The solver is proved to be characterized by low numerical dissipation, thanks to the use of the MAC scheme, which guarantees discrete preservation of total kinetic energy in the case of a single phase. Both two- and three-dimensional simulations have been carried out, and the analysis is presented in terms of energy dissipation, air entrainment, bubble fragmentation, statistics and distribution. Particular attention is paid to the analysis of the mechanisms of viscous dissipation. For this purpose, coherent vortical structures (Horiuti and Takagi, 2005), are identified and the different behaviour of vortex sheets and vortex tubes are highlighted, at different Re. The correlation between vortical structures and energy dissipation demonstrates clearly their close link both in the mixing zone and in the pure water domain, where the coherent structures propagate as a consequence of the downward transport. Notably, it is found that the dissipation is primarily connected with vortex sheets, whereas vortex tubes are mainly related to flow intermittency.

In order to highlight the connections between air entrainment and viscous dissipation with vortical structures, in fig. 2, slices taken in the longitudinal symmetry plane are drawn. The results display a very close correlation between viscous dissipation and the vortex sheet indicator. Also, it is worth noticing that viscous dissipation is not confined about the free surface, but it is spread within the bubble cloud. Within the high-dissipation regions, marked by the vortex sheet indicator, vortex tubes also form in zones with high vorticity.


Figure 2: Longitudinal sections of the solutions computed at Re = 10000 (top) and Re = 40000 (bottom). The coloured contours denote the local values of the normal-to-plane vorticity components (left), and the local dissipation rate (right). The black solid lines in left and right figures denote the vortex-tube and vortex-sheet iso-lines, respectively. Note that the solutions in the water domain are shown only.


How to cite: Di Giorgio, S., Pirozzoli, S., and Iafrati, A.: On coherent vortical structures in wave breaking, EGU General Assembly 2024, Vienna, Austria, 14–19 Apr 2024, EGU24-16319, https://doi.org/10.5194/egusphere-egu24-16319, 2024.

EGU24-17231 | Orals | OS4.1

Wave run-up detection at the Norwegian coast 

Henrik Kalisch, Daniel Blandfort, Marc Buckley, Jan Bödewadt, Maria Bjørnestad, Francesco Lagona, Alexandre Derriey, Jan-Victor Björqvist, and Jochen Horstmann

We are interested in the interaction of ocean waves with steep coastal topography such as encountered in some coastal profiles for example in the United States, New Zealand and Norway. In previous works, it has been shown that under such conditions, shoaling ocean waves may experience significant amplification in the last 50 to 100 meters before they run up on the shore, leading to potentially hazardous run-up events even under relatively calm conditions. In the present work, we are reporting on a remotely accessible observational system which was deployed on the Norwegian Coast near the city of Haugesund. We report on the data analysis and statistical correlation of large run-up events with certain sea states and weather conditions.

References:

[1] Bjørnestad, M. and Kalisch, H., 2020. Extreme wave runup on a steep coastal profile. AIP Advances, 10(10).

[2] Kalisch, H., Lagona, F. and Roeber, V., 2023. Sudden wave flooding on steep rock shores: a clear but hidden danger. Natural Hazards, pp.1-21.


How to cite: Kalisch, H., Blandfort, D., Buckley, M., Bödewadt, J., Bjørnestad, M., Lagona, F., Derriey, A., Björqvist, J.-V., and Horstmann, J.: Wave run-up detection at the Norwegian coast, EGU General Assembly 2024, Vienna, Austria, 14–19 Apr 2024, EGU24-17231, https://doi.org/10.5194/egusphere-egu24-17231, 2024.

EGU24-18430 | Orals | OS4.1 | Highlight

On the validation of wave/ice interactions in the model MFWAM : Analysis with CFOSAT data 

Lotfi Aouf, Emma Bedossa, Stephane Law Chune, Jean Rabault, Ana Carasco, and Danièle Hauser

Improving wave forecasting in the polar oceans is crucial for coupled earth system and climate monitoring. There is still a strong uncertainties on wave variability in the Marginal Ice Zone (MIZ) and polar oceans. The wave scatterometer SWIM of CFOSAT, provide directional wave spectra, which are very useful to improve the wave forecast in the MIZ and the validation of using wave/ice interactions source term in the MFWAM model. The aim of this work is firstly to assess the impact of using the ice probability products provided by CFOSAT in the MFWAM wave model, and secondly to calibrate and validate the source term for wave attenuation induced by sea ice based on Yue et al (2022) implemented in the MFWAM model. Several MFWAM model simulations have been performed in a global configuration during boreal and austral winter and summer seasons. Different ice probability or fraction forcings provided by the IFS atmospheric system and CFOSAT have been tested in the MFWAM model, while sea ice thickness is provided by the Copernicus Marine Service global ocean reanalysis GLORYS. Significant Wave height (SWH) validation of MFWAM model simulations have been carried out using Sentinel-3 altimetry data, which has good coverage of polar regions. The results show a significant improvement in the bias and scatter index of SWH in Antarctica for Weddell and Ross Seas. The assimilation of SWIM wave spectra enhances the improvement of SWH in the polar oceans, particularly in the Ross Sea, Weddell Sea in Antarctica and Beaufort Sea in the Arctic ocean.

In this work we also analyzed wave attenuation by sea ice. Validation with Sentinel-3 in the Weddell Sea during the boreal summer shows a good performance of the MFWAM model with the wave/ice ineractions term compared with the simulation without interactions. The analysis of wave attenuation by sea ice was carried out in the Arctic in the Sprtizbergen archipelago area, where observations from drifting buoys (Open Met buoys) have been used to validate the MFWAM model performance. The results show good consistency between the MFWAM model and the drifting buoys. Further analysis regarding to the impact of using wave/ice interactions on ocean circulation has been conducted with ocean mixed layer model.

More discussions and conclusions will be summarized in the final presentation.

How to cite: Aouf, L., Bedossa, E., Law Chune, S., Rabault, J., Carasco, A., and Hauser, D.: On the validation of wave/ice interactions in the model MFWAM : Analysis with CFOSAT data, EGU General Assembly 2024, Vienna, Austria, 14–19 Apr 2024, EGU24-18430, https://doi.org/10.5194/egusphere-egu24-18430, 2024.

EGU24-18606 | ECS | Orals | OS4.1

Simulation of scale-resolved mixing of passive scalars in waves and turbulence 

Malte Loft, Simen Å. Ellingsen, R. Jason Hearst, Olav Rømcke, Priyanka Gautam, and Thomas Rung

The accuracy of global circulation models partly relies on understanding the dynamics at the coupled atmosphere-ocean interface. Related current research efforts focus on a range of aspects, including the quantification of energy budgets, an understanding of wave growth mechanisms as well as other processes relating to the interaction between waves and ambient turbulence of the upper ocean. The latter is particularly important for the understanding of gas transports close to the surface in the presence of old and long waves (swell). Reported efforts are based on a previously introduced hybrid scale-resolving, numerical method that fully resolves both the air and water phase at realistic Reynolds numbers [Phys. of Fluids, Vol. 35 (7): 072108]. In this context, we enhanced the model by a passive scalar transport procedure to observe the transport of an arbitrary number of passive scalars close to the surface within the upper ocean layer. The presentation will address the treatment of numerical issues, primarily related unintended numerical diffusion through the interface, and explain the layout of a method to obtain accurate results for different wave-turbulence scenarios. Data processing follows experimental approaches [Journal of Fluid Mechanics, Vol. 962: R1], thereby supporting future joint numerical/experimental studies. Results display wave effects on both the turbulence and the scalar transport close to the surface. In particular, enstrophy and turbulent kinetic energy (TKE) are affected in the vicinity of surface waves. The developed two-phase flow model proves to be a promising approach for future collaborative experimental/numerical studies of transport processes in this highly dynamic domain.

How to cite: Loft, M., Ellingsen, S. Å., Hearst, R. J., Rømcke, O., Gautam, P., and Rung, T.: Simulation of scale-resolved mixing of passive scalars in waves and turbulence, EGU General Assembly 2024, Vienna, Austria, 14–19 Apr 2024, EGU24-18606, https://doi.org/10.5194/egusphere-egu24-18606, 2024.

The fluxes of momentum and mechanical energy between the atmosphere and the ocean are coupled with the complex small-scale interactions between wind and wind-generated waves. Small wind waves may carry a significant portion of the air-sea momentum flux, and their growth and dissipation are therefore critical components for the momentum budget at the ocean surface.
We present novel laboratory measurements of turbulence and viscous stress under wind-generated waves using PIV (Particle Image Velocimetry), under slick-free and slick-covered water surfaces. Three surface-active substances were used, with different visco-elastic properties, for wind speeds ranging from 4 m/s to 8 m/s.  Additionally, LIF (Laser-induced fluorescence) imagery was acquired to characterize the surface, including the distribution of bound and freely propagating capillary waves. The bulk of the measurements was performed at a fetch of 15.5 m.
The surfactants strongly modify the onset of capillary waves characteristic of microscale breaking wind-waves, which in turn modifies the growth and evolution of the wind-waves, as well as the turbulent dynamics below microscale breaking wave crests. We will discuss the dynamical role of capillary waves and turbulence near the crest of wind-waves, for the wind-wave energy budget.

How to cite: Buckley, M. and Gade, M.: Laboratory measurements of turbulence below wind-generated waves, with and without surfactants, EGU General Assembly 2024, Vienna, Austria, 14–19 Apr 2024, EGU24-19211, https://doi.org/10.5194/egusphere-egu24-19211, 2024.

EGU24-20078 | Orals | OS4.1

Impact of Errors in Buoy Measurements on Nonlinear Fourier Spectra 

Yu-Chen Lee and Sander Wahls

The nonlinear Fourier transform (NFT) has been recently used to analyze the measured rogue waves in shallow water (Teutsch et al., Nat. Hazards Earth Syst. Sci., 2023). When analyzing field measurement data from the buoy, measurement errors are unavoidable due to various factors. The drag forces on the buoy can e.g. result in low-frequency measurement noise (Ashton and Johanning, Ocean Eng., 2015), while the sensors employed on the buoy are limited in bandwidth and contribute noise themselves (Yurovsky and Dulov, Ocean Eng., 2020). It is still uncertain how the noise generated during the buoy measurement influences the nonlinear Fourier spectrum computed by the NFT. In this study, we discuss the impact of measurement errors on the nonlinear Fourier spectrum of water waves. We first generate random-phase time series from typical wave spectra such as the Pierson-Moskowitz (PM) spectrum for various significant wave heights. We will then artificially incorporate measurement errors into the generated time series. The impact of the errors is studied by comparing the nonlinear Fourier transforms of the time series with and without measurement errors.

How to cite: Lee, Y.-C. and Wahls, S.: Impact of Errors in Buoy Measurements on Nonlinear Fourier Spectra, EGU General Assembly 2024, Vienna, Austria, 14–19 Apr 2024, EGU24-20078, https://doi.org/10.5194/egusphere-egu24-20078, 2024.

During the last years, there has been increasing interest in freak waves and freak forces caused by change in bathymetry. Our research follows the pioneering work of Bitner (Bitner, 1980), who studied how the statistical distribution changed for waves propagating over variable depth. Laboratory data of surface waves from Marin, where waves propagated from deeper to shallower water, were analyzed in Trulsen, Zeng, and Gramstad, 2012. They found a local maximum for kurtosis at the beginning of shallower water. Experimental measurements of Raustl in Trulsen, Raustl, et al., 2020 showed an increase in kurtosis and skewness near the front of the plateau of the shoal, and a minimum in skewness at the lee side. Experimental velocity measurements of Jorde in Trulsen, Raustl, et al., 2020 led to the observation that the velocities had a local maximum and minimum in skewness at the same places as for the surface elevation, but the kurtosis had maximum on the lee side of the shoal. By numerical simulation, the same results were reached by Lawrence, Trulsen, and Gramstad, 2021. This lead us to ask if the forces on a horizontal cylinder would have a similar maximum of kurtosis behind the shoal.

We have done experiments in a wave flume measuring surface elevations and correspond-ing velocities over and behind a shoal, and the resulting forces on a horizontal cylinder behind a shoal, as sketched in fig. 1. Ultrasound probes were placed around the shoal, and an ADV could be moved horizontally over the shoal. The cylinder was equipped with force transducers, and could also be moved. The waves were generated according to the Pierson-Moskowitz spectrum, different from most earlier research that employed the JONSWAP spectrum. In the same way, as for the JONSWAP spectrum in earlier research, we observe the increase in skewness and kurtosis for surface elevation at the front end of the shoal. We also see the increase in kurtosis of the velocity field on the lee side of the shoal. Our force measurements indeed show an increase in skewness and kurtosis on the lee side of the shoal compared to over at the bottom, especially for the horizontal forces. Therefore, there might be reason to be cautious about extreme forces when placing structures behind a shoal.

How to cite: Samseth, K. and Trulsen, K.: Extreme waves over a shoal, and extreme forces on a submerged cylinder behind the shoal, EGU General Assembly 2024, Vienna, Austria, 14–19 Apr 2024, EGU24-21239, https://doi.org/10.5194/egusphere-egu24-21239, 2024.

EGU24-349 | ECS | Orals | OS4.2

Breaking Internal Waves and Ocean Diapycnal Diffusivity in a High-Resolution Regional Ocean Model: Evidence of a Wave-turbulence Cascade 

Kayhan Momeni, Yuchen Ma, William R. Peltier, Dimitris Menemenlis, Ritabrata Thakur, Yulin Pan, Brian K. Arbic, Joseph Skitka, and Matthew H. Alford

While the primary origin of ocean diapycnal diffusivity is commonly attributed to stratified turbulence induced by breaking internal waves (IWs), verifying diffusivity values in ocean circulation models within specific geographical regions remains challenging due to limited microstructure measurements. Recent analyses of a downscaled global ocean simulation into higher-resolution regional setups northeast of Hawaii, reveal a notably enhanced fit between simulated IW spectra and in-situ profiler measurements like the Garrett-Munk spectrum [Nelson et al. (2020), Pan et al. (2020), Thakur et al. (2022)].

In this study, we utilize this dynamically downscaled ocean simulation to scrutinize the dynamics of IW-breaking and the wave-turbulence cascade in this region explicitly. Employing a modified version of the Kappa Profile Parameterization (KPP), we infer the horizontally-averaged vertical profile of diapycnal diffusivity. Comparing this inferred profile to the background profile used in low-resolution coupled climate models—such as the Community Earth System Model (CESM) by the US National Center for Atmospheric Research (NCAR)—is a central aspect of our investigation.

Our exploration reveals that the wavefield in the high-resolution regional domain is dominated by a well-resolved spectrum of low-mode IWs, predictable through appropriate eigenvalue computations for stratified flow. Finally, we propose a novel tentative approach to enhance the KPP parameterization. This approach holds promise for refining our understanding of diapycnal diffusivity, offering valuable insights for improving ocean circulation models.


References:

AD Nelson, BK Arbic, D Menemenlis, WR Peltier, MH Alford, N Grisouard, and JM Klymak. Improved internal wave spectral continuum in a regional ocean model. Journal of Geophysical Research: Oceans, 125(5):e2019JC015974, 2020.

Yulin Pan, Brian K Arbic, Arin D Nelson, Dimitris Menemenlis, WR Peltier, Wentao Xu, and Ye Li. Numerical investigation of mechanisms underlying oceanic internal gravity wave power-law spectra. Journal of Physical Oceanography, 50(9):2713–2733, 2020.

Ritabrata Thakur, Brian K Arbic, Dimitris Menemenlis, Kayhan Momeni, Yulin Pan, W Richard Peltier, Joseph Skitka, Matthew H Alford, and Yuchen Ma. Impact of vertical mixing parameterizations on internal gravity wave spectra in regional ocean models. Geophysical Research Letters, 49(16): e2022GL099614, 2022.

How to cite: Momeni, K., Ma, Y., Peltier, W. R., Menemenlis, D., Thakur, R., Pan, Y., Arbic, B. K., Skitka, J., and Alford, M. H.: Breaking Internal Waves and Ocean Diapycnal Diffusivity in a High-Resolution Regional Ocean Model: Evidence of a Wave-turbulence Cascade, EGU General Assembly 2024, Vienna, Austria, 14–19 Apr 2024, EGU24-349, https://doi.org/10.5194/egusphere-egu24-349, 2024.

EGU24-578 | ECS | Posters on site | OS4.2

Modelling the seasonal and spatial variation of Turbulent Kinetic Energy budget in the north-western Indian Ocean 

Rajesh Chauhan, Manasa Behera, and Sridhar Balasubramanian

North-western Indian Ocean (NIO), especially Arabian Sea (AS), experiences intense seasonally reversing winds and undergoes a seasonal change in the turbulence energetics. Given the importance of Arabian Sea dynamics on the Indian monsoon, a numerical investigation was carried out to study the energy budget using MOM 5. Model domain is between 32 to 118⁰ E and 28⁰ S to 30⁰ N and is forced with daily varying 10 year averaged atmospheric fluxes. Lateral open boundaries are prescribed with sea surface height anomaly (SSHA) in combination with radiation condition. Vertical profiles of temperature and salinity are also prescribed at lateral boundaries. Using the averaged forcing, model is run for 10 years as spin up and brought into equilibrium and then forced with 5 years inter-annually varying dataset, which is used for analysis. Though the model domain covers quite an extensive part of Indian Ocean, but our analysis is limited in the NIO between 8⁰S to 30⁰N and 32 to 82⁰E (hereafter called as Analysis domain). Model produced data is seasonally averaged into 4 seasons, DJF (December to February), MAM (March to May), JJAS (June to September), and ON (October-November). Currents are well represented by model and are validated with OSCAR currents. Ocean properties such as Sea Surface Temperature, Sea Surface Salinity and Mixed Layer Depth produced by model are within reasonable bias. The investigation of TKE indicates that it has seasonal and spatial preference. Depth averaged over 30m TKE, indicates that it is strongest in JJAS and DJF along the Somalia coast and equatorial region of NIO respectively. In MAM, TKE is strong in south-western AS, close to equator and in ON, a reminiscence of TKE is seen along the Western AS (WAS). Spatial average vertical profile of TKE for 3 regions, [1: 8⁰S to 30⁰N and 32 to 82⁰E (Analysis domain), 2: 4⁰S to 4⁰N and 56 to 82⁰E (Western Equatorial Indian Ocean, WEIO), and 3: 4 to 12⁰N and 45 to 55⁰E (WAS)] is shown. Analysis reveals that TKE is highest in upper 200m and decreases with depth, and in DJF, it is maximum in WEIO and least in WAS, but quite interestingly, after 150m till about 250m, TKE increases in WAS. This could indicate strong subsurface turbulent activity in WAS in DJF. In JJAS, TKE is almost 4 times that of DJF and is highest in WAS and least in WEIO. In WAS, turbulence produced due to buoyancy is suppressed by production flux being negative which indicates inverse energy cascade in DJF. In JJAS, production flux is strongly positive in WAS with negative production in the Great Whirl eddy and in the equatorial region. Turbulence is produced by buoyancy as well near horn of Africa, yet dissipation is weak in the said region, which could be due to strong positive transport. Production shows weak positive features in WAS and is strongly negative in equatorial region in MAM and ON. Buoyancy flux is negative in WAS in MAM and ON, indicative of stable stratification.

How to cite: Chauhan, R., Behera, M., and Balasubramanian, S.: Modelling the seasonal and spatial variation of Turbulent Kinetic Energy budget in the north-western Indian Ocean, EGU General Assembly 2024, Vienna, Austria, 14–19 Apr 2024, EGU24-578, https://doi.org/10.5194/egusphere-egu24-578, 2024.

Comprehending how submesoscale dynamics and their potential interplay with tides affect climate models is challenging due to their small scales and high computational demands. To address this challenge, our approach integrates modelling and observational methods. In this study, we investigate the impact of internal tides, eddies and submesoscale currents on the frequency energy spectrum of the ocean. To this end, we apply a novel simulation with telescopic grid refinement to achieve a horizontal resolution finer than 600 m over large regions of the South Atlantic. This refined resolution allows us to accurately capture submesoscale turbulence and a relatively large part of the internal wave spectrum under realistic atmospheric conditions. By comparing simulations with and without tides, we find that without tidal forcing there is significantly less energy at the high frequency end of the spectrum. Validation with mooring and Pressure Inverted Echo Sounder data sets deployed over a two year period in the Walvis Ridge region indicates that the simulation with tides is more accurate in terms of high frequency energy levels. Using an eddy tracking algorithm allows us to differentiate energy spectra within the Agulhas rings from a ring-absent background state. Within these eddies, we observe a substantial shift towards higher power spectral densities of approximately one order of magnitude across both small and large scales.

How to cite: Epke, M. and Brüggemann, N.: Impact of tides and eddies on ocean energy spectra in submesoscale resolving simulations of the South Atlantic, EGU General Assembly 2024, Vienna, Austria, 14–19 Apr 2024, EGU24-2470, https://doi.org/10.5194/egusphere-egu24-2470, 2024.

EGU24-3494 | Orals | OS4.2

  Prandtl Number Effects on Extreme Mixing Events in Forced Stratified Turbulence 

Colm-cille P. Caulfield, Nicoloas Petropoulos, Miles M. P. Couchman, Steve de Bruyn Kops, and Ali Mashayek

`Strongly' stratified turbulent flows can self-organise into a  `layered anisotropic stratified turbulence' (LAST) regime, characterised by relatively deep and well-mixed density `layers' separated by relatively thin `interfaces' of enhanced density gradient. Understanding the associated mixing dynamics is important for parameterising heat transport in the world's oceans. It is challenging to study `LAST' mixing, as it is associated with Reynolds numbers Re := UL/ν  >> 1 and Froude numbers Fr :=(2πU)/(L N)  << 1, (U and L being characteristic velocity and length scales, ν being the kinematic viscosity and N the buoyancy frequency). As a sufficiently large dynamic range (largely) unaffected by stratification and viscosity is still required, the buoyancy Reynolds number Reb := ε/(ν N2) >> 1 where ε is the TKE dissipation rate. This requirement is exacerbated for oceanically relevant flows, as the Prandtl number Pr := ν /κ = O(10) in thermally-stratified water (where κ is the thermal diffusivity), thus leading (potentially) to even finer density field structures. We report here on four forced fully resolved direct numerical simulations of stratified turbulence at various Froude (Fr=0.5, 2) and Prandtl numbers (Pr=1, 7) forced so that Reb=50, with resolutions up to 30240 x 30240 x 3780. We find that, as Pr increases, emergent `interfaces' become finer and their contribution to bulk mixing characteristics decreases at the expense of the small-scale density structures populating the well-mixed `layers'. Nevertheless, `extreme' mixing events (with elevated local destruction rates of buoyancy variance χ0 dominating the total mixing budget) are still preferentially found in strongly stratified interfaces, which has significant implications for parameterising  diapycnal mixing in larger scale ocean models.


This project received funding from the European Union's Horizon 2020 research and innovation program under the Marie Sklodowska-Curie Grant Agreement No. 956457 and used resources of the Oak Ridge Leadership Computing Facility at the Oak Ridge National Laboratory, supported by the Office of Science of the U.S. Department of Energy under Contract No. DE-AC05-00OR22725. S.deB.K. was supported under U.S. Office of Naval Research Grant number N00014-19-1-2152.

How to cite: Caulfield, C.-P., Petropoulos, N., Couchman, M. M. P., de Bruyn Kops, S., and Mashayek, A.:   Prandtl Number Effects on Extreme Mixing Events in Forced Stratified Turbulence, EGU General Assembly 2024, Vienna, Austria, 14–19 Apr 2024, EGU24-3494, https://doi.org/10.5194/egusphere-egu24-3494, 2024.

EGU24-4023 | Posters on site | OS4.2

Resolution of the bottom boundary layer in an eddy-rich model of double-gyre circulation 

Si-Yuan (Sean) Chen and Olivier Marchal

The bottom boundary layer (BBL) is the portion of the water column which is directly affected by the drag of ocean currents on the seafloor. It is often assumed to coincide with the bottom mixed layer in which potential temperature is approximately uniform. Bottom mixed layers have an observed thickness of O(10 m), with maxima of O(100 m) in some basins. As a result, they are in general not represented in numerical models of large-scale circulation, which typically assume a vertical resolution of a few hundred meters near the bottom. The coarse vertical resolution near the bottom that is assumed in many numerical models implies that these models may not accurately represent the velocity shears near the bottom and the dissipation rates of kinetic energy by bottom drag, which depends on the near-bottom velocity. Here we present results from idealized numerical experiments of the circulation in a double (subtropical-subpolar) gyre, which are aimed at determining the effects of near-bottom vertical resolution on simulated ocean circulation and energetics. Results from experiments that resolve the BBL are compared to those from experiments that do not. In all experiments, the horizontal grid is fine enough to resolve the mesoscale eddy field. In our presentation, emphasis will be placed on energy dissipation by bottom drag in experiments with different near-bottom vertical resolutions. The implications of our results for the simulation of large-scale ocean circulation will then be clarified.

How to cite: Chen, S.-Y. (. and Marchal, O.: Resolution of the bottom boundary layer in an eddy-rich model of double-gyre circulation, EGU General Assembly 2024, Vienna, Austria, 14–19 Apr 2024, EGU24-4023, https://doi.org/10.5194/egusphere-egu24-4023, 2024.

EGU24-4115 | ECS | Orals | OS4.2

Convective Mixing: an Energetically Consistent Non-Local Parameterization 

Manolis Perrot and Florian Lemarié

         During shallow and deep oceanic convection, eddy-diffusivity parameterizations are known to fail since advection by non-local plumes is the primary source of turbulent transport. Integration of the Mass-Flux concept to correct Eddy-Diffusivity approaches has long been studied and applied for parameterizing convection in atmospheric models, and very recently in ocean models. This closure involves breaking down vertical turbulent fluxes into two components:

  • a diffusion term that addresses local small-scale mixing in an near isotropic environment, which intensity is typically scaling with turbulent kinetic energy (TKE) ;
  • a mass-flux transport term, that accounts for the non-local transport due to vertically coherent plumes within the environment.

We expose an energetically consistent coupling of Eddy-Diffusivity Mass-Flux (EDMF) schemes with TKE schemes, in order to model oceanic convection.

To achieve such a goal, we reexamine PDE-based derivations from first principles relying on multi-fluid averaging techniques. This approach offers several key advantages. Firstly, it allows to establish fully consistent local and global energy budgets between resolved and subgrid scales, effectively rectifying energy biases present in prior EDMF schemes. Notably, it facilitates a clear separation of convective and turbulent small-scale energy reservoirs. This is a significant departure from traditional schemes used in ocean modeling to account for non-local effects (e.g. KPP). It also provides a lucid description of boundary terms in order to remedy double-counting errors.

Secondly, when compared to existing oceanic schemes, our model demonstrates performance in reproducing mean fields as well as higher-order moments such as TKE, vertical fluxes, and turbulent transport of TKE. It is validated against Large Eddy Simulation (LES) and observational data of oceanic convection.

Thirdly, during the theoretical development of the scheme, we maintain transparency regarding underlying assumptions, and systematically assess their validity in the light of LES data. Thus our framework exhibits the flexibility to formally relax scale assumptions, leading toward scale-awareness.

How to cite: Perrot, M. and Lemarié, F.: Convective Mixing: an Energetically Consistent Non-Local Parameterization, EGU General Assembly 2024, Vienna, Austria, 14–19 Apr 2024, EGU24-4115, https://doi.org/10.5194/egusphere-egu24-4115, 2024.

EGU24-4161 | ECS | Posters on site | OS4.2 | Highlight

Responses of Phytoplankton Communities to Internal Waves inOligotrophic Oceans 

wupeng xiao, lingqi ma, xiaolin bai, Edward Laws, cui guo, xin liu, Kuo-Ping Chiang, kunshan gao, and bangqin huang

Understanding the potential impacts of internal waves on phytoplankton communities in oligotrophic oceans remains an important research challenge. In this study, we elucidated the impact of internal waves on phytoplankton communities through a comprehensive 154-hr time-series of observations in the South China Sea (SCS). We identified distinctive variations in phytoplankton pigment biomass and composition across the upper, middle, and lower layers of the euphotic zone, which we attributed to the perturbations triggered by internal waves. Phytoplankton other than Prochlorococcus in the lower, nutrient-replete layer likely benefitted from allochthonous nutrients introduced by internal waves, but their growth rates were constrained by light limitation, and their pigment biomass was held in check by microzooplankton grazing. In contrast, in the upper, nutrient-depleted layer, the relative abundance of Prochlorococcus increased, likely because of the ammonium regenerated by zooplankton. The middle layer, characterized as the deep chlorophyll maximum layer, exhibited a dynamic equilibrium characterized by nutrient and light co-limitation. This equilibrium resulted in high nitrate assimilation and growth by phytoplankton. The balancing of those rates by significant grazing losses maintained total chlorophyll a concentrations at a high level. Based on these findings, we proposed a three-layer euphotic zone structure characterized by distinct physiological conditions, nutrient-light dynamics, grazing pressure, and phytoplankton responses to internal waves. This three-layer paradigm elucidated the intricate interplay between internal waves and phytoplankton communities and provided insights into the mechanisms that govern primary production and carbon cycling in oligotrophic oceanic ecosystems.

How to cite: xiao, W., ma, L., bai, X., Laws, E., guo, C., liu, X., Chiang, K.-P., gao, K., and huang, B.: Responses of Phytoplankton Communities to Internal Waves inOligotrophic Oceans, EGU General Assembly 2024, Vienna, Austria, 14–19 Apr 2024, EGU24-4161, https://doi.org/10.5194/egusphere-egu24-4161, 2024.

EGU24-4384 | ECS | Posters on site | OS4.2

Estimating the Energy Flux of Internal Tides in the Northern South China Sea Using Underwater Gliders 

Zhiyuan Gao, Zhaohui Chen, Xiaodong Huang, Haiyuan Yang, Yanhui Wang, Wei Ma, and Chenyi Luo

The character of internal tides energy flux in the northern South China Sea (SCS) is explored through an analysis of a fleet of underwater gliders. It is found that the lower mode diurnal internal tides with ~300 km wavelength in the middle basin originate predominantly at the Luzon Strait (LS) and propagate over 1000 km to the western SCS. The semidiurnal internal tides, however, originate from multiple regions, including the LS, the continental shelf, and the islands in the west part. The energy flux of the mode-1 diurnal internal tides attenuated rapidly within 450 km of the LS and was less pronounced after that. The estimated dissipation rate based on the mode-1 energy flux is about 10-8 W/kg, underling the significant role of mode-1 diurnal internal tides in bolstering far-field mixing. This study provides a unique view of the spatial pattern, energy flux, and energy sink of the internal tides in the northern SCS, which could supplement the altimetry-based results and improve the parameterization in ocean models. 

How to cite: Gao, Z., Chen, Z., Huang, X., Yang, H., Wang, Y., Ma, W., and Luo, C.: Estimating the Energy Flux of Internal Tides in the Northern South China Sea Using Underwater Gliders, EGU General Assembly 2024, Vienna, Austria, 14–19 Apr 2024, EGU24-4384, https://doi.org/10.5194/egusphere-egu24-4384, 2024.

Joint effects of winds and tides on near-inertial internal waves (NIWs) are numerically investigated via a series of three-dimensional quasi-realistic simulations in the northern South China Sea (NSCS). Model results demonstrate that in the presence of wind-induced NIWs, more tidal energy is transferred to NIWs, while in the presence of tide-induced NIWs, the extreme wind (cyclone) would inject less near-inertial kinetic energy (NIKE). The interaction between wind-induced and tide-induced NIWs produces total NIKE more (or less) than a linear superposition of that generated by wind and tide forcing alone at different sites in the NSCS. Specifically, near the Luzon Strait, both tides and winds make positive contributions to the local near-inertial energy input, resulting in more than 30% enhancement of total NIKE (>0.5 kJ m-2). However, in some deep-water regions along the cyclone paths, energy is transferred from cyclones to NIWs and also from NIWs to internal tides. Due to this “energy pipeline” effect, tide- and wind-induced NIWs contribute to weakening of total NIKE (~0.3 kJ m-2 or 30%). Additionally, sensitivity experiments with varying initial tidal phases indicate that the interaction between wind-induced NIKE and tide-induced NIKE is robust in most model domain (over 80%) under different phase alignments between wind- and tide-induced NIWs. From the perspective of cyclones, tide-induced NIKE is comparable to wind-induced NIKE in the Luzon Strait before the arrival of cyclones, while tide-induced NIKE is two orders of magnitude smaller than wind-induced NIKE in most of the NSCS after the arrival of cyclones. Overall, our results highlight the joint effects of wind and tide forcing on the local NIW dynamics in the NSCS.

How to cite: Gong, Y.: Joint Effects of Winds and Tides on Near-Inertial Internal Waves in the Northern South China Sea: A Three-Dimensional Numerical Study, EGU General Assembly 2024, Vienna, Austria, 14–19 Apr 2024, EGU24-5062, https://doi.org/10.5194/egusphere-egu24-5062, 2024.

Hourly satellite-tracked surface drifter data are utilized to study energy transfer from eddies to Near-Inertial Waves (NIWs). Spatial velocity gradients are computed from two consecutive velocity estimates derived from the same drifter, providing variable spatial resolutions of (1 km). The eddy-to-NIW energy transfer can be positive or negative, with the positive transfer (forward energy cascade) dominant. The global integrated energy transfer rate (ε) is 0.025 TW, with the anticyclonic eddy contribution dominant over the cyclonic eddy contribution. Given that the global near-inertial wind work (W) is 0.2 TW, the eddy-to-NIW energy transfer efficiency (ε/W) is about 13%, which is one order of magnitude larger than that in low resolution simulations. This result may still underestimate the Eulerian energy transfer by a factor of 2. To our knowledge, this is the first time that this energy transfer is calculated from global drifter observations, providing a baseline for comparison in future studies.

How to cite: Chen, Z.: Energy Transfer between Mesoscale Eddies and Near-inertial Waves from Surface Drifter Observations, EGU General Assembly 2024, Vienna, Austria, 14–19 Apr 2024, EGU24-5641, https://doi.org/10.5194/egusphere-egu24-5641, 2024.

EGU24-6399 | Posters on site | OS4.2

Implementation of implicit filter for spatial spectra extraction 

Kacper Nowak and Sergey Danilov

Scale analysis based on coarse-graining has been proposed recently as an alternative to Fourier analysis. It is now broadly used to analyze energy spectra and energy transfers in eddy-resolving ocean simulations. However, it requires interpolation to a regular mesh for data from unstructured-mesh models. We present an alternative coarse-graining method which relies on implicit filters using discrete Laplacians. This method can work on arbitrary (structured or unstructured) meshes and is applicable to the direct output of unstructured-mesh ocean circulation models. We also present a high-performance Python implementation of this method. In this implementation computation has been split into two phases: preparation and solving. The first one is specific only to the mesh. This allows for auxiliary arrays that are then computed to be reused, significantly reducing computation time. The second part consists of sparse matrix algebra and solving linear system. Our implementation is accelerated by GPU to achieve unmatched performance and scalability. This results in processing data based on meshes with more than 10M surface vertices in a matter of seconds. At present, the method is used to compute energy or power spectra of ocean flows.

How to cite: Nowak, K. and Danilov, S.: Implementation of implicit filter for spatial spectra extraction, EGU General Assembly 2024, Vienna, Austria, 14–19 Apr 2024, EGU24-6399, https://doi.org/10.5194/egusphere-egu24-6399, 2024.

Internal solitary waves (ISWs) were observed by mooring data in the South China Sea in August and September 2014. Normally the arrival pattern of ISWs is relatively regular and the ISW amplitudes have a positive correlation with the magnitude of semidiurnal tidal currents near the Luzon Strait. However, the ISW amplitudes observed in the second spring tide of September are significantly large when an anti-cyclonic eddy is passing the mooring. When an ISW passes the eddy center, its amplitude reduces to nearly zero, but when an ISW passes the eddy edge, its amplitude increases by 50%. A deepened thermocline always damps the ISW amplitudes, whilst the eddy-induced background currents at different locations may have varied effects on the ISW amplitudes, e.g., the background current at the eddy center tends to damp the ISW amplitude but that at the eddy edge amplifies the ISW amplitude. The different effects of a deepened thermocline and eddy-induced background currents near the eddy edge may damp or amplify the ISW amplitude.

How to cite: Xu, J.: Observations of different effects of an anti-cyclonic eddy on internal solitary waves in the South China Sea , EGU General Assembly 2024, Vienna, Austria, 14–19 Apr 2024, EGU24-6907, https://doi.org/10.5194/egusphere-egu24-6907, 2024.

EGU24-7177 | ECS | Posters on site | OS4.2

Generation of the Equatorial Intermediate Current in the eastern Pacific Ocean 

Yusuke Terada and Yukio Masumoto

It has been shown that the Equatorial Intermediate Current (EIC) in the Pacific Ocean, which is westward current along the equator at intermediated depth (from 500m to at least 2000 m), has basin wide zonally uniform structure. In addition to the EIC, intraseasonal variability (ISV) has also been observed near the equator at 1000 m depth with significant amplitude in the eastern Pacific Ocean. Although this intermediate ISV in the eastern basin is considered as an energy source for the EIC, the origin of the intermediate ISV and its relation to the EIC in the Pacific Ocean are still open questions. In this study, we use the 10-day mean horizontal velocity obtained from drift data of the Argo floats and the temperature data from Tropical Atmosphere-Ocean (TAO) moored array in the equatorial Pacific for a period from 2010 to 2022 to investigate the relationship among the EIC, the ISV at the depth of 1000 m, and the ISV in the upper layer.

The meridional component of eddy kinetic energy (V-EKE) at 1000 m depth depicts large intraseasonal variability with a period of about 30 days in the equatorial eastern Pacific, showing a significant seasonality and interannual amplitude modulation. Temperature time series above 500 m depth shows the large amplitude ISV along the equator with the meridionally anti-symmetric structure, whose phase (energy) propagates upward (downward). The surface ISV signal also indicates significant seasonal and interannual variation in its magnitude, which has the highest correlation with the ISV at 1000 m depth at a time lag of 3 months. These results suggest that the ISV at a depth of 1000 m is provided by the upper layer ISV through downward propagating Yanai wave, which takes about 3 months to reach 1000 m depth from the upper layer.

Argo-based zonal velocity in the equatorial Pacific Ocean is found to be westward during most of the high V-EKE season, and its magnitude varies on semiannual to interannual time scales. This suggests that intermittent Yanai wave propagation generates a westward flow at 1000 m depth, which could contribute to the generation of the EIC. Furthermore, comparison of results from two numerical simulations of idealized box ocean with or without eastern basin ISV indicates that downward propagating Yanai wave in the eastern Pacific Ocean generates westward flow locally at the intermediate depth. This may explain the observed basin-scale zonal extent of the EIC, which is unique to the Pacific Ocean. Influences of the realistic topography on the ISV and EIC at the intermediate depth will also be discussed.

How to cite: Terada, Y. and Masumoto, Y.: Generation of the Equatorial Intermediate Current in the eastern Pacific Ocean, EGU General Assembly 2024, Vienna, Austria, 14–19 Apr 2024, EGU24-7177, https://doi.org/10.5194/egusphere-egu24-7177, 2024.

EGU24-7470 | ECS | Orals | OS4.2

Evolution from Agulhas Ring to Mode-Water Eddy? 

Ria Oelerich, Maren Walter, Ralf Bachmayer, Christian Mertens, Lucas Merckelbach, and Jeff Carpenter

Agulhas Rings are anti-cyclonic warm-core eddies that originate from the interaction of the Agulhas current with the Antarctic Circumpolar Current (Agulhas Retroflection) at the southern tip of Africa. The Agulhas Rings are advected with the Benguela Current to the northwest and transport heat and salt into the South Atlantic Ocean and are thus affecting the ecosystem and the carbon cycle. The Walvis Ridge, which is located off the coast of Namibia, is a natural obstacle for the Agulhas Rings that are oftentimes unable to cross the ridge and thus remain in its vicinity until they dissolve. Due to the lack of long-term, high-resolution and sub-surface observations it is not well understood how the properties of these eddies evolve with time. We present long- and short-term observations from moorings (2022-2023) and two ocean glider campaigns (2022, 2023) as part of the SONETT I and SONETT II research expeditions near Walvis Bay. For the glider missions, automated adaptive sampling algorithms were developed to systematically improve the spatial and temporal resolution in the region of interest that is dynamically changing. Moreover, the gliders were equipped with microstructure probes for detailed energy dissipation measurements. In this study, we show how the eddy characteristics, such as temperature, salinity and oxygen, near Walvis Bay evolve with time and how these changes relate to the energy dissipation. Specifically in 2023, a deep glider (up to 1000 m) observed a unique eddy structure below the surface mixed layer that displayed subsurface eddy characteristics, but with a surface signal, indicating the characteristics of a mode-water eddy with a very distinct pattern of energy dissipation.

How to cite: Oelerich, R., Walter, M., Bachmayer, R., Mertens, C., Merckelbach, L., and Carpenter, J.: Evolution from Agulhas Ring to Mode-Water Eddy?, EGU General Assembly 2024, Vienna, Austria, 14–19 Apr 2024, EGU24-7470, https://doi.org/10.5194/egusphere-egu24-7470, 2024.

EGU24-9301 | ECS | Orals | OS4.2

Data-driven and data-agnostic stochastic parametrization of unresolved processes 

Francesco Tucciarone, Etienne Mémin, and Long Li

The simulation of planetary flows at all the scales that have a significant impact on the climate system is unachievable with nowadays computational resources. Large-scale simulations of the Ocean (as well as for Atmosphere) remains the primary tool of investigation while high resolution simulations can be obtained only for small geographical domains or short integration periods. The complex interdependence of mesoscale and sub-mesoscale dynamics, however, is lost in state-of-the-art simulations when performed at scales that are too large to capture these phenomena. Most of the modeling challenges arise from the representation of these effects in a parameterized manner. This work investigates the so called Location Uncertainty (LU) framework [1,2], that provides a solid theoretical background for the definition of a large-scale representation with an additional stochastic component representing the subgrid contribution, introducing new degrees of freedom to be exploited in the modeling of specific phenomena [2]. The model, that has been proven successful in several large-scale models for ocean dynamics [3,4,5,6], is implemented in the community ocean model NEMO (https://www.nemo-ocean.eu) in its hydrostatic primitive equation version, as outlined in [6] and already tested in [7]. An idealized double-gyre configuration is shown to be improved by the stochastic addition in both eddy permitting (~35km) and eddy resolving (~10km) regimes, under a variety of choices of the noise model including both data-driven and data-agnostic approaches.


[1] E. Mémin Fluid flow dynamics under location uncertainty,(2014), Geophysical & Astrophysical Fluid Dynamics, 108, 2, 119–146.

[2] G. Tissot, E. Mémin, Q. Jamet, (2023), Stochastic compressible Navier-Stokes equations under Location uncertainty, Stochastic Transport in Upper Ocean Dynamics, Springer. 

[3] W. Bauer, P. Chandramouli, L. Li, and E. Mémin. Stochastic representation of mesoscale eddy effects in coarse-resolution barotropic models. Ocean Modelling, 151:101646, 2020.

[4] Rüdiger Brecht, Long Li, Werner Bauer and Etienne Mémin. Rotating Shallow Water Flow Under Location Uncertainty With a Structure-Preserving Discretization. Journal of Advances in Modeling Earth Systems, 13, 2021MS002492.

[5] V. Resseguier, L. Li, G. Jouan, P. Dérian, E. Mémin, B. Chapron, (2021), New trends in ensemble forecast strategy: uncertainty quantification for coarse-grid computational fluid dynamics, Archives of Computational Methods in Engineering.

[6] F.L. Tucciarone, E. Mémin, L. Li, (2022), Primitive Equations Under Location Uncertainty: Analytical Description and Model Development, Stochastic Transport in Upper Ocean Dynamics, Springer.

[7] F.L. Tucciarone, E. Mémin, L. Li, (2023), Data driven stochastic primitive equations with dynamic modes decomposition, Stochastic Transport in Upper Ocean Dynamics, Springer.

How to cite: Tucciarone, F., Mémin, E., and Li, L.: Data-driven and data-agnostic stochastic parametrization of unresolved processes, EGU General Assembly 2024, Vienna, Austria, 14–19 Apr 2024, EGU24-9301, https://doi.org/10.5194/egusphere-egu24-9301, 2024.

EGU24-11635 | ECS | Posters on site | OS4.2

Reducing spurious numerical mixing in simulations under strong tidal forcing : a case study 

Adrien Garinet, Patrick Marsaleix, and Marine Herrmann

Tides, and more specifically the internal gravity wave field generated by the tidal current flowing over bathymetric features, play a significant role in the energy cascade and in setting the global state of the ocean by intensifying mixing. Accounting for these dynamics in numerical models is important for accurately depicting energy transfer across scales, and an increasing number of models use explicit tidal forcing. Yet, in fixed coordinates models, the strong vertical motions generated by internal waves trigger the tendency of advection to produce numerical errors, leading on the vertical to spurious numerical mixing that can easily be as high as the physical one. This can severely bias model output and impact the overall simulated dynamics by spuriously mixing water masses and modifying the stratification, which in turn impacts the propagation of internal waves. We propose a fresh way to look at advection schemes, along with a method to make their diffusivity more selective, and eventually protect the relevant vertical scales from being spuriously eroded. A case study on the South East Asian Seas using the Symphonie model is presented, since these seas are known for being the generation site of exceptionally strong internal tides.

How to cite: Garinet, A., Marsaleix, P., and Herrmann, M.: Reducing spurious numerical mixing in simulations under strong tidal forcing : a case study, EGU General Assembly 2024, Vienna, Austria, 14–19 Apr 2024, EGU24-11635, https://doi.org/10.5194/egusphere-egu24-11635, 2024.

EGU24-12074 | ECS | Posters on site | OS4.2

Sensitivity Analysis of the Lorentz Energy Cycle in the ICON-O Model 

Dominic Hillenkötter and Nils Brüggemann

This study provides an analysis of the ocean Lorentz Energy Cycle (LEC) simulated with an ICON-O configuration of 5km horizontal resolution. We focus on those aspects of the LEC related to the dissipation of mesoscale eddy energy. Since most processes relevant for eddy dissipation cannot be resolved even with 5km horizontal resolution, parameterizations are required to dissipate the energy. Typical parameterizations used in ocean models are bottom friction, vertical viscous dissipation and horizontal biharmonic dissipation. We analyse how these parameterizations are responsible for the simulated eddy energy dissipation. Dedicated sensitivity experiments estimate uncertainties arising from these parameterizations when typical friction parameters are modified. These experiments allow to assess the impact on the overall energy balance. Furthermore, we discuss how inertial and sub-inertial motions influence the overall energy dissipation. Overall, this study aims to provide the basis for future, more realistic diagnostics and parameterizations of the processes involved in eddy dissipation.

How to cite: Hillenkötter, D. and Brüggemann, N.: Sensitivity Analysis of the Lorentz Energy Cycle in the ICON-O Model, EGU General Assembly 2024, Vienna, Austria, 14–19 Apr 2024, EGU24-12074, https://doi.org/10.5194/egusphere-egu24-12074, 2024.

EGU24-12521 | ECS | Posters on site | OS4.2

Interactions of internal gravity waves with other waves and mesoscale eddies 

Pablo Sebastia Saez, Carsten Eden, and Manita Chouksey

We find internal gravity waves everywhere in the oceans. The interaction of these waves with other waves or eddies are key to the energy transfers in the ocean and can also lead to wave breaking and density mixing, which in turn drives the large-scale mean flow. The importance of wave-wave interactions compared to wave-mean flow interactions, however, remains largely unknown. We present two methods to better understand both processes: First, the scattering of waves by other waves is evaluated numerically using the kinetic equation derived from the assumption of weak interactions. Second, the interaction of waves with a local coherent meso-scale eddy and a random eddy field is simulated using a novel numerical model called the Internal Wave Energy Model based on the six-dimensional radiative transfer equation. We find mainly a forward energy cascade due to wave-wave interactions. Waves loose energy to the local eddy at its rim in a critical layer like behaviour, while the eddy field scatters the waves along a constant frequency cone.

How to cite: Sebastia Saez, P., Eden, C., and Chouksey, M.: Interactions of internal gravity waves with other waves and mesoscale eddies, EGU General Assembly 2024, Vienna, Austria, 14–19 Apr 2024, EGU24-12521, https://doi.org/10.5194/egusphere-egu24-12521, 2024.

EGU24-13249 | Orals | OS4.2

Turbulent dynamics and energetics of anticyclonic submesoscale headland wakes 

Tomás Chor and Jacob Wenegrat

Both submesoscale flows and interactions with topography have been posited to be important factors driving dissipation and mixing in the ocean. However, since their in-situ measurement is difficult and numerical approaches do not typically resolve the turbulent processes responsible for the irreversible mixing and dissipation, the dynamics and energetics of submesoscale flows generated by topography are not currently well-understood.

In this work we attempt to clarify the topic by investigating a series of realistic Large-Eddy simulations of submesoscale flows past a headland where the turbulence is fully resolved, allowing us to probe into the small-scale processes responsible for the energy cascade. Consistent with previous studies, we find strong evidence of submesoscale centrifugal-symmetric instabilities (CSIs) in the wake, with most of the wakes being energized mainly via horizontal shear production (i.e., centrifugal instabilities). We also find that the mixing efficiency (the fraction of total energy extracted from the flow spent mixing buoyancy) within CSI regions in the wake varies between approximately 0.1 and 0.3, consistent with previous studies that found similar variability in CSI mixing efficiency values.

Finally, despite our simulations spanning a wide range of parameter space and at least three different dynamical regimes (namely regimes with detached eddy formation, attached boundary layers and tridimensional wake turbulence), we show that some quantities of interest can be predicted by simple scalings. As examples, the kinetic energy dissipation and buoyancy mixing rates scale with the Slope Burger number, and the vertical eddy diffusivity scales with the Rossby number times the Froude number.

How to cite: Chor, T. and Wenegrat, J.: Turbulent dynamics and energetics of anticyclonic submesoscale headland wakes, EGU General Assembly 2024, Vienna, Austria, 14–19 Apr 2024, EGU24-13249, https://doi.org/10.5194/egusphere-egu24-13249, 2024.

EGU24-13707 | ECS | Orals | OS4.2

A scale-dependent vertical structure for energy backscatter parameterizations 

Wenda Zhang, Stephen Griffies, Elizabeth Yankovsky, Robert Hallberg, and Alistair Adcroft

Ocean mesoscale eddies constitute a crucial component of ocean energy cascade, engaging in energy exchange with large-scale circulations, submesoscale eddies, and internal waves. State-of-the-art ocean climate models, which partially resolve mesoscale eddies (i.e., eddy-permitting), often exhibit weaker and more surface-intensified eddy kinetic energy (EKE) than in higher-resolution simulations and observations. The energy backscatter scheme has been employed in eddy-permitting simulations to enhance the energy of mesoscale eddies by compensating for the excessive dissipation caused by the viscosity closure. In this scheme, a proper vertical structure for the backscatter coefficient is necessary to simulate a more realistic vertical distribution of kinetic energy. 

Here we propose a parameterization for the vertical structure of subgrid EKE and implement it within the backscatter scheme in idealized eddy-permitting simulations of MOM6. The parameterization is grounded in the observation that the EKE is surface-intensified and decays faster with depth at smaller horizontal scales. The diagnosed vertical structure of EKE from eddy-resolving simulations is well-captured by surface quasi-geostrophic (SQG) modes, whose vertical structure depends on the eddy horizontal scale, Coriolis parameter, and stratification profile. Based on the SQG mode, we formulate a scale-aware parameterization of the vertical structure, accounting for the variation of subgrid eddy scale with the model horizontal grid spacing. This vertical structure is then applied to the energy backscatter coefficient used in 1/2° and 1/4° idealized simulations of basin-scale ocean circulations. The diagnostics of these eddy-permitting simulations are compared to those of a 1/32° reference simulation. The inclusion of the vertical structure in the backscatter improves the simulation of global kinetic energy distributions, large-scale circulation pathways, and isopycnal structures, compared with the eddy-permitting simulations without backscatter or with a depth-independent backscatter. Sensitivity tests show that a more surface-intensified backscatter tends to result in weaker total kinetic energy and more tilted isopycnals. This work provides insights into the parameterization of mesoscale energetics and its vertical variation in eddy-permitting simulations.

How to cite: Zhang, W., Griffies, S., Yankovsky, E., Hallberg, R., and Adcroft, A.: A scale-dependent vertical structure for energy backscatter parameterizations, EGU General Assembly 2024, Vienna, Austria, 14–19 Apr 2024, EGU24-13707, https://doi.org/10.5194/egusphere-egu24-13707, 2024.

EGU24-15421 | Orals | OS4.2 | Highlight

Constraining fiber-optic cable observations of internal waves with conventional oceanographic measurements 

Mariona Claret, Arantza Ugalde, Kraig Winters, Anda Vladoiu, Ethan Williams, Joaquim Salvador, Nina Hoareau, Hugo Martins, Hugo Latorre, Pedro J. Vidal-Moreno, Miguel González-Herráez, and José Luís Pelegrí
Ocean mixing plays a crucial role in the Earth’s climate, however quantifying it is challenging because energy enters the ocean at basin-scale but it dissipates at cm-scale over the vast ocean. Internal waves play an important role in the cascade of energy toward dissipative scales. Energy transfers to the internal wave field are greatly enhanced through flow interactions with topography. Observations of wave-topography interactions are, however, scarce. Distributed Acoustic Sensing (DAS) has recently opened a new door for exploring near-bottom wave dynamics using fibre-optic cables at unprecedented spatio-temporal resolution (meters and seconds) over long spatio-temporal scales (kilometers and months). DAS is particularly attractive as it can use telecommunication cables already in place so that it could potentially be implemented at global scale.

Here we present repeated DAS observations on the continental slope east of Gran Canaria island complemented with contemporaneous hydrographic and velocity data collected with bottom moorings for the first time. Results show that upslope propagation of internal tides is a permanent feature at this site. DAS-inferred tidal temperature oscillations of 2 K magnitude agree with direct temperature observations. Preliminary results showing spectral peaks at the M2 tidal frequency and its harmonics is suggestive of wave-wave interactions. Finally, the potential of DAS to estimate lateral diffusion coefficients is considered.

How to cite: Claret, M., Ugalde, A., Winters, K., Vladoiu, A., Williams, E., Salvador, J., Hoareau, N., Martins, H., Latorre, H., Vidal-Moreno, P. J., González-Herráez, M., and Pelegrí, J. L.: Constraining fiber-optic cable observations of internal waves with conventional oceanographic measurements, EGU General Assembly 2024, Vienna, Austria, 14–19 Apr 2024, EGU24-15421, https://doi.org/10.5194/egusphere-egu24-15421, 2024.

EGU24-16524 | ECS | Posters on site | OS4.2

Decomposing Realistic Oceanic Flow in Balanced and Unbalanced Parts Using a Novel Balancing Approach 

Silvano Rosenau, Manita Chouksey, and Carsten Eden

Decomposing oceanic flow fields into its slowly evolving geostrophic component and the fast wave mode is necessary to understand processes like mesoscale eddy dissipation and spontaneous wave emission. The application of existing decomposition methods, such as nonlinear normal mode decomposition or optimal balance is limited to idealized model settings that neither include topography nor a varying Coriolis parameter. To overcome these limitations, we propose a new approach that combines optimal balance with a time-averaging procedure. This approach eliminates the necessity for the Fourier transformation that is required in the original optimal balance method. We tested and compared the new  variation of optimal balance with the original method in a scaled rotating shallow water model in various dynamical regimes, with Rossby numbers ranging from 0.03 to 0.5. In all tested configurations, the imbalances obtained with the new method converges towards the imbalances obtained with the original method. We further show that the convergence rate can be improved by doing multiple short time averages instead of a single long one. The new method is applicable to realistic ocean scenarios that include topography and a varying Coriolis parameter and shows promising results in decomposing complex flow fields.

How to cite: Rosenau, S., Chouksey, M., and Eden, C.: Decomposing Realistic Oceanic Flow in Balanced and Unbalanced Parts Using a Novel Balancing Approach, EGU General Assembly 2024, Vienna, Austria, 14–19 Apr 2024, EGU24-16524, https://doi.org/10.5194/egusphere-egu24-16524, 2024.

EGU24-17010 | ECS | Posters on site | OS4.2

Observations of Eddy - Internal Wave Interactions in the Tropics 

Marco Schulz, Florian Schütte, Marcus Dengler, and Tim Fischer

Based on an extensive dataset obtained from multiple individual ship-based samplings of mesoscale eddies and a long-term mooring (2006-2023), interactions between mesoscale eddies and internal waves are analyzed. Theory predicts that anticyclonic mesoscale eddies shift the effective Coriolis force for near-inertial waves (NIW) locally in regions of strong relative vorticity towards subinertial frequencies, leading to trapping of NIW in their core and accelerated downward propagation to a critical layer at the eddy base where mixing is eventually enhanced. In contrast, cyclones might expel NIW through the same but reverse effect. In both cases, and independent of their relative vorticity, increased mixing is expected in regions of strong vertical geostrophic shear at the rims due to critical layer processes. We are able to confirm these theoretical predictions in the observed dataset for several eddies (located mostly in the eddy-rich eastern boundary upwelling systems and waters surrounding the Cape Verde Archipelago). Velocity measurements in coherent anticyclonic eddies repeatedly show pronounced alternating current bands with amplitudes up to 15 cm/s, likely associated with convergence of downward propagated NIW. Microstructure measurements, supplemented by finescale parameterizations, show enhanced mixing in both, the base of anticyclones and slightly elevated dissipation rates at the rims of cyclones, where geostrophic shear is strong. Counterintuitive to the aforementioned theory, enhanced downward propagation was also observed below the center of cyclones. Frequency spectra from the mooring data indicate that the NIW frequency band is altered by the relative vorticity. Overall, a high variability of the internal wave field is observed and impacts of mesoscale eddies are readily apparent in the case of anticyclones, representing a path of energy into the deeper ocean and a key process for local mixing.

How to cite: Schulz, M., Schütte, F., Dengler, M., and Fischer, T.: Observations of Eddy - Internal Wave Interactions in the Tropics, EGU General Assembly 2024, Vienna, Austria, 14–19 Apr 2024, EGU24-17010, https://doi.org/10.5194/egusphere-egu24-17010, 2024.

EGU24-18021 | Posters on site | OS4.2

Cross-front wind forcing of a dense submesoscale filament 

Lars Umlauf, Mira Schmitt, and Jen-Ping Peng

In this study, the effects of cross-front winds on a submesoscale dense filament are investigated using high-resolution turbulence and velocity observations, and idealized numerical simulations. Our study area is the Baltic Sea, which is characterized by strong frontal gradients and pronounced submesoscale dynamics. Embedded in a large-scale frontal region, our observations reveal the existence of a 3-4 km wide, dense filament with an asymmetric structure resulting from the interactions between cross-front winds and the two submesoscale fronts laterally bounding the filament. These two fronts are driven by either downgradient winds, directed from the lighter surrounding waters toward the dense center of the filament, or upgradient winds, directed in the opposite direction. While the effect of a wind stress that is aligned with the frontal jet has been investigated in numerous previous studies, especially field data focusing on the role of cross-front winds are largely lacking at the moment. We find that for downgradient winds, when the surface Ekman transport and the frontal jet are aligned, both the frontal jet and the cross-front secondary circulation are enhanced. The latter supports a tendency for frontal re-stratification, suppression of turbulence, and mixed-layer shoaling. For the front with upgradient wind forcing, the Ekman transport and the frontal jet nearly cancel, and also the cross-front secondary circulation is strongly suppressed. Restratification by the secondary circulation is weak in this case, and the well-mixed turbulent surface layer is approximately twice as deep compared to the other side of the filament with downgradient forcing. We show that these mechanisms are consistent with results from idealized numerical simulations of frontal regions with downgradient and upgradient wind forcing.

How to cite: Umlauf, L., Schmitt, M., and Peng, J.-P.: Cross-front wind forcing of a dense submesoscale filament, EGU General Assembly 2024, Vienna, Austria, 14–19 Apr 2024, EGU24-18021, https://doi.org/10.5194/egusphere-egu24-18021, 2024.

EGU24-18340 | ECS | Posters on site | OS4.2 | Highlight

Transient Attracting Profiles in the Great Pacific Garbage Patch 

Luca Kunz, Alexa Griesel, Carsten Eden, Rodrigo Duran, and Bruno Sainte-Rose

A major challenge for cleanup operations in the Great Pacific Garbage Patch is to predict day to day variabilities of plastic concentrations and to identify hotspots of marine debris. An ideal application would indicate material confluence at operational scales O(1 − 10km) but from mesoscale observations of sea surface height O(10 − 100km). The present study introduces the concept of TRansient Attracting Profiles (TRAPs, Serra et al. (2020), Serra and Haller (2016)) to this debate. TRAPs are computable from the instantaneous strain field on the ocean surface and act like short-term attractors for floating objects. Previous experiments have shown the potential of TRAPs to predict pathways of material transport and here we explore the occurrence of these profiles in the North Pacific subtropical gyre, a large-scale convergence zone that is known to entail the Great Pacific Garbage Patch. We compute TRAPs upon daily snapshots of near-surface geostrophic + Ekman current velocity and create a 20-years record of 4,076,065 TRAP objects. We identify 720,391 TRAP trajectories from this data and relate the propagation, persistence and attraction strength of TRAPs to detections of mesoscale eddies. We uncover a life cycle of long-living TRAPs and evaluate recurrent patterns in their vorticity environment. Our study culminates in an unprecedented statistical analysis of drifter motion around TRAPs. We highlight beneficial conditions for hyperbolic transport, estimate local retention times of drifters and find a preference of drifter visits during the formation stage of TRAPs. Our findings provide novel aspects towards mesoscale strain on the ocean surface and how it may benefit search operations at sea.

How to cite: Kunz, L., Griesel, A., Eden, C., Duran, R., and Sainte-Rose, B.: Transient Attracting Profiles in the Great Pacific Garbage Patch, EGU General Assembly 2024, Vienna, Austria, 14–19 Apr 2024, EGU24-18340, https://doi.org/10.5194/egusphere-egu24-18340, 2024.

Typhoons in the northwestern Pacific induce strong oceanic responses. Using 17 years of satellite observations, the impacts of typhoons on sea surface temperature (SST) and chlorophyll-a (Chl-a) are investigated. The SST time series shows that the SST begins to decrease 2 days before the typhoon’s arrival and continues to decrease until 2 days following the typhoon’s passage. The Chl-a has a weak peak 2 days prior to the typhoon’s arrival, rapidly increases after the typhoon arrives, reaches the strongest response on the third day of the typhoon, and gradually decreases to a value slightly higher than the pre-typhoon level. Prominent responses are associated with typhoons that have stronger intensity and slower translation speed. The pre-typhoon upper ocean structure plays a dominant role in determining oceanic responses. Surface cooling is generally stronger where the pre-typhoon mixed layer depth (MLD) is shallow. However, the change in Chl-a shows a contrasting response in that the response prominently increases only when the depth of typhoon-induced mixing exceeds the pre-typhoon MLD. This study poses a quantitative approach to assess the influence of typhoons on the upper ocean from a statistical perspective with consideration of the upper ocean structure.

How to cite: Wang, Y.: Determination of ocean structure on response of sea surface temperature and chlorophyll to typhoon in NW Pacific Ocean , EGU General Assembly 2024, Vienna, Austria, 14–19 Apr 2024, EGU24-1462, https://doi.org/10.5194/egusphere-egu24-1462, 2024.

EGU24-3123 | ECS | Orals | OS4.3

HIDRA3: A Robust Deep-Learning Model for Multi-Point Sea-Surface Height Forecasting 

Marko Rus, Hrvoje Mihanović, Matjaž Ličer, and Matej Kristan

Accurate sea surface height (SSH) forecasting is crucial for predicting coastal flooding and protecting communities. Recently, state-of-the-art physics-based numerical models have been outperformed by machine learning models, which rely on atmospheric forecasts and the immediate past measurements obtained from the prediction location. The reliance on past measurements brings several drawbacks. While the atmospheric training data is abundantly available, some locations have only a short history of SSH measurement, which limits the training quality. Furthermore, predictions cannot be made in cases of sensor failure even at locations with abundant past training data. To address these issues, we introduce a new deep learning method HIDRA3, that jointly predicts SSH at multiple locations. This allows improved training even in the presence of data scarcity at some locations and enables making predictions at locations with failed sensors. HIDRA3 surpasses the state-of-the-art model HIDRA2 and the numerical model NEMO, on average obtaining a 5.0% lower Mean Absolute Error (MAE) and an 11.3% lower MAE on extreme sea surface heights.

How to cite: Rus, M., Mihanović, H., Ličer, M., and Kristan, M.: HIDRA3: A Robust Deep-Learning Model for Multi-Point Sea-Surface Height Forecasting, EGU General Assembly 2024, Vienna, Austria, 14–19 Apr 2024, EGU24-3123, https://doi.org/10.5194/egusphere-egu24-3123, 2024.

EGU24-6187 | ECS | Posters on site | OS4.3

Storm impacts on the marine environment in the English channel 

Harshal Chavan, Francois G Schmitt, and Urania Christaki

We are considering how storms in the English Channel influence the sea water's environment, including salinity, turbidity, oxygen, and temperature. Sudden variations in these environmental variables can disrupt the coastal ecosystems. The impact can lead to eutrophication, hypoxic conditions, harmful algal bloom formation and changes in phytoplankton community structure. The objective is to address these changes using observation data.

For this, we collected observation data from different sites of the English channel from 2010 to 2023. We are using databases from different French National Observing Systems (SNOs): SNO SOMLIT and SNO PHYTOBS providing at low frequency (every 15 days) biogeochemical parameters as well as phytoplankton communities, and SNO COAST HF, providing several biogeochemical parameters at high frequency (10 to 30 minutes). Météo France data hourly meteorological data are used as storm indicators. The changes in environmental structure are considered using various statistical analyses (statistical moments, probability density function, Fourier spectral analysis, biodiversity indicators).

Examples from the storms Ciara (10 Feb 2020), Dirk (December 2013) and Eleanor (3 Jan 2018) will be provided. 


Keywords: English Channel, Storm, Observation databases, Turbulence

How to cite: Chavan, H., Schmitt, F. G., and Christaki, U.: Storm impacts on the marine environment in the English channel, EGU General Assembly 2024, Vienna, Austria, 14–19 Apr 2024, EGU24-6187, https://doi.org/10.5194/egusphere-egu24-6187, 2024.

EGU24-8849 | ECS | Posters virtual | OS4.3

Upper ocean biogeochemical response of Arabian Sea to extremely severe cyclonic storm “Biparjoy” 

Prashant Kumar Makhan and Debadatta Swain

Recent warming in the tropical oceans has increased tropical cyclone (TC) activity globally. The Arabian Sea (AS) in the northern Indian Ocean is such a basin with rising TC activity. TCs have the potential to favor the short-term productivity of the ocean through extensive mixing of the upper ocean, bringing about temporary variations in the biogeochemistry. The current study investigates the upper ocean biogeochemical response of AS to a TC utilizing data sets from six Bio-Argos, multi-satellite observations, and biogeochemical models from Copernicus Marine Services. The extremely severe cyclonic storm “Biparjoy”, one of the long-duration TCs in the basin was chosen as a case study. It formed during the onset of the Indian summer monsoon in June 2023 and persisted for eleven days (6th to 16th June 2023). Profiles obtained from the Bio-Argos around the storm track showed extensive cooling (~4 °C) in the upper surface. The strong TC also resulted in significant vertical mixing which brought cold, nutrient-rich water to the upper surface. Dissolved oxygen concentration was observed to have decreased during the cyclone, compared to pre- and post-cyclone periods. Eventually, an increased chlorophyll concentration, persisting for more than a week, was observed along the track in the sub-surface and surface waters after the passage of the storm. Biogeochemical model data was used to analyze the intricate variations in the upper ocean biogeochemistry of AS during the storm. Further analysis for a better understanding of the upper ocean response of the AS to cyclonic storms in recent years is in progress.

How to cite: Makhan, P. K. and Swain, D.: Upper ocean biogeochemical response of Arabian Sea to extremely severe cyclonic storm “Biparjoy”, EGU General Assembly 2024, Vienna, Austria, 14–19 Apr 2024, EGU24-8849, https://doi.org/10.5194/egusphere-egu24-8849, 2024.

EGU24-8900 | ECS | Orals | OS4.3

The summer marine heatwaves in the North Sea in 2023 

Bayoumy Mohamed, Alexander Barth, and Aida Alvera-Azcárate

Marine heatwaves (MHWs) have increased worldwide in recent decades and are considered one of the most pressing challenges of climate change due to their dramatic environmental and socio-economic impacts. This study examines the occurrence of MHW in the North Sea over more than four decades (1982-2023) by analyzing the long-term trends and interannual variations of MHW characteristics. The study also investigates the role of atmospheric and large-scale climate modes on MHW generation. We find that the accelerated SST warming trend (0.38 ± 0.04 °C/decade) was accompanied by an increase in MHW frequency by 1.0± 0.3 events/decade and in MHW days by 17± 6 days/decade over the entire period. In the summer of 2023, several extreme climate events were observed worldwide, including terrestrial and oceanic heatwaves. This triggered strong media interest and public concern about the causes and links to climate change. In the North Sea, the average SST value broke the record in June and September 2023 with several extreme MHWs. In June 2023, the northwestern part of the North Sea experienced the strongest MHW since 1982, which lasted three weeks (from June 13 to July 4, 2023) and was attributed to changes in atmospheric circulation.

Keywords: North Sea; SST; marine heatwaves; ERA5.

How to cite: Mohamed, B., Barth, A., and Alvera-Azcárate, A.: The summer marine heatwaves in the North Sea in 2023, EGU General Assembly 2024, Vienna, Austria, 14–19 Apr 2024, EGU24-8900, https://doi.org/10.5194/egusphere-egu24-8900, 2024.

Sea-level extremes represent a great danger to coastal infrastructure and a daily threat to people living near the coast. These extremes are predicted to become more frequent in the coming years and decades, mostly due to mean sea-level rise. Knowledge of the underlying principles that drive these events is, thus, of greater importance than ever. Our analysis focuses on events of high-frequency sea-level extremes (extremes at periods shorter than 2 hours). Extreme events were extracted from sea level data series measured at six Adriatic Sea tide gauge records. Series lengths were from 16 to 17.5 years. The sea-level data series were split into a training set and a testing set. Splitting was done so that approximately 80% of the series were used for the training and remaining 20% for the testing. K-means classification was then used to associate extremes events of the training period with atmospheric synoptic conditions, represented with the synoptic variables downloaded from the ERA5 reanalysis. The atmospheric variables considered were the ones found by earlier research to be the most important when it comes to generation of intense high-frequency sea-level oscillations. These variables are: (i) temperature at 850 hPa, (ii) mean sea-level pressure and wind at 10 m and (iii) geopotential at 500 hPa. K-means classification was used to find prevailing clusters related to extremes at each of the six tide gauges. After that, the same synoptic variables were downloaded for each day of the testing period. To each tide gauges, and to each day of the testing period, a cluster, previously defined for the training period, was assigned. The idea was to check whether days of known extremes will be correctly clustered. The goodness of the approximations was determined by estimating the distance of the synoptic maps from the clusters. The results show that the testing period days with extremes have a smaller distance from the clusters than random days indicating that there is a potential for prediction of these events.

How to cite: Ruić, K., Šepić, J., and Vojković, M.: Application of K-means classification for extraction of atmospheric synoptic conditions leading to the high-frequency sea level extremes of the Adriatic Sea, EGU General Assembly 2024, Vienna, Austria, 14–19 Apr 2024, EGU24-9039, https://doi.org/10.5194/egusphere-egu24-9039, 2024.

EGU24-12709 | Orals | OS4.3

Impact of Marine Heatwaves over the water column in a coastal ocean: a case study in the Bay of Biscay and the English Channel  

Guillaume Charria, Coline Poppeschi, Amélie Simon, Anne Gaymard, Maud Martinez Almoyna Carlhand, Nicolas Savoye, Camilla Lienart, Caroline Ulses, Ivane Pairaud, Xavier Couvelard, Sébastien Theetten, and Jean-François Le Roux

Coastal ecosystems are under climate and anthropogenic pressures. Extreme events as Marine Heatwaves (MHW) directly impact environmental conditions necessary to sustain biodiversity in coastal oceans. Recent results showed increasing occurrence and intensity of MHW in the Bay of Biscay and the English Channel based on surface temperature observations.

Combining satellite and in situ observations with recent high resolution numerical simulations, the impact of MHW on the whole water column is investigated to evaluate potential impacts on pelagic and benthic ecosystems. Special attention is given to the last two years, 2022 and 2023, as unprecedent warm years.

The last two decades have been observed (in situ and from satellites) and simulated (using CROCO coastal ocean model with 1km resolution) allowing to identify and characterize MHW (occurrence, duration, intensity). The propagation in the water column of observed heating is investigated with regard to the local dynamics (e.g. tides, constrained shallow waters, river plume dynamics). Depending on hydrodynamical conditions, impacts of MHW on the water column are contrasted and sensitive to characteristics from this type of extreme events.

Those first results are designed to pave the way for an assessment of the MHW impact on the coastal ecosystem during the last two decades with a focus on 2022 and 2023.

How to cite: Charria, G., Poppeschi, C., Simon, A., Gaymard, A., Martinez Almoyna Carlhand, M., Savoye, N., Lienart, C., Ulses, C., Pairaud, I., Couvelard, X., Theetten, S., and Le Roux, J.-F.: Impact of Marine Heatwaves over the water column in a coastal ocean: a case study in the Bay of Biscay and the English Channel , EGU General Assembly 2024, Vienna, Austria, 14–19 Apr 2024, EGU24-12709, https://doi.org/10.5194/egusphere-egu24-12709, 2024.

EGU24-13640 | ECS | Orals | OS4.3 | Highlight

Wind-Speed Anomalies and SST Rise: Investigating the Mid-2023 Heatwave Propagation below the sea surface 

Charlotte Pereira, Borja Aguiar-González, Mathew Carr, and Francisco Machín

   For the study of the marine heatwave that occurred from mid-May to late summer 2023, data provided by AEMET (Spanish Meteorological Agency) for the Gran Canaria Airport and Sea Surface Temperature from Copernicus (products METOFFICE-GLO-SST-L4-REP-OBS-SST and METOFFICE-GLO-SST-L4-NRT-OBS-SST-V2) have been utilized. The employed data include the daily records of meteorological and oceanographic variables from 1982 to 2023.

   A climatological normal year has been computed based on wind speed and Sea Surface Temperature (SST) data, calculating the mean value and smoothing the result with a moving average. A drop in wind speed has been observed in periods when the usual Trade winds are active over the eastern margin of the Atlantic ocean, decreasing from 13.8 m/s in early May, to only 3.0m/s in June, falling 5.8 m/s below the calculated average for that time of year. Associated with this decrease in wind intensity, there is a delayed increase in SST, reaching an average of 2.3 ºC above normal throughout the summer. Even after a subsequent increase in wind intensity, SST does not drop below normal values for the rest of the year. This relationship between a decrease in the wind intensity and an increase in the SST would suggest that the heat is being accumulated in the sea surface. We hypothesize that winds did not facilitate heat transfer from the sea surface in the form of sensible heat during a period when sensible heat is usually released from the ocean to the atmosphere.

   Under this scenario, with a lack of strong winds, mixing in the first layers of the water column is not effective, and the surface temperature measured from satellites is capturing a phenomenon that might mislead the deep-reaching extent of the anomaly. In ongoing analyses, we explore the impact on the water column affected by this abnormal increase in the sea surface temperature by using data provided by Argo floats profiling in the vicinity of the Canary Islands.

How to cite: Pereira, C., Aguiar-González, B., Carr, M., and Machín, F.: Wind-Speed Anomalies and SST Rise: Investigating the Mid-2023 Heatwave Propagation below the sea surface, EGU General Assembly 2024, Vienna, Austria, 14–19 Apr 2024, EGU24-13640, https://doi.org/10.5194/egusphere-egu24-13640, 2024.

EGU24-14475 | ECS | Orals | OS4.3

Detection and Prediction for Sudden High Swells Along the East Coast of Korea 

Youjung Oh and Il-Ju Moon

In recent several years, sudden high swell waves have often occurred on the east coast of the Korean Peninsula, especially in the winter season, which caused many casualties and property damage. These sudden swells have the characteristics of suddenly generating high waves even though the wind does not blow strongly, sweeping away unwary people on breakwaters or causing property damage such as ports and fish farms located on the coast. This study develops a detection and warning system for sudden high swells that frequently occur on the Korean Peninsula's east coast in winter. Using the calculated swell-wind wave height difference, significant wave height, and wind speed, we developed a sudden high swell warning system in three stages (Warning, Watch, and Attention). Analysis reveals that this system successfully detected three recent swell-related accidents on the east coast of Korea. Further experiments by applying the system to the prediction results of the wave model showed that the method successfully issued a warning 24 hours before a sudden high swell reached the east coast of the Korean peninsula. The developed system can provide quantitative and consistent forecast information, which will significantly contribute to preventing accidents caused by sudden high swells along the east coast of the Korean Peninsula. Lastly, we investigated the meteorological conditions that trigger sudden high swell based on reanalysis data and synoptic weather charts.


Acknowledgement: This research was supported by the Korea Meteorological Administration Research and Development Program under Grant (RS-2023-00239702)

How to cite: Oh, Y. and Moon, I.-J.: Detection and Prediction for Sudden High Swells Along the East Coast of Korea, EGU General Assembly 2024, Vienna, Austria, 14–19 Apr 2024, EGU24-14475, https://doi.org/10.5194/egusphere-egu24-14475, 2024.

EGU24-15362 | ECS | Posters on site | OS4.3 | Highlight

Coastal and regional marine heatwaves and cold spells in the northeastern Atlantic 

Amelie Simon, Coline Poppeschi, Sandra Plecha, Guillaume Charria, and Ana Russo

The latest Intergovernmental Panel on Climate Change (IPCC) report describes an increase in the number and intensity of marine heatwaves (MHWs) and a decrease in marine cold spells (MCSs) in the global ocean. How- ever, these reported changes are not uniform on a regional to local basis, and it remains unknown if coastal areas fol- low the open-ocean trends. Surface ocean temperature mea- surements collected by satellites (from 1982–2022) and 13 coastal buoys (from 1990–2022) are analyzed in the north- eastern Atlantic and three subregions: the English Channel, Bay of Brest and Bay of Biscay. The activity metric, com- bining the number of events, intensity, duration and spatial extent, is used to evaluate the magnitude of these extreme events. The results from in situ and satellite datasets for each of the studied regions are quite in agreement, although the satellite dataset underestimates the amplitude of activity for both MHWs and MCSs. This supports the applicability of the method to both in situ and satellite data, albeit with cau- tion on the amplitude of these events. Also, this localized study in European coastal northeastern Atlantic water high- lights that similar changes are being seen in coastal and open oceans regarding extreme events of temperature, with MHWs being more frequent and longer and extending over larger ar- eas, while the opposite is seen for MCSs. These trends can be explained by changes in both the mean of and variance in sea-surface temperature. In addition, the pace of evolu- tion and dynamics of marine extreme events differ among the subregions. Among the three studied subregions, the English Channel is the region experiencing the strongest increase in summer MHW activity over the last 4 decades. Summer MHWs were very active in the English Channel in 2022 due to long events, in the Bay of Biscay in 2018 due to intense events and in the Bay of Brest in 2017 due to a high occur- rence of events. Winter MCSs were the largest in 1987 and 1986 due to long and intense events in the English Channel. Finally, our findings suggest that at an interannual timescale, the positive North Atlantic Oscillation favors the generation of strong summer MHWs in the northeastern Atlantic, while low-pressure conditions over northern Europe and a high off the Iberian Peninsula in winter dominate for MCSs. A pre- liminary analysis of air–sea heat fluxes suggests that, in this region, reduced cloud coverage is a key parameter for the generation of summer MHWs, while strong winds and in- creased cloud coverage are important for the generation of winter MCSs.

How to cite: Simon, A., Poppeschi, C., Plecha, S., Charria, G., and Russo, A.: Coastal and regional marine heatwaves and cold spells in the northeastern Atlantic, EGU General Assembly 2024, Vienna, Austria, 14–19 Apr 2024, EGU24-15362, https://doi.org/10.5194/egusphere-egu24-15362, 2024.

Extreme sea levels can result in catastrophic flooding of coastal regions, endangering the lives of residents and destroying coastal infrastructure. Due to climate change they are becoming more frequent and therefore more dangerous. Extreme sea levels occur on different temporal and spatial scales, including sub-hourly scales, which we have only recently been able to assess due to the recent enhancement of the temporal resolution of the tide gauge measurements.

To quantify the contribution of sub-hourly sea level oscillations to positive sea level extremes, raw sea level data from 288 tide gauges along the European coasts, with a sampling resolution of less than 20 minutes, were obtained from: (1) the IOC-SLSMF website (263 stations); (2) National agencies (Portugal, Finland, Croatia – 24 stations). Large portions of the raw dataset had numerous data quality issues (i.e., spikes, shifts, drifts), thus quality control procedure was required. Out of range values and spikes were automatically removed, remaining data were visually examined, and spurious data were removed manually. After quality control, all data series were de-tided, and residuals were split into a low-frequency (T > 2 h) and a high-frequency (T < 2 h) component.

The five highest positive sea level extremes per year were extracted from the residual series and the high-frequency series. These were defined as residual extremes and high-frequency extremes, respectively. The contribution of the high-frequency sea level oscillations to the total sea level extremes along the European coasts was estimated. The contribution was shown to be significantly geographically and station-dependent, and it is important to take it into account when estimating flooding levels.

How to cite: Balić, M. and Šepić, J.: Contribution of high-frequency sea level oscillations to the sea level extremes along European coasts, EGU General Assembly 2024, Vienna, Austria, 14–19 Apr 2024, EGU24-16424, https://doi.org/10.5194/egusphere-egu24-16424, 2024.

EGU24-16470 | ECS | Posters on site | OS4.3

Change of Phaeocystis globosa ecology displayed by a 50-year time series (Dutch Wadden Sea) 

Léon Serre-Fredj, Anneke van den Oever, Evaline van Weerlee, Myron Peck, and Catharina J.M. Philippart

Phaeocystis globosa is a colony-forming microalgal species with a complex multiple morphotype life cycle that can produce Harmful algal bloom (HAB) inducing ecological and societal issues. In the Dutch Wadden Sea the P.globosa colony and solitary cell densities have been monitored since 1974 as a component of a long-term phytoplankton series. During these years this ecosystem has endured anthropic effects through eutrophication and climate change modifying the drivers of the phytoplankton communities. Along the phytoplankton series, numerous variables (e.g. temperature, chl a, nutrients) are measured to better describe the changes and the impacts of those changes. Generalized Additives Modelling (GAM) is used to describe the change of ecology of P.globosa along the time series and pinpoint which drivers. In the longest term, the analysis highlights a shift from a period of eutrophication with high densities of P.globosa followed by the treatment of water inducing a reduction of densities. Whereas in recent years marked by the rise of temperature, the densities seem to decrease slightly. Throughout the year insolation has increased and temperature while after the eutrophic period, phosphorus has been reduced. These three parameters are pinpointed as the main drivers controlling the densities of P.globosa. Temperature and phosphorus also control the occurrence of bloom. As the temperature pattern has changed the phenology of bloom has also been modified with earlier bloom. Since 1994 the proportion of the colony morphotype has also increased steadily modifying the ecology of the species. The time series allows demonstrating how extremes in condition are affecting and driving densities ecology and phenology of P.globosa with potential consequences on human activities and higher trophic levels.


How to cite: Serre-Fredj, L., van den Oever, A., van Weerlee, E., Peck, M., and Philippart, C. J. M.: Change of Phaeocystis globosa ecology displayed by a 50-year time series (Dutch Wadden Sea), EGU General Assembly 2024, Vienna, Austria, 14–19 Apr 2024, EGU24-16470, https://doi.org/10.5194/egusphere-egu24-16470, 2024.

EGU24-17233 | ECS | Posters on site | OS4.3

Evaluating the application of deep-learning ensemble sea level and storm surge forecasting in the Baltic Sea 

Amirhossein Barzandeh, Marko Rus, Matjaž Ličer, Ilja Maljutenko, Jüri Elken, Priidik Lagemaa, and Rivo Uiboupin

The sea level predictions, which are done with state-of-the-art hydrodynamic models, often suffer from various uncertainties which are related to errors in atmospheric and open boundary forcing fields as well as in physical flux parametrizations. The errors in atmospheric prediction, and regional extreme phenomena like storm surges are due to models' approximated descriptions of the physical environments (e.g coupling with waves, atmosphere, ice, runoff), but also due to the stochastic nature of weather prediction, which is often treated as a single deterministic forecast in many applications. Moreover, the submission of correct warning alerts is subject to conversion to local reference level. The application of data-driven AI models can offer a promising addition to the classic hydrodynamic models in addressing these challenges. In the present study the sea level deep-learning forecasting model HIDRA2, demonstrates promising capabilities for forecasting storm surges in numerous coastal stations across the eastern coast of the Baltic Sea. Our comprehensive assessment of HIDRA2's includes intercomparison with the sea level forecasts predicted with the regional configuration of the NEMO 4.0 hydrodynamics model. Moreover the probabilistic storm surge forecast from the ensemble sea level predictions allows us to identify and refine the best sub-set of ensembles for accurately predicting storm surges. This case study will play an important role in guiding decision-making processes regarding the integration of deep-learning methodologies into the operational phase of sea level prediction, particularly in the Baltic Sea region.

The EU funds this work under the agreement DE_330_MF between ECMWF and Météo-France. The on-demand capability proposed by the Météo-France led international partnership is a key component of the weather-induced extremes digital twin, which ECMWF will deliver through different phases of Destination Earth, launched by the European Commission.


How to cite: Barzandeh, A., Rus, M., Ličer, M., Maljutenko, I., Elken, J., Lagemaa, P., and Uiboupin, R.: Evaluating the application of deep-learning ensemble sea level and storm surge forecasting in the Baltic Sea, EGU General Assembly 2024, Vienna, Austria, 14–19 Apr 2024, EGU24-17233, https://doi.org/10.5194/egusphere-egu24-17233, 2024.

EGU24-18074 | ECS | Posters on site | OS4.3

Relative contributions to suspended sediment variability under extreme events (Gironde Estuary, France) 

Juliana Tavora, Roy El Hourany, Elisa Fernandes, Aldo Sotollichio, Suhyb Salama, and Daphne van der Wal

The frequency and intensity of extreme events associated with climate change are projected to increase continuously in the coming decades. Within these scenarios, the effects and ramifications of extreme events on coastal ecosystems are still poorly understood. In particular, the spatiotemporal footprint of extreme events is required to devise a strategy for better mitigation of impacts. Satellite data provide a unique spatial capability to address the effects of extreme events, for example, on Suspended Particulate Matter (SPM) in coastal waters. However, the low temporal resolution (e.g., associated with cloud disturbances) leads to small or insufficient samples to capture the dynamics of a given coastal system. On the other hand, although hydrodynamic sediment transport models provide continuous spatial-temporal estimates of SPM, refining their realistic flow of SPM importation or accurate sediment class distribution, especially capturing extreme events, remains challenging.

The new generation of statistical approaches comprising machine learning techniques is a valuable tool for comprehensive cube data time series of satellite remote sensing data with spatial and temporal gaps. Here, we propose a machine learning framework.  The framework allows not only filling spatial gaps in satellite imagery (compromised due to cloud disturbances) but also the estimation of the spatial estuarine domain affected by extreme events in river discharge and windbursts. Preliminary results also suggest that SPM dynamics is largely influenced by hydrodynamic forcings (river discharge, tides, winds), but depth can also play a significant role. Our study demonstrates that machine learning might be useful to synthesize coherent spatial and temporal distribution patterns of SPM variability, highlighting where extreme events most and least likely affect the estuarine system. The latter provides valuable insights for coastal management, such as prioritizing regions mosltly influence by extreme events for ecological monitoring and maintenance of critical habitats.

How to cite: Tavora, J., El Hourany, R., Fernandes, E., Sotollichio, A., Salama, S., and van der Wal, D.: Relative contributions to suspended sediment variability under extreme events (Gironde Estuary, France), EGU General Assembly 2024, Vienna, Austria, 14–19 Apr 2024, EGU24-18074, https://doi.org/10.5194/egusphere-egu24-18074, 2024.

EGU24-18075 | Orals | OS4.3

On the generation of a meteotsunami, the case study of supercell storm, over Adriatic Sea. 

Rossella Ferretti, Francesco Memmola, Alessandro Coluccelli, Maurizio Brocchini, Sara Corvaro, Pierluigi Penna, and Pierpaolo Falco

In the afternoon of July 22, 2023, a very intense thunderstorm developed over the central Po Valley. It  quickly cross the Adriatic sea traveling from the center of the Po Valley to the Croatian coast, moving in the direction northwest-southeast. The thunderstorm  speed ranged between 50 and 80km/h, with  a downdraft exceeding 100 km/h, wind gust up to 120 km/h, which led to the formation of intense hailstorms with hail larger than 8 cm. The pressure difference between the front and central regions of storm,  reaced  6 hPa, with peaks up to 10 hPa. As the supercell moved towards the coast, the combined effects of the downdraft and the pressure variation, along with the storm's speed, likely triggered a meteotsunami. Both amateur evidences and instrumental observations showed the propagation of a  wave along the Adriatic coast, from North to South, with an amplitude of about 40 cm and a period of approximately 20 minutes. This phenomenon was observed from Ravenna (where the stormcell moves from land to sea) to Ancona, San Benedetto del Tronto, and Ortona with a propagation speed comparable with the storm  speed thus, in good agreement with a possible Proudman resonance. Physical analysis and numerical simulations of the atmosphere and ocean were performed  using numerical models: WRF (Weather Research and Forecasting System), ICON (Icosahedral Numerical Model), and ROMS (Regional Oceanographic Modeling System), coupled with SWAN (Simulating Waves in Nearshore) at 1 km horizontal resolution. The atmospheric results accurately reproduced  the storm's structure and evolution. The coupled ROMS and SWAN model was performed to assess the individual impacts of the downdraft, the vertical component of the downdraft, the pressure surge, and the overall storm surge. This work presents the outcomes and key factors contributing to the generation and amplification of this phenomenon.


How to cite: Ferretti, R., Memmola, F., Coluccelli, A., Brocchini, M., Corvaro, S., Penna, P., and Falco, P.: On the generation of a meteotsunami, the case study of supercell storm, over Adriatic Sea., EGU General Assembly 2024, Vienna, Austria, 14–19 Apr 2024, EGU24-18075, https://doi.org/10.5194/egusphere-egu24-18075, 2024.

EGU24-18446 | ECS | Posters virtual | OS4.3

Forecasting Marine Environmental States Including Algal Blooms 

Raed Halawi Ghosn, Émilie Poisson-Caillault, and Alain Lefebvre

Coastal ecosystems are evolving with the increase of anthropogenic activities. Their dynamics involve various spatial and temporal scales, as well as complex benthic and pelagic interactions. Understanding these dynamics necessitates further knowledge of marine extreme, recurrent, and rare events, e.g., heat waves, Harmful Algal Blooms (HABs), storms, flood, etc.  Thus, the development of a forecasting system that alerts for algal blooms and other environmental states becomes imperative inorder to  mitigate their socio-economic and environmental influences.  In this research, we developed a semi-supervised machine learning approach to forecast marine environmental states, including algal blooms. Our approach is a multi-source, multi-frequency, and multi-parameter approach that involves in-situ, satellite and modeling data,  at low and high frequency. We apply the unsupervised M-SC (Multi-level Spectral Clustering) algorithm to cluster the data both spatially and temporally. Following that, we label these clusters to characterize the different environmental states, such as rare, extreme and recurrent events. Then, we apply a supervised machine learning algorithm such as Random Forest (RF) in order to forecast future environmental states, particularly algal blooms. This expert system will lead to better management strategies for marine ecosystems, and will help mitigate algal blooms.

How to cite: Halawi Ghosn, R., Poisson-Caillault, É., and Lefebvre, A.: Forecasting Marine Environmental States Including Algal Blooms, EGU General Assembly 2024, Vienna, Austria, 14–19 Apr 2024, EGU24-18446, https://doi.org/10.5194/egusphere-egu24-18446, 2024.

EGU24-19563 | Orals | OS4.3

Exploring how a warmer Mediterranean Sea affects the origin and development of destructive Tropical-Like Cyclones IANOS and DANIEL 

Gianluca Redaelli, Giovanni Liguori, Leone Cavicchia, Mario Marcello Miglietta, Davide Bonaldo, Sandro Carniel, Carlos Calvo-Sancho, Maria Luisa Martin, Juan Jesus Gonzalez-Aleman, Rossella Ferretti, and Antonio Ricchi

In a complex contest of climate change, we observe the evolution of extreme events that greatly challenge many areas of human life. Although the Mediterranean Sea is a relatively mild basin, it is however characterized by, occasionally intense cyclones with tropical-like characteristics known as Tropical-Like Cyclones (TLC). Many studies have highlighted that sea surface temperature (SST) distribution play a crucial role in modulating the intense air-sea exchange, hence controlling both development and evolution of TLCs. However, given the complex interplay among ocean mixed layer, heat content and temperature, the role of the mixed layer depth (MLD) and SST Anomaly is of paramount importance. In this study we investigated the role of both SST anomaly, horizontal gradients and MLD profile on the origin and evolution of a recent record-breaking TLC (named IANOS and DANIEL). IANOS and DANIEL are originated over the southern Ionian Sea. The first made landfall over Greece mainland coast and DANIEL made landfall over Libyan coasts. These TLCs developed over a basin where a positive SST anomaly up to 4 °C was detected, which coincided with the sea area where it reached the maximum intensification and strength. We conducted a series of experiments using an atmospheric model (WRF - Weather Research and Forecasting system) driven by underlying SST (standalone configuration), either with daily update or coupled to a simple mixed-layer ocean model (SLAB ocean), with SST calculated at every time step using the SLAB ocean for a given value of the MLD. Sensitivity tests were performed increasing or decreasing MLD depth by 10 m, 30 m, 50 m, 75 m, 100 m, removing the horizontal gradients, removing the SST anomaly. Then, possible past and future climatological scenarios of MLD thickness were identified and tested. Preliminary results show that the MLD influences not only the intensity of the cyclone but also the structure of the precipitation field both in terms of magnitude and location. The fundamental role of the SST anomaly was also found to be essential to provide intense characteristics to IANOS and DANIEL. Results deserve further investigation in the context of climate change scenarios that can provide useful insights into impact on coastal civil and economics in the whole Mediterranean region.

How to cite: Redaelli, G., Liguori, G., Cavicchia, L., Miglietta, M. M., Bonaldo, D., Carniel, S., Calvo-Sancho, C., Martin, M. L., Gonzalez-Aleman, J. J., Ferretti, R., and Ricchi, A.: Exploring how a warmer Mediterranean Sea affects the origin and development of destructive Tropical-Like Cyclones IANOS and DANIEL, EGU General Assembly 2024, Vienna, Austria, 14–19 Apr 2024, EGU24-19563, https://doi.org/10.5194/egusphere-egu24-19563, 2024.

EGU24-21250 | Posters on site | OS4.3

Marine heatwave inhibition of gelatinous zooplankton carbon flux into the deep ocean 

Matjaž Ličer, Črtomir Ernest Perharič Bailey, Martin Vodopivec, and Tinkara Tinta

Once gelatinous zooplankton (GZ) organisms die, they begin to sink. During the sinking process they decay, with decay rates strongly dependent on ambient ocean temperature - warmer temperatures accelerate mass decay rates in the upper water column during the presence of a marine heatwave, leading to reduced GZ carbon flux into the deep ocean. We leverage this temperature dependence of the decay rates to quantify marine heatwave (MHW) related inhibition of vertical GZ mass fluxes out of the euphotic zone (at 200 m depth). We use established methodologies for MHW detection and quantification to isolate some of the strongest MHW events in the northwest Mediterranean in the past 20 years, specifically June 2003, July 2006 and July 2019 events. We present a new Lagrangian tracking class CarbonDrift for the OpenDrift environment, which couples mass decay and organism sinking rates while allowing for horizontal advection during sinking. We use this Lagrangian model for vertical tracking of the sinking organisms and compute the fraction of the sinking organism mass reaching the bottom of the euphotic zone under i) climatological temperature field and ii) during the three mentioned MHWs. The difference between climatological and MHW simulations allows  quantification of the impact of MHW on the vertical carbon flux out of the euphotic zone. We show that during each of these marine heatwaves, carbon export out of the euphotic zone (at 200 m) decreases by 2 - 6 % in comparison to exports in climatological conditions. The accumulated effect of this inhibition proportionally diminishes Mediterranean's capacity to act as a deep ocean carbon sink.

How to cite: Ličer, M., Perharič Bailey, Č. E., Vodopivec, M., and Tinta, T.: Marine heatwave inhibition of gelatinous zooplankton carbon flux into the deep ocean, EGU General Assembly 2024, Vienna, Austria, 14–19 Apr 2024, EGU24-21250, https://doi.org/10.5194/egusphere-egu24-21250, 2024.

EGU24-21832 | Posters on site | OS4.3

Analysis and Development of Oceanographic Models:reaching the Swash Zone 

Francesco Memmola, Alessandro Coluccelli, Aniello Russo, and Maurizio Brocchini

The swash zone is the part of the beach where the final dissipation of the energy of the incident short waves usually occurs, while low-frequency wave energy is, generally, reflected back to sea. Swash zone flows are of fundamental importance not only because of their local effects but also because they  an affect the surf zone dynamics as a whole. Notwithstanding its importance, typical circulation models do not account for the swash zone dynamics and simplified boundary conditions are often used. This is achieved by calculating a mean shore line and provide along it shoreline boundary condition (SBCs) which take into account of the swash zone dynamics. We present a new SBCs which allowed us to reproduce a shoreline close to the one obtained by ROMSsl with a 0.1 m cross-shore resolution, but using a much coarser grid of 4 m.

How to cite: Memmola, F., Coluccelli, A., Russo, A., and Brocchini, M.: Analysis and Development of Oceanographic Models:reaching the Swash Zone, EGU General Assembly 2024, Vienna, Austria, 14–19 Apr 2024, EGU24-21832, https://doi.org/10.5194/egusphere-egu24-21832, 2024.

This study investigates the Rapid Intensification (RI) and Maximum Intensity (MI) of Hurricanes Wilma and Rita (2005), focusing on the impact of Sea Surface Temperature (SST), SST anomalies (SSTA), Ocean Heat Content (OHC) and the Ocean Mixed Layer Depth (OMLD). Utilizing numerical model simulations, the research aims to quantify the ocean's impact on tropical cyclone intensity, particularly under different OHC scenarios. Numerical simulations are performed using the Weather Research and Forecasting (WRF) model coupled with a simplified 1D Ocean Model. Simulations performed include a control with initialization consistent with observations, removing the SSTA, modulating the OMLD (doubling and halving), and modulating SST initialization fields at –3, –2, –1, +1, +2, +3 Celsius. Simulations successfully reproduce the RI phase and intensity trajectory of Hurricane Wilma and Rita, with the SSTA significantly impacting both intensity and track. Preliminary results (under ideal atmospheric conditions) indicate the SSTA produces an average 27% lower Central Sea Level Pressure (CSLP), a 30% difference in minimum CSLP, and a mean difference in maximum wind speed of approximately 6%. Additionally, SSTA enhances the deepening rate during the RI phase by about 47%, increases the total surface heat flux by approximately 19%, and produces a 10% increase in accumulated grid scale precipitation.  

How to cite: Wellmeyer, E. and Ferretti, R.: On the role of SST and Upper Ocean Thermal Structure on Rapid Intensification and Maximum Intensity in Tropical Cyclones. , EGU General Assembly 2024, Vienna, Austria, 14–19 Apr 2024, EGU24-22076, https://doi.org/10.5194/egusphere-egu24-22076, 2024.

The validation and error analysis of remote sensing data are important for their application. Currently, due to the relative scarcity of in-situ observations in the ocean, the accumulation of collocations between remote sensing and in-situ data is slow. This study proposes an engineering trick to address this issue: using the output of numerical models as a "bridge" to connect remote sensing data with in-situ data, thereby expanding the spatiotemporal window of collocation and improving collocation efficiency. The basic idea of this method is that numerical models based on differential equations can partially simulate the local spatiotemporal variations of the parameter near in-situ data. These variations can be used to compensate for the representation errors caused by the spatiotemporal differences between remote sensing and in-situ observations. Therefore, this method can enlarge the spatiotemporal window for collocation when the error limit is given. This collocation process considers the dynamic processes through numerical models and is thus named "dynamic collocation." This study demonstrates through several simple experiments that this dynamic method is superior to traditional "static" windows and has application potential. In addition to improving data collocation efficiency in the open ocean, dynamic collocation can also address the issue of the difficulty of direct comparison between satellite and buoy data in coastal areas due to significant spatial gradients in sea waves. Besides data comparison, dynamic collocation can provide a larger sample size for the model training of narrow swath sensors' empirical algorithms. For example, we applied this method to SWIM data from CFOSAT and proposed a high-precision empirical retrieval algorithm for wave mean periods.

How to cite: Jiang, H.: Dynamic collocation between satellite and in-situ measurements in wave remote sensing, EGU General Assembly 2024, Vienna, Austria, 14–19 Apr 2024, EGU24-3336, https://doi.org/10.5194/egusphere-egu24-3336, 2024.

EGU24-4534 | ECS | Posters on site | OS4.4

On the connection between eddy impingement east of Taiwan and Kuroshio intrusion into South China Sea 

Yu-Hao Tseng and Chung-Ru Ho

Using absolute dynamic topography and satellite altimeter eddy tracking data, the intrusion of the Kuroshio caused by the impingement of mesoscale cyclone eddies east of Taiwan into the northern South China Sea (NSCS) through the Luzon Strait was studied. Between 1993 and 2021, a total of 12 such cases were identified. Six of them occurred when the Kuroshio upstream (east of Luzon) strengthened and the Kuroshio downstream (east of Taiwan) weakened. A composite analysis of all cases shows that the average time from when a mesoscale cyclonic eddy impinges the Kuroshio east of Taiwan to when the NSCS reaches maximum negative vorticity is about 28 days. When the Kuroshio upstream strengthens and downstream weakens, the negative vorticity of the NSCS west of the Luzon Strait increases by 45% compared with normal conditions. The duration of the interaction between the Kuroshio and the mesoscale cyclonic eddy east of Taiwan is 28 days, compared with the normal 41 days.

How to cite: Tseng, Y.-H. and Ho, C.-R.: On the connection between eddy impingement east of Taiwan and Kuroshio intrusion into South China Sea, EGU General Assembly 2024, Vienna, Austria, 14–19 Apr 2024, EGU24-4534, https://doi.org/10.5194/egusphere-egu24-4534, 2024.

EGU24-4592 | Posters on site | OS4.4

Remote sensing linear trends of the Gulf Stream from 1993 to 2016 

Wenzhou Zhang, Fei Chai, Huijie Xue, and Leo Oey

The Gulf Stream (GS) transports a massive amount of heat northward to high latitudes and releases sensible and latent heat to the atmosphere, playing an important role in the North Atlantic and European climate change. The change trends of the GS transport and pathway are still uncertain to date. Our analyses of altimeter observations from 1993 to 2016 indicate that the linear trends in surface maximum speed, transport and latitudinal location of the GS are significant east of 61ºW at the 95% level while they are small and not significant between 72ºW and 61ºW. The weakening trend of the GS during the period from 1993 to 2016 is accompanied with a southward-shifting path, which is associated with the decline of the North Atlantic Oscillation (NAO) and possibly reduction in the Atlantic meridional overturning circulation (AMOC). 

How to cite: Zhang, W., Chai, F., Xue, H., and Oey, L.: Remote sensing linear trends of the Gulf Stream from 1993 to 2016, EGU General Assembly 2024, Vienna, Austria, 14–19 Apr 2024, EGU24-4592, https://doi.org/10.5194/egusphere-egu24-4592, 2024.

EGU24-4682 | Orals | OS4.4 | Highlight

Keeping the PACE with the NASA Plankton, Aerosol, Cloud, ocean Ecosystem (PACE) mission 

Ivona Cetinic and Jeremy Werdell

The PACE mission, scheduled to launch in Feb 2024, represents NASA’s next great investment in ocean biology, clouds, and aerosol data records to enable advanced insight into ocean and atmospheric responses to Earth’s changing climate. A key aspect of PACE is its inclusion of an advanced satellite radiometer known as the Ocean Color Instrument (OCI) to measure the “colors” of the ocean, land, and atmosphere. Whereas heritage instruments observe roughly six visible wavelengths from blue to red, OCI will collect a continuum of colors that span the visible rainbow from the ultraviolet to near infrared and beyond. In doing so, OCI will be the first of its kind to collect such “hyper”spectral radiometry on daily global scales, which will allow unique and highly advanced continuous identification of aquatic phytoplankton communities, as well as atmospheric aerosol, cloud, and terrestrial data products. PACE will also include two small multi-angle polarimeters that also measure “color”, but with additional capabilities to do so in multiple directions and with consideration of polarized light. Both polarimeters will substantially improve how we view our atmosphere and the interaction of airborne particles and clouds.  Overall, This PACE instrument suite will revolutionize studies of global biogeochemistry, carbon cycles, and hydrosols / aerosols in the ocean-atmosphere system.

How to cite: Cetinic, I. and Werdell, J.: Keeping the PACE with the NASA Plankton, Aerosol, Cloud, ocean Ecosystem (PACE) mission, EGU General Assembly 2024, Vienna, Austria, 14–19 Apr 2024, EGU24-4682, https://doi.org/10.5194/egusphere-egu24-4682, 2024.

In this study, low-cost software-defined GPS and SBAS Reflectometry (GPS&SBAS-R) systems have been built and proposed to measure ocean-surface wave parameters on board the research vessel New Ocean Researcher 1 (R/V NOR-1) and other ground-based coastal stations of Taiwan. A power-law ocean wave spectrum model has been used and applied with the Small Perturbation Method (SPM) approach to solve the electromagnetic wave scattering problem from rough ocean surface and compare with experimental seaborne GPS&SBAS-R observations. Meanwhile, the intensity scintillations of high-sampling GPS&SBAS-R signal acquisition data are thought to be caused by the moving rough surfaces of the targeted oceans. We found that each derived scintillation power spectrum is a Fresnel filtering result on sea/ocean-surface elevation fluctuations and depends on the First Fresnel Zone (FFZ) value and the ocean-surface wave velocity. The determined ocean-surface wave parameters, e.g. wave velocity and spectral index, have been compared and validated against nearby buoy measurements.

How to cite: Tsai, L.-C., Hwa, C., Su, S.-Y., and Lv, J.-X.: Ocean-surface wave measurements using scintillation theories on seaborne and coastal software-defined GPS and SBAS reflectometry observations, EGU General Assembly 2024, Vienna, Austria, 14–19 Apr 2024, EGU24-5059, https://doi.org/10.5194/egusphere-egu24-5059, 2024.

EGU24-5859 | Orals | OS4.4

Benefits of fully focused SAR altimetry to coastal wave height estimates: A case study in the North Sea 

Marcello Passaro, Florian Schlembach, Frithjof Ehlers, Marcel Kleinherenbrink, Denise Dettmering, Florian Seitz, and Cornelis Slobbe

Estimating the three geophysical variables significant wave height (SWH), sea surface 
height, and wind speed from satellite altimetry continues to be challenging in the 
coastal zone because the received radar echoes exhibit significant interference from 
strongly reflective targets such as mud banks, sheltered bays, ships etc. Fully focused 
SAR (FF-SAR) processing exhibits a theoretical along-track resolution of up to less 
than half a metre. This suggests that the application of FF-SAR altimetry might give 
potential gains over unfocused SAR (UF-SAR) altimetry to resolve and mitigate smallscale 
interferers in the along-track direction to improve the accuracy and precision of 
the geophysical estimates. 

The objective of this study is to assess the applicability of FF-SAR-processed Sentinel- 
6 Michael Freilich (S6-MF) coastal altimetry data to obtain SWH estimates as close as 
possible to the coast. 
We have developed a multi-mission FF-SAR processor and applied the coastal 
retracking algorithm CORALv2 to estimate SWH. We assess different FF-SAR and UFSAR 
processing configurations, as well as the baseline Level-2 product from 
EUMETSAT, by comparison with the coastal, high-resolution SWAN-Kuststrook wave 
model from the Deltares RWsOS North Sea operational forecasting system. This 
includes the evaluation of the correlation, the median offset, and the percentage of 
cycles with high correlation as a function of distance to the nearest coastline. 
Moreover, we analyse the number of valid records and the L2 noise of the records. The 
case study comprises five coastal crossings of S6-MF that are located along the Dutch 
coast and the German coast along the East Frisian Islands in the North Sea. 

We find that the FF-SAR-processed dataset with a Level-1b posting rate of 140 Hz 
shows the greatest similarity with the wave model. We achieve a correlation of ~0.8 at 
80% of valid records and a gain in precision of up to 29% of FF-SAR vs UF-SAR for 1- 
3 km from the coast. FF-SAR shows, for all cycles, a high correlation of greater than or 
equal to 0.8 for 1-3 km from the coast. We estimate the decay of SWH from offshore at 
30 km to up to 1 km from the coast to amount to 26.4%+-3.1%. 

How to cite: Passaro, M., Schlembach, F., Ehlers, F., Kleinherenbrink, M., Dettmering, D., Seitz, F., and Slobbe, C.: Benefits of fully focused SAR altimetry to coastal wave height estimates: A case study in the North Sea, EGU General Assembly 2024, Vienna, Austria, 14–19 Apr 2024, EGU24-5859, https://doi.org/10.5194/egusphere-egu24-5859, 2024.

EGU24-6770 | Posters on site | OS4.4

Importance of ocean observations to the ECCC global ocean analysis system, GIOPS 

K Andrew Peterson, Gregory C Smith, Dorina Surcel-Colan, Kamel Chikhar, and Brayden Zheng

The Synergistic Observing Network for Ocean Prediction (SynObs) project (https://oceanpredict.org/synobs) seeks to find synergies between ocean observations and ocean prediction through a multi-system approach to an Observing System Experiment (OSE). Best estimates and predictions for locations of eddies, shape of ocean sound speed profiles, ocean currents, sea surface temperature and ocean water masses are important ocean diagnostics for a variety of ocean and/or coupled NWP applications. Skillful estimates of these diagnostics is presumably determined by the quantity and quality of ocean observations used in the ocean state estimation, but the exact value of the observations, and in particular, which observations are most crucial is unknown. 

In the context of the SynObs project, Environment and Climate Change Canada's (ECCC's) system the Global Ice Ocean Prediction System (GIOPS) has performed several observation withholding experiments.  The importance of each withholding experiment will be studied by looking first at our standard innovation metrics of observation minus model misfits in the context of both assimilated observations and withheld profile observations.    Further analysis against novel observation metrics, such as an eddy tracking diagnostic comparison, drifting buoy current velocity measurements and sound profile (from T/S profile) comparisons will be detailed.  Finally, preliminary results from a set of short lead (10d) coupled forecast runs may also be presented.  

How to cite: Peterson, K. A., Smith, G. C., Surcel-Colan, D., Chikhar, K., and Zheng, B.: Importance of ocean observations to the ECCC global ocean analysis system, GIOPS, EGU General Assembly 2024, Vienna, Austria, 14–19 Apr 2024, EGU24-6770, https://doi.org/10.5194/egusphere-egu24-6770, 2024.

EGU24-8952 | ECS | Posters on site | OS4.4

Assessing the Impact of Wave Age on GNSS-R L1 products and L2 Wind Speed Inversion 

Mingyi Chen, Yufu Liou, Kanghung Yang, and Hwa Chien

    This study delves into the impact of wave age on GNSS-R L1 observations, with a specific emphasis on Delay-Doppler Map (DDM) and Normalized Bistatic Radar Cross Section (NBRCS) signal strength, as well as its consequent effects on L2 wind speed inversion. Conventionally, DDMs have been simplified in wind speed inversion algorithms to solely represent sea surface roughness influenced by wind speed. However, this research underscores the significant, yet often overlooked, role of sea surface roughness induced by wave characteristics in the reflection of microwave signals. Wave age, denoting the delay of waves under wind influence and the proportion of swell to wind waves, is identified as a crucial factor affecting sea surface roughness and, thereby, the scattering properties of ocean surface signals.

    Recognizing the intricate physical correlation between wave age and sea surface wind speed, along with the multi-variable dependency inherent in GNSS-R observation theory, the study employed machine learning techniques to assess the extent of wave age's influence throughout the observation to wind speed inversion process. For this purpose, the Resnet18 deep convolutional neural network was chosen for its adept handling of the complex features present in DDM data, which can be considered as images. This choice was anchored in Resnet18’s robust feature extraction abilities and its proven track record in tasks requiring high-accuracy image classification.

    This study utilized CyGNSS L1 data along with corresponding ECMWF wind speed and sea surface parameter data for specific time and location. To conduct a comparative analysis, two methodologies were used: a traditional geophysical model function (GMF) developed by our self and machine learning. Preliminary testing indicated a marked enhancement in the accuracy of wind speed predictions when incorporating wave age into both GMF and machine learning approaches. The root mean square error notably decreased from approximately 1.8-2 meters per second to about 1.1 meters per second. The study also found a link between wave age and NBRCS intensity distribution, noting that larger inverse wave ages correlate with more signal scattering and weaker signal strength, underlining the vital impact of wave age on NBRCS intensity distribution.

How to cite: Chen, M., Liou, Y., Yang, K., and Chien, H.: Assessing the Impact of Wave Age on GNSS-R L1 products and L2 Wind Speed Inversion, EGU General Assembly 2024, Vienna, Austria, 14–19 Apr 2024, EGU24-8952, https://doi.org/10.5194/egusphere-egu24-8952, 2024.

EGU24-9426 | Orals | OS4.4

Variability and trends in subtropical gyres derived from 25-year satellite chlorophyll-a observations 

Chiara Volta, Salvatore Marullo, and Sandro Calmanti

Previous studies, based on satellite observations, suggested that global warming caused all subtropical gyres to expand over time (Polovina et al., 2008; Leonelli et al., 2022). This raised major concerns about the potential increase in ocean desertification and its impact on the Earth’s climate system. Here, the longest satellite chlorophyll-a (chl-a) concentration dataset currently available is used to analyze the evolution of the most oligotrophic areas in the five major subtropical gyres on Earth at a fine spatial-temporal resolution over 25 years (January 1998 - December 2022). These gyres include the North and South Atlantic SubTropical Gyres (NASTG and SASTG, respectively), the North and South Pacific SubTropical Gyres (NPSTG and SPSTG, respectively), and the Indian Ocean SubTropical Gyre (IOSTG). Different thresholds of chlorophyll-a concentrations are used to defined three subregions within each gyre: the oligotrophic area, whose chl-a is less than or equal to 0.1 mg m-3, and the ultra- and hyper- oligotrophic areas where chl-a does not exceed 0.07 and 0.04 mg m-3, respectively. Our results indicate that ultraoligotrophic conditions prevail in all five systems, and that oligotrophic and ultraoligotrophic zones in all gyres combined have reduced and expanded, respectively, at the same rate (0.3%/yr) since 1998, while the hyperoligotrophic area has increased globally at an annual rate of 3.4%. Results also reveal that the most affected gyres are the NASTG, the NPSTG and the IOSTG, where the hyperoligotrophic subregions have expanded at an annual rate of 17.8, 22.8 and 8.6%, respectively, and their combined area in 2022 was about 5 times larger than it was in 1998. No statistically significant (p>0.05) trends were detected in the SASTG and SPSTG, although an increasing tendency in their hyperoligotrophic subregions is observed. Altogether, the results suggest that, despite no significant variation in the overall size of subtropical gyres being observed in 25 years, their hyperoligotrophic cores are expanding and would lead to reduced productivity in these systems.


Polovina, J.J., Howell, E.A., and Abecassis, M. (2008). Ocean’s least productive waters are expanding. Geophysical Research Letters, 25, L03618, doi:10.1029/2007GL031745

Leonelli, F.E., Bellacicco, M., Pitarch, J., Organielli, E., Buongiorno Nardelli, B., de Toma, V., Cammarota, C., Marullo, S., and Santoleri, R. (2022). Ultra-oligotrophic Waters Expansion in the North Atlantic Subtropical Gyre Revealed by 21 Years of Satellite Observations. Geophysical Research Letters, 49, e2021GL096965, doi:10.1029/2021GL096965

How to cite: Volta, C., Marullo, S., and Calmanti, S.: Variability and trends in subtropical gyres derived from 25-year satellite chlorophyll-a observations, EGU General Assembly 2024, Vienna, Austria, 14–19 Apr 2024, EGU24-9426, https://doi.org/10.5194/egusphere-egu24-9426, 2024.

EGU24-10674 | ECS | Posters on site | OS4.4

Effect of Coral Reefs on Wave Height 

Mariia Usoltseva, Marcello Passaro, and Denise Dettmering

Coral reefs, among other benefits, provide natural protection from waves for coastal communities. In the context of climate change and its role in the degradation of coral reefs and the intensification of extreme weather events, there has been a growing interest in understanding the sheltering properties of coral reefs. Despite this interest, there remains a lack of comprehensive studies that systematically assess wave behaviour on coral reefs using remote sensing techniques.

This study utilized along-track altimetry observations from the European Space Agency's Sea State Climate Change Initiative (CCI) v3 L3 dataset, complemented by ERA5 data, to examine the influence of coral reefs on wave height. Changes in significant wave height (SWH) on coral reefs, derived from the multi-mission altimetry dataset, are compared with those computed from ERA5 reanalysis in its gridded format and interpolated on satellite tracks. The assessment is conducted on a global and regional scale, considering different offshore sea states. Additionally, the study explores the influence of the structural complexity of coral reefs on their capacity to attenuate waves. This is achieved through a regional analysis of altimetry measurements in years with a high percentage of hard coral cover and years after destructive storms.

The results demonstrate a high degree of agreement between SWH attenuation computed from the satellite altimetry dataset and ERA5 interpolated on the satellite tracks, yielding a correlation coefficient of 0.724. Additionally, this study contributes to the expanding body of knowledge regarding the influence of coral reefs on wave height. Despite the pronounced variability contingent upon the state of coral reefs and the local wave climate, about 80% of observations show a reduction in wave height as waves traverse coral reefs. Statistical evaluation reveals an increase in the reduction of wave height with an increase in offshore wave conditions, as evident in the analysis of all three datasets. Furthermore, case studies on extreme events show a regional decrease in wave attenuation on coral reefs with reduced hard coral cover. The study highlights the potential of satellite altimetry in the observation of wave height changes across coral reefs, as well as the ability of coral reefs to attenuate waves and mitigate the destructive potential of storms, thereby contributing to coastal protection and resilience.

How to cite: Usoltseva, M., Passaro, M., and Dettmering, D.: Effect of Coral Reefs on Wave Height, EGU General Assembly 2024, Vienna, Austria, 14–19 Apr 2024, EGU24-10674, https://doi.org/10.5194/egusphere-egu24-10674, 2024.

EGU24-11240 | Posters on site | OS4.4

Recent advances from the ESA CCI+Sea Surface Salinity project 

Jacqueline Boutin and Cloivs Thouvenin-Masson and the CCI+SSS consortium

Sea Surface Salinity (SSS) is an increasingly-used Essential Ocean and Climate Variable. The SMOS, Aquarius, and SMAP satellite missions all provide SSS measurements, with very different instrumental features leading to specific measurement characteristics. The Climate Change Initiative Salinity project (CCI+SSS) aims to produce a SSS Climate Data Record (CDR) that addresses well-established user needs based on those satellite measurements. To generate a homogeneous CDR, instrumental differences are carefully adjusted based on in-depth analysis of the measurements themselves, together with some limited use of independent reference data [Boutin et al., 2021]. An optimal interpolation in the time domain without temporal relaxation to reference data or spatial smoothing is applied. This allows preserving the original datasets variability. SSS CCI fields are well-suited for monitoring weekly to interannual signals, at spatial scales ranging from 50 km to the basin scale.

In this poster, we review recent advances of the CCI+SSS phase 2 project and the performances of the last (version 4) CCI+SSS product which covers the 2010-2022 period.

With respect to global CCI+SSS v3 dataset, CCI+SSS v4 dataset includes the following updates. According to several users recommendations, global fields are now on a rectangular 0.25°grid, and polar fields on EASE polar grid are also delivered. The ice filtering has been refined (it was too strong in CCI v3). A correction for contamination by radio frequency interferences has been developed and applied around Samoa island, Barbados island and in the Gulf of Guinea. Latitudinal-seasonal corrections have been applied on SMOS, Aquarius and SMAP SSS. SSS changes related to SMOS direct models updates (wind, dielectric constant, rain) have also been taken into account. This leads to significant improvements at high latitudes, allowing to monitor the interannual SSS variability in the Barents Sea, or the spatio-temporal evolution of a fresh event west of Greenland in Fall 2021. In the tropics, we show that the RFI contamination correction allows to restore the interannual SSS variability related to ENSO which was completely masked by RFI contamination around the island of Samoa. We also illustrate how the CCI+SSS fields have been used to assess model results, at global scale with or without data assimilation (GLORYS model), and in the Amazone plume (NEMO-PISCES biogeochemical model).

References

Boutin, J., et al. (2021), Satellite-Based Sea Surface Salinity Designed for Ocean and Climate Studies, Journal of Geophysical Research: Oceans, 126(11), e2021JC017676, doi:https://doi.org/10.1029/2021JC017676.

Gévaudan et al. (2022). Influence of the Amazon-Orinoco discharge interannual variability on the western tropical Atlantic salinity and temperature. Journal of Geophysical Research: Oceans, 127, e2022JC018495. https://doi.org/10.1029/2022JC018495

How to cite: Boutin, J. and Thouvenin-Masson, C. and the CCI+SSS consortium: Recent advances from the ESA CCI+Sea Surface Salinity project, EGU General Assembly 2024, Vienna, Austria, 14–19 Apr 2024, EGU24-11240, https://doi.org/10.5194/egusphere-egu24-11240, 2024.

EGU24-12124 | Orals | OS4.4

Sea Surface Temperature Retrievals in Heavy Precipitation From AMSR-2 Microwave Measurements 

Zorana Jelenak, Paul Chang, and Suleiman Alsweiss

The first satellite microwave sea surface temperature (MSST) estimates were provided from TRMM Microwave Imager radiometer on board of Tropical Rainfall Microwave Mission in 1997. Since then the MSST became on of one of most sought after parameters for new microwave missions in both operational and research communities. In that respect the WindSat, AMSR-E, ASMR-2 and GMI instruments all empployed either C- or X-band channels or both in order to provide the SST measurements. While the resolution of MSST is relativly course due to utilization of the low frequency channels, the main advantage of the MSST is in its ability to fill the gap in observations in cloud covered regions. While However the SST coverage is still spars heavy clouds and precipitation areas.

To maximaze utility of MSST for operations we investigated different combinations of microwave brighntess temperatures that minimize precipitation effect on measurements and maximaze its sensitivity to SST. Guided by this goal we developed a statistically based algorithm that relies on three empirical quantities utilizing linear combinations of 6, 10 and 18GHz vertically and horizontally polirized channels. This approach allowed us to come up with the unique, first of a kind MSST product from AMSR-2 microwave ocean observations that provides SST estimates even in the heavy precipitation areas such as one observed within Tropical Cyclones. Utilization of higher frequency channels had an added advantage of increasing the the MSST resolution relative to products that utilized only 6 or 10GHz measurements. Another added advantage was substantially minimized sun glint areas that were traditionally excluded from measurements swaths and resulted in substantially reduced coverage in the southern hempisphere.

The measurement technique, validation results and data availability will be discussed and presented.

How to cite: Jelenak, Z., Chang, P., and Alsweiss, S.: Sea Surface Temperature Retrievals in Heavy Precipitation From AMSR-2 Microwave Measurements, EGU General Assembly 2024, Vienna, Austria, 14–19 Apr 2024, EGU24-12124, https://doi.org/10.5194/egusphere-egu24-12124, 2024.

EGU24-13356 | ECS | Posters virtual | OS4.4

 Inconsistencies in Ocean Temperature Monitoring for Coral Reef Applications 

Vanessa Hui Fen Neo, Joseph Mbui Maina, Jens Zinke, Thomas Fung, Chris Merchant, Kyle Zawada, and Hedwig Krawczyk


Coral reefs are extremely vulnerable to climate-driven warming of the ocean, which threatenstheir survival. Coral responses to rising temperatures are currently studied and predictedusing sea surface temperature (SST) from multiple sources. Despite the importance ofharmonizing complementary data from different sources, there is no clear understanding ofthe consistency or lack of it among the main datasets used and the predictions made usingthem. Understanding the consistency among the different SST data applied to coral reefsmay facilitate monitoring and understanding global warming's impact on coral reefs. Fourtypes of SST data across North-Western and South-Western Australia are compared toassess their differences and ability to predict historical coral bleaching events. Four decadesof coral bleaching indicators, Degree Heating Week (DHW) and Degree Heating Month (DHM)were calculated based on satellite-derived SST, global climate models (GCM), and coral corederived proxies. Both DHW and DHM were inconsistent among datasets and did notaccurately predict moderate and severe bleaching events. Despite high DHWs and DHMs,some reefs did not experience bleaching, suggesting site-specific coral adaptation. SST datafrom different sources had better consistency for frequency and were consistent with coralcore derived proxies of SST, highlighting the importance of coral cores in understanding pastthermal stress. By exploring the differences and similarities among data sources, this studyhighlights the need to compare thermal stress indicators from different datasets for a betterunderstanding and a more robust prediction of coral response to thermal stress.

How to cite: Neo, V. H. F., Maina, J. M., Zinke, J., Fung, T., Merchant, C., Zawada, K., and Krawczyk, H.:  Inconsistencies in Ocean Temperature Monitoring for Coral Reef Applications, EGU General Assembly 2024, Vienna, Austria, 14–19 Apr 2024, EGU24-13356, https://doi.org/10.5194/egusphere-egu24-13356, 2024.

EGU24-13362 | ECS | Posters virtual | OS4.4

Exploring Oceanographic Frontiers: Insights from Animal Telemetry Data of four Captive-Born Loggerhead Sea Turtles released in the Macaronesia 

F. Lihue Ferro, Olaia Laguéns-Expósito, Borja Aguiar-González, Nuria Varo-Cruz, Ana Liria-Loza, Alejandro Usategui-Martín, and Francisco Manchín

A pioneering exploration into oceanographic phenomena in Macaronesia and the west North Atlantic Ocean is presented utilizing animal telemetry data collected from four captive-born Loggerhead sea turtles. Noting the cosmopolitan nature and migratory behaviors of sea turtles, this analysis assesses the potential of sea turtles to offer valuable insights into oceanic environmental variables. 


The turtles' interactions with upwelling sites, eddies, and ocean currents are revealed through the integration of georeferenced data (location and time) and oceanographic products from the Marine Copernicus Service. The oceanographic data were interpolated to the turtles’ location in time to obtain remotely-sensed Sea Surface Temperature (SST), chlorophyll-a (chl-a) concentrations and altimeter-derived ocean currents along the routes they performed. 


The results showcase the versatility of these animals as ocean gliders if they were instrumented with temperature and chl-a sensors, providing valuable measurements mostly about the atmosphere-ocean interaction, given their known diving behavior usually ranges from the surface down to 200 m. One of the turtles stayed for over two years near Banc d’Arguin. The simulation of its performance (if it were instrumented with oceanographic sensors) resembled that of a mooring in a key region of high productivity, capturing the seasonal cycle of SST and the chl-a bloom. A second turtle crossed the North Atlantic Subtropical Gyre as if it were an ocean glider leaving the Canary Islands and reaching the Gulf Stream in about 4 months. The path followed by this turtle reveals likely corridors used by sea turtles in cross-basin migrations which would be of high interest to be used for long-term and recurrent monitoring of the upper open ocean interior. Lastly, the third and fourth turtle navigated along the shelf of the Northwest African upwelling area, demonstrating their capability to sample not only open ocean but also coastal areas; the latter being particularly important given the relevance of counting with in situ SST measurements for validation of satellite data. 


Jointly, the four turtles of study and their associated navigational routes encourage further study of the potential of instrumenting Loggerhead sea turtles in Macaronesia as a complementary tool to more traditional approaches for measuring environmental variables.

How to cite: Ferro, F. L., Laguéns-Expósito, O., Aguiar-González, B., Varo-Cruz, N., Liria-Loza, A., Usategui-Martín, A., and Manchín, F.: Exploring Oceanographic Frontiers: Insights from Animal Telemetry Data of four Captive-Born Loggerhead Sea Turtles released in the Macaronesia, EGU General Assembly 2024, Vienna, Austria, 14–19 Apr 2024, EGU24-13362, https://doi.org/10.5194/egusphere-egu24-13362, 2024.

EGU24-15081 | ECS | Posters on site | OS4.4

Exploring Environmental Impacts on High Frequency Radar Signal Variability in Taiwan's Northern Coastal Waters 

An Cheng, Huan Meng Chang, Hwa Chien, and Hsin Yu Yu

    This study focuses on the spatiotemporal analysis of High Frequency Radar (HFR) signal intensity under various environmental conditions, utilizing data from four LERA MKIII systems along the northern coast of Taiwan. This investigation spans from 2023 to 2024. The radar systems are strategically positioned at different locations: Shalun station operates at 24.4 MHz with a boresight angle of 0 degrees, Beigang station at 26.77 MHz with a boresight of 345 degrees, Chaojing station at 27.75 MHz with a boresight of 0 degrees, and Zhongjiao Bay station at 31.75 MHz with a boresight of 55 degrees. The coordinates for these stations are respectively 121.24°E, 25.11°N (Shalun); 121.16°E, 25.08°N (Beigang); 121.80°E, 25.14°N (Chaojing); and 121.63°E, 25.24°N (Zhongjiao Bay). Each HFR system consists of a linear array of 16 receiving antennas and utilizes the beamforming method to process signals within a boresight angle range of ±60 degrees.
    This study's methodology employs time series analysis techniques to scrutinize High Frequency Radar (HFR) data, correlating it with various environmental observations. By charting the Signal-to-Noise Ratio (SNR) of the radar signals across different range cells along the radar's boresight azimuth over time, we identify temporal and spatial trends. Notably, periodic fluctuations in the radar signal time series have been observed. These fluctuations seem intricately linked to tidal cycles, exhibiting a significant correlation with the angular disparity between tidal flow direction and the radar's boresight azimuth. Additionally, a decrease in radar signal strength coupled with an increase in noise levels was noticed under conditions of elevated winds and waves. The research aims to precisely quantify the interplay between radar signals and the collective influence of tides, waves, and wind speeds. This thorough analysis seeks to deepen our understanding of how environmental elements impact radar performance, thereby contributing to a more nuanced comprehension of coastal ocean dynamics.

How to cite: Cheng, A., Chang, H. M., Chien, H., and Yu, H. Y.: Exploring Environmental Impacts on High Frequency Radar Signal Variability in Taiwan's Northern Coastal Waters, EGU General Assembly 2024, Vienna, Austria, 14–19 Apr 2024, EGU24-15081, https://doi.org/10.5194/egusphere-egu24-15081, 2024.

EGU24-15346 | ECS | Posters on site | OS4.4

New ocean color algorithms for estimating the concentration of particulate organic nitrogen from remote sensing in oceanic surface waters 

Alain Fumenia, Hubert Loisel, Daniel Jorge, Marine Bretagnon, Julien Demaria, and Antoine Mangin

The concentration of particulate organic nitrogen (PON) in seawater plays a central role in ocean biogeochemistry. Limited availability of PON data obtained directly from in situ sampling methods hinders our ability to better characterize the spatio-temporal variability of PON within the global ocean. Tight relationships have recently been developed between in situ measurements of seawater inherent optical properties (IOPs) and PON. Knowing that IOPs can now be estimated from ocean color remote-sensing, these relationships could then be used to assess PON from semi-analytical algorithms applied to satellite ocean color observations. The present study aims at evaluating which IOPs, as estimated from space, can be used as the best proxy for the remote sensing retrieval of PON. The different considered IOPs are the absorption coefficients of total particulate matter, ap(λ), phytoplankton, aph(λ), and non-algal particles, ad(λ), as well as the particulate backscattering coefficient, bbp(l). IOPs have been derived from satellite ocean remote-sensing reflectance, Rrs(l), using different available inverse methods. The validation of the algorithms is based on matchup between an extensive dataset of 156 concurrent measurements of in situ PON and satellite-derived particulate IOPs. Our results show that reasonably strong PON vs satellite-derived IOPs relationships hold across a range of diverse oceanic and coastal environments. aph(443) shows the best ability to serve as a PON proxy over a broad range of PON from open ocean oligotrophic to coastal waters (MdAPD of 25.39 %). bbp(555) can also be considered as a good proxy of PON in open ocean environments (MdAPD of 22.03 %). Comparison with in situ time series over ten years shows also the good performance of the algorithm to reproduce the seasonal variation of PON. The application of this algorithm to Moderate-Resolution Imaging Spectroradiometer (MODIS; 2002-present) observations provides global PON distributions pattern which agree with in situ PON expected geographical distribution. High PON concentrations are observed in turbid shelf and coastal regions as well as in upwelling areas; while low PON are observed in oligotrophic regions. The presented relationships demonstrate a promising means to assess long-term trends and/or budget of PON in specific areas of the ocean or at the global oceanic scale.

How to cite: Fumenia, A., Loisel, H., Jorge, D., Bretagnon, M., Demaria, J., and Mangin, A.: New ocean color algorithms for estimating the concentration of particulate organic nitrogen from remote sensing in oceanic surface waters, EGU General Assembly 2024, Vienna, Austria, 14–19 Apr 2024, EGU24-15346, https://doi.org/10.5194/egusphere-egu24-15346, 2024.

EGU24-16367 | ECS | Posters on site | OS4.4

Simulation of the wave-current interaction effect on the SAR-derived radial velocity 

Anis Elyouncha, Adrien Martin, and Christine Gommenginger

Synthetic aperture radar (SAR) offers the possibility to observe the sea surface current with very high spatial resolution thanks to techniques such as Doppler centroid analysis and Along-Track Interferometry. These observations are relevant in coastal areas and shelf seas. SAR has been routinely providing valuable information on sea surface winds and waves for decades. However, the Doppler signature of the surface (aka Wind-wave Artefact Surface Velocity - WASV) is strongly affected by the waves and needs to be corrected accurately. In this study, we assess how strongly and how far convergent and divergent current fields impact the wave fields, hence the WASV. This is a numerical study, combining a numerical wave model (Simulating WAves Nearshore - SWAN) with a semi-empirical wave Doppler electromagnetic simulator (Yurovsky et al., 2019 - KaDOP).

In this study, the simulation of the effect of the wave-current interaction on the significant wave height is carried out using the SWAN model. Simulations are carried out for two different wind speeds 5 m/s and 10 m/s to represent different wave height regimes and two current profiles, convergent and divergent. The domain grid is one dimensional from x=0 to x=200 km with a spacing of 1 km. The depth is set to a constant value of 1000 m. The direction of propagation of the waves is perpendicular to the current front. Two scenarios are simulated waves propagating along the current and waves propagating against the current. The wind is set uniform over the whole fetch. The Doppler model KaDOP is used to estimate wave Doppler velocity (UD). This model takes as inputs the incidence angle, wind speed, relative wind direction, significant wave height (Hs) and peak radial frequency (Ωp) for wind sea and swell. The latter two quantities are affected by the wave-current interaction which affects the estimated wave Doppler. 

In summary, a combination of two different front widths (1 km and 3 km) and two wind speeds (5 m/s and 10 m/s) resulted in eight simulations. First,  it is shown that the spectral density increases (decreases) due to the convergent (divergent) current. The modulation is more important at the intermediate waves between the peak and around 0.6 Hz while it is negligible at the lowest and highest frequencies. As expected, the variation magnitude of Hs and UD increases with increasing magnitude of the current divergence and wind speed. It is also noted that the convergent current, when the waves propagate in a direction opposing the current, yields larger variations ∆Hs and ∆UD. Only in cases when the current front is 1 km wide, i.e. the divergence ≈ 0.19 10−3, ∆UD exceeds 0.1 m/s, but this limit is only exceeded locally (over a few pixels). 

How to cite: Elyouncha, A., Martin, A., and Gommenginger, C.: Simulation of the wave-current interaction effect on the SAR-derived radial velocity, EGU General Assembly 2024, Vienna, Austria, 14–19 Apr 2024, EGU24-16367, https://doi.org/10.5194/egusphere-egu24-16367, 2024.

EGU24-16471 | Posters on site | OS4.4

High spatial resolution Sea Surface Temperature data for the study of Marine Heat Waves in the souther North Sea 

Aida Alvera-Azcárate, Bayoumi Mohamed, Aleander Barth, Joppe Massant, and Dimitry Van der Zande

Marine Heat Waves (MHWs) are defined as discrete periods of anomalously warm water temperature at a given location. MHWs can have a huge impact on marine ecosystems, already under stress because of the effects of a warming ocean under climate change and high anthropogenic pressure. This work will assess the spatio-temporal evolution of MHWs in the southern North Sea, with an emphasis on the 2022 events. Studying the impact of MHWs on coastal marine ecosystems is currently hampered by the resolution mismatch between traditional satellite data (typically 1 km spatial resolution for SST and CHL) and species habitat/substrate. In the southern North Sea, a multitude of shallow sandbanks, sand, mud and coarser sediment substrats are for instance present, offering a multitude of habitats to different species. With ocean dynamics, and hence water mass and temperature distribution being impacted by the presence of these sandbanks, fine spatial resolution data are required for accurate analysis of the consequences of MHWs and cold spells on the ecosystem. The Thermal InfraRed Sensor (TIRS) sensor onboard the Landsat constellation provides SST at a spatial resolution of 30 m with an accuracy of 0.1 to 0.2K, and can allow the study of the evolution of small-scale dynamics in coastal regions, including the development of MHWs. However, Landsat data have a very low revisit time (7-9 days), not optimal to study specific MHW events, which can evolve on a daily basis. This work will assess the synergy between Landsat data and daily, low-spatial resolution SST data to analyse the evolution of MHWs at coastal regions. DINEOF (Data Interpolating Empirical Orthogonal Functions) will be used to merge these tow data sources and provide high spatial and temporal resolution SST data. This work is a first attempt at linking MHW variability and their consequences on marine ecosystems at very fine spatio-temporal scales, and is part of the North-Heat project. We aim at providing key insights for our comprehension of MHWs in the southern North Sea, a region where marine ecosystems are already under high anthropogenic pressure.


How to cite: Alvera-Azcárate, A., Mohamed, B., Barth, A., Massant, J., and Van der Zande, D.: High spatial resolution Sea Surface Temperature data for the study of Marine Heat Waves in the souther North Sea, EGU General Assembly 2024, Vienna, Austria, 14–19 Apr 2024, EGU24-16471, https://doi.org/10.5194/egusphere-egu24-16471, 2024.

EGU24-17175 | ECS | Orals | OS4.4

Simultaneous dynamical reconstructions of Sea Surface Height and Temperature from multi-sensor satellite observations. 

Florian Le Guillou, Marie-Helene Rio, Daniele Ciani, Andrea Storto, and Bruno Buongiorno Nardelli

For many years, satellite observations of sea surface height (SSH) and sea surface temperature (SST) have provided invaluable information on the dynamics of the upper ocean at many scales. SSH and SST variables are dynamically linked, and are very often used together for many scientific studies (e.g. estimating heat transport in the upper layer by SSH-derived geostrophic currents). As observations are unevenly distributed in space and time (SSH is measured along one-dimensional trajectories and SST measurements are affected by clouds), many scientific and operational applications rely on gridded SSH and SST products. However, these products suffer from two main limitations. Firstly, conventional mapping techniques rely on static optimal interpolation schemes, which limits the estimation of nonlinear dynamics at scales poorly sampled by altimetry or, for SST, in regions densely affected by clouds (e.g. near western boundary currents). Secondly, SSH and SST reconstructions are performed separately, without relying on synergies between the two variables, which has an impact on the consistency of the two reconstructed fields.

We introduce an original dynamical mapping algorithm to simultaneously reconstruct SSH and SST from multi-sensor satellite observations. This innovative method combines a weakly constrained, reduced-order, 4-dimensional variational scheme with simple physical models – quasi-geostrophic for SSH and advection-diffusion for SST. The weak constraint of the models on the inversion procedure ensures that the reconstructed SSH and SST fields closely match the observations while preserving the space-time continuity of the dynamical structures.

The work focuses on the North Atlantic Ocean over the year 2023 and considers the available along-track altimetric SSH, microwave and infrared SST data. The performances of the method are evaluated through Observing System Experiments, utilizing independent altimetric (from conventional and SWOT satellites) and drifter data. Results show a significant improvement of the reconstruction of short energetic structures, both in terms of SSH and SST, compared to operational products. The benefit of using SST observations for reconstructing SSH fields increases as the number of altimeters is reduced. This opens new opportunity to use the method for sea-level related climate applications that rely on a stable two altimeters constellation.

How to cite: Le Guillou, F., Rio, M.-H., Ciani, D., Storto, A., and Buongiorno Nardelli, B.: Simultaneous dynamical reconstructions of Sea Surface Height and Temperature from multi-sensor satellite observations., EGU General Assembly 2024, Vienna, Austria, 14–19 Apr 2024, EGU24-17175, https://doi.org/10.5194/egusphere-egu24-17175, 2024.

EGU24-17323 | Orals | OS4.4

Comparing and combining directional swell measurements from Sentinel-1, SWIM and SWOT 

Romain Husson, Annabelle Ollivier, Beatriz Molero, Charles Peureux, Baptiste Gombert, Manal Yassine, Pierre Dubois, Adrien Nigou, Lotfi Aouf, Cedric Tourain, Gérald Dibarboure, and Alejandro Bohé


Various spaceborne Radar instruments are now operating with the common ability to observe long waves propagating across the oceans: the C-band Synthetic Aperture Radar (SAR) onboard Sentinel-1 (~23-36° of incidence), SWIM rotating Ku-band Radar onboard the Chinese-French CFOSAT satellite (~2 to 10° of incidence) and the Ka-band radar Interferometer (KaRIn) onboard the Surface Water Ocean Topography (SWOT) (1 to 5° of incidence).  

The directional swell measurements are investigated using model and in situ measurements but also co-locations between the spaceborne instruments (also known as cross-overs in altimetry). These latter co-locations involve both static and so-called “dynamic co-locations" where waves are propagated using a linear wave propagation model over a few hundred kilometers to maximize the number of co-locations between the sensors. Intercomparisons can therefore be performed either for specific case studies or for massive statistical comparisons. 

In this study, we use wave measurements from Sentinel-1A (S1-A) wave mode Level-2 Ocean (OCN) products (distributed by ESA) and SWIM L2P products from the new Near-Real Time (NRT) processing that extends the range of swell measurements up to 1200m wavelength (500m before) and better filter non-wave signatures (distributed by CNES/CLS, Q1 2024). We also investigate the possibility to use KaRIn SWOT spectral content of measurements from either the Sigma0 or the Sea Surface Height Anomaly (SSHA) observations to image so-called “forerunners”, the longest period swells that propagate ahead of the most energetic swell components (from Munk 1947). 

Intercomparisons show the promising synergies between these sensors and the potential to derive worldwide multi-sensor swell monitoring. First, SWIM shows great capabilities to image the shortest swell that S1 can totally miss or partially image because of its cutoff limitation. Then, S1 has shown capabilities to observe long swell (with peak wavelength larger than 800m), but their imaging mechanism is still limited by the reduced velocity bunching and tilt modulation of longest forerunners. On the other hand, comparisons with SWOT indicate that KaRIn unsmoothed (ocean data at their highest resolution) SSHA measurements can further extend the range of visible swell up to kilometric scales thanks to its interferometric capability. 

A significant work is still necessary to better understand, compare and inter-calibrate these directional swell measurements but they offer very promising perspectives for the exhaustive description of swell events, from the longest forerunners to the short wind sea. 

How to cite: Husson, R., Ollivier, A., Molero, B., Peureux, C., Gombert, B., Yassine, M., Dubois, P., Nigou, A., Aouf, L., Tourain, C., Dibarboure, G., and Bohé, A.: Comparing and combining directional swell measurements from Sentinel-1, SWIM and SWOT, EGU General Assembly 2024, Vienna, Austria, 14–19 Apr 2024, EGU24-17323, https://doi.org/10.5194/egusphere-egu24-17323, 2024.

EGU24-17817 | ECS | Orals | OS4.4

Interannual variability of Sea Surface Salinity in North-Eastern tropical Atlantic: influence of freshwater fluxes 

Clovis Thouvenin-Masson, Jacqueline Boutin, Vincent Echevin, Alban Lazar, and Jean-Luc Vergely

​​​​​In tropical regions, the fresh water flux entering into the ocean originates primarily from precipitations and, in a lesser extent, from continental rivers. Nevertheless, at regional scale, river flows can have a significant impact on the surface ocean dynamics. Riverine fresh water modifies salinity, and therefore density, stratification and circulation in the surface layer. The eastern Southern North Tropical Atlantic (e-SNTA) region off Northwest Africa, with its particular coastline, relatively high cumulative river discharge and the vicinity of ITCZ, is a particularly interesting location to study the linkage between precipitations, river flows and Sea Surface Salinity (SSS). In particular, the effect of river flows interannual anomalies on SSS have been unexplored in this region.

In this work, we focus on the regional SSS interannual variability, and their relations to river discharge and rainfall. We quantify the impact of these forcings on surface salinity and dynamics, combining informations coming from the CROCO regional ocean model and from SSS remote sensing.  Several simulations forced by different interannual and climatological forcings are analyzed. We compare the simulated SSS with satellite (ESA CCI product), in-situ (Argo, ships and Melax mooring datasets), and Glorys reanalysis. The mixed layer salinity budget is investigated to better understand the dynamics driving SSS variability.

Overall, the simulations are in good agreement with the observations, with a slight statistical improvement in the river plume regions when using ISBA interannual runoff and IMERG precipitation. 
We find that interannual SSS variability depends on surface circulation, river discharge, precipitation and wind variability.  Strong anomalies are mostly linked to strong precipitation anomalies. The impact of river discharge is highly dependent on surface currents. This highlights the importance of properly constraining river runoff and precipitation to simulate realistic sea surface salinities. 

This study shows the value of satellite salinity data for validating ocean models, and highlights the potential contribution of future L-band radiometric missions for coastal ocean observation.

How to cite: Thouvenin-Masson, C., Boutin, J., Echevin, V., Lazar, A., and Vergely, J.-L.: Interannual variability of Sea Surface Salinity in North-Eastern tropical Atlantic: influence of freshwater fluxes, EGU General Assembly 2024, Vienna, Austria, 14–19 Apr 2024, EGU24-17817, https://doi.org/10.5194/egusphere-egu24-17817, 2024.

EGU24-18280 | ECS | Posters on site | OS4.4

3D reconstruction of horizontal and vertical quasi-geostrophiccurrents in the North Atlantic Ocean 

sarah asdar, Daniele Ciani, and Bruno Buongiorno Nardelli

Direct in situ measurements of ocean currents are still quite limited and, due to its small magnitude, measurements of the vertical velocity remain one of the biggest challenges in oceanography. Vertical velocities are therefore generally inferred indirectly, and a common approach to diagnose them is to use the quasi-geostrophic omega equation. In the framework of the European Space Agency World Ocean Circulation project, a new high-resolution (1/10°) data-driven dataset of 3D ocean currents, including the vertical component, has been developed: the WOC-NATL3D dataset. The product domain extends over a wide portion of the North Atlantic Ocean from the surface down to 1500 m depth, and the dataset covers the period between 2010 and 2019. This entire domain holds immense importance for fishery activities and is identified as a key area within international conventions for the conservation of fishing resources, such as tuna and tuna-like fishes under ICCAT (International Commission for the Conservation of Atlantic Tunas). To generate this product, a diabatic quasi-geostrophic diagnostic model is applied to data-driven 3D temperature and salinity fields obtained through a deep learning technique, along with ERA5 fluxes and empirical estimates of the horizontal Ekman currents based on input provided by the European Copernicus Marine Service. The assessment of WOC-NATL3D currents is performed by direct validation of the total horizontal velocities with independent drifter estimates at various depths (0, 15 and 1000 m) and by comparing them with existing reanalyses that are obtained through the assimilation of observations into ocean general circulation numerical models. Our estimates of the ageostrophic components of the flow improve the total horizontal velocity reconstruction, being more accurate and closer-to-observations than model reanalyses in the upper layers, also providing an indirect proof of the reliability of the resulting vertical velocities.

How to cite: asdar, S., Ciani, D., and Buongiorno Nardelli, B.: 3D reconstruction of horizontal and vertical quasi-geostrophiccurrents in the North Atlantic Ocean, EGU General Assembly 2024, Vienna, Austria, 14–19 Apr 2024, EGU24-18280, https://doi.org/10.5194/egusphere-egu24-18280, 2024.

EGU24-18960 | Orals | OS4.4

Integrating satellite remote sensing and Machine Learning techniques for ecological quality assessment in Italian coastal waters 

Chiara Lapucci, Andrea Antonini, Emanuele Böhm, Emanuele Organelli, Luca Massi, Alberto Ortolani, Carlo Brandini, and Fabio Maselli

Assessing and monitoring water ecological quality in coastal areas is crucial for safeguarding marine ecosystems, and consequently has a central role in European Union environmental policies. In this work we present the use of in situ monitoring and satellite Earth Observation (EO) techniques as an innovative approach to assess water quality using machine learning. This study shows the use of Sentinel-3 Ocean and Land Color Instrument (OLCI) imagery from Copernicus Marine Service to evaluate the ecological quality of Italian coastal waters, focusing on the Trophic Index (TRIX, Vollenweider et al., 1998), used as a key indicator within the Marine Strategy Directive (2008/56/EC) to characterize the trophic status of coastal waters. Specifially, we investigated the possibility of integrating remote sensing and machine learning techniques to estimate TRIX levels in Italian coastal waters, using an in situ dataset for TRIX estimation obtained from the Marine Strategy Directive Monitoring database (ISPRA). Given that TRIX computation is traditionally based on in situ data, the exploitation of satellite data presents an opportunity to obtain it on a larger spatial and temporal scale. As the TRIX index relies significantly on chlorophyll a, that often exhibits correlations with other components (Massi et al., 2019), we initially explored the relationships between TRIX variables, especially chlorophyll a concentration, and water spectral reflectance using in situ multispectral observations. Encouraged by the results, the effectiveness of OLCI full-resolution data was tested for evaluating the trophic status of Tuscany coastal waters. Our findings initially showed distinctive geographic patterns of in situ TRIX values in the Ligurian, Tyrrhenian, and Ionian coastal regions of Italy, revealing regions with eutrophic conditions near estuaries and others exhibiting oligotrophic characteristics. A Random Forest Regression algorithm was applied to this database, constituted by in situ data and OLCI data, optimizing calibration parameters to predict TRIX levels. This method, via the Feature Importance analysis, underscored the significance of specific spectral bands related to chlorophyll spectral response. The statistical analysis validates the model's performance, indicating in the initial test described above a moderate level of error (MAE of 0.51) and satisfactory explanatory power (R2 of 0.37) (Lapucci et al., 2023). These outcomes show the potentiality of a synergistic use of remote sensing and machine learning in environmental monitoring and management. Current investigations are aimed at refining methodologies and broaden datasets to further test and enhance TRIX monitoring capabilities from a spatial perspective.

References:

  • Vollenweider, R.A.; Giovanardi, F.; Montanari, G.; Rinaldi, A. Characterization of the trophic conditions of marine coastal waters with special reference to the NW Adriatic Sea. Environmetrics 1998, 9, 329–357.
  • Massi, L.; Maselli, F.; Rossano, C.; Gambineri, S.; Chatzinikolaou, E.; Dailianis, T.; Arvanitidis, C.; Nuccio, C.; Scapini, F.; Lazzara,L. Reflectance spectra classification for the rapid assessment of water ecological quality in Mediterranean ports. Oceanologia 2019,61, 445–459.
  • Lapucci, C.; Antonini, A.; Böhm, E.; Organelli, E.; Massi, L.; Ortolani, A.; Brandini, C.; Maselli, F. Use of Sentinel-3 OLCI Images and Machine Learning to Assess the Ecological Quality of Italian Coastal Waters. Sensors 2023, 23, 9258.


How to cite: Lapucci, C., Antonini, A., Böhm, E., Organelli, E., Massi, L., Ortolani, A., Brandini, C., and Maselli, F.: Integrating satellite remote sensing and Machine Learning techniques for ecological quality assessment in Italian coastal waters, EGU General Assembly 2024, Vienna, Austria, 14–19 Apr 2024, EGU24-18960, https://doi.org/10.5194/egusphere-egu24-18960, 2024.

EGU24-21059 | Orals | OS4.4

Satellite Altimetry In Coastal Lagoons: The Case Of The Marano-Grado And Venice Lagoons In The Northern Adriatic Sea 

Francesco De Biasio, Stefano Vignudelli, and Ron Abileah

In the Northern Adriatic Sea, the Marano-Grado and Venice coastal lagoons lay at the edge of a coastal plain of 2.400 km2 of low-lying areas along 300 km of coast (Bondesan et al., 1995). Defined as geographically distinct water bodies, coastal lagoons are shallow, enclosed by barriers, intermittently connected to the ocean through restricted inlets, and typically aligned parallel to the shore (Tagliapietra et al., 2009). Such sheltered coastal regions are characterized by slow water flow, low waves and intertidal marshes partially protecting the surface from wind. However, they face dual threats of storm surges and rising sea level, which shape their geomorphological evolution.

Satellite radar altimetry emerges as an indispensable tool for studying these environments, as traditional tide gauges are insufficient for discerning sea level changes independent of land shifts. Unlike classical open ocean altimetry, which loses accuracy within 10–15 km of the coast, modern coastal altimetry, bolstered by advancements like Delay-Doppler processors and high burst-repetition frequencies (e.g., 80 Hz), extends reliable coverage to sheltered coastal areas. Recent enhancements, such as the implementation of SAR and SARin processing algorithms developed by the HYDROCOASTAL project team, further strengthen the capabilities of coastal altimetry (https://eo4society.esa.int/projects/hydrocoastal/) and are implemented in the ESA GPOD/Earth Console® Altimetry Virtual Lab service. Notably, the PISA algorithm, specializing in conditions like specular reflection, leverages Radar Cross Section (RCS) classification to distinguish between specular, quasi-specular, and non-specular behavior (Abileah and Vignudelli, 2021). This algorithm capitalizes on the superior signal-to-noise ratio of specular surfaces, enabling precise range retrieval in challenging scenarios.

In this study, high-resolution radar data are employed in the examination of the Venice and Marano-Grado coastal lagoons. The Marano-Grado Lagoon serves as a validation platform, with a comparative analysis of data in two Sentinel-3 tracks. Subsequently, the utility of these data, encompassing wind speed and significant wave height, is evaluated within the coastal zone of the Venice Lagoon. These two coastal zones are chosen not only for their geographical significance but also due to the availability of in-situ observations from various instruments, including tide gauges, wave recorders, and wind instruments: this multi-instrumental approach offers distinct advantages for comprehensive comparison and interpretation purposes.

The motivation driving this study is rooted in the recognition of approximately 32,000 lagoons, spanning 13% of the world's coastline (Carter et al., 1996; Barnes, 1980). Limited in-situ measurements, particularly in developing nations, propel the reliance on satellite data as the most viable option for monitoring sea level changes. The cost and logistical challenges associated with in-situ observations further underscore the importance of satellite altimetry in providing a seamless observational continuum across open oceans, coastal regions, and inland waters.

References

Bondesan et al. (1995). Journal of Coastal Research, 1354-1379.

Tagliapietra et al. (2009). Marine and freshwater Research, 60(6), pp.497-509, doi:10.1071/MF08088.

Abileah and Vignudelli (2021). Remote Sensing of Environment, 264, 112580, doi:10.1016/j.rse.2021.112580.

Carter and Woodroffe (1995). ISBN 0521598907. doi:10.1017/CBO9780511564420.

Barns (1981). Journal of the Marine Biological Association of the United Kingdom, 61, 2, pp. 549, doi:10.1017/S0025315400047135. 

How to cite: De Biasio, F., Vignudelli, S., and Abileah, R.: Satellite Altimetry In Coastal Lagoons: The Case Of The Marano-Grado And Venice Lagoons In The Northern Adriatic Sea, EGU General Assembly 2024, Vienna, Austria, 14–19 Apr 2024, EGU24-21059, https://doi.org/10.5194/egusphere-egu24-21059, 2024.

EGU24-21436 | Posters on site | OS4.4

Remote estimates of sea surface nitrate from ocean color in the northwest Pacific  

Shuangling Chen, Yuntao Wang, and Fei Chai

Sea Surface Nitrate (SSN) plays an important role in assessing new production and phytoplankton growth in the ocean, yet it has been challenging to estimate SSN from satellites due to its complex and varying relationship with different environmental proxies. The different SSN trends in the northwest Pacific reported in previous studies call for more detailed research to examine the interannual variabilities in SSN. We addressed this problem by developing a stacking-random-forest (SRF) based algorithm for Moderate Resolution Imaging Spectroradiometer (MODIS). It allows estimating SSN from daily sea surface temperature (SST) and Chlorophyll-a concentration (Chl) at a spatial resolution of 4 km. For SSN ranging between 0.0005 and 25.88 μmol/kg, the model had a root mean square difference of 1.34 μmol/kg (5.3%) and coefficient of determination of 0.92. Further independent validation and sensitivity tests demonstrated the validity of the algorithm in retrieving SSN. Using this novel data record, for the first time, we investigated the SSN interannual variabilities and trends from MODIS. Overall, the SSN showed a weak decreasing trend of -0.01±0.007 μmol kg-1 yr-1 (p < 0.05) in the northwest Pacific in 2002-2020, associated with an increasing trend in SST. The interannual variabilities of SSN were significantly correlated with the environmental proxies (SST, Chl) and the climate indices (Pacific Decadal Oscillation and North Pacific Gyre Oscillation). The SSN trends can be further restricted with more data available.

How to cite: Chen, S., Wang, Y., and Chai, F.: Remote estimates of sea surface nitrate from ocean color in the northwest Pacific , EGU General Assembly 2024, Vienna, Austria, 14–19 Apr 2024, EGU24-21436, https://doi.org/10.5194/egusphere-egu24-21436, 2024.

EGU24-1361 | ECS | Posters virtual | OS4.5

Short-term submesoscale eddy variations observed in SWOT KaRIn SLA fields 

Xiaoyan Chen, Graham Quartly, and Ge Chen

In this study, we present a series of typical submesoscale eddy short-term variations revealed by one-day repeat SWOT KaRIn sea level anomaly (SLA) fields. First, several representative cases demonstrate SWOT’s capacity to continuously track submesoscale signals (<80 km diameter) over multiple days. By comparing with eddies detected based on traditional merged SLA fields with 0.25 spatial resolution, it is observed that SWOT can resolve eddy signals several days earlier. This early detection proves essential for investigating the processes involved in eddy generation. Second, the study validates the effectiveness of SWOT in resolving complex eddy-eddy interactions of merging and splitting which are often ambiguous in data merged from multiple altimeters, especially in high latitudes. Third, the vertical structures of SWOT-derived submesoscale eddies are revealed by combining with Argo observations. Results indicate that these submesoscale eddies can induce strong temperature and salinity anomalies, and also exhibit vertical biochemical signatures (e.g., chlorophyll, backscattering coefficient of particles). A BGC-Argo float was trapped by an anticyclonic eddy for nearly 2 months in the Northwest Pacific, revealing that the vertical temperature anomaly of the eddy had a double-core structure with a warm (cold) core in the upper (lower) layer during its generation phase. In addition, the submesoscale features observed by SWOT are accompanied by significant chlorophyll and SST signatures, further confirming the ability of SWOT to detect submesoscale features. This study not only integrates diverse observations to underscore the resolving ability of SWOT at the submesoscale, but also emphasizes the unique advantage of the one-day repeat product in capturing rapidly changing signals. Such insights are of great significance for an in-depth understanding of submesoscale dynamical processes and facilitate further statistical analyses of submesoscale eddies using the global coverage by SWOT in its 21-day revisit cycle.

How to cite: Chen, X., Quartly, G., and Chen, G.: Short-term submesoscale eddy variations observed in SWOT KaRIn SLA fields, EGU General Assembly 2024, Vienna, Austria, 14–19 Apr 2024, EGU24-1361, https://doi.org/10.5194/egusphere-egu24-1361, 2024.

EGU24-1629 | ECS | Orals | OS4.5

Ocean tides from SWOT: insights in complex coastal regions 

Michael Hart-Davis, Christian Schwatke, Ole Andersen, Richard Ray, Edward Zaron, Antonio Bonaduce, Hilde Sande Borck, and Denise Dettmering

Studying ocean tides from satellite altimetry has traditionally been difficult in coastal regions, mainly due to the complexity of tides in these regions, limited spatial coverage, and land contamination of the radar returns. The Cal/Val phase and the science orbit phase of SWOT provide unique observations which can be exploited for tidal analysis. The nadir data provided by this mission complements other traditional altimetry missions and will serve the refinement of global ocean tide models well in future studies. The KaRIn data, however, is beneficial for evaluating the spatial variability of ocean tides at much smaller scales than previously possible from altimetry or in-situ measurements. In addition, areas very close to the shoreline can also be monitored. Analysing tides in complex coastal regions, such as fjords and inlets, is now also possible thanks to the increased spatial coverage of SWOT. 

This presentation evaluates the pixel cloud data of the hydrological product and the ocean product provided by SWOT in three regions. These regions are selected to provide examples of the usefulness of these data in very complex environments. The regions are as follows:

  • The Bristol Channel, on the west coast of the UK.
  • The Sognefjord along the west coast of Norway.
  • The Long Island Sound on the east coast of the USA.

These regions have relatively large tidal ranges and have been challenging for conventional altimetry, resulting in reduced accuracy in available ocean tide models. These regions are also well covered by in-situ measurements and are either covered by the Cal/Val phase or the nominal orbit of the SWOT mission. The resultant estimations will be contrasted with in-situ measurements and state-of-the-art global models.

How to cite: Hart-Davis, M., Schwatke, C., Andersen, O., Ray, R., Zaron, E., Bonaduce, A., Borck, H. S., and Dettmering, D.: Ocean tides from SWOT: insights in complex coastal regions, EGU General Assembly 2024, Vienna, Austria, 14–19 Apr 2024, EGU24-1629, https://doi.org/10.5194/egusphere-egu24-1629, 2024.

EGU24-1959 | Posters virtual | OS4.5

SWOT Level-3 Overview algorithms and examples 

Marie-Isabelle Pujol, Gerald Dibarboure, Yannice Faugere, Antoine Delepoulle, Frederic Briol, Matthias Raynal, Clement Ubelmann, Robin Chevrier, Anaelle Treboutte, and Pierre Prandi

The Surface Water Ocean Topography (SWOT) mission was launched in December 2023.It is the result of cooperation between CNES, NASA and their partners from the Canadian and UK Space Agencies. SWOT carries a unique altimetric payload, including a Ku-band Jason-class nadir altimeter and a Ka-band SAR-interferometric (KaRIn) wide-swath altimeter providing 2 swaths 50-km wide. It offers new opportunity for the observation of the small mesoscale structures over the oceans, including near coast and high latitude areas. Thanks to these observation capabilities, SWOT could contribute to a better understanding of the physical processes at play at these scales, and to the applications that flow from them.

Few months after its launch, Level-2 product of the KaRIn measurement were made available for the SWOT Science Team. These products however remain complex and oriented for the altimetry expert community, while many non-expert users may need the swath measurement for different applications. To answer these needs, a Level-3 product was developed in the context of the SWOT Science Team Project DESMOS. It is the result of different processing steps including the use of the state of the art of different geophysical corrections (e.g. Mean Sea Surface, ocean tide), aiming to improve the quality of the sea level measurement at small mesoscale; the multi-mission calibration, that makes the SWOT measurements consistent with other altimeters; the data selection, to identify invalid measurements; the sea surface height noise-mitigation, aiming reduce the noise level on SSHA and allowing the estimation of the geostrophic current and vorticity. We present here the SWOT KaRIn Level-3 product.

How to cite: Pujol, M.-I., Dibarboure, G., Faugere, Y., Delepoulle, A., Briol, F., Raynal, M., Ubelmann, C., Chevrier, R., Treboutte, A., and Prandi, P.: SWOT Level-3 Overview algorithms and examples, EGU General Assembly 2024, Vienna, Austria, 14–19 Apr 2024, EGU24-1959, https://doi.org/10.5194/egusphere-egu24-1959, 2024.

EGU24-2030 | Orals | OS4.5

Validating SWOT in the coastal zone: a radar altimetry and tide gauge case study in the Bristol Channel and Severn River-Estuary system 

Ian Dougal Lichtman, Chris Banks, Francisco J. M. Calafat, Christine Gommenginger, and Paul Bell

The Bristol Channel and Severn River-Estuary system is highly dynamic with one of the largest tidal ranges in the world. The Severn is the longest river in the UK, with the second largest mean flow.  The coastline surrounding these waters and upriver is covered by a network of tide gauges (TGs), which has been continuously operational for a period of decades. This makes it an ideal area for the validation of new satellite altimetry sensors such as those on the Surface Water and Ocean Topography (SWOT) mission,  which for the first time collects 2D maps of water level, and to explore quality of SWOT data in the coastal zone. The SWOT-UK project  used this area for these purposes, for a comprehensive programme of field campaigns and multidisciplinary research in a coastal and estuarine context, as part of the UK contribution to the international SWOT Science Team validation work.

For the SWOT-UK project, a set of TG, CryoSat-2 and Sentinel-3 data has been gathered to validate total water level and surface slope during the 1-day repeat SWOT CAL/VAL mission phase. Extra in situ GNSS-IR instruments were deployed to fill gaps in the existing TG network. This combined data set was used to assess the consistency and quality of the TG network and develop a validation scheme for the SWOT L2 and L3 altimetry data, in coastal and estuarine settings. This will highlight issues of how the coastal dynamics, hydrology and morphology affect the comparison of satellite altimetry and TGs, and how these features may be seen in the SWOT data. The slope along the satellite passes (across-channel), near-shore coastal dynamics and intertidal morphology have been seen to affect the comparison of satellite altimetry and TG data, and these geographic characteristics are expected to influence the uncertainty in the comparison with the SWOT data.

The validation data from Bristol Channel and Severn Estuary has been used for an assessment of the performance of these novel 2D altimeter measurements. Cross-comparisons with in situ and satellite data will be presented, with an exploration of the effect of coastal dynamics and morphology on these data. This will lead to an improvement of satellite altimetry in the coastal zone. In addition, the SWOT data will be relevant to the improvement of numerical models, by providing a quality of validation and assimilation data not previously available, and help understand and reduce uncertainties due to changing intertidal morphology.

How to cite: Lichtman, I. D., Banks, C., Calafat, F. J. M., Gommenginger, C., and Bell, P.: Validating SWOT in the coastal zone: a radar altimetry and tide gauge case study in the Bristol Channel and Severn River-Estuary system, EGU General Assembly 2024, Vienna, Austria, 14–19 Apr 2024, EGU24-2030, https://doi.org/10.5194/egusphere-egu24-2030, 2024.

EGU24-3501 | ECS | Orals | OS4.5

Reconstructing ocean surface momentum conservation from altimetry, drifters and wind reanalysis 

Margot Demol, Pierre Garreau, and Aurélien Ponte

Improving our understanding and ability to represent surface oceanic dynamics is crucial for the study and forecast of the climate system, as it modulates air-sea interactions and marine ecosystem. 

The recently launched SWOT altimetric satellite is providing a 2D highly resolved vision of sea level (down to submesoscales) and may thus offer a brand new view on upper ocean circulation.

If geostrophy has historically allowed a global estimation of mesoscale and larger ocean surface circulation from classical altimetry, it is jeopardized at the scales resolved by SWOT by contributions from higher frequency processes such as internal tides, near-inertial waves and wind effect.

Drifters trajectories, which provide a high frequency  'ground-truth’ estimate of the upper ocean circulation and wind reanalysis products are thus highly complementary to altimetry to reconstruct surface ocean dynamic. 

The horizontal surface momentum conservation is here reconstructed from historical altimetric data, drifters derived currents (Global Drifter Program) and atmospheric reanalysis products. We will present our ability at closing upper ocean momentum balance globally and quantify contributions from different terms involved (inertial acceleration, coriolis acceleration, pressure gradient and wind stress vertical divergence). This will allow to qualify and map the dominant dynamical balances, revealing the limit of geostrophy and the dominance of inertial balance in some areas. An error budget is also estimated. 

How to cite: Demol, M., Garreau, P., and Ponte, A.: Reconstructing ocean surface momentum conservation from altimetry, drifters and wind reanalysis, EGU General Assembly 2024, Vienna, Austria, 14–19 Apr 2024, EGU24-3501, https://doi.org/10.5194/egusphere-egu24-3501, 2024.

EGU24-5898 | Posters on site | OS4.5

Validation of SWOT data using airborne LiDAR off the coasts of Normandy during the fast sampling orbit phase 

Laurent Froideval, Hugo Kersimon, Christophe Conessa, Laurent Benoit, Edward Salameh, Pascal Bonnefond, Nicolas Picot, Imen Turki, and Laignel Benoit

The Surface Water and Ocean Topography (SWOT) altimeter will perform a continuous global water survey with unprecedented resolution and accuracy across its 3-year mission. After being launched on December 16th 2022 with a SpaceX Falcon 9 rocket from Vandenberg in California, it was successfully commissioned followed by a Calibration and Validation (Cal/Val) phase that lasted approximately between April and July 2023. During this period, numerous in-situ measurements were performed across the globe to assess the altimeter’s performance. Airborne Light Detection And Ranging (LiDAR) campaigns were conducted off the coasts of Normandy, France as part of other measurements in this region. We carried out 4 different missions, 2 in May and 2 in June, using a Leica ALS 60 airborne sensor aboard 2 different planes, a Piper Navajo and a Swearingen Fairchild Merlin. The flight plans were designed below the SWOT Ka-band Radar Interferometer (KaRIn) along and across the 1-day fast sampling ground track. Ground Control Points (GCP) were acquired under the LiDAR coverage, close to the city of Cherbourg. The plane’s trajectory was processed using CNES GINS software, using the integer Precise Point Positioning (iPPP) mode, resulting in centimetric antenna phase positioning. LiDAR data were calibrated using the GCPs with a millimetric average accuracy. First results between SWOT data and airborne LiDAR indicate very good consistency. Indeed, the differences between the SWOT LR 2 km pre-cal product and LiDAR data, averaged over a similar 2 km grid, gives centimetric standard deviation.

How to cite: Froideval, L., Kersimon, H., Conessa, C., Benoit, L., Salameh, E., Bonnefond, P., Picot, N., Turki, I., and Benoit, L.: Validation of SWOT data using airborne LiDAR off the coasts of Normandy during the fast sampling orbit phase, EGU General Assembly 2024, Vienna, Austria, 14–19 Apr 2024, EGU24-5898, https://doi.org/10.5194/egusphere-egu24-5898, 2024.

EGU24-6062 | ECS | Orals | OS4.5

Mapping directional sea surface slopes associated with seamounts from SWOT and validation with ICESat-2 

Bjarke Nilsson, Ole B. Andersen, and Rasmus Lørup Arildsen

Observations from satellite altimeters are essential to mapping the marine gravity field and bathymetry. As most of the ocean basins are yet to be mapped by sonar, obtaining reliable data of sea surface height and sea surface slopes is key to improving our understanding of the marine gravity field and bathymetry. Improvement in altimeter systems has enabled the marine gravity field to be determined to a few mGal, however with conventional satellite altimetry, improvements are challenging.

The major challenge is the sampling geometry of conventional satellite altimeters, with along-track (majorly north-south) sea surface slopes being much better determined than across-track slopes (east-west). With the KaRIn instrument on the Surface Water and Ocean Topography (SWOT) satellite, swath-altimetry with 2-dimensional observations of the sea surface height is possible. From these observations, the directional sea surface slopes in both along-track and across-track can be determined. However, determining the resolution and precision with which the sea surface slope is determined, is of fundamental importance for the improvement of the mapping of the marine gravity field.

We present directional sea surface slopes associated with a major seamount using SWOT L2 data and with a minor seamount using SWOT pixel-cloud data, demonstrating the quantum leap forward possible with SWOT. With three parallel beams, ICESat-2 is another satellite that can determine the east-west sea surface slope. From observing the difference in sea surface height between beams, we can determine the directional sea surface slopes in north-south and east-west components, with auspicious results. With data from ICESat-2, we aim to validate the SWOT directional sea surface slopes at cross-overs between SWOT and ICESat-2 and determine the relative initial performance.

How to cite: Nilsson, B., Andersen, O. B., and Arildsen, R. L.: Mapping directional sea surface slopes associated with seamounts from SWOT and validation with ICESat-2, EGU General Assembly 2024, Vienna, Austria, 14–19 Apr 2024, EGU24-6062, https://doi.org/10.5194/egusphere-egu24-6062, 2024.

EGU24-6299 | ECS | Posters on site | OS4.5

Global Ocean spectral slope rupture evidenced by SWOT 21-day orbit observations 

Oscar Vergara, Rosemary Morrow, Robin Chevrier, Gérald Dibarboure, and Nicolas Picot

Embarking both the revolutionary KaRIn 2D imaging SAR interferometer and a Jason-class nadir altimeter, the SWOT mission provides sub-50 km wavelength ocean sea surface height observations. With its unprecedented spatial resolution, coupled with an extremely low noise, the SWOT KaRIn observations will allow us to characterize ocean dynamics for wavelengths well below the capabilities of conventional nadir altimetry.  

Along-track Sea Surface Height (SSH) observations (1 Hz) have been recently used to tease out the spectral characteristics of oceanic variability in the meso- to sub-mesoscale wavelength range (wavelength < 100 km). Conventional altimetry reveals a regime shift in many tropical and subtropical regions, where a quasi-geostrophic energy cascade changes to a flatter, non-geostrophic dynamical regime at smaller wavelengths. Yet at higher latitudes, with smaller Rossby radius, this regime shift was not apparent, hidden by the higher conventional altimetry noise at smaller wavelengths. In the present study, we take advantage of the multi-instrumental characteristics of the SWOT mission, embarking a conventional nadir altimeter in addition to KarIn with its improved signal-to-noise ratio, to characterize the spectral slope rupture at global scale. We use SWOT data available during the first months of the mission’s 21-day repeat orbit and compare these results against latest model and in situ estimates.  

This wavelength scale, where the geostrophic energy cascade becomes dominated by non-geostrophic dynamics (e.g. internal gravity waves including internal tides) is important for using and interpreting SSH-derived geostrophic current data, and to quantify the regions and seasons where the geostrophic assumption breaks down. Our results could therefore be used as an indicator for this scenario, as more high-resolution SWOT data becomes available and is integrated into multi-mission global SSH products and their derived geostrophic currents.

How to cite: Vergara, O., Morrow, R., Chevrier, R., Dibarboure, G., and Picot, N.: Global Ocean spectral slope rupture evidenced by SWOT 21-day orbit observations, EGU General Assembly 2024, Vienna, Austria, 14–19 Apr 2024, EGU24-6299, https://doi.org/10.5194/egusphere-egu24-6299, 2024.

EGU24-6805 | ECS | Orals | OS4.5

Reconstructing vertical velocities and heat fluxes in the Southern Ocean from SWOT SSH fields 

Elisa Carli, Lia Siegelman, Rosemary Morrow, Benoit Legresy, and Oscar Vergara

Accessing vertical velocities and heat fluxes globally represents today a major gap in our understanding of the 3D ocean dynamics. SWOT is showing a great advance, namely a sea level resolution up to ten times better than traditional nadir-looking altimeters, allowing for the observation of fine-scale ocean dynamics. Mesoscale dynamics account for 80% of the total kinetic energy in the ocean and smaller mesoscales and sub-mesoscales contribute 50% of the total vertical velocity variance in the upper ocean. In this work, we explore the potential of using SWOT 2D surface topography data to reconstruct vertical velocities and vertical heat fluxes below the Southern Ocean mixed layer using surface Quasi-Geostrophic (sQG) theory for the vertical projection. The upper ocean 3D circulation is calculated from SWOT’s science phase 2D sea surface height (SSH) observations and validated with multi-sourced in-situ data (high-resolution XBT and CTD sections from the SURVOSTRAL and ACC-SMST SWOT CalVal campaigns in the Southern Ocean south of Tasmania). The performance of the SQG methodology, in terms of spatial and temporal correlation, is first assessed using the COAS coupled ocean-atmosphere simulation,  and we find that the SQG reproduces both the spatial distribution and the overall regional variability of the mesoscale structures below the Southern Ocean mixed layer. We then apply the SQG methodology to a high-resolution SSH regional mapping of 3 to 5 days of SWOT science phase data to obtain reconstructed vertical velocities and vertical heat fluxes. The results are validated over the in-situ XBT and CTD data collected in the same time period. The observable structures, resolved dynamics and errors involved in this fine-scale reconstruction are discussed.

How to cite: Carli, E., Siegelman, L., Morrow, R., Legresy, B., and Vergara, O.: Reconstructing vertical velocities and heat fluxes in the Southern Ocean from SWOT SSH fields, EGU General Assembly 2024, Vienna, Austria, 14–19 Apr 2024, EGU24-6805, https://doi.org/10.5194/egusphere-egu24-6805, 2024.

EGU24-7789 | ECS | Orals | OS4.5

Adapting in situ sampling strategies to SWOT-scale studies: The BioSWOT-Med campaign example as part of the SWOTAdopt-a-Crossover Consortium 

Louise Rousselet, Andrea Doglioli, Anne Petrenko, Stéphanie Barrillon, Maristella Berta, Anthony Bosse, Léo Berline, Jean-Luc Fuda, Robin Rolland, Pascale Bouruet-Aubertot, Sven Gastauer, Gérald Grégori, and Francesco d'Ovidio

The SWOT satellite measures sea surface height at an unprecedented resolution about ten times better than conventional altimetry products. SWOT data offer a unique opportunity of observing very fine-scale (~few km) surface dynamics from space. In situ samplings, aside from complementing the 2D picture, also provide a 3D view of the observed fine scale dynamics essential for interpretation of bio-physical interaction processes. Nevertheless, exploring this regime during field experiments remains challenging due to the difficulty to precisely locate fine-scale features in real time. A shift of a few km may not be of critical importance when sampling a large structure such as an eddy with a radius of about 100 km. However a similar sampling error could obviously lead to severe misinterpretations in the case of a 10 to 20 km wide eddy. The problem is even exacerbated by the fact that the lifetime typically decreases with the size of eddies and filaments. One way to address this problem with field experiments at the SWOT scales is therefore to update and adapt the sampling location and shape, with synoptic near-real time information of the sea state provided by available high resolution remote sensing (SST and Chlorophyll), and analysis of altimetry and model assimilation. Although vulnerable to cloud coverage and/or limited in resolution, this information can be complemented by near-real time Lagrangian analysis of the surface geostrophic fields providing finer diagnostics of the sampling site dynamics. Early SWOT data also filled some gaps in terms of parameters and spatiotemporal coverage. By using the BIOSWOT-Med cruise as an example, here we review the tools offered by the SWOT AdAC Consortium to the field experiments that have been deployed during the SWOT fast-sampling phase (March-June 2023). After evaluating synergies and shortcomings with in situ platforms, we will discuss how adaptive sampling strategies may evolve in the future to assist field experiments during the SWOT Science phase.

How to cite: Rousselet, L., Doglioli, A., Petrenko, A., Barrillon, S., Berta, M., Bosse, A., Berline, L., Fuda, J.-L., Rolland, R., Bouruet-Aubertot, P., Gastauer, S., Grégori, G., and d'Ovidio, F.: Adapting in situ sampling strategies to SWOT-scale studies: The BioSWOT-Med campaign example as part of the SWOTAdopt-a-Crossover Consortium, EGU General Assembly 2024, Vienna, Austria, 14–19 Apr 2024, EGU24-7789, https://doi.org/10.5194/egusphere-egu24-7789, 2024.

EGU24-7832 | ECS | Posters on site | OS4.5

Coastal tides and tidal Bore in the Severn Estuary from fast-sampled SWOT data 

Rasmus Arildsen, Rasmus Arildsen, and Ole Andersen

Satellite altimetry is instrumental in deciphering the dynamics of oceans and coastal regions. It yields indispensable data critical for monitoring global sea levels, predicting wave heights, and charting the courses of ocean currents and river elevations. These insights are pivotal for advancing climate research, ensuring navigational safety, and managing water resources effectively. Nonetheless, in coastal settings, the efficacy of conventional altimetry is constrained by its spatial resolution and the interference of land in the radar signal near the coastlines. These limitations hinder its ability to accurately capture the nuanced characteristics of dynamic and intricate coastal environments.

The launch of the Surface Water and Ocean Topography (SWOT) satellite represents a monumental leap in the technology of satellite altimetry. With advanced high-resolution wide swath altimetry and innovative use of the phase difference between dual onboard antennas, SWOT drastically reduces the limitations of traditional radar altimeters. SWOT provides a 2D measurements grid with a detailed 50m grid spacing not degrading towards the coast. This marks a substantial enhancement compared to the 7-km across-track spacing along a 1D trajectory offered by conventional altimetry.

This enhancement allows for the precise and detailed monitoring of dynamic coastal phenomena such as tides and tidal bores, even in estuaries.

Tidal bores, characterized as sudden and powerful water surges against the river's current, are critical for local ecology, navigation, and flood management. Despite their importance, their dynamic and transient nature has made them challenging to study using conventional methods. The Bristol Channel, with its extreme tidal range and the presence of the Severn Bore, presents an ideal case study to demonstrate SWOT's capabilities.

We use SWOT 50-meter pixel cloud data during the 1-day fast sampling repeat period in April 2023 to study the high-resolution tidal signal in the Bristol Channel - Severn Estuary and the Severn tidal bore. The results demonstrate that SWOT can capture both complex tidal signals associated with wetting and drying close to the coast, but also the tidal bore sweeping up the Severn River from the mouth of the river and some 20 km upstream.

How to cite: Arildsen, R., Arildsen, R., and Andersen, O.: Coastal tides and tidal Bore in the Severn Estuary from fast-sampled SWOT data, EGU General Assembly 2024, Vienna, Austria, 14–19 Apr 2024, EGU24-7832, https://doi.org/10.5194/egusphere-egu24-7832, 2024.

EGU24-7922 | ECS | Posters on site | OS4.5

What can we learn from the SWOT Fast Sampling Phase on coastal ocean circulation: example of the North Current (NW Mediterranean Sea)? 

Léna Tolu, Florence Birol, Fabien Léger, Oscar Vergara, and Rosemary Morrow

The monitoring of ocean currents is a key component in many coastal applications, ranging from biogeochemical resources to marine pollution or search and rescue. During the last three decades, satellite altimetry has played an essential role in the understanding and monitoring of ocean currents at global scale. But its use is still limited in coastal areas due to a poorer data quality as we approach the coast, and a spatio-temporal data resolution considered as sparse relatively to the scales of coastal dynamical features.

However, many recent studies addressing the different issues related to the derivation and exploitation of altimeter-derived coastal current velocities have shown that they efficiently complement coastal velocity fields derived from in-situ data (e.g., hydrographic observations, surface drifter and moored or ship-based acoustic Doppler velocities) or from shore‐based HF radars. Indeed, one of the major advantages of this measurement technique is to provide long time series (i.e. > 30 years) of spatially and temporally homogeneous information about the circulation and to be available at near-global scale. The data quality problem can be partially overcome thanks to dedicated processing with adequate corrections. Additionally, merging data from multiple missions has been shown to improve the spatial and temporal resolution. But few data sets including coastal processing and several altimetry missions still exist.

The SWOT mission represents the beginning of a new class of altimeters. Associated to substantial improvements in terms of spatial resolution and altimetry data accuracy, it could considerably change the situation in terms of coastal applications. In this study, we study and quantify the ability of SWOT to observe coastal currents compared with conventional nadir missions on a case study: the Northern Current (NW Mediterranean Sea). In particular, we take advantage of the 1-day repeat orbit during the Fast Sampling Phase as a prototype to explore what future altimetry based on such temporal resolution could bring in coastal oceanography.

How to cite: Tolu, L., Birol, F., Léger, F., Vergara, O., and Morrow, R.: What can we learn from the SWOT Fast Sampling Phase on coastal ocean circulation: example of the North Current (NW Mediterranean Sea)?, EGU General Assembly 2024, Vienna, Austria, 14–19 Apr 2024, EGU24-7922, https://doi.org/10.5194/egusphere-egu24-7922, 2024.

EGU24-10457 | Orals | OS4.5

Measuring Significant Wave Height fields in two dimensions at kilometric scales with SWOT 

Alejandro Bohe, Albert Chen, Curtis Chen, Gerald Dibarboure, Pierre Dubois, Alexander Fore, George Hajj, Benoit Legresy, Luc Lenain, Beatriz Molero, Eva Peral, Matthias Raynal, and Bryan Stiles

The Surface Water and Ocean Topography (SWOT) mission is primarily designed to measure Sea Surface Height in two dimensions at an unprecedented resolution thanks to its innovative Ka-band radar interferometer KaRIn. In addition to the topography measurements derived from the phase difference between the images acquired at each of the two antennas separated by 10 meters, KaRIn can also provide information about the sea state, by exploiting the measured power in each of the SAR images and the interferometric correlation between both acquisition channels.

This last quantity, sometimes referred to as interferometric coherence, is directly affected by the presence of surface waves. This provides a fantastic opportunity to measure, for the first time at a global scale, Significant Wave Height at kilometric resolutions (well below the reach of nadir altimeters) and in two dimensions. This, however, requires estimating all other sources of decorrelation of instrumental origin with an exquisite precision to avoid misinterpreting instrumental effects as geophysical signals.

In this talk, I will briefly describe how the interferometric acquisitions by KaRIn are calibrated and processed to obtain SWH maps in 2D at various km-scale resolutions (typically 2x2 km or 5x5 km), and discuss how the accuracy at which we need to estimate all the other sources of decorrelation varies with cross-track distance and actual SWH to highlight the most challenging regimes for the inversion. I will then present comparisons between the KaRIn two-dimensional SWH measurements and several independent sets of validation data, including data from SWOT’s nadir altimeter, from the SAR nadir altimeter on-board Sentinel-3, from MASS’s lidar, and from in-situ data. I will finish by discussing various physical features that can be observed in the retrieved SWH fields to illustrate that the high resolution and the two-dimensional character of SWOT measurements really open the door to the quantitative study of the processes that contribute to sea-state variations at small scales.

How to cite: Bohe, A., Chen, A., Chen, C., Dibarboure, G., Dubois, P., Fore, A., Hajj, G., Legresy, B., Lenain, L., Molero, B., Peral, E., Raynal, M., and Stiles, B.: Measuring Significant Wave Height fields in two dimensions at kilometric scales with SWOT, EGU General Assembly 2024, Vienna, Austria, 14–19 Apr 2024, EGU24-10457, https://doi.org/10.5194/egusphere-egu24-10457, 2024.

EGU24-10460 | Orals | OS4.5

Dynamical mapping of SWOT: performances from real observations 

Clement Ubelmann, Florian Le Guillou, Maxime Ballarotta, Emmanuel Cosme, Sammy Metref, and Marie-Hélène Rio

The Surface Water and Ocean Topography (SWOT) mission offers two-dimensional measurements of Sea Surface Height (SSH), capturing scales of a few tens of kilometers and enabling the study of previously unobserved short mesoscale dynamical structures. However, the mission faces technical challenges in maximizing scientific benefits, particularly during the science phase with its 21-day repeat orbit, which limits observations of small-scale structure evolution over time.

To address the challenge of high spatial and low temporal samplings, we propose an original dynamic interpolation scheme that we call 4Dvar-QG. This innovative method combines a weakly constrained, reduced-order, 4-dimensional variational scheme with a quasi-geostrophic model. The weak constraint of the quasi-geostrophic model on the inversion procedure ensures that the estimated maps closely match the observations while preserving the space-time continuity of the reconstructed structures.

The 4Dvar-QG method is applied in the North Atlantic Ocean on a constellation of real conventional altimeters and SWOT, during both the SWOT’s fast sampling and science phases. Performance evaluations are conducted through Observing System Experiments, utilizing independent data (such as altimetric and drifter data) as ground truth and comparing results to operational products like the Multiscale Interpolation Ocean Science Topography product (MIOST). The 4Dvar-QG method significantly improves the mapping of short energetic structures, reducing the root mean square error by up to 50% and increasing the effective resolutions by up to 30% compared to MIOST, while maintaining good reconstruction of large-scale and/or low energetic structures.


How to cite: Ubelmann, C., Le Guillou, F., Ballarotta, M., Cosme, E., Metref, S., and Rio, M.-H.: Dynamical mapping of SWOT: performances from real observations, EGU General Assembly 2024, Vienna, Austria, 14–19 Apr 2024, EGU24-10460, https://doi.org/10.5194/egusphere-egu24-10460, 2024.

EGU24-10813 | Orals | OS4.5

C-SWOT2023: a Mediterranean intensive field experiment in the framework of the SWOT fast sampling phase 

Pierre Garreau, Franck Dumas, Aurelien Ponte, Valerie Garnier, Ivane Pairaud, Khodia Sadji Ndiaye, and Margot Demol

The field experiment C-SWOT-2023 was carried out in North-Western Mediterranean Sea and aimed to support the new-generation SWOT altimeter (NASA/CNES) calibration and validation during its fast sampling phase. The daily overflight of the satellite between Marseille and Menorca was the opportunity to revisit the main aspects of the ocean circulation in the North-Western Mediterranean sub-basin such as the North Current, the Balearic Front or the eddy soup in the winter convection area.  The originality of the field experiment lies in the deployment of two research vessels (the R/V Thetys II for IFREMER and the R/V Atalante for the SHOM) that sailed along together to explore statistics of the surface ocean dynamics (vorticity, strain, divergence) that are seldomly accessible in fine scale observations. High resolution transects recording velocities, temperature and salinity in the first four hundred meters under the SWOT swaths were performed in order to disentangle the geostrophic and the ageostrophic part of the circulation. Dozens of drifting buoys have been dropped to assess the lagrangian aspect of the dynamics. A short overview of the 3D observations dataset will be proposed before focusing on the comparison between the dynamics experienced in situ and those observed remotely by SWOT.

How to cite: Garreau, P., Dumas, F., Ponte, A., Garnier, V., Pairaud, I., Ndiaye, K. S., and Demol, M.: C-SWOT2023: a Mediterranean intensive field experiment in the framework of the SWOT fast sampling phase, EGU General Assembly 2024, Vienna, Austria, 14–19 Apr 2024, EGU24-10813, https://doi.org/10.5194/egusphere-egu24-10813, 2024.

EGU24-11153 | ECS | Posters on site | OS4.5

Assimilation of wide swath satellite altimetry to map geostrophic and internal tide signals of the ocean dynamics  

Valentin Bellemin-Laponnaz, Florian Le Guillou, Emmanuel Cosme, Clément Ubelmann, and Eric Blayo

Mapping Sea Surface Height (SSH) from satellite altimetry is key to many scientific and operational applications. At the fine scales observed by SWOT, SSH variations are primarily driven by two types of dynamics - nearly geostrophic, Balanced Motion (BM) and wavy motion due to the Internal Tide (IT). These two processes differently affect ocean dynamics. The IT does not affect the surface horizontal transport of passive tracers (oil spills, plastics, algae…) unlike BM, but has a significant contribution to the vertical transport of heat, salt and nutrients. Separating BM and IT contributions to SSH variations will be essential in the mapping process. To a different extent, this separation is now common practice with high-frequency outputs of numerical simulations. Yet it is still an unresolved challenge for SSH maps computed with satellite observations like SWOT, which are sparse in space and time. 

This study introduces an innovative method to separate BM and IT components from SSH altimetric observations including SWOT. The method is based upon a data assimilation system combining two models - quasi-geostrophic for BM and linear shallow-water for IT. The inversion is performed with a weak-constraint four-dimensional variational (4DVar) approach, with two different sets of control parameters adapted to each component. A major, expected benefit of this approach lies in the potential to capture the non-stationary part of the internal tide component. The method outputs hourly SSH and surface velocity fields over a domain for both components. 

The work focuses on the North Pacific Ocean, because this zone has a strong mesoscale and submesoscale activity, including the two dynamics of interest. Observing System Simulation Experiments (OSSEs) are carried out over 20°x20° domains surrounding the SWOT crossovers. The experiments include both conventional Nadir and wide-swath SSH measurements, that are interpolated from the LLC4320 MITgcm simulation. The mapping algorithm performances are evaluated by comparing the outputs with the MITgcm referenced fields. The first results indicate that the assimilation system is able to separate the two targeted components, including the non stationary part of the internal tide. As this study is part of a PhD, the latest results available will be presented at the conference.

How to cite: Bellemin-Laponnaz, V., Le Guillou, F., Cosme, E., Ubelmann, C., and Blayo, E.: Assimilation of wide swath satellite altimetry to map geostrophic and internal tide signals of the ocean dynamics , EGU General Assembly 2024, Vienna, Austria, 14–19 Apr 2024, EGU24-11153, https://doi.org/10.5194/egusphere-egu24-11153, 2024.

EGU24-11336 | Posters on site | OS4.5

FaSt-SWOT field campaigns combining high-resolution observations and modelling for SWOT validation in the Western Mediterranean Sea 

Baptiste Mourre, Elisabet Verger-Miralles, Laura Gómez-Navarro, Bàrbara Barceló-Llull, Benjamin Casas, Vincent Combes, Eugenio Cutolo, Lara Diaz-Barroso, Maximo Garcia-Jove, Irene Lizarrán, Emma Reyes, Daniel Tarry, Nikolaos Zarokanellos, and Ananda Pascual

The FaSt-SWOT sea trial experiments, conducted in the Balearic Sea (Western Mediterranean Sea) between 25-28 April and 7-10 May 2023, aimed at collecting multi-platform in-situ observations of meso- and submesoscale ocean structures in the area covered by the SWOT satellite during its initial fast-sampling phase. The general objectives of the FaSt-SWOT project are twofold: 1) participate with these data to the satellite cal/val activities, and 2) improve the characterization and understanding of the fine-scale dynamics by combining in-situ multi-platform and satellite data with high-resolution numerical models and machine-learning-based computational techniques. The experiments consisted in 2 phases both using multi-scale ship-based instruments (CTD, Moving Vessel Profiler, thermosalinograph, ADCP and GoPros), autonomous platforms (surface drifters and gliders), and satellite observations (SST, ocean color and altimetry). In addition, 2km-resolution data-assimilative modelling simulations were produced to provide a complementary view of the fine-scale ocean variability. Finally, machine-learning-based optimization algorithms were also tested to define adaptive sampling strategies during the experiment. 

The sampling first focused on a 20km-diameter anticyclonic eddy detected under the swath of the satellite thanks to satellite imagery and drifter trajectories. Several cross-sections of the Moving Vessel Profiler and underwater gliders provided insights into the vertical structure of temperature and salinity fields and the associated signals in chlorophyll and dissolved oxygen. Two gliders were programmed to perform back-and-forth sections during a 3-week time with a 1-day delay between them, allowing to evaluate the temporal variability of the ocean fields at the period of repetitivity of the satellite. The second phase started 9 days after the end of the first one. A 48-hour dense radiator-like pattern was performed by R/V SOCIB, allowing to characterize the evolution of the small eddy observed during the first leg.  A total of 45 surface drifters were deployed during the two phases to evaluate in-situ surface currents and their associated convergence and divergence in the vicinity of the eddy. While conventional altimetry was not able to properly represent the sea level signature of the observed eddy, initial SWOT measurements indicate an improved detection capability by the new satellite. In addition, high-resolution numerical simulations reproduce a small anticyclonic eddy with similar characteristics as that of the observed eddy. These simulations are used to provide a more general understanding of the situation, indicate the origin of the eddy in the frontal area between recent and modified Atlantic waters, and provide insights into the vertical extension of the small mesoscale structure.  

We provide here an overview of the whole FaSt-SWOT dataset, including both observing and modelling components. A more detailed analysis of the measurements is provided in a companion presentation. 

How to cite: Mourre, B., Verger-Miralles, E., Gómez-Navarro, L., Barceló-Llull, B., Casas, B., Combes, V., Cutolo, E., Diaz-Barroso, L., Garcia-Jove, M., Lizarrán, I., Reyes, E., Tarry, D., Zarokanellos, N., and Pascual, A.: FaSt-SWOT field campaigns combining high-resolution observations and modelling for SWOT validation in the Western Mediterranean Sea, EGU General Assembly 2024, Vienna, Austria, 14–19 Apr 2024, EGU24-11336, https://doi.org/10.5194/egusphere-egu24-11336, 2024.

EGU24-11687 | Posters on site | OS4.5

High-frequency sea level temporal variability estimate from SWOT KaRIn and Sentinel-3A/B crossovers 

Anne Barnoud, Robin Fraudeau, Noémie Lalau, Marie Bouih, Michaël Ablain, Matthias Raynal, Gérald Dibarboure, and François Boy

The observation of sea level variability on very small time scales ranging from less than an hour to a few days is currently very limited with the constellation of nadir altimeter satellites. Calculating sea surface height at crossovers between a single mission or several nadir altimeter missions makes it possible to analyse the sea level variability on these very short timescales for a small number of measurements (a few hundred). Moreover, these observations are spatially sparsely distributed, most often at very high latitudes for crossovers of less than a few hours of time difference.

Thanks to the launch of the joint CNES/NASA SWOT mission in December 2022 with swath measurements, a new paradigm for observing high-frequency temporal variability in sea level is now possible. SWOT KaRIn instrument offers 2D observations of the oceans with an unprecedented coverage and resolution. We take advantage of this new high quality dataset to estimate the sea level variability over short time scales. The crossovers of SWOT KaRIn during the 1-day orbit phase with itself and with Sentinel-3A/B nadir observations less than 1 hour to 72 hours of time difference from 17/04/2023 to 07/07/2023 are analysed. The crossovers with Sentinel-3A/B offer a very good spatial sampling of the oceans which cannot be reached with SWOT crossovers only. We analyse the variance of the sea surface height differences at the crossovers, as a function of time difference and of latitude. The variability of the sea surface height differences at the crossovers contains both the sea level variability and the instrumental errors. We attempt to disentangle the errors from the sea level variability. Sea surface height differences variance with time differences tending to 0 hours, hence free of oceanic variability, amount to ~3.2-3.5 cm. This value increases fastly with time difference up to about 4 hours as the contribution of sea level variability and errors increase. With time differences of 4 hours, the sea surface height differences variance reaches 4 cm. Then, the increase of the sea surface height differences variance slows down, as some phenomena are not correlated anymore, and roughly linearly increases to reach 5 cm for time differences of 72 hours.

How to cite: Barnoud, A., Fraudeau, R., Lalau, N., Bouih, M., Ablain, M., Raynal, M., Dibarboure, G., and Boy, F.: High-frequency sea level temporal variability estimate from SWOT KaRIn and Sentinel-3A/B crossovers, EGU General Assembly 2024, Vienna, Austria, 14–19 Apr 2024, EGU24-11687, https://doi.org/10.5194/egusphere-egu24-11687, 2024.

EGU24-12599 * | Orals | OS4.5 | Highlight

A breakthrough of radar remote sensing of the ocean: the  Surface Water and Ocean Topography (SWOT) Mission 

Lee-Lueng Fu, Rosemaary Morrow, J. Thomas Farrar, and Jinbo Wang

Remote sensing of Earth’s surface water is crucial to the study of climate change and its impact to society.  Radar remote sensing is particularly important because it penetrates cloud cover, providing observations under all weather conditions.  Forty years ago, Seasat, the first satellite designed for studying the ocean from space, laid the foundation of radar remote sensing of the ocean with radar altimeter, scatterometer, and synthetic aperture radar (SAR). The first two have become the pillars of a global observing system that has revolutionized oceanography. Precise measurement of sea surface height by radar altimetry has provided a modern record of global sea level change and the state of ocean circulation, but its spatial resolution is limited by the large radar footprint (~20 km) and measurement noise, making it difficult to study small-scale, rapidly changing ocean processes, especially near coasts.

While SAR provides high-resolution images of many features of the ocean and land waters, it is difficult to derive quantitative information to study the underlying dynamics. Using the phase differences of consecutive SAR observations (a technique called radar interferometry) has allowed determination of the slow movement of ice sheets since the early 1990s. In the early 2000s, a mission was conducted onboard the Space Shuttle to map the earth’s land topography. The concept of applying radar interferometry onboard a satellite for oceanography and land hydrology was developed in the 2000s. Twenty years later the global mission called Surface Water and Ocean Topography (SWOT) was launched in December 2022.

We will present early results from SWOT with a focus on the ocean. The fundamental advancement of SWOT is the capability of observing the elevation of the ocean surface and with the resolution of SAR.  The spatial resolution of the resolved ocean dynamics more than an order of magnitude better than in conventional altimetry, enabling the study of small-scale ocean eddies and fronts that are essential to the ocean’s heat and carbon uptake from the atmosphere. The increased resolution will also advance the study of near shore processes to assess the coastal impact of sea level rise and severe weather.


How to cite: Fu, L.-L., Morrow, R., Farrar, J. T., and Wang, J.: A breakthrough of radar remote sensing of the ocean: the  Surface Water and Ocean Topography (SWOT) Mission, EGU General Assembly 2024, Vienna, Austria, 14–19 Apr 2024, EGU24-12599, https://doi.org/10.5194/egusphere-egu24-12599, 2024.

EGU24-13200 | Posters on site | OS4.5

New insight into the ocean mesoscale field at the Nordic high latitudes 

Antonio Bonaduce, Roshin Raj, Fabio Mangini, Artem Moiseev, and Johnny Johannesen

The Norwegian Atlantic Current contributes fundamentally to the temperate climate of northwestern Europe and maintains an ice-free ocean well into the Barents Sea even in winter. The interaction between the two branches of the Norwegian Atlantic Current is not known in detail but is generally understood to be mediated by mesoscale eddies. In particular, the Lofoten Basin appears as a hot-spot of mesoscale activity in several studies in the literature, based on conventional altimetry. While satellite altimetry has made a fundamental contribution to our understanding of ocean circulation, the current constellation of nadir altimeters does not allow for resolving the spatial and temporal scales characterizing the intensification and dissipation of the mesoscale features. The Surface Water and Ocean Topography (SWOT) mission, based on Ka-band Radar Interferometry (KaRIn), extends the capability of existing nadir altimeters to two-dimensional mapping of the ocean surface at an unprecedented spatial resolution. The fast-sampling phase (1-day repeat) of the mission also allowed for resolving the temporal evolution of mesoscale eddies. The Lofoten Basin is located in an area where the SWOT tracks cross, which was sampled twice a day over 90 days in 2023. Building on this unique opportunity, the results presented in this work rely on both the fast-sampling and science (21-day repeat) phases of the SWOT mission to show a comparison of KaRIn retrievals with conventional altimeters and characterize the representation of the mesoscale field emerging from the different altimetry concepts.

How to cite: Bonaduce, A., Raj, R., Mangini, F., Moiseev, A., and Johannesen, J.: New insight into the ocean mesoscale field at the Nordic high latitudes, EGU General Assembly 2024, Vienna, Austria, 14–19 Apr 2024, EGU24-13200, https://doi.org/10.5194/egusphere-egu24-13200, 2024.

EGU24-13614 | Orals | OS4.5

Early Assessment of SWOT’s Swath-mapping Capabilities over Arctic Sea Ice 

Sinead L. Farrell, Reint Fischer, Kyle Duncan, Donghui Yi, John M. Kuhn, Eric Leuliette, and Laurence Connor

The routine measurement of sea ice, an essential climate variable, is urgently needed for improving seasonal sea ice forecasting and tracking ocean-ice-atmosphere interactions. Over the last few decades, ocean remote sensing techniques have revealed significant and rapid declines in both the extent and volume of Arctic sea ice, driven by accelerated warming at high northern latitudes. The Surface Water Ocean Topography (SWOT) mission delivers innovative wide-swath Ka-band synthetic aperture radar (SAR) interferometry and coincident Ku-band altimetry and provides, for the first time, swath mapping of sea ice from a space-based system. The novel SWOT technology can be exploited to advance knowledge of sea ice processes and properties. Although SWOT’s latitudinal limit of coverage is 78° N, this is nevertheless sufficient for mapping the seasonal sea ice zone in the Arctic which develops, grows and deforms in winter and typically reaches a maximum in the month of April. SWOT can obtain measurements across ~9-10 million square kilometers of Arctic sea ice in April. It's high-resolution swath-mapping approach captures sea ice surface topography in two dimensions, both along- and across-track. This new capability allows us to determine the areal fraction and shape of individual sea ice floes, map the 2D structure of leads, identify the ice edge location in higher fidelity than has heretofore been possible, and simultaneously measure sea ice height, from which sea ice freeboard and hence thickness may be derived. Here we show the results of our initial assessment of SWOT data collected during the 1-day fast repeat orbit phase. This particular sampling strategy allows us to track individual sea ice floes and derive high resolution estimates of ice drift velocity. SWOT backscatter signatures over sea ice are also used to discriminate between rough sea ice floes and smooth, specular  leads. We evaluate SWOT backscatter using high-resolution measurements of sea ice roughness derived from spatially-coincident ICESat-2 laser altimetry data.  We also show the feasibility of using the 2D swath-mapping capabilities of SWOT in concert with ICESat-2 sea ice height profiles to map the joint floe size-ice thickness distribution. Our results demonstrate the many benefits of swath mapping altimetry for polar sea ice studies.

How to cite: Farrell, S. L., Fischer, R., Duncan, K., Yi, D., Kuhn, J. M., Leuliette, E., and Connor, L.: Early Assessment of SWOT’s Swath-mapping Capabilities over Arctic Sea Ice, EGU General Assembly 2024, Vienna, Austria, 14–19 Apr 2024, EGU24-13614, https://doi.org/10.5194/egusphere-egu24-13614, 2024.

Coastal-to-land sites are mostly affected by climate changes and are at multi-risks due to coastline retreat, flooding storms and river floods. New altimeter processing and new missions open new possibilities to observe fine-scale spatial changes in this region. Our hypothesis is that new altimetry remote sensing observations from the Delay Doppler nadir-altimetry and wide swath altimetry can make an unprecedented progress at monitoring the river-to-ocean continuum and understanding estuarine and coastal hydrodynamic processes.

Aim of this study is the interaction between river discharge and coastal sea level in the Elbe estuary and tidal river. Region of analysis are the German coasts and Elbe estuary and tidal river. This last is under the SWOT cal/val track. SWOT’s unique, high-resolution 2D observations, combined with the field campaign data, other satellite data and models, is expected to provide a new view of many dynamical phenomena from ocean and nearshore zones to coastal and estuarine contexts.

We consider the Fully-Focus (FF-SAR) processing near coast. We show that results depend on the retracking method and that land contamination is also affecting FF-SAR. The  SAMOSA+ retracker gives the best results for both FFSAR and unfocused SAR (USAR).

The ability of regional ocean models to reproduce tides and the high variability at fine spatial-scale is investigated. Ocean simulation sea level is compared to nadir-altimetry along the satellite ground tracks. We show that while the coverage of nadir-altimeter is limited by the number of ground-tracks, SWOT, that provides a uniform coverage, is less affected by land contamination. We investigate the SWOT mission data. First results with low resolution 2 km x 2 km data indicate good agreement with in-situ gauges with 20-30 cm standard deviation from in-situ tide gauge stations. SWOT enhanced resolution data at 250m x 250m and higher resolution data are further investigated to more accurately monitor nearshore, estuarine, and the sea-ice interface. Due to the differences between along-track and swath-altimetry, new methods to derive accuracy and precision of the measurements and derived ocean parameters are developed. Using a large network of in-situ, model and nadir-altimetry data we perform the calibration and the validation of the SWOT products assessing the relevance of SWOT for improving numerical models over all the Elbe tidal river.


We would be interested in submitting our presentation to a peer reviewed special issue in Ocean Sciences.


How to cite: Fenoglio-Marc, L.: Monitoring the Elbe estuary and coastal zone with SWOT and nadir-altimeters , EGU General Assembly 2024, Vienna, Austria, 14–19 Apr 2024, EGU24-14849, https://doi.org/10.5194/egusphere-egu24-14849, 2024.

EGU24-15396 | ECS | Orals | OS4.5

A framework for early-stage coastal and estuarine tidal and mean sea surface correction from the Surface Water Ocean Topography mission 

Thomas Monahan, Tianning Tang, Stephen Roberts, and Thomas Adcock

The NASA Surface Water Ocean Topography mission (SWOT), launched on 16 December 2022, will provide the highest spatial and temporal altimetric measurements of coastal oceans to date. The mission is ideally suited to studying mesoscale and submesoscale processes and is expected to enhance our understanding of coastal tides greatly. Although improved tidal analysis and prediction is, of course, useful for studying tides, arguably more important is the accurate removal of tidal variability from SWOT observations. This is a consequence of the fact that the tidal signal often dominates other sub-mesoscale processes which are of high interest to SWOT researchers. While SWOT presents unprecedented spatial resolution, the temporal sparsity renders the applications of conventional tidal analysis methods difficult in the early stages of the mission. Despite significant improvements in global and regional barotropic tidal models in the past few decades, the complexity of coastal and estuarine tides as well as the relatively limited in-situ measurements available for assimilation can lead to significant errors when used for tidal corrections. Further complications are introduced by the uncertainty in mean sea surface (MSS) estimates from gridded MSS Products. These errors can account for large percentages of the global Sea Level Anomaly error and grow significantly over rough bathymetry. As such, the accurate assessment of the uncertainty for the released data products and corrections derived from primary SWOT data are critical to the early success of SWOT science teams. We develop a fully Bayesian variant of tidal harmonic analysis to achieve tidal super-resolution and MSS correction for early-stage (<1 year) SWOT data products. Our approach can be applied to any location, without prior knowledge of bathymetry or gauge constraints but provides a natural framework for integrating physical priors, historical altimetry measurements, gauge constraints, and even spatial coherence. By taking a variational approach, the method avoids the computational bottlenecks presented by standard Bayesian methods. Additionally, we model the MSS as an additional parameter within the model, which yields provably accurate mean sea surface corrections and uncertainty approximation. A new constituent selection criterion is developed and provides reliable tidal constituent super-resolution when compared to standard methods (e.g. Rayleigh, Munk-Hasselman). We apply our variational Bayesian tidal analysis to simultaneously correct the mean sea surface and tidal correction errors present in the Bristol Channel SWOT Cal/Val site. We develop several 2-D Sea Surface models to illustrate how the Bayesian approach can integrate varying degrees of prior information, and tackle the challenging problem of tidal deformation. Additionally, results on simulated data indicate that the variational Bayesian harmonic analysis can significantly reduce the global error in both the estimated M2, N2, and S2 constituents and MSS after only 1 year of SWOT science orbit. Thus, we present our variational Bayesian tidal analysis as both a standalone tidal analysis tool and a specialized tool for SWOT empirical tidal and MSS correction. Our approach (VTide) will be released as part of the open-source Python package OTide in spring 2024. 

How to cite: Monahan, T., Tang, T., Roberts, S., and Adcock, T.: A framework for early-stage coastal and estuarine tidal and mean sea surface correction from the Surface Water Ocean Topography mission, EGU General Assembly 2024, Vienna, Austria, 14–19 Apr 2024, EGU24-15396, https://doi.org/10.5194/egusphere-egu24-15396, 2024.

EGU24-15790 | Posters on site | OS4.5

Overview of SWOT ocean surface topography performance  

Pierre Prandi, Matthias Raynal, Emeline Cadier, Francesco Nencioli, Benjamin Flamant, Gérald Dibarboure, Bryan Stiles, Clement Ubelmann, and Antoine Delepoulle

The SWOT mission was launched in December 2022. Its first of a kind KaRIn instruments provides two dimensionnal images of ocean surface topography over a 120 km wide swath. Ocean surface topography data quality and mission performance have been assessed and monitored over the first year of SWOT mission, as part of mission performance activities performed by the mission project.

Here we present a synthesis of SWOT mission performances over ocean: from data availability and validity to end-to-end performance metrics (eg SSH differences at crossovers, wavenumber spectrum and comparison with the current nadir altimetry constellation). We also discuss the performance of cross-calibration algorithms at level 2 (based on crossovers) and level 3 (based on other altimeters). Results presented here are based on the analysis of the 2 km product during both the calval (1 day repeat orbit) and science (21 day repeat orbit) phases and focused on ocean surface topography retrievals. All mission CalVal metrics highlight the excellent performance of KaRIn measurements.  

We also present some known limitations of current SWOT products that are of interest to science users.

How to cite: Prandi, P., Raynal, M., Cadier, E., Nencioli, F., Flamant, B., Dibarboure, G., Stiles, B., Ubelmann, C., and Delepoulle, A.: Overview of SWOT ocean surface topography performance , EGU General Assembly 2024, Vienna, Austria, 14–19 Apr 2024, EGU24-15790, https://doi.org/10.5194/egusphere-egu24-15790, 2024.

EGU24-16006 | Posters on site | OS4.5

Fine scales structures of the Abrolhos Bank circulation from SWOT data early results 

Fabrice Hernandez, Alex Costa, and Marcus Silva

In the frame of the SWOT satellite cal/val initiative in Brazil, the University Federal of Pernambuco ship Ciencias do Mar IV has performed successive survey in May and September 2023 over the Abrolhos Bank (17-20°S along the Brazilian coast). In situ measurements, as well as moored data have been collected, in order to be compared to SWOT sea surface height retrievals, but also Copernicus Marine Service operational products in quasi-real time. The objective of this work are two-fold. First characterize the coastal to open ocean continuum of ocean variability in this shallow area during the surveys, and second evaluate both the SWOT and operational oceanography products in providing realistic representation of the high frequency scales. The first results show the dominance of the tidal dynamics over the Banks, and the influence of the wind and the sea-state variability. However, the Brazil Current patterns and associated mesoscales features are well captured by satellite data and models. Further work will evaluate the benefit of SWOT short scale information to improve our understanding of meso to submesoscale interactions in the area.

How to cite: Hernandez, F., Costa, A., and Silva, M.: Fine scales structures of the Abrolhos Bank circulation from SWOT data early results, EGU General Assembly 2024, Vienna, Austria, 14–19 Apr 2024, EGU24-16006, https://doi.org/10.5194/egusphere-egu24-16006, 2024.

EGU24-16040 | Orals | OS4.5

Towards mapping total currents and winds during the BioSWOT-Med campaign with the OSCAR airborne instrument 

Adrien Martin, Eva Lemerle, David Mccann, Karlus Macedo, Daria Andrievskaia, Christine Gommenginger, and Tania Casal

The BioSWOT-Med cruise focused on the Western Mediterranean Sea, known for its rich plankton biodiversity under oligotrophic and moderate energy conditions. The cruise aimed to investigate the role of fine-scale circulation as a driver of plankton diversity, coinciding with the SWOT satellite's daily "fast-sampling" orbit over the same region. SWOT, with its high-resolution 2D observations of sea surface height at 15-120km spatial scale, offered a unique perspective on ocean dynamics.
Mesoscale and submesoscale currents play a crucial role in ocean-atmosphere interaction and marine biosphere processes. The SeaSTAR satellite mission concept (former ESA Earth Explorer 11 candidate at phase 0), is designed to observe small-scale ocean surface dynamics with a remarkable 1 km resolution, contributing to our understanding of carbon, water, energy, gases, and nutrient exchanges across various Earth systems.
To prepare for the SeaSTAR mission, the OSCAR (Ocean Surface Current Airborne Radar) airborne instrument was developed, providing a synoptic 2D view of ocean and atmosphere dynamics, including currents, waves, and winds, at fine scale. During the SEASTARex campaign in May 2022 over the Iroise Sea in Brittany, France, OSCAR demonstrated excellent performance against various measurements, including marine radar, ADCP, and HF radar.
Building on OSCAR's success, a campaign was organized in May 2023, coinciding with the Bio-SWOT campaign, to fly together with SWOT over a non-tidal dominated area, mapping small-scale dynamics. Satellite SAR images from various sources, including RCM, TerraSAR-X, Sentinel-1, RadarSat-2, and PAZ SAR, were collected for comparative analysis with OSCAR and SWOT data.
Initial comparisons between OSCAR and satellite data, spanning remote sensing instruments like SWOT, SAR imagers, and optical sensors, showed a high level of agreement. SWOT data, analyzed with a diverse dataset, promises to enhance understanding and characterization of dynamics observed in the new 2D images.
OSCAR's Doppler and scatterometry capabilities offer a fresh perspective on dynamic processes, particularly at fine scales, bridging the gap between in-situ point measurements and space-based sensors. The ongoing synergy between OSCAR and satellite data holds potential to advance our understanding of oceanic and atmospheric phenomena, addressing critical challenges related to climate, weather, and marine ecosystems.

How to cite: Martin, A., Lemerle, E., Mccann, D., Macedo, K., Andrievskaia, D., Gommenginger, C., and Casal, T.: Towards mapping total currents and winds during the BioSWOT-Med campaign with the OSCAR airborne instrument, EGU General Assembly 2024, Vienna, Austria, 14–19 Apr 2024, EGU24-16040, https://doi.org/10.5194/egusphere-egu24-16040, 2024.

EGU24-17256 | Posters on site | OS4.5

Integrating SWOT with autonomous platforms: the case of the BioSWOT-Med biogeochemical front 

Riccardo Martellucci, Marco Bellacicco, Milena Menna, Maristella Berta, Aude Joel, Massimo Pacciaroni, Elena Mauri, Giulio Notarstefano, Pierre.Marie Poulain, Luca Centurioni, Anthony Bosse, Anne Petrenko, Maxime Arnauld, Pascale Bouruet-Aubertot, Bàrbara Barceló-Llull, Roxane Tzortzis, Louise Rousselet, Robin Rolland, Sven Gastauer, Mark D. Ohman, Francesco d'Ovidio, and Andrea Doglioli

The BioSWOT-Med cruise was carried out in the northwestern Mediterranean Sea during the fast-sampling phase of the satellite SWOT mission (fixed tracks were revisited every 24h), contributing to the international efforts of studying the oceanic submesoscale to mesoscale (1 to 100 km) dynamics. This region is an ideal natural laboratory for fine-scale biogeochemistry as its dynamics sustains strong contrasts associated with high production in the north (Gulf of Lions) and oligotrophic conditions with moderate energy in the south. The BioSWOT-Med cruise used an adaptive and Lagrangian sampling strategy, determined from near-real time satellite observations analysis, combining in-situ shipborne measurements with drifters, ocean gliders and Biogeochemical (BGC)-Argo floats, to achieve high spatio-temporal resolution multidisciplinary measurements within SWOT swaths. In this work, we present the preliminary outcomes derived by autonomous platforms (BGC-Argo floats, gliders, and surface drifters) with high-frequency sampling. Drifters combined with SWOT observations have been able to disentangle distinct features such as frontal zones, cyclones, anticyclones, and filaments. BGC-Argo floats collected measurements within an anticyclonic eddy visible in SWOT images but unresolved by conventional altimetry, and within a meander of the North Balearic front. The frontal area is influenced by saltier and colder Atlantic origin Water to the north and younger Atlantic Water to the south, resulting in a strong horizontal salinity gradient (~0.4 PSU). Chlorophyll concentrations co-varied with these frontal features and showed remarkable variations both at the surface and in the Deep Chlorophyll Maximum, with strong vertical gradients. As revealed by gliders measurements, the anticyclonic eddy, located south of the front, was characterised by fresher, warmer, and less productive Atlantic Water, and exhibited a distinct horizontal gradient compared with waters north of the front. Using both optical imaging and dual-frequency active acoustics, Zooglider revealed a marked change in the community of grazing zooplankton in the eddy center. The BGC-Argo floats equipped with chlorophyll and backscatter sensors also allowed estimating ocean productivity in terms of Net Community Production (NCP) which provided new insights about the link between ocean production and physical processes.  

This study demonstrates the importance of performing a synergic approach combining unprecedented high resolution satellite observations from SWOT and autonomous platforms (BGC-Argo floats, gliders, and drifters) to resolve the biological and physical interactions at fine scales.

How to cite: Martellucci, R., Bellacicco, M., Menna, M., Berta, M., Joel, A., Pacciaroni, M., Mauri, E., Notarstefano, G., Poulain, P. M., Centurioni, L., Bosse, A., Petrenko, A., Arnauld, M., Bouruet-Aubertot, P., Barceló-Llull, B., Tzortzis, R., Rousselet, L., Rolland, R., Gastauer, S., Ohman, M. D., d'Ovidio, F., and Doglioli, A.: Integrating SWOT with autonomous platforms: the case of the BioSWOT-Med biogeochemical front, EGU General Assembly 2024, Vienna, Austria, 14–19 Apr 2024, EGU24-17256, https://doi.org/10.5194/egusphere-egu24-17256, 2024.

EGU24-17343 | Orals | OS4.5

Complex 3-D oceanic velocities at SWOT scales exhibited during the spring 2023 BioSWOTMed cruise 

Anne A Petrenko, Maxime Arnaud, Stéphanie Barrillon, Caroline Comby, Jean-Luc Fuda, Léo Berline, Anthony Bosse, Louise Rousselet, Robin Rolland, Pascale Bouruet-Aubertot, Laurina Oms, Margot Demol, Morgane Didry, Sven Gastauer, Massimo Pacciaroni, Maristella Berta, Francesco d'Ovidio, Gerald Gregori, and Andrea Doglioli

During the SWOT fast sampling phase in spring 2023, the BioSWOTMed cruise (https://doi.org/10.17600/18002392) sampled for four weeks a front located on both the western and eastern swaths of the 003 SWOT pass, about 100 km northeast of Menorca, in the Western Mediterranean Sea. The front coincided to a portion of the north Balearic front. The front was modulated by the presence of eddies of small Rossby radius (of the order of 20-30km), not visible in conventional altimetry maps. The availability of cloud-free images of ocean color (OLCI) for five consecutive days also revealed the presence of various submesoscale structures and part of their life cycle. The front consisted of a strong roughly eastward meandering jet, separating cold, salty and more productive waters (modified Atlantic Water) in the north from warm, fresher and more oligotrophic waters (younger Atlantic Water) in the south. In addition to classical hydrological, glider, drifters/floats and moving vessel profiler (MVP) measurements, 3D oceanic velocities were measured by 3 ship-mounted acoustic Doppler current profilers (ADCPs), 2 lowered-ADCPs, 1 free-falling newer generation 5-beam ADCP and 2 autonomous vertical velocity profilers. The jet had horizontal velocities up to ~0.35 m.s-1 (0-300 m average), with a cross-jet distance of ~40 km and a vertical extension of 200 m. 1m-surface drifters deployed in the core of the jet traveled at a speed of ~0.5 m.s-1. Two northerly storms generated intense near-inertial waves interacting in the mesoscale field of several eddies sampled by the ship. Cyclogeostrophic velocities derived from SWOT are in good agreement with the measured ADCP (horizontal) velocities. The normalized relative vorticity provides a regional view of the complex oceanic circulation of the jet meandering between various mesoscale eddies and interacting with submesoscale structures. The high variability of vertical velocities (+/- 1.5 cm.s-1) of various origins masks the expected cross-frontal ageostrophic circulation. The finescale 3D circulations observed and well captured at the surface by SWOT are also associated with complex biological content distribution.

How to cite: Petrenko, A. A., Arnaud, M., Barrillon, S., Comby, C., Fuda, J.-L., Berline, L., Bosse, A., Rousselet, L., Rolland, R., Bouruet-Aubertot, P., Oms, L., Demol, M., Didry, M., Gastauer, S., Pacciaroni, M., Berta, M., d'Ovidio, F., Gregori, G., and Doglioli, A.: Complex 3-D oceanic velocities at SWOT scales exhibited during the spring 2023 BioSWOTMed cruise, EGU General Assembly 2024, Vienna, Austria, 14–19 Apr 2024, EGU24-17343, https://doi.org/10.5194/egusphere-egu24-17343, 2024.

EGU24-17489 | ECS | Posters on site | OS4.5

Cyclogeostrophic inversion for estimating Sea Surface Currents from SWOT altimeter data 

Vadim Bertrand, Victor E V Z De Almeida, Julien Le Sommer, and Emmanuel Cosme

The spatial resolution of the Sea Surface Height (SSH) observations provided by the SWOT mission opens unprecedented perspectives for estimating ocean near surface circulation at scales <100km. The geostrophic balance, which relates the pressure gradient, the current velocity, and the Coriolis force, is commonly employed to estimate Sea Surface Currents (SSC) from SSH. This equation represents a drastic approximation of the Navier-Stokes equations adapted to mesoscales and larger scales ocean dynamics, which neglects in particular the velocity advection term. However, it is known that at the scales allowed by SWOT's observations, the advection term can no longer be neglected in the leading order balance, especially in highly energetic regions.
But solving the cyclogeostrophic balance equation, which includes the advection term, can not be achieved analytically, and requires the use of numerical methods. Still, (1) existing iterative approaches are known to diverge, and ad-hoc procedures are required to avoid local discontinuities; (2) publicly available implementations are missing.

To overcome these limitations, we propose a new Python package, named jaxparrow. jaxparrow formulates the cyclogeostrophic balance as a variational problem and solves this problem using state-of-the-art optimization procedures. Its implementation heavily relies on JAX, a Python library which brings together automatic differentiation and just-in-time compilation. In this presentation, we will describe the variational formulation of the cyclogeostrophic balance inversion and demonstrate the performance of this approach with high resolution ocean model data.
We will then illustrate how global estimates of cyclogeostrophic SSC can be obtained from altimeter data by combining jaxparrow with existing SSH mapping techniques, and  describe how cyclogeostrophic corrections may improve our ability to estimate SSC from SWOT ocean data.

How to cite: Bertrand, V., E V Z De Almeida, V., Le Sommer, J., and Cosme, E.: Cyclogeostrophic inversion for estimating Sea Surface Currents from SWOT altimeter data, EGU General Assembly 2024, Vienna, Austria, 14–19 Apr 2024, EGU24-17489, https://doi.org/10.5194/egusphere-egu24-17489, 2024.

EGU24-17494 | ECS | Posters on site | OS4.5

Internal wave–eddy interactions, turbulence and mixing during the 2023 BioSWOT-MED cruise 

Robin Rolland, Pascale Bouruet-Aubertot, Yannis Cuypers, Elvira Pulido, Anthony Bosse, Anne Petrenko, Sandra Nunige, Louise Rousselet, Stéphanie Barrillon, Maristella Berta, Maxime Arnaud, Milena Menna, Massimo Pacciaroni, Roxane Tzortzis, Bàrbara Barceló-Llull, Francesco d'Ovidio, Gérald Grégori, and Andrea Doglioli

The BioSWOT-MED cruise (https://doi.org/10.17600/18002392) was designed to study the bio-physical coupling in the region of the North Balearic Front in the Western Mediterranean Sea, an area of moderate fine scale energy level. The cruise took place during the SWOT fast-sampling phase in April-May 2023 thus providing a unique opportunity to study the daily evolution of mesoscale eddies and fine scale structures as inferred from SWOT in combination with high frequency in-situ measurements.

In-situ measurements were focused on a fine scale front identified from SWOT altimetry data and Chl-a gradient from remote sensing (Sentinel-3). The front was located at the northern margin of a small mesoscale anticyclonic eddy (~30 km of diameter, too small to be detected by conventional altimetry maps), from a cyclonic area. Preliminary results revealed strong wave-eddy interactions. Two triplets of 24-h Lagrangian stations (the boat is passively advected by the current to follow the water mass sampled) were performed during the cruise with one station at the front and two on both sides. At the end of the cruise, a third 24-h station was conducted in the anticyclonic eddy.

Two consecutive wind events (~25–30 kn) before the second and third sets of stations allowed us to observe and characterise the generation of near-inertial waves (NIWs) and their propagation at depth. Whereas NIWs amplitude was uniformly small during the first triplet of stations, contrasted NIWs amplitudes were observed after the wind events. A remarkable intensification of NIWs in the anticyclonic eddy was observed at the last station with amplitudes reaching up to ~0.4 m/s down to ~300 m, in strong contrast with weak NIW amplitudes in the frontal and the cyclonic area. An inertial chimney trapping NIWs can be evidenced within the anticyclonic eddy. Vertical Microstructure Profiler measurements showed that those trapped NIWs significantly enhanced turbulence and mixing activity in the anticyclonic eddy through intense shear generation. Contrasts in vertical nutrients fluxes between the inertial chimney in the anticyclonic eddy, the front and the cyclonic area are finally discussed.

How to cite: Rolland, R., Bouruet-Aubertot, P., Cuypers, Y., Pulido, E., Bosse, A., Petrenko, A., Nunige, S., Rousselet, L., Barrillon, S., Berta, M., Arnaud, M., Menna, M., Pacciaroni, M., Tzortzis, R., Barceló-Llull, B., d'Ovidio, F., Grégori, G., and Doglioli, A.: Internal wave–eddy interactions, turbulence and mixing during the 2023 BioSWOT-MED cruise, EGU General Assembly 2024, Vienna, Austria, 14–19 Apr 2024, EGU24-17494, https://doi.org/10.5194/egusphere-egu24-17494, 2024.

EGU24-17643 | ECS | Orals | OS4.5

Analysis of fine-scale dynamics in the Balearic Sea through high-resolution observations and SWOT satellite data 

Elisabet Verger-Miralles, Baptiste Mourre, Bàrbara Barceló-Llull, Laura Gómez-Navarro, Daniel R. Tarry, Nikolaos Zarokanellos, and Ananda Pascual

The FaSt-SWOT experiments aim to integrate SWOT measurements with in-situ observations from two high-resolution multi-platform ocean campaigns and advanced data-assimilative models. The goal is to evaluate the performance of the satellite, characterize fine-scale (10-100 km) dynamics and quantify the associated horizontal and vertical transports. The FaSt-SWOT experiments were specifically designed to collect multi-platform in-situ observations within the swath of the SWOT satellite for validation, focusing on the area around the Balearic Sea. The campaigns took place in April and May 2023 and involved the simultaneous use of various ship-based instruments (CTD, Moving Vessel Profiler (MVP), thermosalinograph, ADCP, GoPros), autonomous platforms (surface drifters and gliders), and satellite observations (SST, ocean color, altimetry).

In this presentation, we will focus on the analysis and processing of the multi-platform data collected during FaSt-SWOT. The sampling location was defined a few days before the first experiment based on the presence of a remarkable small-scale anticyclonic eddy (~20 km-diameter) detected in SST imagery and in the trajectory of a drifter within one of the SWOT swaths north of the Ibiza Island. Subsequent SST and ocean color maps showed the temporal evolution of the sampled eddy, which evolved into finer-scale features. Therefore, the context was ideal for analyzing SWOT's capability to detect this type of small structures. Indeed, the signature of the eddy was detected in the first sea level maps provided by SWOT and unresolved by conventional altimetry.

The analyzed data consist of ~1000 MVP profiles of temperature and salinity from the surface down to a depth of 200 m along the ship trajectory (100 m during the first phase), combined with CTD rosette casts at fixed stations down to 700 m depth. Additionally, we will present data from two gliders that conducted 2 back-and-forth transects along the satellite swath with a 1-day delay between them, and the data from the 45 surface drifters deployed during both phases of the experiment. We will discuss the processing of the MVP observations, as well as the cross-calibration performed between CTD, MVP, and gliders measurements. This is a really important step to ensure that we are providing accurate and reliable quality-controlled observations, as well as a necessary process since these data will be available. Finally, we will provide a comparison between in-situ observations and SWOT data, and an analysis of the dynamics in the sampled area.

How to cite: Verger-Miralles, E., Mourre, B., Barceló-Llull, B., Gómez-Navarro, L., R. Tarry, D., Zarokanellos, N., and Pascual, A.: Analysis of fine-scale dynamics in the Balearic Sea through high-resolution observations and SWOT satellite data, EGU General Assembly 2024, Vienna, Austria, 14–19 Apr 2024, EGU24-17643, https://doi.org/10.5194/egusphere-egu24-17643, 2024.

Disentangling balanced eddy and unbalanced wave motions from the oceanic Sea Surface Height (SSH) fields, is a complex problem made even more challenging due to their non-linear interactions. The high resolution SSH snapshots from the recently launched Surface Water and Ocean Topography (SWOT) program will include scales down to O(10) km and resolve internal gravity waves (IGWs). At these scales the IGW signatures co-existing with those of the balanced motions pose two major challenges: (i) disentangling IGWs from balanced motions at the ocean surface, a regime with small scale separation and Rossby number near unity, and (ii) detecting IGW signals from two-dimensional snapshots. Here we address these challenges by using state-of-art flow decomposition methods combined with machine learning (ML) for a range of flow regimes.

The currently available flow decomposition methods rely on three-dimensional flow fields and methods to separate these motions from two-dimensional snapshots are currently non-existent. Here we develop a novel method using supervised ML to extract IGWs from snapshots of a flow field and apply it to SWOT SHH field. The initial training and testing is done using Convolution Neural Network algorithms, often used for instance in image classification and pattern recognition problems. The neural network (NN) is trained to detect IGWs in different dynamical regimes based on the decomposition outputs of velocities and model-derived SSH fields from a suite of idealised ocean models outputs of rotating stratified flows with different flow decomposition methods: Higher order decomposition (Eden et al., 2019; Chouksey et al., 2022), Optimal Balance (Masur et al., 2020; Chouksey et al., 2023), and Time Averaged Optimal Balance (Rosenau et al., 2023). The trained NN predicts the flow components from SSH fields generated by the SWOT-simulator and SWOT observations. Analysis using TensorFlow in a shallow water model shows promising results in the prediction of balanced and unbalanced motions by the trained NN. This novel ML-based flow decomposition method is the first of its kind and will provide support for the retrieval of IGW signatures to the SWOT community. 

How to cite: Chouksey, M. and Brecht, R.: Detection of internal waves from oceanic SHH field using neural-network based flow decomposition, EGU General Assembly 2024, Vienna, Austria, 14–19 Apr 2024, EGU24-19694, https://doi.org/10.5194/egusphere-egu24-19694, 2024.

EGU24-20685 | Orals | OS4.5

SWOT ocean data products and CNES AVISO services: an overview 

Cyril Germineaud, Gerald Dibarboure, Marie-Isabelle Pujol, Robin Chevrier, and Anne-Sophie Tonneau

The Surface Water and Ocean Topography (SWOT) mission was launched in December 2022, followed by a three-month commissioning phase and a three-month Calibration and Validation (Cal/Val) phase before the SWOT spacecraft transitioned from a 1-day to a 21-day repeat orbit for science operations in July 2023. Measurements over the ocean surface from the low-rate (LR) data of the SWOT KaRIn (short for Ka-band Radar Interferometer) instrument provided striking 2D images of various ocean features at different spatial and temporal scales. These features include (but are not limited to) the evolution of (sub)mesoscale eddies in energetic currents, the propagation of ocean surface waves and internal tides, and the recent development of El Niño in the tropical Pacific Ocean.

As part of the public release of pre-validated SWOT KaRIn data for evaluation and validation, we will showcase the multiple ocean products distributed by the CNES AVISO center along with some applications for open ocean and coastal ocean studies. This contribution will also present the SWOT ocean data access and services for optimal data use from AVISO, as well as some SWOT dedicated tools provided by a common PODAAC/CNES GitHub platform.

How to cite: Germineaud, C., Dibarboure, G., Pujol, M.-I., Chevrier, R., and Tonneau, A.-S.: SWOT ocean data products and CNES AVISO services: an overview, EGU General Assembly 2024, Vienna, Austria, 14–19 Apr 2024, EGU24-20685, https://doi.org/10.5194/egusphere-egu24-20685, 2024.

The objective of the study is to develop a specialized sharing platform for offshore wind power, enabling offshore wind power stakeholders to utilize environmental information related to offshore wind power. The offshore wind environmental information platform provides monitoring results for major environmental aspects such as birds, marine mammals, fish, underwater noise, electromagnetic fields, and scour. These results are gathered following the construction of Korea's southwest and Jeju Hanlim offshore wind farms. In addition, this platform allows users to confirm the results of the environmental rating in the southwest sea area and adjust the weight for each item as needed. It provides communication guidelines for the entire project process for communication and smooth agreement between stakeholders in the offshore wind power project, as well as guidelines for preparing environmental impact assessments for offshore wind power development projects based on the results of monitoring the marine environment of offshore wind power complexes. The offshore wind energy environmental information platform offers objective ecological information related to offshore wind power, providing data to verify various controversial issues, and is expected to contribute to reducing environmental impact assessment costs and securing social acceptance. This work was supported by the KETEP and the MOTIE of the Republic of Korea (No. 20203030020080) and conducted by Korea Environment Institute.

How to cite: Maeng, J. and lee, H.: Development of a Shared Platform for Environmental Monitoring Information for Offshore Wind Energy Projects, EGU General Assembly 2024, Vienna, Austria, 14–19 Apr 2024, EGU24-1714, https://doi.org/10.5194/egusphere-egu24-1714, 2024.

EGU24-1748 | Orals | OS4.6

The Potential Impact of Floating Wind turbines on the deep water oxygen deficit in seasonally stratified shelf seas 

Tom P. Rippeth, Ben J. Lincoln, Sijing Shen, Brian Scannell, Xin Meng, Jo Hopkins, and Jonathan Sharples

Seasonally stratified shelf seas are amongst the most biologically productive on the planet. A consequence is that the deeper waters can become oxygen deficient in late summer in response to deep water remineralisation of sunken organic matter. Model simulations suggest that a warming climate will accelerate this deficiency due to strengthening stratification and the increased duration of stratification. In the next decades the seasonally stratified seas will host the massive expansion of off-shore wind farms, and in particular the new generation of floating wind turbines.  Here we integrate novel turbulence timeseries measurements with vertical profiles of water column properties from a seasonally stratified shelf sea to estimate oxygen and biogeochemical fluxes. These new results are used to investigate the role of vertical mixing in the development of the seasonal Odeficit with particular reference to the potential impact of enhanced mixing associated with the wake of the floating wind turbines. 

How to cite: Rippeth, T. P., Lincoln, B. J., Shen, S., Scannell, B., Meng, X., Hopkins, J., and Sharples, J.: The Potential Impact of Floating Wind turbines on the deep water oxygen deficit in seasonally stratified shelf seas, EGU General Assembly 2024, Vienna, Austria, 14–19 Apr 2024, EGU24-1748, https://doi.org/10.5194/egusphere-egu24-1748, 2024.

The global shift towards sustainable energy underscores the increasing importance of wind power in the energy transition. However, there is a scarcity of studies focusing on diurnal variations in wind energy potential across different sites, leading to potential inaccuracies in energy generation estimates. This study addresses this gap by conducting a thorough investigation into the diurnal patterns of wind power density (WPD) at 30 m and 60 m hub heights for six coastal Indian sites spanning the period 1969-2007.

Hourly wind speed data obtained from the Indian Meteorological Department (IMD) for these locations formed the basis for a detailed analysis using the Weibull distribution model. The study highlights the crucial need to account for diurnal fluctuations in wind speed, as overlooking them may result in overestimating night-time and underestimating daytime WPD.

Key findings include the identification of Tuticorin as exhibiting the highest diurnal WPD, reaching a peak of 714.53 W/m2 in July at the 60 m hub height, while Mormugao experienced the lowest diurnal WPD during December. Substantial variations in WPD were observed between day and night, emphasizing the necessity of considering diurnal wind speed fluctuations for accurate energy generation predictions.

The implications of this study extend beyond mere data analysis. The results have practical significance for designing and sizing energy storage systems to ensure uninterrupted energy supply throughout the day and night. Additionally, the findings can guide the installation of hybrid energy storage systems, contributing to reduced operational costs and environmental impacts.

The study concludes with recommendations for further research, suggesting the implementation of energy storage systems and hybrid systems for selected locations studied. Energy storage systems are deemed essential for balancing intermittent wind energy generation, while the integration of wind and solar resources in hybrid systems could optimize overall renewable energy generation. The insights gained from this study provide a foundation for developing region-specific renewable energy systems tailored to unique wind characteristics, emphasizing the importance of energy storage and hybrid solutions for a reliable and uninterrupted power supply.

In summary, this study contributes valuable insights into the diurnal variations of wind power density in coastal regions of India, offering a comprehensive understanding of the wind energy potential in these areas. These insights serve as a basis for the development of sustainable and efficient renewable energy systems, highlighting the critical role of energy storage and hybrid solutions in ensuring a consistent and reliable power supply.


How to cite: Yadav, S., Sarkar, A., and Singal, S. K.: Comprehensive Analysis of Diurnal Wind Power Density Variations for Optimizing Wind Energy Integration in Coastal Regions of India, EGU General Assembly 2024, Vienna, Austria, 14–19 Apr 2024, EGU24-4591, https://doi.org/10.5194/egusphere-egu24-4591, 2024.

EGU24-5247 | Posters on site | OS4.6

The MARE (MARine Energy) project Assessment of energy production potential from marine waves and currents: a case study from Aegadian archipelago 

Antonino D'Alessandro, Attilio Sulli, Mauro Agate, Cinzia Caruso, Patrizia Capizzi, Luca Cocchi, Roberto D'Anna, Andrea Di Benedetto, Anna Figlioli, Maurizio Gasparo Morticelli, Alfonso Mandiello, Raffaele Martorana, Antonino Pisciotta, Stefano Speciale, Sergio Scirè Scappuzzo, Salvatore Scudero, and Giovanni Vitale

The MARE (MARine Energy project), funded in the framework of PRIN PNRR, arises from the premise that the energy production from marine sources, becoming an important piece in the mosaic of renewable energies, the available resource must be well assessed, in order to demonstrate the real productive possibilities and attract investors. The activity presents the potential tools identified for the definition of a methodology capable of determining the potential of energy producibility from sea waves and marine current along the territorial waters of the Aegadian Archipelago. To assess the potential for the marine energy it is opportune to employ the most suitable methodologies for the analysis of such particularly complex system. The MARE project aims to contribute to the necessary knowledge so that the energy production from marine waves and currents may become a real resource for small islands.

The MARE project focused on two main lines:

  • The collection, organization and analysis of available environmental data, with particular reference to those strictly related to the studied problem;
  • The identification, on the basis of geological, geophysical and geochemical investigation of the potential for energy production of the highlighted case of study.

And includes the following types of surveys in the Aegadian Archipelago and surroundings:

-           bathymetric surveys

-           seismic microtremor investigations

-           current meter surveys

-           investigations of temperature and salinity parameters

For the following purposes:

  • Assessment of Energy Production Potential from marine waves motion;
  • Assessment of Energy Production Potential from marine currents.

How to cite: D'Alessandro, A., Sulli, A., Agate, M., Caruso, C., Capizzi, P., Cocchi, L., D'Anna, R., Di Benedetto, A., Figlioli, A., Gasparo Morticelli, M., Mandiello, A., Martorana, R., Pisciotta, A., Speciale, S., Scirè Scappuzzo, S., Scudero, S., and Vitale, G.: The MARE (MARine Energy) project Assessment of energy production potential from marine waves and currents: a case study from Aegadian archipelago, EGU General Assembly 2024, Vienna, Austria, 14–19 Apr 2024, EGU24-5247, https://doi.org/10.5194/egusphere-egu24-5247, 2024.

EGU24-5626 | Posters on site | OS4.6

Wind and wave co-location in the Celtic Sea, UK 

Simon Neill

Within the UK, wave power is generally only considered viable along the energetic west coast of Scotland. However, this region has minimal electricity infrastructure, and so it would be challenging to distribute the electricity. One way to further advance wave energy in the UK could be to co-locate less energetic waves sites with offshore wind. This study examines wave power within the Irish Sea, the southern part of which is exposed to the Atlantic Ocean. The spectral wave model SWAN is run for a decade (2012-2021) to quantify the wave energy resource. The high resolution Irish Sea model is nested within an outer model of the North Atlantic, with both models forced by ERA5 wind fields. Monthly mean wave power in the southern part of the Irish Sea (the Celtic Sea) exceeds 30 kW/m during winter months. To investigate the potential for co-location, wave and wind power were compared at a leased floating wind site in the Celtic Sea. Over the simulated decade, r~ 0.5, demonstrating modest potential for co-location of wind and wave energy technologies – considerably less favourable than other sites in the North Atlantic (for example the Canary Islands or the west coast of Scotland) that exhibit greater swell.

How to cite: Neill, S.: Wind and wave co-location in the Celtic Sea, UK, EGU General Assembly 2024, Vienna, Austria, 14–19 Apr 2024, EGU24-5626, https://doi.org/10.5194/egusphere-egu24-5626, 2024.

EGU24-6132 | ECS | Orals | OS4.6

Sediment Wakes Within Offshore Wind Farms Using Sentinel-2 and Landsat-8/9 

Enora Lecordier, Rodney Forster, Krysia Mazik, Pierre Gernez, and Katharine York

Offshore wind energy has been widely accepted as a major component of renewable electricity to support Net Zero objectives and tackle climate change. This acceptance has led to an accelerated deployment of the offshore wind industry in the North Sea, with larger wind farm areas and bigger structures to support longer blades and more powerful turbines. As water flow encounters the foundations of structures, turbulence is generated, leading to the creation of visible downstream wakes. This redistribution of sediment may have an impact on water column processes, and near-field benthic communities.  Sediment wakes within the wind farm may also influence predator/prey interactions and could indicate areas to target or avoid for the location of aquaculture lines or other collocated activities.

The use of remote sensing techniques allows regular monitoring of turbidity in wind farm areas. A virtual constellation composed of Sentinel-2 (European Space Agency) and Landsat-8/9 (NASA) makes it possible to study sediment wake movements at high spatial and temporal resolution while considering tidal influence. Satellite images combined with current velocity, wave models, oceanography data and inherent properties of each turbine allow a better understanding of the parameters regulating the intensity of wakes.

Six offshore wind farms have been studied in two different sites: one in the UK (Lincolnshire) and the other in Belgium (Belgian EEZ) for a total of 269 turbines. A new method of pixel extraction has been developed to automatically extract turbid wakes around every turbine depending on the current direction. This was used to study the changes in suspended particulate matter (SPM) concentration within the wake. The British site, containing 3 wind farms, showed a strong turbine effect, whose intensity varied from 0 (absence of wake) up to 6 g.m-3 of SPM concentration compared to the concentration upstream of the turbines, while the Belgian site, containing 3 wind farms, showed less variability and less intense wakes. As a preliminary result, and without isolating each parameter from the others, the type of foundation seems decisive for wake formation and SPM concentration at the surface: jacket foundations showed less intense wakes than monopiles and gravity-based structures (Mann-Whitney, p<0.001), showing that the shape and size of the foundation affect sediment resuspension. Also, and especially within the Belgian wind farms, wakes were more intense in winter/spring than during summer/autumn as storm events may create even more turbulence and enhance sediment resuspension (Mann-Whitney, p<0.01 and p<0.001).

A Generalised Linear Model incorporating current velocity, wind wave height, swell period and height, type of foundation, seabed morphology and seasonality was generated to explain the influence of physical and environmental parameters on sediment wake in wind farms and can help predict the SPM increase downstream of a structure.

How to cite: Lecordier, E., Forster, R., Mazik, K., Gernez, P., and York, K.: Sediment Wakes Within Offshore Wind Farms Using Sentinel-2 and Landsat-8/9, EGU General Assembly 2024, Vienna, Austria, 14–19 Apr 2024, EGU24-6132, https://doi.org/10.5194/egusphere-egu24-6132, 2024.

Wind turbines harvest the kinetic energy of the winds in the lower atmosphere to generate electricity, thereby reducing the wind speed locally.  Over oceans, this can have direct consequences for the wind energy input into the oceanic mixed layer, as well as associated wave dynamics, ocean mixing, and the wind-driven circulation.  To estimate the potential relevance of these effects, we consider a scenario of 150 GW of installed capacity, as formulated by the Esbjerg declaration, which we distribute over a hypothetical area of 100 000 km2 in the North sea.  To do so, we budget kinetic energy fluxes within the lower atmosphere to estimate the impacts of wind energy use on frictional dissipation near the surface, and then use relationships inferred from the ERA-5 reanalysis to link frictional dissipation to different aspects of ocean dynamics.  Our first-order estimates show that the mean wind speed is reduced by 12% in this scenario.  Using the mean wind speed as an example case, such a reduction is associated with a more substantial reduction of surface friction by about 33%.  In this case, the ocean impacts are reflected in reduced wave heights by 14%, reductions in Stokes drift velocities at the ocean surface by 18%, wave power by 27%, and ocean mixing by 35%.  These basic energetic arguments highlight the need to assess and quantify the extent of impacts large-scale offshore wind power use is likely to have on ocean dynamics that need to be considered with the anticipated expansion in the coming decades.  This is necessary in order to mitigate potentially substantial and detrimental impacts on marine ecosystems.

How to cite: Kleidon, A. and Badger, J.: Follow the energy: Why using more offshore wind power weakens ocean dynamics and impacts marine ecosystems, EGU General Assembly 2024, Vienna, Austria, 14–19 Apr 2024, EGU24-6212, https://doi.org/10.5194/egusphere-egu24-6212, 2024.

EGU24-8558 | Orals | OS4.6

Assessing the potential of tidal and ocean current energy for remote Arctic communities 

David C. Finger and Haraldur Audunsson

Tidal and ocean current energy represent continuous and reliable renewable sources that can offer valuable electricity to remote communities located near ocean shores. Ocean currents result from various factors such as tidal forces, wind shear at the water surface, temperature gradients due to inflow from melting water, salinity gradients caused by incoming freshwater, the Coriolis effect, and underwater topography. In the Faeroe Islands, ocean currents have been harnessed to produce power exceeding 1 MW (https://minesto.com/), providing an essential energy source for the ongoing energy transition.

Especially in the Arctic, temperature and salinity gradients can enhance water velocity within a stratified water column in coastal areas. Therefore, comprehensive monitoring, accounting for the vertical stratification of the water column, becomes imperative to accurately assess the full potential of ocean currents. To accomplish this, we intend to employ an Acoustic Doppler Current Profiler (ADCP) (Xylem, Inc, 2015) to evaluate the three-dimensional velocity field at various locations in Iceland, aiming to comprehend the complete potential of ocean current energy.

We will start our investigation with preliminary monitoring in Fossvogur, a two-kilometer-long fjord situated in front of Reykjavik University in Reykjavik, Iceland. We will combine in-situ ADCP data with remotely sensed surface temperature and vertical CTD proofing of the water column. Once our data collection and processing methods are standardized, we plan to extend our approach to locations with stronger ocean currents, such as Hvammsfjördur just south of the Wastfjords. Our initial findings suggest that tidal currents, temperature and salinity gradients, and wind shear significantly contribute to increasing ocean currents, challenging the assumption that the energy potential of these currents might have been underestimated in the past. This revelation could substantially aid in the energy transition of remote coastal communities by providing them with clean, cost-efficient, and environmentally friendly energy sources.

Moreover, our methodology holds promise for application in any coastal region, potentially offering a renewable energy solution for various coastal communities.

How to cite: Finger, D. C. and Audunsson, H.: Assessing the potential of tidal and ocean current energy for remote Arctic communities, EGU General Assembly 2024, Vienna, Austria, 14–19 Apr 2024, EGU24-8558, https://doi.org/10.5194/egusphere-egu24-8558, 2024.

EGU24-9177 | ECS | Posters on site | OS4.6

The significance of tides for offshore wind wake effects on coastal ocean dynamics 

Nils Christiansen, Ute Daewel, and Corinna Schrum

As offshore wind development increases, marine environments are increasingly affected by offshore wind farm wakes and their impact on hydrodynamic processes. Recent studies have shown that wind wakes can influence ocean circulation and stratification through changes in surface wind speed. However, their results indicate that the wake effects are attenuated in areas that are strongly determined by tidal currents. In this study, we look deeper into the wake-induced hydrodynamic processes and the influence of tides, aiming to understand the role of local hydrodynamic conditions on the magnitude of emerging wake effects. For this, we use high-resolution unstructured-grid modeling, focusing on offshore wind development for tidal and non-tidal scenarios in the shallow North Sea. The model simulations show the effects arising from wind speed reductions and demonstrate the impact of tidal processes. We identified that tidal currents can disturb the changes in surface current velocity and even mitigate the impact on the mean flow field around offshore wind farms. In shallow waters, tidal stirring superimposes wake-induced processes and can influence the changes in vertical mixing and stratification. Our simulations reveal that tides eventually mitigate the impacts of offshore wind farm wakes on the North Sea hydrodynamics. These findings become important when assessing offshore wind farm effects in different marine environments and estimating the extent of the anthropogenic disturbances.

How to cite: Christiansen, N., Daewel, U., and Schrum, C.: The significance of tides for offshore wind wake effects on coastal ocean dynamics, EGU General Assembly 2024, Vienna, Austria, 14–19 Apr 2024, EGU24-9177, https://doi.org/10.5194/egusphere-egu24-9177, 2024.

This study presents a detailed analysis of weather window accessibility for Marine Renewable Energy (MRE) sites along Ireland's coast, utilizing a robust 12-year met-ocean dataset. The research focuses on key test sites - the Atlantic Marine Energy Test Site (AMETS), the Galway Bay Test Site (GBTS), and the Westwave Demonstration Site - and expands to a broader spatial analysis of Irish coastal waters. By integrating significant wave height and wind data, the study evaluates site accessibility, emphasizing the paramount role of wave height in determining access. Findings reveal substantial spatial variability in accessibility, with high-resource areas like AMETS facing greater access challenges due to harsher conditions, as opposed to the more accessible GBTS. The study underscores the need for a nuanced, region-specific approach to MRE development in Ireland, highlighting how strategic planning and technological advancements are crucial in exploiting the country's significant MRE potential. The results also stress the importance of long-term data for accurate environmental variability assessment, offering vital insights for future MRE site viability and strategy development.

How to cite: Eftekhari, A., Moore, D., and Nash, S.: Optimizing Weather Windows for the Deployment, Operation, and Maintenance of Marine Renewable Energy Devices in Irish Coastal Waters, EGU General Assembly 2024, Vienna, Austria, 14–19 Apr 2024, EGU24-10270, https://doi.org/10.5194/egusphere-egu24-10270, 2024.

EGU24-11584 | Orals | OS4.6

Optimising the number of turbines in Tidal Range Schemes 

Man-Yue Lam, Meysam Qadrdan, and Reza Ahmadian

An energy transition from fossil fuel energy to renewable energy is needed to alleviate global climate change and achieve the Net Zero emission target. While focus has been put on wind and solar energies, they are intermittent and non-dispatchable. Consequently, there will be a significant need for filling the gap between renewable energy supply and energy demand. Tidal energy is potentially capable of contributing to balancing this gap because of its predictability and dispatchability. Tidal range schemes (TRSs) utilise the tidal range to create artificial head differences across the structures. The head differences then drive the turbines to generate electricity. TRSs can also be used as energy storage by controlling the turbine operation and even pumping water into or out of the impoundment. The UK has vast tidal energy resources which are mainly unutilized. While several TRSs have been proposed, there are currently no TRSs developed in the country because of their large initial investment cost and significant impacts on their adjacent coastal areas. Approaches to determine the optimal design and operation of TRSs are needed to improve their cost-effectiveness.

            This research studies the optimal number of turbines for TRSs. There have been discrepancies concerning whether an optimal number of turbines exists for any given TRS by merely optimising its annual energy production (AEP).  Several published works (Aggidis and Feather, 2012; Petley and Aggidis, 2016; Vandercruyssen et al., 2022) showed that the AEP increases as more turbines are used until the turbines fully utilise the available tidal energy. Once the tidal energy is fully utilised, adding more turbines does not increase or decrease the AEP. However, other published works (Xue et al., 2021; Hanousek et al., 2023) showed that there is an optimal number of turbines for a given TRS that produces the maximum AEP and using turbines more than the optimal number reduces AEP. This research reconciles the two aforementioned statements by optimising the AEP of a proposed TRS at an unused dock with a 0D model with and without constraining the maximum starting head to 7.5 m, which is lower than the tidal range at the TRS site. Such a constraint would be necessary if the TRS is used as a flood protection measure as well as an energy source. Results showed that AEP increased with an increase in the number of turbines until the entire tidal range was utilised if the constraint was not applied. With the starting head constraint applied, there was an optimal number of turbines beyond which the AEP decreased. The absence of the optimal number of turbines in the unconstrained condition demonstrates the importance of cost models in selecting the optimal number of turbines. Reference: (i) Aggidis and Feather (2012). 10.1016/j.renene.2011.11.045; (ii) Hanousek et al. (2023). 10.1016/j.renene.2023.119149; (iii) Petley and Aggidis (2016).  10.1016/j.oceaneng.2015.11.022; (iv) Vandercruyssen et al. (2022). 10.1016/j.heliyon.2022.e11381; (v) Xue et al. (2021). 10.1016/j.apenergy.2021.116506

Figure 1. The annual energy production for Barry Dock Lagoon with an increasing number of turbines with and without the maximum starting head constraint (≤ 7.5m).

How to cite: Lam, M.-Y., Qadrdan, M., and Ahmadian, R.: Optimising the number of turbines in Tidal Range Schemes, EGU General Assembly 2024, Vienna, Austria, 14–19 Apr 2024, EGU24-11584, https://doi.org/10.5194/egusphere-egu24-11584, 2024.

EGU24-12852 | ECS | Posters on site | OS4.6

Informing the selection of mooring and anchor systems for floating offshore wind farms based on a review of existing projects 

Pegah Amjadian, Shauna Creane, Mark Coughlan, Christopher O' Donovan, Budi Zhao, Mike Long, and Jennifer Keenahan

National and international climate objectives, along with sustainable development targets, are driving the rapid growth of the offshore renewable energy sector. At the forefront of this industry is offshore wind. While fixed offshore wind technology has reached maturity, its application is limited to water depths of 60 meters, restricting access for nations interested in adopting offshore wind solutions. Hence, the wind industry is actively pursuing the advancement of floating offshore wind technology.

Choosing the right floating foundation, mooring systems, and anchors for a project is crucial and it is vital to customize and optimize of the design of these systems based on site-specific factors like water depth, environmental conditions, and seabed morphology. These systems play a critical role in securing the turbine during severe environmental events and contribute, alongside the floating platform, to the overall hydrodynamic stability. In addition, the lifespan of a floating offshore wind turbine is greatly influenced by the selection of a reliable mooring system and anchor type, emphasizing potential cost savings compared to systems requiring mid-life line replacements with higher operational costs.

This research is set to address a significant gap in our knowledge by creating a decision matrix for selecting mooring and anchor setups in floating offshore wind projects. Furthermore, we'll address certain challenges associated with floating structures, like sediment mobility and interactions of structures with the seafloor, which can pose significant risks to marine structures. These issues are often primary factors that risk the stability and integrity of offshore structures in marine and coastal environments. Investigating and modelling these phenomena are essential steps to minimize the risk of failure in projects. The process involves carefully studying successful past projects, closely examining the geotechnical data and seabed condition, metocean data, and thoroughly evaluating how the platforms are designed.

Furthermore, the study also considers the Atlantic Marine Energy Test Site (AMETS), a crucial project led by the Sustainable Energy Authority of Ireland (SEAI), offering valuable insights as an illuminating case study for potential future projects. This study will conduct an extensive review to assess various types of anchors that could be suitable for our designated study area. By integrating insights from prior projects and gaining a nuanced comprehension of water movements, we aim to make thorough and well-informed decisions regarding optimal parameters. These parameters encompass crucial aspects such as location, water depth, foundation type, and mooring specifications.

Keywords: floating offshore wind foundation, mooring, anchors, sediment mobility


How to cite: Amjadian, P., Creane, S., Coughlan, M., O' Donovan, C., Zhao, B., Long, M., and Keenahan, J.: Informing the selection of mooring and anchor systems for floating offshore wind farms based on a review of existing projects, EGU General Assembly 2024, Vienna, Austria, 14–19 Apr 2024, EGU24-12852, https://doi.org/10.5194/egusphere-egu24-12852, 2024.

EGU24-15342 | ECS | Posters on site | OS4.6

Resolving the wakes of offshore wind infrastructure in two layer flows 

Charlie Lloyd

To enable a global net zero future the next decade will see exponential growth of offshore wind renewable energy. This scale of development necessitates expansion into deeper, seasonally stratified, waters, for the first time. This transition from shallow well-mixed regions to deeper waters marks a fundamental change in the marine environment, due to the importance of vertical density gradients on fluid dynamics. Seasonal stratification is a vital control on marine ecosystems; primary production, biogeochemical cycling, and water column structure are all intricately linked through vertical mixing processes across the pycnocline. Understanding turbulence introduced in the water column by tidal flows past offshore infrastructure, and the subsequent effect on vertical mixing, is therefore vital for predicting and managing renewable energy impacts on the marine environment.


This work is focussed on understanding the fundamental fluid dynamics of offshore wind infrastructure wakes in stratified flows, using direct numerical simulations. The tidal flows past the structures are approximated by a uniform quiescent background flow with a two-layer density profile. The flows past two types of infrastructure are investigated: A uniform vertical cylinder approximating a monopile, and a truncated cylinder approximating a floating spar-buoy or semi-submersible structure. The truncated cylinder has its length equal to the pycnocline depth, such that it penetrates through the upper half of the pynocline.


Through these simulations we identify the process through which turbulence generated in the wake of the structures leads to vertical mixing across the pycnocline. While both cylinders weaken the pynocline by a similar amount, the processes that lead to vertical mixing differ significantly. The truncated cylinder directly leads to mixing in the lee of the structure due to the vertical displacement of fluid beneath it. In contrast, the full cylinder requires a transition from horizontally sheared flow to 3D turbulence before vertical mixing occurs. In addition to direct mixing of the pycnocline through turbulence, internal gravity waves are also observed in the wake of both cylinders, identified through a spectral decomposition of instantaneous slice data. Future work will aim to understand the interaction between waves and turbulence in the cylinder wakes, the influence of shear in the background flow on mixing in the wakes, and will develop sub-grid-scale closures appropriate for modelling full-scale tidal flows past offshore wind infrastructure.


How to cite: Lloyd, C.: Resolving the wakes of offshore wind infrastructure in two layer flows, EGU General Assembly 2024, Vienna, Austria, 14–19 Apr 2024, EGU24-15342, https://doi.org/10.5194/egusphere-egu24-15342, 2024.

EGU24-16226 | ECS | Orals | OS4.6

Effect of Increased Geometric Complexity on LoadActing on Floating Offshore Wind Turbine Platforms 

Nilotpal Dhar, Robert M Dorrell, Charlie J Lloyd, Stuart J McLelland, and John Walker
Renewable energy sources, including offshore wind energy, are fundamental to reducing fossil fuel
consumption and greenhouse gas emissions. Many countries are planning for a rapid and massive ex-
pansion of the offshore wind sector to meet the NetZero goals. So far, the installation of offshore wind
turbines (OWT) has been restricted to near-shore shallow water ( 60m). However, future expansion
of the sector will be in deep waters, away from the shore, where the wind speed is stronger and more
consistent. Monopiles, the most commonly used foundations for OWT, become uneconomical or tech-
nologically unfeasible in deep waters. Therefore, OWT supported by floating platforms is the way to go
forward. The initial platform designs and construction were based on the experience obtained from the
oil and gas industry (O&G). However, the load acting and the movement of the floating offshore wind
turbine (FOWT) platforms are vastly different from the O&G platforms. In addition to the aerodynamic
loading, these platforms are subjected to hydrodynamic loading, making platform design a complex task.
Evaluating the forces acting on these platforms, even under idealistic conditions, is challenging. Although
significant progress has been made, platform, anchor, mooring, and turbine design improvement depends
on accurate load calculation. Further, understanding hydrodynamic loading is essential to evaluate the
energy losses due to the FOWT system and, therefore, the mixing of the water column behind the struc-
ture. In this research, the effect of increased geometric complexity on load acting on a semi-submersible
platform is numerically investigated. Three unidirectional flow regimes of Reynolds number (Re) = 2900,
43000, and 200000 are investigated, using the OC4 semi-submersible platform as the reference. The OC4
semi-submersible platform was developed by the OC4-DeepCWind consortium to obtain experimental
data and validate numerical models for FOWT. The results show that the drag force acting on the plat-
form increases as the Re and number of members in the platform increases. These findings are important
in understanding the hydrodynamic loading on FOWT platforms under static conditions and designing
the platform, mooring and anchoring systems. Further, this is essential for the sustainable development
of the offshore wind energy sector.


How to cite: Dhar, N., Dorrell, R. M., Lloyd, C. J., McLelland, S. J., and Walker, J.: Effect of Increased Geometric Complexity on LoadActing on Floating Offshore Wind Turbine Platforms, EGU General Assembly 2024, Vienna, Austria, 14–19 Apr 2024, EGU24-16226, https://doi.org/10.5194/egusphere-egu24-16226, 2024.

EGU24-17385 | Posters on site | OS4.6 | Highlight

Evaluating the Synergy of Wind and Wave Energy in European Coastal Regions using Satellite Altimetry data 

Sonia Ponce de León Alvarez, João Bettencourt, John Ringwood, and Jérôme Benveniste

In this research, we present a comprehensive analysis of the combined potential of wind and wave energy across various European coastal locations. Our primary aim is to explore the viability of leveraging satellite altimetry for assessing the potential of wind and wave energy synergies on the European shelf. This exploration is driven by the premise that integrating wind and wave energy sources could significantly reduce the variability in energy supply. Our methodology employs the homogenized, multi-mission altimeter dataset provided by the European Space Agency's Sea State Climate Change Initiative (Sea_State_cci). This dataset spans 26 years, from January 1991 to December 2018, offering an extensive temporal and spatial coverage for estimating wind and wave power densities at various sites.

To calculate wave power density, we utilize an empirical model that derives the wave energy period from the altimeter's Ku-band significant wave height and radar backscatter coefficient. Our findings indicate a notable correlation between wind and wave energy in the Mediterranean, in contrast to the North Atlantic locations. Consequently, the Western North Atlantic seems to be the most promising region for combined wind and wave energy farms, considering the benefits of simultaneous exploitation.

The study also reveals interesting patterns in the relationship between the variability and average wave power across different sites, a critical factor for any marine renewable energy strategy. Notably, we observe that the overall variability in energy supply tends to decrease with an increase in average wave power, primarily because the more powerful swell waves exhibit a lower correlation with local wind conditions. This insight is pivotal for understanding the dynamics of marine renewable energy sources and optimizing their exploitation.

How to cite: Ponce de León Alvarez, S., Bettencourt, J., Ringwood, J., and Benveniste, J.: Evaluating the Synergy of Wind and Wave Energy in European Coastal Regions using Satellite Altimetry data, EGU General Assembly 2024, Vienna, Austria, 14–19 Apr 2024, EGU24-17385, https://doi.org/10.5194/egusphere-egu24-17385, 2024.

EGU24-17966 | Orals | OS4.6

Understanding the Effectiveness of Scour Mitigation Techniques at Offshore Windfarms Using Experimental Modelling 

Maisy Bradbury, Stuart McLelland, Robert Dorell, Kerry Marten, and Richard Whitehouse

Over the last three decades the offshore wind energy sector in the UK and globally has grown rapidly and the recent COP28 climate summit reinforced the North Sea Collaboration (NSEC) on the development of offshore wind which targets an installed capacity of at least 260 GW of offshore wind energy by 2050. Due to this accelerated demand for offshore wind there has been increased demand for research on scour around subsurface structures in the offshore environment. It is also beneficial to minimise the influence of subsurface foundations on the marine ecosystem and therefore scour mitigation methods that enhance marine habitats would be advantageous. This study uses experimental modelling to explore the impact of scour mitigation around monopile foundations and evaluate successful methods whilst considering the habitats living around the offshore structures.

Currently rock armour is most commonly used as an optimised scour protection layer for creating biodiversity enhancements. In this study four different scour mitigation techniques were assessed to analyse their effectiveness for scour mitigation; Textured Collars, Rock Dumping, Textured Piles and Rock Bags. All four scour mitigation techniques investigated have additional bio-enhancement capabilities and can be classed as a ‘Nature Inclusive Designs’ used to promote marine biodiversity and seaweed planting.  These scour mitigation methods include both dynamic and flow altering strategies using both the sea floor area around the monopile foundation and the foundation surface itself.  The experiments measured scour development under two different flow conditions until an equilibrium bed state developed. In some experiments, a novel Mylar Film technique was used to enable continuous measurement of scour development through structures being tested whilst simultaneously preventing water and sediment transfer. The results shown in Figure 1 suggest that under low flow conditions rock dumps and textured collars are the most effective scour mitigation technique to reduce scour depth. Textured collars prove to be the most successful for reducing scour depth under both flow conditions tested in these experiments.

How to cite: Bradbury, M., McLelland, S., Dorell, R., Marten, K., and Whitehouse, R.: Understanding the Effectiveness of Scour Mitigation Techniques at Offshore Windfarms Using Experimental Modelling, EGU General Assembly 2024, Vienna, Austria, 14–19 Apr 2024, EGU24-17966, https://doi.org/10.5194/egusphere-egu24-17966, 2024.

EGU24-18403 | Posters on site | OS4.6 | Highlight

SeaHeat: Assessing Baltic Sea potential and risks for thermal energy source 

Simo-Matti Siiriä, Aleksi Nummelin, and Lauri Laakso

The Baltic Sea presents a unique environment for thermal energy usage through heat pumps, which has yet to be extensively explored. Its distinct characteristics, such as a strong vertical stratification dominated by salinity and relatively shallow depth, create a setting where, despite cold winters, the water beneath the halocline remains relatively warm. Identifying areas where temperatures remain sufficiently warm is the first step in utilising this resource for energy production. During winter, with water temperatures typically under 5 °C, the water flows required for meaningful power plants would be comparable to the magnitudes of small rivers, necessitating a thorough assessment of the environmental impacts of both extracting warm water and the outflow of cooler water.

We will present the first results of a project in which we have used the existing Baltic Sea reanalysis from Copernicus Marine Services to  (i) identify locations within the Baltic Sea where water temperatures reliably stay above specific trigger temperatures, thereby offering feasible sites for energy extraction and (ii) assess  the environmental impacts of intake and outflow volumes based scale analysis of the local ocean heat budget.

We will also present a decision support tool designed for end-users considering the implementation of sea-heat power plants. This tool provides a preliminary assessment of both the opportunities and risks associated with specific sites, offering a crucial first step in the decision-making process for potential sea-heat energy projects.

How to cite: Siiriä, S.-M., Nummelin, A., and Laakso, L.: SeaHeat: Assessing Baltic Sea potential and risks for thermal energy source, EGU General Assembly 2024, Vienna, Austria, 14–19 Apr 2024, EGU24-18403, https://doi.org/10.5194/egusphere-egu24-18403, 2024.

EGU24-20440 | ECS | Orals | OS4.6

Near-field measurements around offshore wind turbines show how they enhance hydrodynamics in their direct environment 

Erik Hendriks, Kobus Langedock, Luca van Duren, Jan Vanaverbeke, Wieter Boone, and Karline Soetaert

In the southern North Sea, a relatively shallow shelf sea, offshore wind farms are being constructed and planned on an extensive scale. To assess the possible ecosystem effects of these upscaling efforts (from 20GW in 2020 to more than 300 GW in 2050), we need to quantify the effect of turbines on local hydrodynamics and suspended matter dynamics. In this study, we present the results of a field campaign aiming at quantifying these effects.

The campaign was undertaken in June 2022 in the Belgian Coastal Zone. We measured a set of hydrographic parameters at various locations around a single turbine, supplemented with water and sediment samples.

The data reveal how the turbine enhances the local hydrodynamics and hydrographic parameters. In the turbine wake, we observe an increase in turbulent kinetic energy. This leads to a more well-mixed water column. At the water surface, this leads to colder and more saline water, while the water near the seabed becomes warmer and less saline. These effects are closely linked to the direction of the tidal current, as the turbine-induced wake is only several turbine diameters wide. The wake length is much longer, extending for several hundreds of meters behind the turbine.

This presentation discusses the study setup and the steps required to quantify the impact of turbines on local hydrodynamics. Furthermore, we will discuss how this knowledge is implemented in large-scale models, as this step is crucial for assessing the ecosystem impact of upscaled offshore wind.

How to cite: Hendriks, E., Langedock, K., van Duren, L., Vanaverbeke, J., Boone, W., and Soetaert, K.: Near-field measurements around offshore wind turbines show how they enhance hydrodynamics in their direct environment, EGU General Assembly 2024, Vienna, Austria, 14–19 Apr 2024, EGU24-20440, https://doi.org/10.5194/egusphere-egu24-20440, 2024.

EGU24-2754 | Posters on site | OS4.7

A Study on the Economic Valuation of the Korean Seabed Geological Map 

Jungkyu Park and Inkwon Um

The government project to publish the geological map of the seabed of South Korea was initiated in 1975. Over the course of 40 years, until 2015, the geological map of the seabed for the regional scale (1:250,000) covering a total area of 350,000 km2 under the jurisdiction of South Korea was successfully completed. Subsequently, starting in 2016, a new seabed mapping program for the coastal zones of South Korea at a more precise scale (1:100,000) has been in preparation.

The geological map of the seabed in South Korea comprises 5 to 8 thematic map sheets, including seabed topography, surface sediment average particle size distribution, surface sediment type distribution, and seabed surface acoustic distribution. These maps play a crucial role in various national infrastructure aspects such as resource development, defense security, educational research, and marine construction. Despite their significance, there exists a lack of public understanding and consensus regarding the necessity and importance of geological seabed maps. This is attributed to their nature as special public goods, not directly utilized by the public and not traded in the market.

In light of this, this study aims to evaluate the economic value of the geological map of the seabed, shedding light on the necessity of its preparation and emphasizing its importance. The study measures the range of applications for the geological seabed map, distinguishes consumers and beneficiaries, and quantifies the value of the geological map of the seabed in South Korea using the conditional value method—an established valuation technique for non-market goods.

How to cite: Park, J. and Um, I.: A Study on the Economic Valuation of the Korean Seabed Geological Map, EGU General Assembly 2024, Vienna, Austria, 14–19 Apr 2024, EGU24-2754, https://doi.org/10.5194/egusphere-egu24-2754, 2024.

Microplastics (MPs, smaller than 5 mm) are ubiquitous and difficult to be degraded in environment. It is more easily to be ingested by the organism and cause a series of harms through the food chain. Based on the survey of MPs distribution in the intertidal zone along our coast and the development of fast MPs detection methods by using Hyperspectral image recognition, we use a typical marine food chain (microalgae-mussels-crabs) to investigate the trophic transfer and the relative toxic effects by environmental MPs. The polyethylene particles (10-45 μm) was selected as representative MPs to investigate the induced biological effects in microalgae, marine mussels and crabs, and the potential mechanisms under different exposure scenarios, including both water-born and trophic transfer exposure. The results showed that the algae could absorb on the surface of MPs, which not only damaged algal cells, but also changed surface characteristics of MPs to affect the feeding of mussels. In addition, MPs could be ingested and accumulated in the consumers with significant exposure concentration dependence and tissue specificity. Biomarkers from different levels in mussels and crabs showed that MPs could induce the increased ingestion rate, decreased lysosomal membrane stability, the changes of the activity of antioxidative responses. In addition, MPs indeed caused more serious stress responses in organisms at higher levels in food chain through the trophic transfer under the mechanism to balance the antioxidant defenses and metabolism system. To our best knowledge, this research is the first study to focus on trophic transfer induced biological responses by MPs in marine organisms. It provides an important research model and scientific basis for the future exploration of eco-toxic effect of environmental MPs.

How to cite: Di, Y., Zhao, R., and Xu, J.: Application of marine organisms at multi-trophic level to study the integrated biological responses induced by microplastics through food-chain, EGU General Assembly 2024, Vienna, Austria, 14–19 Apr 2024, EGU24-4928, https://doi.org/10.5194/egusphere-egu24-4928, 2024.

EGU24-6017 | Posters on site | OS4.7

Operational oceanography in ports and coastal areas, applications for the management of pollution events 

Andrea Cucco, Roberto Sorgente, Giovanni Quattrocchi, Simone Simeone, Andrea Pes, Andrea Satta, Matteo Sinerchia, Angelo Perilli, and Alberto Ribotti

We present the key findings derived from two European projects, SICOMARplus and GEREMIA, which focused on ocean modeling applications to support maritime safety and to safeguard the marine environment in two regions situated in the northern part of Sardinia, Italy. These projects have supported the implementation of two operational numerical prediction systems for pollution risk management at sea, in the Bonifacio Strait and the port of Olbia. The primary beneficiaries of these tools and associated products included fishermen, yachtsmen, seafarers, and individuals working at sea, as well as emergency management entities such as the Coast Guard, port authorities, and the Italian Navy.

Both prediction systems are based on advanced coastal ocean numerical models with high spatial resolution and European cutting-edge meteorological and marine data (i.e., ECMWF and Copernicus Marine Service) to establish environmental conditions at open boundaries.

Considering the SICOMARplus project, the operational products comprise a 3-day forecast of marine parameters, like sea surface temperature, wave direction and height, current speed and direction. Additionally, the system provides Oil Stranding Time and Risk Rank Maps for the Bonifacio Strait and the entire north-western coast of Sardinia.

Regarding the GEREMIA project, the operational products include a 3-day prediction of the speed and direction of surface currents, as well as Water Age within the port of Olbia and the surrounding gulfs system. These insights into water renewal times within the port, under real-time and forecast of the meteorological and marine conditions, serve as a proxy for hazard assessment in the event of a maritime accident. This is particularly crucial when significant volumes of hydrocarbons may disperse in port waters, with implications for the tourism and economic sectors, such as bathing and aquaculture.

Both systems are equipped with web-based interactive graphical user interfaces specifically designed to access operational products, allows users to zoom in on specific areas and to setup and execute numerical simulations in on-demand mode. Users are required to provide their credentials for access to the reserved area, where, after inputting basic parameters, they can perform simulations to predict the surface transport of oil or floating pollutants in north-western Sardinia.

These prediction systems and related products, specifically designed to support stakeholders, prove invaluable in planning and managing at-sea activities, enhancing safety, and reducing potential hazards arising from unexpected accidents.

How to cite: Cucco, A., Sorgente, R., Quattrocchi, G., Simeone, S., Pes, A., Satta, A., Sinerchia, M., Perilli, A., and Ribotti, A.: Operational oceanography in ports and coastal areas, applications for the management of pollution events, EGU General Assembly 2024, Vienna, Austria, 14–19 Apr 2024, EGU24-6017, https://doi.org/10.5194/egusphere-egu24-6017, 2024.

EGU24-7079 | ECS | Posters on site | OS4.7

Weathering effects on microplastic production in fishing rope hauler operations:  mechanical abrasion  

Young Kyoung Song, U-Seong Kim, and Tae-Hoon Kim

While land-basd sources of plastic pollution have garnered increasing attention in recent years, ocean-based sources have been less thoroughly examined. The objective of this study was to quantify and characterize the production of microplastics on the surface of fishing ropes during the operation of a hauler on a fishing boat. The simulation of the fishing process (operating the hauler) was conducted in two phases to assess quantification, size distribution, and shapes of particles produced from the fishing ropes due to mechanical abrasion with the hauler.

Initially, we simulated the fishing operation using the hauler with varying weights at 0, 5, 10, 15, and 20 kg (weight-varied hauler simulation, WVHS). Subsequently, we simulated the fishing operation using the hauler according to the frequency of hauler operation (0, 5, 10, 15, and 20 times) with weights of 5kg and 50kg (frequency-varied hauler simulation, FVHS). All fragmented particles were identified using a FTIR microscope (Nicolet iN10 MX; Thermo Fisher Scientific) equipped with a linear array detector, employing 25 μm steps over one section (~12 × 12 mm) in reflection mode.

In the results of WVHS experiment, the abundance of fragmented particles larger than 10 mm on the surface of the PP rope increased with the weight due to mechanical abrasion. The observed values were 31±1.2 particles/m (5kg), 52±21 particles/m (20kg), 69±44 particles/m (35kg), and 77±5.7 particles/m (50kg) when lifting each weight using the hauler. The estimated regression equation was y=1.383x+15.538 (F=4.585, p=0.001). In the FVHS experiment, the abundance of produced particles peaked at 10 times and subsequently sustained a steady state in particle abundance for the 5 kg weight. For the 50 kg weight, the peak occurred at 5 times of hauler simulation, with subsequent reductions and a steady state in particle abundance. Our research offers essential information to estimate the microplastic production on fishing ropes during hauler operating, providing valuable insights into the impact of fishing activities on microplastic production in marine environments.

How to cite: Song, Y. K., Kim, U.-S., and Kim, T.-H.: Weathering effects on microplastic production in fishing rope hauler operations:  mechanical abrasion , EGU General Assembly 2024, Vienna, Austria, 14–19 Apr 2024, EGU24-7079, https://doi.org/10.5194/egusphere-egu24-7079, 2024.

EGU24-7256 | ECS | Posters on site | OS4.7

Optimizing Medslik-II: Parametrization through a bayesian search algorithm applied at the Baniyas oil spill incident (Syria, 2021) 

Igor Atake, Gabriele Accarino, Marco Carlo, Donatello Elia, Giovanni Coppini, and Giovanni Aloisio

Oil spill incidents can have a significative negative impact on coastal and marine ecosystems as well as human activities. Despite increased maritime safety, the European Maritime Safety Agency's Cleanseanet program detected a substantial increase in spills within the Mediterranean basin. The accurate prediction of the transport and transformation of the oil slick is a key aspect for assessing the impacts of the spill on coastal and marine areas. In this context, numerical oil spill modeling plays a crucial role in understanding unseen impacts and filling observational gaps. Such models are executed according to a set of physical simulation parameters, which are usually hand-picked, relying mostly on the modeler's expertise. Proper selection of such parameters is key for ensuring accurate results. This study proposes a novel technique integrating satellite observations, the Medslik-II oil spill model and Machine Learning for enhancing the oil spill results by optimizing the model parametrization. A Bayesian Optimization Framework was implemented to search for the optimal configuration through the parameter space. A real oil spill case, that occurred in the Baniyas area (Syria) in 2021, was used to validate the proposed approach. Results from early evaluation of such framework are promising and demonstrated that coupling physics- and data-driven techniques can lead to more precise risk assessment and planning for oil spill incidents.

How to cite: Atake, I., Accarino, G., Carlo, M., Elia, D., Coppini, G., and Aloisio, G.: Optimizing Medslik-II: Parametrization through a bayesian search algorithm applied at the Baniyas oil spill incident (Syria, 2021), EGU General Assembly 2024, Vienna, Austria, 14–19 Apr 2024, EGU24-7256, https://doi.org/10.5194/egusphere-egu24-7256, 2024.

EGU24-8195 | Posters on site | OS4.7

Polycyclic aromatic hydrocarbons distribution, origin and risk assessment in Jeddah marine coastal zone sediments, Saudi Arabia 

Ioannis Hatzianestis, Yasser Abualnaja, Constantine Parinos, Elvira Plakidi, Styliani Chourdaki, and Alexandra Pavlidou

Polycyclic aromatic hydrocarbons (PAH) were determined in surface marine sediments collected from the Jeddah coastal zone (Saudi Arabia), in order to assess their levels, origin, and probable toxic effects on marine organisms. Two marine areas were selected (a) the Jeddah lagoon system, which is an area with shallow depth and restricted water circulation receiving wastewater and (b) Mena Jeddah, an extensive port facility within the Islamic Port of Jeddah, influenced by various activities associated with the port operations. Sediments were collected from 10 stations and PAHs were determined by gas chromatography – mass spectrometry. In total thirty-two parent and alkyl substituted compounds were quantified. High PAH concentrations, indicative of an enhanced pollutant burden, were recorded in the Jeddah Lagoon (mean value 5800 μg/kg for total polycyclic aromatic hydrocarbons (∑PAH)), whereas PAH levels in Mena Jeddah were lower (mean value for ∑PAH 615 μg/kg). PAH mixtures were mainly composed of methyl substituted compounds at all lagoon stations, suggesting a petroleum origin, whereas PAH from combustion sources accounted for only 8.5–28.8% of ∑PAH. In contrast, pyrolytic PAHs were found at higher concentrations in Mena Jeddah, where total PAH concentrations were lower, accounting for 39–61% of total PAHs. PAH sources and transport pathways were further examined by using various molecular diagnostic ratios/indices and applying Positive Matrix Factorization, which is a multivariate statistical method capable to calculate source profiles and contributions. Low temperature combustion was found to be the most significant source of PAHs with an average contribution of 41%, followed by high temperature combustion and petrogenic sources (21%) and low MW fossil inputs (17%). Petroleum related pollution seems to predominate in Jeddah lagoons, whereas pyrolytic PAHs produced from low temperature combustion processes were dominant in Mena Jedda. To evaluate probable toxicity risks to marine organisms, PAHs concentrations were compared to sediment quality guidelines, whereas Toxicity Equivalent Quotients (TEQs) of carcinogenic PAHs relative to benzo[a]pyrene were also calculated and used for ecological risk assessment. Based on these criteria it seems that, despite the high total values of PAHs, adverse biological effects are unlikely to occur, while a low to moderate ecological risk was found in the lagoon stations.

This study has been funded by the project “Marine and Coastal Assessment Protection Study for the Kingdom of Saudi Arabia Coastline” made between the Saudi National Center for Environmental Compliance (NCEC) and King Abdullah University of Science and Technology (KAUST) under the leadership of the Ministry of Environment, Water and Agriculture, as part of the Vision 2030 for economic growth and development in the Kingdom of Saudi Arabia.

How to cite: Hatzianestis, I., Abualnaja, Y., Parinos, C., Plakidi, E., Chourdaki, S., and Pavlidou, A.: Polycyclic aromatic hydrocarbons distribution, origin and risk assessment in Jeddah marine coastal zone sediments, Saudi Arabia, EGU General Assembly 2024, Vienna, Austria, 14–19 Apr 2024, EGU24-8195, https://doi.org/10.5194/egusphere-egu24-8195, 2024.

EGU24-9808 | ECS | Posters on site | OS4.7

A subsurface oil spill study: integral ‘plume’ model and lagrangian oil droplets 

Giulia Gronchi, Nadia Pinardi, Giovanni Coppini, and Gianandrea Mannarini

Despite the imperative to mitigate climate change, most state governments still focus on oil extraction and production. This research aims to tackle the issue of oil entering the ocean from subsurface sources, such as drilling well blowouts or pipeline failures. The objective of this study is to develop a two-stage model for subsurface oil spills. Following a comprehensive review of state-of-the-art models, we delineated a near-field 'plume' phase, where buoyant oil collectively rises, and a far-field stage, characterized by the dispersion of oil droplets through ocean currents and turbulence after reaching a terminal intrusive level due to ocean stratification. UWORM (UnderWater Oil Release Model) includes an integral Lagrangian elements plume model, validated using both laboratory-scale and real-scale experiments in the North Sea. Entrainment is calibrated, demonstrating good agreement with in-situ data and length scales corresponding to different regimes. Following near-far field coupling, Lagrangian Particle Tracking is employed for individual oil droplets via OceanParcels. Size-dependent buoyancy results in the formation of distinct clusters with varying resurfacing times. Both near and far-field components utilize Copernicus Marine Service ocean state data, incorporating 3D fields of currents, temperature, and salinity.

How to cite: Gronchi, G., Pinardi, N., Coppini, G., and Mannarini, G.: A subsurface oil spill study: integral ‘plume’ model and lagrangian oil droplets, EGU General Assembly 2024, Vienna, Austria, 14–19 Apr 2024, EGU24-9808, https://doi.org/10.5194/egusphere-egu24-9808, 2024.

EGU24-11590 | ECS | Posters virtual | OS4.7

Microplastic trajectories and fates in the Canary Current System using TrackMPD 

Álvaro Cubas, Borja Aguiar-González, Daura Vega-Moreno, Eugenio Fraile-Nuez, and Francisco Machín

The pollution caused by marine microplastic debris is a significant environmental problem that affects the world’s oceans. Therefore, understanding their movement, distribution and fates in the ocean is crucial for addressing this issue. We explore the sensitivity of microplastic trajectories and fates to physical processes in the Canary Current System by employing the TrackMPD modeling framework, an existing open-access toolbox developed in MATLAB. TrackMPD resolves the limitations of previous toolboxes considering particle dynamical properties and a diverse set of physical processes. The sensitivity tests were performed through the release of virtual particles upstream the Canary Islands, using the horizontal velocity field extracted from the operational Atlantic – Iberian Biscay Irish (IBI) Ocean Analysis and Forecasting dataset. We base the sensibility test on varying the advection resolving method (RK4, RK2 and Euler Method) and the horizontal dispersion coefficient. Comparisons between scenarios are conducted by descriptive visualization of the trajectories and by computing a dimensionless Skill Score based on normalized cumulative Lagrangian separation that allows to estimate differences between trajectories. Results underscore the impact that varying physical processes parameters have on microplastic transport within the Canary Current System. These preliminary findings indicate that the transport and fates of microplastics are strongly influenced by the noteworthy mesoscale activity in the region, especially the eddies, and a coastal jet located east of the islands. After 90 days of simulation, most of the particles remain in the open ocean and those that reach the coast will mainly do so on the east coast of the islands. In all cases, average Skill Score values are above 0.8. The main differences are related to the horizontal dispersion, resulting in lower Skill Scores with higher dispersion coefficients. This effect shows no significant differences between advection scheme resolution. Moreover, the Skill Score indicates variability differences between advection schemes, where the Euler method exhibits more variability than the RK2, and the RK2 more than the RK4. This analysis provides insights into the importance of basic physical processes on the distribution and fate of microplastic debris, thereby increasing the knowledge on the topic. Ongoing analyses test the performance of the above different schemes against real case scenarios of surface drifters navigating through the Canary Current system

How to cite: Cubas, Á., Aguiar-González, B., Vega-Moreno, D., Fraile-Nuez, E., and Machín, F.: Microplastic trajectories and fates in the Canary Current System using TrackMPD, EGU General Assembly 2024, Vienna, Austria, 14–19 Apr 2024, EGU24-11590, https://doi.org/10.5194/egusphere-egu24-11590, 2024.

EGU24-11705 | Orals | OS4.7

Use of ensemble prediction systems in operational oil spill modelling 

Tor Nordam, Raymond Nepstad, Emma Litzler, Knut-Frode Dagestad, and Øyvind Breivik

Models play an important role in oil spill response and contingency planning. They are used ahead of time, to analyse possible scenarios and risks, and they are used during an active spill, to help direct response measures. Given the chaotic nature of both the ocean and the atmosphere, predictions are fundamentally challenging, particularly beyond a time window of a few days. To deal with this challenge, weather forecasters have over the last decade been moving towards ensemble prediction systems (EPS), rather than simply focusing on improved model resolution. The idea is that an ensemble of different, but (ideally) equally likely, predictions will provide useful information about the forecast uncertainty.

Given that EPS weather forecast data is increasingly available, these should be routinely used in operational oil spill modelling. In this talk, we present numerical experiments of hypothetical oil spill scenarios off the coast of Norway, using the OSCAR oil spill model. For ocean input data, we use the operational NorKyst800 ROMS setup provided by MET Norway, and for wind we use the MetCoOp Ensemble Prediction System (MEPS), a collaborative product from the Meteorological institutes of Norway, Sweden and Finland. Due to operational availability, we use only a single realisation of the ocean model, but 30 different ensemble members for the atmosphere model. We investigate the potential for the combination of EPS wind data and deterministic current data to provide added value in a response situation, even though the ocean and atmosphere data will not always be dynamically consistent. Since wind, more than currents, drive stranding and entrainment of oil, the use of a wind ensemble will provide some information about the uncertainty in predictions of surface slick as well as locations and amounts of beached oil.

Additionally, we compare the use of deterministic ocean data and EPS wind data with another setup, Barents 2.5 km, where we use a dynamically consistent set of EPS data for both the ocean and the atmosphere. We show that this latter setup has larger variation between ensemble members, indicating the potential added value for oil spill response in moving towards operational EPS forecasting also for ocean models.

How to cite: Nordam, T., Nepstad, R., Litzler, E., Dagestad, K.-F., and Breivik, Ø.: Use of ensemble prediction systems in operational oil spill modelling, EGU General Assembly 2024, Vienna, Austria, 14–19 Apr 2024, EGU24-11705, https://doi.org/10.5194/egusphere-egu24-11705, 2024.

EGU24-11899 | ECS | Posters on site | OS4.7

Clouds of bubbles and droplets; formation and distribution under breaking waves 

Arsalan Mostaani, Tor Nordam, Emlyn J. Davies, and Andreas Steinvik

Formation of bubble clouds under breaking waves and whitecaps is a prominent phenomenon in quantifying the air-sea gas exchange process. The size distribution of bubbles will impact the bubble cloud properties such as volume, concentration, and intrusion depth over time and space. The number, size, and shape of the bubbles are highly associated with the intensity of the breaking wave (i.e., wave steepness). While for low-intensity spilling waves, the rolling surface jet and the subsequent secondary (splash-up) jets may generate clouds of bubbles with nearly similar length and time scales, however under high-intensity plunging waves, a more complicated plume-cloud of bubbles may be generated due to the frontal plunging jets. In the case of an oil spill at sea, breaking waves will also lead to breakup and entrainment of a surface slick into smaller submerged droplets.

A series of lab experiments were conducted in a linear wave flume with a piston-type wave maker, investigating bubble clouds and oil droplets and their spatial and temporal properties under 2-D spilling and plunging breakers. In this work, the SINTEF SilCam camera system with a uniform LED backlight was utilized to capture images of the bubbles and droplets at high frequency. The PyOpia open-source image processing library was enhanced and subsequently trained to capture the overlapping bubbles, droplets, and individual bubbles with highly deformed shapes.

In the present poster, results extracted from the image analysis are described. We show depth- and time-resolved size distributions for both bubbles and oil droplets. Some of the size-distribution models and scales presented in the literature, for both air bubbles and oil droplets, are examined to evaluate their performance with current data.

How to cite: Mostaani, A., Nordam, T., Davies, E. J., and Steinvik, A.: Clouds of bubbles and droplets; formation and distribution under breaking waves, EGU General Assembly 2024, Vienna, Austria, 14–19 Apr 2024, EGU24-11899, https://doi.org/10.5194/egusphere-egu24-11899, 2024.

EGU24-13480 | Orals | OS4.7

SkyTruth’s Cerulean: Public Database of Near-Real-Time Oil Detections 

Jonathan Raphael and Jason Schatz

We introduce Cerulean, a fully automated machine learning pipeline designed to detect anthropogenic oil pollution across the world’s oceans in near-real-time from Sentinel-1 data. Cerulean is anticipated to provide a vital resource to researchers, environmental organizations, governments, journalists, and other stakeholders, by providing a free and public global monitoring and reporting system for oil pollution.

Cerulean was recently launched and is now accessible to the public via a state-of-the-art map-based interface (cerulean.skytruth.org) as well as an Open Geospatial Consortium (OGC) compliant API (api.cerulean.skytruth.org). These two interfaces allow unfettered access to our continuously growing database of potential oil slicks, able to be filtered against many different criteria including event timestamp, geographic area of interest, and slick area. Additionally, we cross-correlate each high-confidence slick with our vessel-tracking AIS database and our oceanic stationary infrastructure database to highlight the top three probable sources of each potential slick.

Cerulean’s code is open-source and has been published on GitHub to encourage public scrutiny for review and feedback. Though the model itself is continually being improved upon, and individual slicks should be subjected to expert review, we hope that this tool can immediately become a regular source of high-quality slick candidates for users seeking to test or corroborate their own models and systems, or to review their own sovereign waters. We are also looking for potential partners interested in collaboration to demonstrate novel value pipelines that leverage this new datasource.

How to cite: Raphael, J. and Schatz, J.: SkyTruth’s Cerulean: Public Database of Near-Real-Time Oil Detections, EGU General Assembly 2024, Vienna, Austria, 14–19 Apr 2024, EGU24-13480, https://doi.org/10.5194/egusphere-egu24-13480, 2024.

EGU24-13576 | Orals | OS4.7

Organic Pollution in Sediments along the Coastal zone of Saudi Arabia, Red Sea, During Field Survey in Summer 2021 

Yasser Abualnaja, Alexandra Pavlidou, Constantine Parinos, and Ioannis Hatzianestis

As part of the Vision 2030 for economic growth and development in the Kingdom of Saudi Arabia, the Marine and Coastal Environment Protection (MCEP) Initiative for Saudi Arabia was established (https://mcep.kaust.edu.sa/). In the frame of this project, we traced the discrete sources of pollution in critical hotspot areas including: wastewater treatment plants (WWTP), desalination plants, ports, industries, petroleum platforms, aquaculture facilities and urban development.

In this work, we present measurements of organic pollutants in sediments obtained during a surveillance cruise conducted in June 2021 with the HCMR  R/V AEGAEO, over a north - south coastal transect in the Red Sea. The hot spots areas surveyed, from north to south, were: the area near the Saudi-Jordanian border (Phosphate Terminal in Aqaba Port in Jordan; cross-border pollution) and Haql (desalination, power and WWTP, port activities), Magna (maritime traffic), Tabuk Fisheries (aquaculture activities), Duba (desalination plant), Al Wajh (port facilities; desalination plant), Red Sea Project Lagoon (north and west channels), Yanbu Cement Company (industrial discharges), Yanbu King Fahd Port (industrial and shipping center- the largest in Saudi Arabia), Jeddah Lagoon System (wastewater inputs), Jeddah Mena (port operations), Al Khurma (Jeddah WWTP), Al Lith (shrimp and fish farms), Al-Shuqaiq (desalination plant) and Jizan Economic City (expanding industrial facility).

This is the first broad coverage study in a one-off sampling campaign in Saudi Arabian coastal zone, constituting the first multidisciplinary and geographically comprehensive survey of contaminants. Aliphatic (C10-C40) and polycyclic aromatic (32 substances including both parent and methylated compounds) hydrocarbons (AHC and PAH) and polychlorinated biphenyls (PCB), which constitute important classes of organic contaminants that may cause degradation and pose a risk of serious damage in the marine environment, were determined in surface sediments collected from the coastal zone of the Red Sea. In general, north-south increasing gradients were evident for all pollutants, revealing a link between the hydrographic conditions and biogeochemical properties. AHC concentrations did not exceed 44 μg/g with the exception of Jeddah Mena, Al Khumra and Lagoons, where values almost 200 times higher were detected. Very increased PAH levels (>1000 ng/g) were measured only in the lagoons, whereas moderate pollution was found in Jeddah Mena and Al Khumra. PCBs concentrations were low in all the samples studied. The examination of various molecular indices and ratios revealed a chronic petroleum-associated anthropogenic pressure in Jeddah Lagoons, Jeddah Sea Port and Al Khumrah, whereas some petroleum residues were also found at King Fahd Yanbu Port, shrimp and fish farms near Al Lith and to a lesser extent at Magna. The domestic and industrial activities probably enrich the coastal zone of the Red Sea with organic pollutants. Hydrocarbons were linked with different sources, e.g domestic sewages (detergents) in Jeddah Lagoons and weathered petroleum in Jeddah Mena, whereas in Al Shuqaic hydrocarbons were mostly of biogenic origin. Pyrolytic PAHs predominated only in Jeddah Mena, indicating that limited combustion processes occur in the Red Sea which do not  affect the marine environment. Regarding sediment quality guidelines PAHs concentrations were, in general,  lower than ERL values.

How to cite: Abualnaja, Y., Pavlidou, A., Parinos, C., and Hatzianestis, I.: Organic Pollution in Sediments along the Coastal zone of Saudi Arabia, Red Sea, During Field Survey in Summer 2021, EGU General Assembly 2024, Vienna, Austria, 14–19 Apr 2024, EGU24-13576, https://doi.org/10.5194/egusphere-egu24-13576, 2024.

EGU24-13844 | Orals | OS4.7 | Highlight

Cleaning the bilge tanks: Is Brazil on the route of international oceanic dumping? 

Daniel Zacharias, Natália Crespo, Natália da Silva, Rosmeri da Rocha, Carine Gama, Sérgio Ribeiro e Silva, and Joseph Harari

In 2019–2020, a “Mysterious” oil spill reached almost 3,000 km of the Brazilian shore. Despite the large affected area, the STFM (Spill, Transport and Fate Model) [1] time-reverse modeling indicated a relatively small Venezuelan oil volume (5000–12,500 m3) [2] and quite far from the coast [3]. These volume and position are consistent with a cleaning bilge tank procedure.

In the following years, at least three similar events were recorded, one on the equatorial coast of Brazil and two in the Fernando de Noronha archipelago (about 375 km from the coast). These events indicated that Brazil was being periodically reached by tar balls and oil slicks from unknown origin. The most likely routes were mapped and computationally tested [3] [4].

The hypothesis is that the oil/waste dumped in international waters by ships on-route to Cape of Good Hope is reaching the Brazilian coast. On that account, 9,000 probabilistic simulations (distributed in 30-year of data), each one with 20,000 Lagrangian elements, were used to estimate the probability of dumped oil residue reaching the Brazilian coast. 

About 20,000 – 35,000 ships navigate this route and the modeling results have shown that up to 28.5 % of large ships could dump oil on-route towards Cape of Good Hope. Inside the Brazilian Exclusive Economic Zone, the probability of dumped oil/waste reaching the coastline is about 62 % and quickly decreases for more distant dumping zones (Zones 2 and 3). Equatorial and Northeast shores of Brazil are the most vulnerable to oceanic dumping when compared to other regions.

Brazilian Federal Police declared that a Greek-flagged tanker (i.e., Bouboulina) is the main suspect of the 2019’s oil spill [5]. However, the simulation results suggest an alternative hypothesis: The City of Tokyo (VL Nichioh) tanker that crossed Zone 2 area between June 18th and 20th, 2019, towards Venezuela to be loaded. The drift time (72 days) is compatible with the position, also, the loading that would take place in a few days could motivate the tanker to execute a cleaning procedure, accumulating a large volume of residual oil in the bilge tank [4].


[1] Zacharias, D.C., et al., 2018. Offshore petroleum pollution compared numerically via algorithm tests and computation solutions. Ocean Eng., https://doi.org/10.1016/j.oceaneng.2018.01.007. 

[2] Zacharias, D.C., et al., 2021a. Mysterious oil spill on Brazilian coast: analysis and estimates. Mar. Pollut. Bull., https://doi.org/10.1016/j.marpolbul.2021.112125. 

[3] Zacharias, D.C., et al., 2021b. Mysterious oil spill on the Brazilian coast – part 2: a probabilistic approach to fill gaps of uncertainties. Mar. Pollut. Bull., https://doi.org/10.1016/j.marpolbul.2021.113085.

[4] Zacharias, D.C., et al., 2023. Oil reaching the coast: Is Brazil on the route of international oceanic dumping?  Mar. Pollut. Bull., https://doi.org/10.1016/j.marpolbul.2023.115624. 

[5] Escobar, H., (2019), Mysterious oil spill threatens marine biodiversity haven in Brazil, Science, https://www.science.org/doi/full/10.1126/science.366.6466.672.  


Keywords:  STFM; Oil spill; Oil dumping

How to cite: Zacharias, D., Crespo, N., da Silva, N., da Rocha, R., Gama, C., Ribeiro e Silva, S., and Harari, J.: Cleaning the bilge tanks: Is Brazil on the route of international oceanic dumping?, EGU General Assembly 2024, Vienna, Austria, 14–19 Apr 2024, EGU24-13844, https://doi.org/10.5194/egusphere-egu24-13844, 2024.

EGU24-15185 | Posters on site | OS4.7

Oil spill risk assessment based on ocean model ensemble prediction system 

Emma Litzler, Raymond Nepstad, Tor Nordam, Johannes Röhrs, Kai H. Christensen, and Edel S. U. Rikardsen

Accidental oil spills at sea can have severe environmental impact on the marine
environment. To help quantify the risk of petroleum activities, relevant oil
spill scenarios are simulated ahead of time, to form a picture of possible
outcomes, and to estimate needs for response equipment. Formally, an
Environmental Risk Assessment (ERA) may be carried out, in which risk is
quantified by estimating the environmental consequences of different outcomes,
weighted by the probabilities of those outcomes.

Probabilities in ERA are commonly determined by ensemble simulations with an
oil spill trajectory model. Long time series of environmental data are produced
for the relevant area, and the oil spill scenario is simulated repeatedly at
different intervals within the environmental data set. Due to differences in
wind, current and other environmental parameters, the outcome of a scenario
will be different each time, and each simulation in the ensemble constitutes a
sample from the space of possible outcomes.

In this work, we run ensembles with the OSCAR oil spill model, using half a
year of data from 24 different ensemble members of an ocean model EPS (Ensemble
Prediction System) setup for the Barents Sea. We demonstrate that in addition
to the variation in outcomes from running simulations at different times, we
also get variation across the 24 different realisations of the environmental
data. Assuming that each of the ensemble members are equally likely guesses at
the ocean state, the use of the EPS data as input to the oil spill simulations
allow us to explore a larger range of possible outcomes of the oil spill.

The use of EPS in weather forecasting is already common practice, and available
to the public through ranges of uncertainty in weather apps. Given that the
transport of oil at the sea surface is to a large degree controlled by the
wind, the use of EPS data in operational oil spill modelling of ongoing events
is already possible. Making use of such data can help predict significant, but
perhaps unlikely events, such as catastrophic oiling of sensitive beaches.

How to cite: Litzler, E., Nepstad, R., Nordam, T., Röhrs, J., Christensen, K. H., and Rikardsen, E. S. U.: Oil spill risk assessment based on ocean model ensemble prediction system, EGU General Assembly 2024, Vienna, Austria, 14–19 Apr 2024, EGU24-15185, https://doi.org/10.5194/egusphere-egu24-15185, 2024.

EGU24-15262 | Posters on site | OS4.7

Coastal oil spill predictions for port’s Offensive Security Certified Professional (OSCP) qualification 

George Zodiatis, Giovanni Coppini, Antonio Augusto Sepp Neves, Svitlana Liubartseva, Juan Peña, Andreas Nikolaidis, and Constantinos Hadjistassou

The Port of Limassol is a critical hub for maritime transport and economic activities in Cyprus, and is prone to oil pollution incidents. The port is designated as a refuge for ships in need of assistance, and shelters a myriad of socio-economic resources. In alignment with international agreements and best practices, oil spill simulations are conducted addressing preventive measures and preparedness.

Several potential oil spill scenarios are considered for the Limassol Port Offensive Security Certified Professional (OSCP) qualification. They include small-to-medium volume releases caused by operational activities within the port and/or at anchorage and the vessel lanes at the Limassol Bay. The port calls include container ships, general cargo vessels, passenger and pleasure craft, navy vessels, dry docks, offshore supply vessels related to oil/gas platforms, drill ships, tankers, and vehicle carriers. Given the port traffic and diversity of vessel types three oil spill scenarios are identified within the three tier levels of potential oil spills and three additional specific scenarios were requested to be simulated as part of the Limassol port OSCP. The identified possibilities for oil spill releases due to marine traffic incidents are noted to be possible and not probable. Therefore, six oil spill scenarios were computed for oil spill simulation: 1) during offloading operations within the port, 2) ship collision outside the port’s gate, 3) outside the port from a drifting vessel, 4) ship-to-ship cargo transfers, 5) vessel grounding, and 6) small fishing vessel sinking.

Results of the oil spill simulations from the six scenarios are based on the 96 simulations using the well-established MEDSLIK model for winter (January and February) and summer (July) in 2017 and 2018. Each oil spill simulation spanned 3-4 days, manifesting once per each period. Daily hydrodynamical data of the CYCOFOS forecasting domain downscaled from the Copernicus Marine Service were used, together with the hourly SKIRON winds in the Eastern Mediterranean. Mostly, more than 50% of the initial spillage reached the shoreline of Limassol Bay. The shorter first impact on the beach was less than 24 hours, followed by gradually coastal depositions accompanied by sporadic oil washing off. For the internal oil spill sources, the impact to the port breakwaters is predicted to be at the very beginning of the leakage. Mainly, 35-47% of oil evaporated within less than 20 hours, while for the emulsified engine oil the evaporation reached 55-60%. The simulations indicate that the extent of the impacted shoreline of the Limassol Bay during winter typically exceeded the summer’s extent. In the winter, the oil spills chiefly were predicted to affect the Limassol port and, secondly, the touristic shoreline of the Limassol Bay. Conversely, in the summer, heavier oil depositions are predicted on the touristic shoreline. Nevertheless, insignificant oil depositions are predicted at the entire sea front of Limassol Bay. The simulations revealed that the numerous wave breakers located along the touristic shoreline of the Limassol Bay serve as “artificial booms” and therefore are mostly coated by the spilled oil, preventing the nearby tourist beaches from direct contamination.

How to cite: Zodiatis, G., Coppini, G., Sepp Neves, A. A., Liubartseva, S., Peña, J., Nikolaidis, A., and Hadjistassou, C.: Coastal oil spill predictions for port’s Offensive Security Certified Professional (OSCP) qualification, EGU General Assembly 2024, Vienna, Austria, 14–19 Apr 2024, EGU24-15262, https://doi.org/10.5194/egusphere-egu24-15262, 2024.

EGU24-15377 | Orals | OS4.7

Parameter estimation and sensitivity in Lagrangian oil spill models 

Jørgen Skancke and Raymond Nepstad

Lagrangian oil spill models, like many environmental models, are constructed from a large set of submodels, each with their own set of parameters and constants. The submodels belong to different domains of science, such as physical oceanography, petroleum chemistry, sediment and coastal geoscience, biochemistry, and ecotoxicology. Generally, these submodels have been derived and fitted to observations independently and within separate contexts, before being combined in some sequence to become the oil spill model. In this way, oil spill models have a large set of input parameters and constants that affect model output. When oil spill models are compared with observed data, it is challenging to know which of this large set of parameters should be adjusted to improve the model's performance against observations. Given the scale of oil spill models, parameters from different submodels can be correlated in non-trivial ways. It is also generally not known to which parameters the oil spill model displays the most sensitivity. This is further complicated by parameter sensitivity being dependent on environmental input such as wind speeds and ocean currents. Here, we present a sensitivity analysis of an idealised oil spill model, with submodels for oil surface spreading, entrainment of oil by breaking waves, resurfacing of oil, emulsification of surface oil by water uptake, and increase in viscosity of oil due because of weathering and water uptake. We discuss our results in context of improving oil spill models from observations, both laboratory data and sea-truth in the form of past spill events. 

How to cite: Skancke, J. and Nepstad, R.: Parameter estimation and sensitivity in Lagrangian oil spill models, EGU General Assembly 2024, Vienna, Austria, 14–19 Apr 2024, EGU24-15377, https://doi.org/10.5194/egusphere-egu24-15377, 2024.

Ammunition dumped in the sea generates specific problems related to decision making about what will happen in the event of a leak and the consequences when it will be taken out of the sea. One of the reasons for the difficulties in making decisions is the lack of knowledge about the dumped material (it may be, for example, chemical munitions), the level of pollution in the surrounding area, and the mobility of the sediments in which it was found. Therefore, the main goal of this work is to develop a model that will be an element of the system providing information on the mobility of sediments and thus the possibility of spreading the contaminated fraction. The whole will consist of several elements, including a demonstrator for analysing the properties of sediments. An important element is to get the real value of the threshold shear stress to calculate the current speed required to resuspend individual particles or upper sediment layers. Additionally, the properties of the sediment will be determined on the basis of the in situ collected samples. All this will allow the development of a model providing information on the mobility of bottom material introduced into the sea depths and, consequently, the contaminated area. The work concerns preliminary activities, and the concept of the system along with preliminary results will be presented. At this stage, the shear stress threshold measurement also requires tuning. It is important to add that this is to be part of a larger system to support the selection of the most appropriate approach when ammunition is found in the Baltic Sea.


The results are part of the EU MARTERA project PROBANNT. Study partially financed by the National Centre for Research and Development, Poland

How to cite: Jakacki, J. and Muzyka, M.: Assessment of resuspend bottom material into the water column during the possible removal of dumped ammunition from the sea., EGU General Assembly 2024, Vienna, Austria, 14–19 Apr 2024, EGU24-15550, https://doi.org/10.5194/egusphere-egu24-15550, 2024.

EGU24-16287 | Orals | OS4.7

Modelling the sedimentation of macro-, micro- and nanoplastics in the ocean from surface to sediment 

Nan Wu, Stuart Grieve, Andrew Manning, and Kate Spencer

The ocean is considered a sink for plastic waste, with buoyant plastics remaining at the surface for up to 50 years. Removal of plastic waste from the ocean by manpower is not feasible, but natural-based removal strategies are promising. Among these, the biological pump stands out as a crucial process responsible for transferring materials and nutrients from the surface to the deep ocean. In this context, plastic particles can be incorporated into and transported with marine snow aggregates, providing a potential mechanism for removing plastic waste from the upper ocean (human food chain) to the deep ocean. However, the longevity of plastic debris at the ocean surface remains poorly understood. To address this gap, we developed a degradation-aggregation model to predict the longevity of different types, sizes and shapes of buoyant plastics at the ocean surface. 
Our results show that the longevity of plastic debris is primarily determined by the time it takes for plastic debris to degrade sufficiently and become small enough (< 100 µm) to be incorporated into marine snow aggregates. Larger plastics take decades to degrade into small microplastics that can be trapped in marine snow, prolonging their presence in surface waters. Conversely, once microplastics are small enough to be incorporated into marine snow, they can reach the seafloor sediment within two years. Interestingly, our model highlights that vertical settling of microplastics occurs through multiple incorporation and settling via vector transport of marine snow, which differs from previous studies reporting oscillations of microplastics in the ocean subsurface. This study explains the mechanisms of plastic debris removal by the biological pump and the longevity of plastic debris at the ocean surface. In addition, this theoretical model can be extended to different aquatic ecosystems to predict the fate and longevity of plastic debris in different environments.

How to cite: Wu, N., Grieve, S., Manning, A., and Spencer, K.: Modelling the sedimentation of macro-, micro- and nanoplastics in the ocean from surface to sediment, EGU General Assembly 2024, Vienna, Austria, 14–19 Apr 2024, EGU24-16287, https://doi.org/10.5194/egusphere-egu24-16287, 2024.

EGU24-19655 | Orals | OS4.7

Spatiotemporal trends in microplastic pollution of surface waters of the Eurasian Arctic 

Svetlana Pakhomova, Igor Zhdanov, Anfisa Berezina, Tatiana Polivanova, and Evgeny Yakushev

The present study addresses spatial and temporal distribution of floating microplastics (MPs) in the Eurasian part of the Arctic Ocean. In this study we used a harmonized methods from sample collection to data reporting according to the latest recommendations of AMAP for MPs research. Studies were carried out in 6 cruises: in August-October 2019, 2020, 2021 and 2022 onboard R/V Akademik Mstislav Keldysh and R/V Akademik Ioffe. A total of 200 surface water samples were collected in the Barents, Kara, Laptev, and East-Siberian seas, comprising by far the most extensive dataset on floating microplastics in the Eurasian Arctic. Floating debris were sampled using a Neuston net with mesh size 0.33 mm, each catch lasted an average 20 minutes. All potential plastic particles were identified on ATR -FTIR (Spectrum Two, Perkin Elmer).

It was revealed that MPs pollution significantly decreases from the West to East in the Eurasian Arctic, from 19.0 µg/m3 in the Barents Sea to 11.2 µg/m3 in the Kara Sea, 3.6 µg/m3 in the Laptev Sea and 2.0 µg/m3 in the East-Siberian Sea. Less MPs were found in the Great Siberian River plumes than in high saline water. The maximum concentration of MPs was found in the Kara Gates Straight (640 µg/m3) in August in the waters flowing from the Barents Sea. This can indicate that the main source of MPs in the Siberian Arctic is located in the Barents Sea.

Variability of MPs abundance was found in the Kara Sea for different years, 1000 – 5000 items/km2 on average without a clear trend. Possible influence of several factors effecting MPs fate here was discussed, i.e. interannual changes in riverine discharge, shipping activity, Atlantic water inflow, ice cover. 

How to cite: Pakhomova, S., Zhdanov, I., Berezina, A., Polivanova, T., and Yakushev, E.: Spatiotemporal trends in microplastic pollution of surface waters of the Eurasian Arctic, EGU General Assembly 2024, Vienna, Austria, 14–19 Apr 2024, EGU24-19655, https://doi.org/10.5194/egusphere-egu24-19655, 2024.

EGU24-20650 | ECS | Orals | OS4.7

Comparison of Analytical Methods to Determine Phthalates Release from Macroplastic and Presence in Seawater 

Amedeo Boldrini, Nicola Gaggelli, and Steven Loiselle

Plastic pollution is a global issue of growing concern because of the large amount of waste ending up into terrestrial and aquatic ecosystems, primarily due to inefficient methods of end-of-life treatment. Biodegradable plastics, capable of being decomposed into harmless compounds by microorganisms, are promoted as an eco-friendly alternative to fossil-based polymers. However, environmental impact of these materials is a matter of intense debate, due to the limited knowledge of the release and decomposition of the chemicals they contain and how living species are affected by biodegradable plastic waste.

Since phthalates and other additives are generally not chemically bound to the polymers, a degradation experiment under natural environmental conditions was set up to evaluate the presence of phthalates and the release in natural seawater. Three biodegradable plastic films with similar weight and shape, made up of poly(lactic acid) and poly(butylene adipate-co-terephthalate) samples were immersed in marine water for 120 days, one exposed to heat and sunlight, the other one shielded from UV light.

The biobag samples were found to contain phthalic acid esters as additives, whether low molecular weight as dimethyl phthalate, diethyl phthalate, benzyl butyl phthalate and dibutyl phthalate, or high molecular weight including di-2-ethylhexyl phthalate and di-n-octyl phthalate. Phthalates are considered as hazardous endocrine disrupting compounds, able to induce toxic effects in humans and aquatic animals. Quantification of these chemicals in examined biobags was performed by means of HPLC-DAD and resulted in concentrations in the μg/g range across all samples.

Results of 1H-NMR analysis of seawater samples after the degradation experiment showed that phthalates leaching occurred in one of the DARK samples; however, quantification through HPLC was not achieved due to the low concentration or modification of chemical structure of phthalate esters through photo- or thermal degradation. Diverse factors can affect phthalate structure in aquatic environments, such as hydrolysis, photolysis and biodegradation, therefore a comprehensive analysis of which degradation mechanisms are involved in biodegradable plastic decomposition is crucial to assess how and at which concentration additives and breakdown products can harm living species.

How to cite: Boldrini, A., Gaggelli, N., and Loiselle, S.: Comparison of Analytical Methods to Determine Phthalates Release from Macroplastic and Presence in Seawater, EGU General Assembly 2024, Vienna, Austria, 14–19 Apr 2024, EGU24-20650, https://doi.org/10.5194/egusphere-egu24-20650, 2024.

EGU24-20977 | Posters on site | OS4.7

A near-real time oil spill detection and forecasting system for Iliad Digital Twins of the Ocean 

Katerina Spanoudaki, Sabrina Outmani, Maria Luisa Quarta, Laura Vettorello, Noemi Fazzini, Georgios V. Kozyrakis, Vassiliki Metheniti, Marco Folegani, and Nikos Kampanis

The EU funded Iliad project builds on the assets resulting from two decades of investments in policies and infrastructures for the blue economy aiming to establish an interoperable, data-intensive, and cost-effective Digital Twin of the Ocean (DTO). Iliad DTO combines ocean observations, state-of-the-art forecast models, citizen science, AI and advanced computing infrastructures (cloud computing, HPC, Internet of Things, Big Data, social networking, and more) to create high-resolution, multi-variable and multi-dimensional near real-time virtual representations of the ocean. Continuously integrating data from numerous in-situ sensors and satellites, Iliad DTO can provide a platform for researchers, policy makers, the industry, and citizens, to monitor the impact of climate change and human activities on ocean health and productivity and make data driven management decisions for a sustainable blue economy. Several Digital Twin (DT) pilots will be undertaken in key thematic areas such as offshore wind energy, wave and tidal energy, biodiversity assessments, fisheries and aquaculture, marine pollution and more.

The current work presents the Oil Spill Response Digital Twin pilot developed in the frame of Iliad. The DT focuses on Cretan Sea and aims to provide early detection of marine oil spills and operational forecasting of spill trajectories to support immediate response to pollution events, minimizing thus the impact on marine ecosystems, coastal communities and the economy and reducing the time for environmental recovery. A multi-model approach is followed for predicting the fate and transport of oil spills, employing MEDSLIK-II and OpenDrift particle tracking models, coupled to operational, high-resolution numerical weather (WRF), hydrodynamic (NEMO) and sea state (WAVEWATCH III) models for Cretan Sea. Real-time observations (current speed/direction, sea water temperature, wave height) from novel, low-cost on-line sensors are integrated in the DT and assimilated into the operational metocean forecasting chain for validation purposes and for improving models’ forecasting skills. A near-real time automatic oil spill detection system, from Sentinel-1 SAR images, is developed, which allows early detection of marine oil spills and triggers the oil spill forecasting system, producing accurate short-term forecasting of spills’ trajectories and fate. Automatic detection and classification of oil spill events employs a trained FCOS which performs initial object detection, fine-tuned with a dataset of +1000 SAR images, including 4 different classes (oil spill, look-alike, ship, land). Image pre-processing and oil spill mask delineation is performed using SNAPpy-based (Sentinel Application Platform Python toolbox) adaptive thresholding algorithms. The oil spill detection and forecasting system is tested by reconstructing the Ulysse-Virginia oil spill, which occurred off the coast of Corsica on October 7th, 2018. Sentinel-1 images are used to detect and delineate the coverage of the spill, to initiate Medslik-II and OpenDrift models for simulating the oil spill fate and transport. Oil spill predictions are produced using different metocean forcings, highlighting the importance of high-resolution metocean data in accurate forecasting of oil spill trajectories. Quantitative metrics are used to evaluate the ability of the oil spill models to reproduce the satellite oil spill observations. 


Acknowledgement: This research has received funding from the European Union’s H2020 RIA programme under GA No 101037643.

How to cite: Spanoudaki, K., Outmani, S., Quarta, M. L., Vettorello, L., Fazzini, N., Kozyrakis, G. V., Metheniti, V., Folegani, M., and Kampanis, N.: A near-real time oil spill detection and forecasting system for Iliad Digital Twins of the Ocean, EGU General Assembly 2024, Vienna, Austria, 14–19 Apr 2024, EGU24-20977, https://doi.org/10.5194/egusphere-egu24-20977, 2024.

EGU24-21393 | ECS | Posters on site | OS4.7

Modeling the Oslofjord bottom oxygen regime interdecadal changes affected by increased waste water discharge in 1970s 

Anfisa Berezina, Evgeniy Yakushev, Andre Staalstrøm, and Helene Frigstad

Oxygen regime in the vicinity of the sediment-water interface (SWI) was studied with a coupled benthic-pelagic model 2DBP (Yakushev et al., 2020), that considers biogeochemical processes occurring in the water column and the sediments in the same model domain. C-N-P-Si-O-S-Mn-Fe biogeochemical model BROM describes in detail the processes of organic matter mineralization in oxygen-depleted conditions that are vitally important for assessing biogeochemical impacts (i.e., denitrification, metal reduction, sulfate reduction). This allows us to predict changes in redox conditions at the bottom as a function of seasonality (organic matter production and destruction, vertical mixing), anthropogenic (eutrophication), and climatic (temperature and mixing ) factors.

This model was applied to the Western Oslo Fjord subjected to an intensive organic waste discharge in the 1960s-1970s. In this period, it was documented the disappearance of shrimps in the bottom layer and increased primary production in the surface layer.

This work aimed to reconstruct the Oslo Fjord SWI redox conditions in the past decadal period (1930-2023). It was numerically demonstrated the interconnection between an amount of supplying with waste water organic matter and oxygen depletion processes in the bottom layer. It was shown that in the 1970s there was a shift from normoxic to anoxic conditions. It was also estimated the period of the system restoration to normoxic conditions after the improvement of the wastewater plant in the 1980s. This model can be used for analyzing the consequences of future changes under different scenarios of nutrient discharges to the Fjord.

How to cite: Berezina, A., Yakushev, E., Staalstrøm, A., and Frigstad, H.: Modeling the Oslofjord bottom oxygen regime interdecadal changes affected by increased waste water discharge in 1970s, EGU General Assembly 2024, Vienna, Austria, 14–19 Apr 2024, EGU24-21393, https://doi.org/10.5194/egusphere-egu24-21393, 2024.

EGU24-21844 | Posters on site | OS4.7

Contaminants of Emerging Concern in the Marine Environment: An Integrated Effects Assessment Approach (CONTRAST) 

Steven Brooks, Samantha Martins, Bavo De Witte, Juan Bellas, Ketil Hylland, Aourell Mauffret, Joachim Sturve, Ed Temperley, Jon Barber, Marina Lipizer, Christos Tsabaris, Evgeniy Yakushev, and Adam Lillicrap

The Horizon Europe project, CONTRAST, will develop an integrated assessment and effect-based monitoring framework (IAF) to measure the impacts of contaminants of emerging concern (CECs) on the marine environment, which will contribute to the assessment of Good Environmental/ Ecological Status for application in EU policy (MSFD/WFD). The IAF will involve chemical measurements together with biological effects endpoints optimised to detect the presence and effect of CECs in the marine environment. Chemical prioritisation schemes will identify the CECs that pose the greatest threat to marine life and select which CECs to target in the laboratory experiments, where the effects on organisms and biodiversity will be assessed. In silico, in vitro and in vivo bioassays will be used to determine the mechanisms of toxicity of selected CECs. Providing information on how CECs interact with organisms at environmentally relevant concentrations and which biological effects tools should be used in the IAF to cover the range of toxicity mechanisms that CECs produce. A series of European-wide case studies will be used to test the suitability of the IAF to measure the effects of chemicals including CECs on indicator species and biodiversity and to model fate of CECs in marine environment. The knowledge gained from field testing and laboratory studies will form the basis for guidance documents and policy briefs on best practices for performing an IAF on CECs in the marine environment and help to provide the necessary protection of marine ecosystems.

How to cite: Brooks, S., Martins, S., De Witte, B., Bellas, J., Hylland, K., Mauffret, A., Sturve, J., Temperley, E., Barber, J., Lipizer, M., Tsabaris, C., Yakushev, E., and Lillicrap, A.: Contaminants of Emerging Concern in the Marine Environment: An Integrated Effects Assessment Approach (CONTRAST), EGU General Assembly 2024, Vienna, Austria, 14–19 Apr 2024, EGU24-21844, https://doi.org/10.5194/egusphere-egu24-21844, 2024.

EGU24-380 | ECS | Orals | OS4.9

Deep-Learning Based Seasonal Chlorophyll Forecasting in the Tropical Atlantic  

Gabriela Martinez Balbontin, Julien Jouanno, and Rachid Benshila

Accurate biogeochemical forecasting of the oceans is crucial for ecosystem and fisheries management. In this study, we propose a methodology for chlorophyll forecasting at a seasonal scale by leveraging physical ocean forecasts and autoencoders, a type of convolutional neural network. Chlorophyll-a is a key indicator of phytoplankton biomass, and it offers the advantage of being relatively easy to measure at a large scale using satellite-based color sensors. Specifically, this approach focuses on estimating surface chlorophyll concentrations in the Tropical Atlantic from forecasted physical properties of the ocean: sea surface temperature and salinity, sea surface height, and mixed layer depth. 

The proposed method is trained on the GlobColour dataset, a cloud-free, merged chlorophyll concentration output from various sensors, from 1998 to 2009. Seven-month forecasts are performed for the period 2010–2020, with monthly initialization. We show that we can skillfully integrate data from the ECMWF’s long-range forecasting system, SEAS5, to predict multiannual and seasonal chlorophyll levels. Evaluation against 2010–2020 GlobColour data demonstrates the autoencoder’s skill in capturing spatial and temporal patterns. Seasonal performance was assessed for regions of interest, including the Equatorial and Senegal-Mauritania upwelling regions, the Inter-Tropical Convergence Zone (ITCZ), and the Northern Atlantic. The neural network consistently outperforms the biogeochemical reanalysis of reference in measured skill and has the additional advantage of being less resource-intensive than traditional models. 

These results further confirm the potential of deep-learning techniques in operational oceanographic applications. Future work will focus on expanding this approach to generating global-scale, multi-nutrient forecasts in the context of the European Digital Ocean Twin (EDITO) project, which aims to provide an environment to exploit this type of machine-learning based simulation algorithms. 

How to cite: Martinez Balbontin, G., Jouanno, J., and Benshila, R.: Deep-Learning Based Seasonal Chlorophyll Forecasting in the Tropical Atlantic , EGU General Assembly 2024, Vienna, Austria, 14–19 Apr 2024, EGU24-380, https://doi.org/10.5194/egusphere-egu24-380, 2024.

EGU24-1338 | Orals | OS4.9

Zooplankton and Micronekton products from the Copernicus Marine Service catalogue: state of the current product and development plan 

Olivier Titaud, Anna Conchon, Laurène Mérillet, Sarah Albernhe, and Héloïse Magliano

Since mid-2019, meso-zooplankton and micronekton reanalyses (large past time series that are processed with time-consistent forcings) are available and regularly extended for the Copernicus Marine Service catalogue. The product (also known as MICRORYS) is computed using SEAPODYM-LMTL, the Lower and Mid Trophic levels model of the Spatial Ecosystem And POpulation DYnamic Modeling framework. Meso-zooplankton organisms (200µm-2mm) constitute the low-trophic level. These organisms are transported along with the water masses. Micronekton organisms, constituting the mid-trophic level, are bigger organisms (2-20cm) able to swim over short distances. SEAPODYM models the spatial and population dynamics of the LMTL population with a system of advection-diffusion-reaction equations. The vertical dimension is simplified into three layers (namely epipelagic, upper, and lower mesopelagic). Layers matches the vertical distribution of organisms that is observed. The six micronekton groups are defined according to their diel vertical migration from the surface at night to the deep ocean during the day. Now MICRORYS products use a global configuration of SEAPODYM at 1/12° daily resolution. This product has evolved considerably since the first delivery. We propose here to review the state of the art of this product. Some case studies and the developments that are expected soon, especially those concerning a new computational grid that bypasses the problem at the poles will be presented.

How to cite: Titaud, O., Conchon, A., Mérillet, L., Albernhe, S., and Magliano, H.: Zooplankton and Micronekton products from the Copernicus Marine Service catalogue: state of the current product and development plan, EGU General Assembly 2024, Vienna, Austria, 14–19 Apr 2024, EGU24-1338, https://doi.org/10.5194/egusphere-egu24-1338, 2024.

EGU24-5332 | ECS | Posters on site | OS4.9

A wave ensemble prediction system for the Mediterranean Sea 

Konstantinos Kampouris and Gerasimos Korres

An ensemble wave prediction system (EPS) at a 1/16o grid horizontal resolution is being developed for the Mediterranean Sea, based on the WAM Cycle 6 wave model implementation. Open boundary conditions are provided by a North Atlantic wave model at 1/6o resolution. Uncertainty is forced in the Med-waves EPS (in both the Mediterranean and the North Atlantic wave models), through a reduced size ensemble of 10m winds provided from the ECMWF atmospheric EPS (50 members + 1 control run) at approximately 18 km spatial resolution with a forecast horizon of 10 days ahead. The nominal ECMWF EPS ensemble size (50 ensemble + 1 control members) is reduced to 23+1 members using clustering techniques (k-means method). The Mediterranean 10-day ensemble wave forecasts are verified for a 6-month period (Jan-Jun 2022) against available satellite and wave buoys observations, as well as reference cases, like the forecast of the NRT Med-waves of the Copernicus Marine Service. A variety of both deterministic and probabilistic metrics are used in the verification process, in order to access as many forecast quality attributes as possible and to best determine the performance of the EPS. In general, the wave EPS shows a good forecast skill, which after the first 3-4 forecast days becomes even better than the skill of the deterministic Med-waves Copernicus Marine forecast system, indicating the importance of the ensemble approach as the forecast ranges increase.

How to cite: Kampouris, K. and Korres, G.: A wave ensemble prediction system for the Mediterranean Sea, EGU General Assembly 2024, Vienna, Austria, 14–19 Apr 2024, EGU24-5332, https://doi.org/10.5194/egusphere-egu24-5332, 2024.

EGU24-5334 | ECS | Orals | OS4.9

Estimates of the dissolved organic carbon concertation from remote sensing in the frame of the OCROC project. 

Marie Montero, Hubert Loisel, Daniel S.F Jorge, Marine Bretagnon, Julien Demaria, Aurélien Prat, Ana Gabriela Bonelli, Lucile Duforêt-Gaurier, and Antoine Mangin

Carbon monitoring from space is critical for the reporting and verification of carbon stocks and changes in both coastal and open ocean waters. In the frame of the OCROC project, funded by the Copernicus 2 – 1st Service Evolution Call for Tenders (2022-2024), we focus on the particulate (POC) and dissolved (DOC) organic carbon of surface oceanic and coastal waters, which represent the two components of the total organic carbon (TOC) pool in the ocean. The present presentation is mainly dedicated to the estimation of DOC, the main contributor to TOC, over open ocean waters. An enhanced version of the Ocean and Land Color Instrument's (OLCI) DOC algorithm of Bonelli et al. (2022) is presented and adapted to historical and present ocean color sensors. This algorithm employs two different Artificial Neural Network (ANN) algorithms depending on the Optical Water Classes, and four input parameters namely the absorption coefficient of Colored Dissolved Organic Matter (acdom(443)) chlorophyll-a concentration (Chl-α),  Sea Surface Temperature (SST), and Mixed Layer Depth (MLD). In this new version of the algorithm SST and MLD are both delivered by COPERNICUS (Multi Observation Global Ocean ARMOR3D L4 analysis and multi-year reprocessing).  Each of the four input parameters is provided at a distinct time lag to enhance the accuracy of the model. Furthermore, a revisited “match-up” database, compared to the one used in Bonelli et al. (2022), is utilized to validate the algorithm across multiple ocean color missions.

How to cite: Montero, M., Loisel, H., Jorge, D. S. F., Bretagnon, M., Demaria, J., Prat, A., Bonelli, A. G., Duforêt-Gaurier, L., and Mangin, A.: Estimates of the dissolved organic carbon concertation from remote sensing in the frame of the OCROC project., EGU General Assembly 2024, Vienna, Austria, 14–19 Apr 2024, EGU24-5334, https://doi.org/10.5194/egusphere-egu24-5334, 2024.

EGU24-6692 | Orals | OS4.9

Advancements in the Ongoing Development of the Black Sea Physical Analysis and Forecasting System 

Mehmet Ilicak, Diana Azevedo, Eric Jansen, Salvatore Causio, Leonardo Lima, Adil Sozer, Aljaz Maslo, Sergio Creti, Francesco Trotta, Giovanni Coppini, and Nadia Pinardi

The Black Sea Physical Analysis and Forecasting System (BSFS) operates within the Black Sea Monitoring and Forecasting Centre (BLK-MFC) as part of the Copernicus Marine Service (CMEMS). Here we present ongoing research and development activities for the future generations of the BSFS. The current system has the 1/40-degree horizontal grid NEMO ocean model featuring 121 vertical levels. Significant enhancements encompass the integration of biharmonic horizontal viscosity instead of the traditional Laplacian constant viscosity. This adaptation effectively mitigates small-scale grid noise, thereby elevating accuracy in representing mesoscale eddies.

A notable advancement includes the implementation of a two-way nested domain surrounding the Bosphorus Strait, employing the NEMO-AGRIF mesh refinement algorithm. This newly constructed high-resolution Bosphorus Strait domain has a 1/200-degree horizontal resolution, facilitating much better resolution of the strait's bathymetry.

Further refinements encompass recent developments targeting improvements in the model's eddy kinetic energy (EKE), relative vorticity fields, and minimized drift below the thermocline which is crucial for longer integration in a reanalysis scope. A concurrent effort involves the ongoing development of a new domain encompassing the Azov Sea, coupled with a sea-ice model. This initiative involves the utilization of different bulk formulas, enabling the incorporation of sea ice fluxes and AGRIF mesh refinement capabilities.

Testing of the enhanced domain configuration involves rigorous assessments aimed at validating the efficacy of these updates, ensuring a comprehensive evaluation of the system's performance.

How to cite: Ilicak, M., Azevedo, D., Jansen, E., Causio, S., Lima, L., Sozer, A., Maslo, A., Creti, S., Trotta, F., Coppini, G., and Pinardi, N.: Advancements in the Ongoing Development of the Black Sea Physical Analysis and Forecasting System, EGU General Assembly 2024, Vienna, Austria, 14–19 Apr 2024, EGU24-6692, https://doi.org/10.5194/egusphere-egu24-6692, 2024.

EGU24-7146 | ECS | Orals | OS4.9

LETKF-based Ocean Research Analysis (LORA): A new ensemble ocean analysis dataset 

Shun Ohishi, Takemasa Miyoshi, and Misako Kachi

Various ocean analysis products have been produced and used for geoscience research. In the Pacific region, there are four high-resolution regional analysis datasets [JCOPE2M (Miyazawa et al. 2017) and FRA-ROMS II (Kuroda et al. 2017) with 3D-VAR; NPR-4DVAR (Hirose et al. 2019) with 4D-VAR; and DREAMS with a Kalman filter (Hirose et al. 2013)], but there are no EnKF-based analysis datasets to the best of the authors’ knowledge.

Recently geostationary satellites such as Himawari-8 and -9 have been providing sea surface temperatures (SSTs) at high spatiotemporal resolution. To use these data effectively, we have developed an eddy-permitting EnKF-based ocean data assimilation system at horizontal resolution of 0.25° with a short assimilation interval of 1 day and demonstrated that the combination of three schemes [incremental analysis update (IAU; Bloom et al. 1996), relaxation-to-prior perturbation (RTPP; Zhang et al. 2004), and adaptive observation error inflation (AOEI; Minamide and Zhang 2017)] significantly improved dynamical balance and analysis accuracy (Ohishi et al. 2022a, b). With the recent enhancement of computational resources, we have developed higher-resolution eddy-resolving ocean data assimilation systems at horizontal resolution of 0.1° and produced ensemble analysis products for the western North Pacific (WNP) and Maritime Continent (MC) regions called the LETKF-based Ocean Research Analysis (LORA)-WNP and -MC, respectively (Ohishi et al. 2023). The validation results show that the LORA has sufficient accuracy for geoscience research and various applications such as fisheries and marine transport. Since March 2023, the LORA-WNP and -MC have been released at JAXA-RIKEN Ocean Analysis website (https://www.eorc.jaxa.jp/ptree/LORA/index.html).

How to cite: Ohishi, S., Miyoshi, T., and Kachi, M.: LETKF-based Ocean Research Analysis (LORA): A new ensemble ocean analysis dataset, EGU General Assembly 2024, Vienna, Austria, 14–19 Apr 2024, EGU24-7146, https://doi.org/10.5194/egusphere-egu24-7146, 2024.

EGU24-10659 | Posters on site | OS4.9

ECMWF 6th generation ocean and sea-ice reanalysis system (ORAS6) 

Eric de Boisseson, Hao Zuo, Marcin Chrust, Philip Browne, Magdalena Balmaseda, and Patricia de Rosnay

Ocean and sea-ice reanalyses are reconstructions of historical ocean and sea-ice states by ingesting observations into simulated model states through data assimilation methods. Reanalysis provides invaluable information for climate monitoring and is an essential component in long-term prediction such as seasonal to decadal forecasts. The Ocean ReAnalysis System-6 (ORAS6) is the 6th generation of ocean and sea-ice reanalysis system developed at ECMWF. ORAS6 is forced by hourly ERA5 atmospheric fields and uses an ensemble variational ocean data assimilation (EDA) to produce an 11-member ensemble of ocean reanalyses. Both the new EDA system and the use of the latest reprocessed input datasets help making better use of ocean observations to provide ocean states with improved fit to observations both at the surface and the subsurface, a better representation of the daily cycle of the surface temperature and more accurate ocean transports. ORAS6 sea-ice states are produced using a new multi-category sea ice model assimilating sea-ice concentration observations and show improved fit to satellite observations. This increased complexity came with its lot of technical challenges but now opens the door for the future assimilation of new sea-ice variables such as sea-ice thickness and new diagnostics such as snow depth over sea-ice that will benefit from future satellite missions.

Ocean and sea-ice states from ORAS6 will be used to initialise the ocean component of the ECMWF operational coupled ensemble forecasts and provide the lower boundary conditions for the upcoming ERA6 atmospheric reanalysis produced by the Copernicus Climate Change Service (C3S). This presentation will feature results from the first stream of production of ORAS6 covering the most recent decade as well as a preview of ORAS6 streams covering the rest of the satellite-observed decades as well as the pre-satellite period with a focus on performance evaluation against the current ECMWF operational system-5 (ORAS5).

How to cite: de Boisseson, E., Zuo, H., Chrust, M., Browne, P., Balmaseda, M., and de Rosnay, P.: ECMWF 6th generation ocean and sea-ice reanalysis system (ORAS6), EGU General Assembly 2024, Vienna, Austria, 14–19 Apr 2024, EGU24-10659, https://doi.org/10.5194/egusphere-egu24-10659, 2024.

EGU24-10942 | Posters virtual | OS4.9

Progresses in assessing the quality of the Copernicus Marine near real time Northeast Atlantic and Shelf Seas models application. 

Stefania Angela Ciliberti, Axel Alonso, Arancha Amo-Baladron, Lluis Castrillo, Manuel Garcia, Romain Escudier, Bruno Levier, Elodie Gutknecht, Guillaume Reffray, Lotfi Aouf, Alice Dalphinet, Louna Louise, Roland Aznar, Marcos Sotillo, and Sylvain Cailleau

Qualification and validation of operational ocean products are fundamental processes and vital part of the Copernicus Marine Service for evaluating added value of any new or upgraded release and for monitoring forecasting systems skills in operations. These have an important impact on both users and model developers, in providing a comprehensive understanding of forecasting systems reliability. As cross-cutting activity at production units’ level, and as providers of analysis and forecast ocean products for the Iberia-Biscay-Ireland (IBI) and Northwest Shelf (NWS) regions in the frame of the Copernicus Marine Service, we are continuing to incrementally evolve evaluation methods of forecasting products by improving our capacity in analysing ocean model data using newly available in-situ and satellite observations.

In this presentation, an overview of today capacity in assessing operational ocean model products derived from the Northeast Atlantic and Shelf Seas regions model is presented, including evaluation of ongoing numerical experiments, with an outlook on future product quality evolution. Starting from the NARVAL tool, currently used by the IBI Monitoring and Forecasting Centre for assessing daily operational production of physical and biogeochemical variables, we show how new digital tools can support regional fit-for-purpose assessment and perform multi-model/multi-parameter/multi-frequency verification (with a particular focus on biogeochemical variables) by accessing, using, and interoperating operational products available in the target regions through the Copernicus Marine Data Store.

This work presents the operational daily evaluation and monitoring of the IBI and NWS Blue and Green Ocean products, with a focus on recent systems upgrades and on forecast performances. Evolutions of product quality tools will include integration of new product types - like interim and multi-year regional datasets - with implementation of new metrics, and development of a new digital validation service where users (e.g., end users and intermediate users, including operational teams) will have access to NWS operational systems skills.

How to cite: Ciliberti, S. A., Alonso, A., Amo-Baladron, A., Castrillo, L., Garcia, M., Escudier, R., Levier, B., Gutknecht, E., Reffray, G., Aouf, L., Dalphinet, A., Louise, L., Aznar, R., Sotillo, M., and Cailleau, S.: Progresses in assessing the quality of the Copernicus Marine near real time Northeast Atlantic and Shelf Seas models application., EGU General Assembly 2024, Vienna, Austria, 14–19 Apr 2024, EGU24-10942, https://doi.org/10.5194/egusphere-egu24-10942, 2024.

EGU24-12551 | ECS | Orals | OS4.9

Enhancement of coastal winds and surface ocean currents with deep learning – The Copernicus Marine Service Evolution KAILANI project 

Manuel Garcia-Leon, Lotfi Aouf, José María García-Valdecasas, Alice Dalphinet, Juan Asensio, Roland Aznar, José María Terrés, Tania López Pérez, and Marcos G Sotillo

Coastal stakeholders are adding ocean forecasts in their daily operations. The Copernicus Marine Service - Monitoring and Forecasting Centres (CMS - MFCs) are evolving to meet these user new demands. For instance, the wave forecast service at the Iberian-Biscay-Ireland area (IBI-WAV) is being upgraded with increases in model resolution (from 1/20º to 1/40º) and the delivery of new variables (e.g. maximum wave height). 

Enhancing coastal forcings (winds and surface currents) reinforces these forthcoming upgrades. Higher model resolution benefits local-scale phenomena representation (i.e. wind wave growth or wave refraction due to currents), but errors in the forcings may degrade the expected performance. The Copernicus Marine Service Evolution project KAILANI (2022-2024) aims to improve the accuracy of these operational forcings by correcting them with Artificial Neural Networks (ANNs). These ANNs are fed with remote sensing data as target datasets, allowing to predict complex spatial patterns by using the same forcings as predictors.

Three pilot sites have been selected to develop this methodology: (i) the Galician area (NE-Atlantic, macrotidal), (ii) the Canary Islands (NE-Atlantic, mesotidal) and (iii) the Ebro Delta (NW Mediterranean, microtidal).

The ANN for coastal winds has been trained with Satellite Synthetic Aperture Radar (SAR; data from the ESA Sentinel-1 mission). Due to the nature of the data (i.e. good spatial coverage, but with revisit times up to several days), the ANN architecture consists of a Generative Adversarial Network (GAN) that uses Convolutional layers for addressing the spatial dimension. The ANN is able to downscale ECMWF-IFS wind fields from 1/10º to 1/40º resolution, adding spatial features learnt a priori from SAR data. The ANN-predicted winds present lower speed bias (up to 30% in specific areas) and RMSD (up to 10%) than original ECMWF-IFS winds.  

Surface currents are predicted with ANNs based on Autoencoders (AE), using hourly-averaged HF-Radar data as target dataset (retrieved from Copernicus Marine In-Situ TAC). Spatial and time dimension are addressed with Convolutional and Long Short-term Memory (LSTM) layers, respectively. The input data includes (i) IBI-PHY currents and (ii) atmospheric forcings from ECMWF-IFS. The AE improves error metrics respect IBI-PHY, showing speed and directional biases close to 2 cm/s and 7º (achieving bias decreases of 45% and 60% in some areas, respectively).

These ANN-driven wind and currents forcings will be used in pre-operational tests by the IBI-WAV service. If successful, this methodology could be transferred into operations of the IBI NRT wave forecast system, as well as to be extended in other CMS regional MFCs. 

How to cite: Garcia-Leon, M., Aouf, L., García-Valdecasas, J. M., Dalphinet, A., Asensio, J., Aznar, R., Terrés, J. M., López Pérez, T., and G Sotillo, M.: Enhancement of coastal winds and surface ocean currents with deep learning – The Copernicus Marine Service Evolution KAILANI project, EGU General Assembly 2024, Vienna, Austria, 14–19 Apr 2024, EGU24-12551, https://doi.org/10.5194/egusphere-egu24-12551, 2024.

EGU24-13185 | Posters virtual | OS4.9

Multi-decadal surface wind forcing products for the Copernicus Marine Service 

Rianne Giesen and Ad Stoffelen

The ocean surface wind plays a key role in the exchange of heat, gases and momentum at the atmosphere-ocean interface. It is therefore crucial to accurately represent the wind forcing in physical ocean model simulations. A comparison of scatterometer observations and global numerical weather prediction (NWP) model wind fields revealed substantial local systematic errors in wind vector components and spatial derivatives. The widespread use of NWP model winds in the computation of ocean surface processes implies that these biases propagate into modelled air-sea fluxes, surface waves and currents.

Temporally-averaged gridded differences between geolocated scatterometer wind data and NWP wind fields can be used to correct for persistent local NWP wind vector biases. By combining these scatterometer-based bias corrections with global, hourly NWP wind fields, high-resolution wind forcing products can be created for the ocean modelling community and other users.

In 2022, new hourly and monthly Level-4 (L4) surface wind products were introduced in the Copernicus Marine Service catalogue. These products include global bias-corrected 10-m stress-equivalent wind, surface wind stress fields and spatial derivatives. The bias corrections are calculated from Copernicus Marine Service Level-3 wind products for a combination of scatterometers and their collocated European Centre for Medium-range Weather Forecasts (ECMWF) model winds. The hourly real-time product covers the past two years and uses ECMWF operational model forecasts. The hourly and monthly multi-year products currently span the period from August 1999 to 3 months before present-day and are based on the ECMWF ERA5 reanalysis. In 2024, the multi-year products will be extended backward to 1991, covering a period of more than 30 years. The spatial bias correction fields are found to be highly consistent between different scatterometers and over time. Compared to the uncorrected ECMWF winds, the L4 winds correspond better to moored buoy observations and independent scatterometer observations. Like any Copernicus Marine Service product, the wind products are freely and openly available for all operational, commercial and research applications.

How to cite: Giesen, R. and Stoffelen, A.: Multi-decadal surface wind forcing products for the Copernicus Marine Service, EGU General Assembly 2024, Vienna, Austria, 14–19 Apr 2024, EGU24-13185, https://doi.org/10.5194/egusphere-egu24-13185, 2024.

EGU24-14472 | Posters on site | OS4.9

Digital Twin Ocean for China Coastal Seas 

Fei Chai

With over 2 billion people relying on the marine resources, the East Asian seas have nourished rapid economic growth over the past decades. But this comes at the expense of ocean health. Coastal-SOS - “Coastal Zones Under Intensifying Human Activities and Changing Climate: A Regional Programme Integrating Science, Management and Society to Support Ocean Sustainability”, a UN Ocean Decade endorsed project aims to provide solutions for the sustainable development of coastal ocean through effective integration of science, governance, and society. Numerical modelling is a key programmatic effort, serving synthesis analysis, mechanistic studies, and most importantly, predictions, which will contribute to construct the next generation of product: the data-model fully integrated Digital Twin Ocean. One of the expected outcomes of this project is a decision-making support system and toolbox aided by numerical modelling and the Digital Twin Ocean initiative that will result in integrated coastal management and development of marine spatial planning and ecosystem conservation practices. I will review the existing observational data and modelling work in Xiamen Bay and Changjiang Estuary which are two pilot sites and discuss plan of constructing a Digital Twin Ocean in these regions.

How to cite: Chai, F.: Digital Twin Ocean for China Coastal Seas, EGU General Assembly 2024, Vienna, Austria, 14–19 Apr 2024, EGU24-14472, https://doi.org/10.5194/egusphere-egu24-14472, 2024.

EGU24-15360 | ECS | Posters on site | OS4.9

Baltic Sea reanalysis from Copernicus Marine Service – soaked in local knowledge 

Ida Margrethe Ringgaard

A regional reanalysis is like a good local restaurant: it builds on local knowledge and focus is on local specialities. For the Baltic Sea, one of the most important local ‘specialities’, or features, is the gateway: the narrow and shallow Danish Straits where the salty North Sea water mass meets with the fresh Baltic Sea water. If this very important process of inflow of saline and oxygen-rich water from the North Sea into the Baltic Sea is not modelled correctly, the results will be of insufficient quality, and not represent the ocean accurately. Currently, global ocean models cannot run with sufficiently high resolution, nor do they focus on local features required to simulate the Baltic Sea adequately. This requires a regional ocean model. Here we present the CMEMS high-resolution ocean reanalysis for the Baltic Sea covering the 30 year period 1993 to 2023. The reanalysis consists of the physical state as well as the bio-geo-chemical state and the waves. Preliminary results from 2 on-going tasks will also be presented: 1) extending the reanalysis back in time to 1980 and 2) expanding the data assimilation from the present parameters (SST and in-situ temperature and salinity profiles) to include sea ice concentration, nutrients and oxygen.

How to cite: Ringgaard, I. M.: Baltic Sea reanalysis from Copernicus Marine Service – soaked in local knowledge, EGU General Assembly 2024, Vienna, Austria, 14–19 Apr 2024, EGU24-15360, https://doi.org/10.5194/egusphere-egu24-15360, 2024.

EGU24-15466 | Posters on site | OS4.9

GEORGE-project provides next-generation multiplatform ocean observing technologies for RIs, a joint data flow from the sea bed to the surface ocean, and applies novel tools for knowledge sharing. 

Janne-Markus Rintala, Socratis Loucaides, Matt Mowlem, Laurent Coppola, Leymarie Edouard, Ute Schuster, Meike Becker, Juanjo Dañobeitia, Nadine Lanteri, Richard Sanders, Tommi Männistö, Laura Sinikallio, Katri Ahlgren, Yann-Hervé de Roeck, and Kutsch Kutsch and the GEORGE-Project

The ocean observing research infrastructures (RIs) in Europe (i.e. ICOS, EMSO, Euro-Argo) have successfully implemented a world-leading system of standardised Ocean observations over the past 15 years, building on more than a century of experiences by the involved marine institutes. This community has joined forces in the GEORGE project to take their observation to the next level of technology: GEORGE aims to develop an already existing observations network with novel state-of-the-art biogeochemical, multi-platform observing system operated across ERICs that can carry out integrated biogeochemical observations for characterisation of the Ocean carbon system. We have brought together 28 partners from leading European ocean-observing technology developers, academia, and the observing community. In addition to improving the measurement technologies of the existing RI’s, GEORGE will also streamline data treatment, e.g., quality control and the data flow to repositories, as well as adopt the novel methods developed for knowledge sharing to endorse rigorous learning without boundaries to ensure the sustainability of future ocean observations.

How to cite: Rintala, J.-M., Loucaides, S., Mowlem, M., Coppola, L., Edouard, L., Schuster, U., Becker, M., Dañobeitia, J., Lanteri, N., Sanders, R., Männistö, T., Sinikallio, L., Ahlgren, K., de Roeck, Y.-H., and Kutsch, K. and the GEORGE-Project: GEORGE-project provides next-generation multiplatform ocean observing technologies for RIs, a joint data flow from the sea bed to the surface ocean, and applies novel tools for knowledge sharing., EGU General Assembly 2024, Vienna, Austria, 14–19 Apr 2024, EGU24-15466, https://doi.org/10.5194/egusphere-egu24-15466, 2024.

EGU24-15653 | Posters on site | OS4.9

European contribution to the OneArgo array 

Claire Gourcuff, Alan Berry, Fiona Carse, Dimitris Kassis, Birgit Klein, Kjell Arne Mork, Giulio Notarstefano, Violeta Slabakova, Colin Stedmon, Andreas Sterl, Virginie Thierry, Laura Tuomi, Pedro Velez, Waldemar Walczowski, and Simo-Matti Siiriä

The Argo Programme is a major component of both the Global Ocean Observing System (GOOS) and the Global Climate Observing System (GCOS), providing near-real time data for ocean and atmospheric services and high-quality data for climate research. Although originally designed to provide temperature and salinity profiles in the upper 2 km of the ice-free ocean, the array has been expanded into seasonal ice zones. In addition, regional pilot programmes have demonstrated that some Argo floats can now measure biogeochemical parameters to address oceanic uptake of carbon, acidification, and deoxygenation (BioGeoChemical, BGC-Argo) and some floats are also able to make measurements throughout the water column down to 6000 m depth (Deep-Argo). These new BGC-Argo and Deep-Argo Missions, together with the initial Core-Argo Mission form the new global, full-depth and multidisciplinary OneArgo programme (Roemmich et al. 2019).

Euro-Argo aims at maintaining ¼ of the global OneArgo array, with a regional perspective focusing on European marginal seas (Mediterranean, Black and Baltic seas) and the European part of the Arctic seas.

The Euro-Argo strategy focuses on providing sustained high quality oceanic data to the scientific community for better understanding of the role of the Ocean in the Earth’s climate. Addressing issues of climate change along with expanding floats’ capabilities and coverage are at the centre of the Euro-Argo strategy. Another domain of grand challenges is related to the health of the oceanic ecosystem and its impacts on society. The recent technological advances in biogeochemical instrumentation on Argo floats have greatly improved the ability to address ecosystem monitoring, and gather data in the European marine areas to support climate and biodiversity policies set up by the European Union. Moreover, Argo is a major source of information for operational centres such as the Copernicus Marine and Climate Services and the European Centre for Medium-Range Weather Forecasts (ECMWF) in Europe, for the provision of ocean and weather forecasts and seasonal predictions. Euro-Argo supports the enhancement of monitoring and observing systems at regional scales for model-assimilation and model-validation purposes. In particular, the extensions of Argo into the deep ocean and ecosystem parameters offer new possibilities and will help to constrain and improve the models and resulting products.

Within this context, Euro-Argo is currently revising its deployment and coverage strategy for the next decade, taking into consideration specific European needs in terms of in situ ocean observations, while contributing to the global OneArgo new ambitious design.

We will present this strategy and provide some highlights on the challenges for the years to come.

How to cite: Gourcuff, C., Berry, A., Carse, F., Kassis, D., Klein, B., Mork, K. A., Notarstefano, G., Slabakova, V., Stedmon, C., Sterl, A., Thierry, V., Tuomi, L., Velez, P., Walczowski, W., and Siiriä, S.-M.: European contribution to the OneArgo array, EGU General Assembly 2024, Vienna, Austria, 14–19 Apr 2024, EGU24-15653, https://doi.org/10.5194/egusphere-egu24-15653, 2024.

EGU24-16173 | ECS | Posters on site | OS4.9

Designing and delivering user-driven products and services through Copernicus Marine Service  

Valentina Giunta, Corinne Derval, Laurence Crosnier, and Muriel Lux

The Copernicus Marine Service is one of the six pillar services of the Copernicus program. It follows a user-driven process by taking into consideration user feedback to consistently improve its portfolio of products and services. Mercator Ocean International (here MOi) is entrusted by the European Union to implement the Copernicus Marine Service over the 2021-2027 period. Consequently, MOi is maintaining a permanent dialogue with users to collect their requirements and support them in the use of the service. Public Core users, such as policy stakeholders and regional sea conventions, are the main target, but Copernicus Marine Service is open to all communities (Core and non-Core users). Thus, MOi manages and analyses feedback from all users on the current service and their requirements for the service evolution. The user feedback process is dynamic and constantly evolving to target specific audiences and expertise. Currently, user needs are being collected through diverse channels and sources, such as through the User Support team, but also through training and surveys. To plan the service evolution, feedback from groups with specific expertise is needed to help fill the gap in what is being offered and to improve the data quality. As an example of these target audiences, the Champion User Advisory Group (CUAG), formed by active users of Copernicus Marine Service, and the National Marine Stakeholders Group, formed by member states, were consolidated. These groups allow regular interactions and communication among expert users and policymakers, which have been proven to be resourceful sources of feedback that help towards better services and data products. Among the main needs expressed by users, increasing spatial and temporal resolution of global models and reanalysis products, having longer ocean forecasts, and improving quality data are the top priorities.  With the added value of feasibility studies, these inputs are considered and evaluated internally and discussed with the producer's centers to ensure that the planned roadmap is aligned with the user requirements. Additionally, knowledge gaps and cutting-edge scientific developments are identified to plan the service evolution activities in the short, intermediate, and long term to better serve marine policy implementation and scientific research. In conclusion, the goal of this user-driven approach is to give Copernicus Marine Service the capacity to effectively answer users’ needs on ocean monitoring and forecasting at European and global levels. 

How to cite: Giunta, V., Derval, C., Crosnier, L., and Lux, M.: Designing and delivering user-driven products and services through Copernicus Marine Service , EGU General Assembly 2024, Vienna, Austria, 14–19 Apr 2024, EGU24-16173, https://doi.org/10.5194/egusphere-egu24-16173, 2024.

EGU24-16783 | Orals | OS4.9

Development of a near real-time demonstrator based on a very high-resolution global ocean model 

Clement Bricaud, Jerome Chanut, Romain Bourdalle Badie, Mary Malicet, and Yann Drillet

In the framework of the Copernicus Marine Environment Monitoring Service, Mercator Ocean International operates a global high-resolution forecasting systems at the resolution of 1/12°. Increasing resolution appears necessary to improve the quality of service and to satisfy the users’ needs in the operational application (Le Traon, 2019). Resolving scales below 100 kilometers, and in particular sub mesoscale processes (1-50 km), appears to be essential to better represent the circulation in the open ocean (Chassignet, 2017), and, to improve the large-scale representations thanks to a more explicit energy transfers between finer and larger scales (Fox-Kemper Baylor, 2019). A deeper understanding of their various contributions (geostrophic flows, tidal motions, waves, inertial currents) and their role in the global ocean kinetic energy budget will improve the knowledge of these energy transfers between different scales.  

In 2019, it has been decided to go towards higher resolution and develop a new global sub mesoscale-permitting model. Benefiting from the context of the European H2020 IMMERSE project, a new 1/36° global configuration (2 to 3 km resolution), based on the NEMO 4.2 OGCM, has been developed. Thanks to the resolution increase, this model can resolve the Rossby radius in almost all open oceans areas at global scale quite everywhere and to span a large part of the internal wave spectrum. 

In 2022, a hierarchy of multi-year simulations at 1/4°, 1/12° and 1/36° resolution and with/without explicit tide representation has been performed: for each resolution, after a 3-years spin up without tidal forcing, 2 twin 3-years runs have been realized: one without tidal forcing and one forced by the 5 tidal components K1, O1, S2, M2, N2. These models are driven at the surface by the 8km/1hour ECMWF IFS system. Atmospheric pressure forcing has been activated. 

In 2023, in the framework of the EDITO-Model Lab project, the development of a near real-time demonstrator has been started. The system is based on the new 1/36° global configuration and constrained by a spectral nudging to the CMEMS/MOI global 1/12° real-time system (for temperature , salinity , horizontal velocities and  sea ice concentration).

We propose a first evaluation of the benefits due to the resolution increase and tidal forcing. Circulation, energy, tidal representation and mixing of the experiments are compared to each other’s. 

How to cite: Bricaud, C., Chanut, J., Bourdalle Badie, R., Malicet, M., and Drillet, Y.: Development of a near real-time demonstrator based on a very high-resolution global ocean model, EGU General Assembly 2024, Vienna, Austria, 14–19 Apr 2024, EGU24-16783, https://doi.org/10.5194/egusphere-egu24-16783, 2024.

EGU24-17414 | Orals | OS4.9

Leveraging data challenges to enhance Copernicus Marine Service products and align with the future European Digital Twin of the Ocean. 

Sammy Metref, Maxime Ballarotta, Clément Ubelmann, Maxime Beauchamp, and Clément Busché

The SLICING (Sea Level Innovations and Collaborative Intercomparison for the Next-Generation products) project is a Copernicus Service Evolution project that responds to the evolving landscape of sea level processing. SLICING promotes a novel approach centered on open and collaborative data challenges for altimetric product developments and assessments. With a focus on fostering collaboration and methodological advancement, SLICING aligns with the objectives of the Copernicus Marine Service (CMEMS) and the overarching spirit of the European Digital Twin of the Ocean (DTO).


With the growing influence of artificial intelligence in oceanography and the advances of oceanographic observations, such as the new SWOT satellite, the surge in innovative methodologies and processing techniques is huge. However, these scattered efforts and the lack of generic and open comparisons is still a hindrance to reliably inform operational process chains. SLICING proposes a structured framework for the comparison of state-of-the-art methods and operational products to assess processing techniques and improve altimetry products. This framework not only aims to enhance the quality of observation and mapping processing for CMEMS but also provides a blueprint for the CMEMS Sea Level Thematic Assembly Centre evolution. By formulating altimetric processing problems as data challenges on collaborative platforms, SLICING attempts to provide a link between scientific innovation and operational implementation, addressing the gap between research and production. These challenges, rooted in rigorous software development practices, transcend mere method testing. They act as catalysts for collaboration, bringing together scientists around key operational altimetric processing issues.


In this presentation, we show examples of open comparisons for preprocessing the new SWOT data and mapping conventional altimetry. Through these examples, we offer a comprehensive overview of the strides made during the SLICING project, shedding light on advancements in sea level processing and the facilitation of collaborative data challenges. This overview can serve as a valuable exploration into the dos and don'ts that emerged from the project, offering insights into effective strategies for fostering collaborations and enhancing the quality of oceanographic products. By distilling the lessons learned, this broader perspective is intended to guide future initiatives, both within the CMEMS and in the broader context of the European DTO. Indeed, through shared problem formulation, evaluation metrics, and reproducible practices, the work carried out in the SLICING project exemplifies how the spirit of collaborative data challenges aligns with the DTO's vision of a unified digital platform.


How to cite: Metref, S., Ballarotta, M., Ubelmann, C., Beauchamp, M., and Busché, C.: Leveraging data challenges to enhance Copernicus Marine Service products and align with the future European Digital Twin of the Ocean., EGU General Assembly 2024, Vienna, Austria, 14–19 Apr 2024, EGU24-17414, https://doi.org/10.5194/egusphere-egu24-17414, 2024.

EGU24-17473 | Posters on site | OS4.9

Evaluation of annual and interannual trends of marine Chlorophyll concentration 

Antoine Mangin, Quentin Jutard, Aurélien Prat, Julien Demaria, and Marine Bretagnon

Since 1997, remote sensing of the ocean colour has routinely documented ecosystems health and productivity on a global scale. Therefore, these observations, especially chlorophyll-a concentration, are particularly important not only for the management of living marine resources but also for climate studies as the ocean might act as a sink or a source of carbon for the atmosphere. In such a context, reliable evaluations of trends, whether seasonal, annual, or especially interannual variations, are critical.

There are several products of surface chlorophyll concentrations derived from ocean colour sensing available through the Copernicus Marine Service. Some of them are more adapted to specific regional seas and use adapted algorithms for chlorophyll retrieval. There also exist chlorophyll products at global scale that are built with different assumptions each of them aiming at building the best time series (from 1997 up to now) for climate analysis. Moreover, some products offer uncertainty estimates and/or quality indicators that are useful for trend computations. We will present an intercomparison of trend evaluations made with these different products at different time scales (annual and interannual). Differences will be commented on and explained.

How to cite: Mangin, A., Jutard, Q., Prat, A., Demaria, J., and Bretagnon, M.: Evaluation of annual and interannual trends of marine Chlorophyll concentration, EGU General Assembly 2024, Vienna, Austria, 14–19 Apr 2024, EGU24-17473, https://doi.org/10.5194/egusphere-egu24-17473, 2024.

EGU24-18063 | ECS | Orals | OS4.9

Retrieving Sea Ice Information in the Pan-Arctic Region from Synthetic Aperture Radar 

Tore Wulf, Jørgen Buus-Hinkler, Suman Singha, Mads Hvid Ribergaard, Till Soya Rasmussen, and Matilde Brandt Kreiner

The Arctic’s unprecedented transformation due to anthropogenic warming necessitates close monitoring of sea ice to understand and address climate change impacts. As the sea ice retreats and becomes thinner, increased human activity in the region emphasizes the urgent need for detailed, near real-time sea ice information as well as improved sea ice forecasts for maritime safety and planning.

Current methods of Arctic sea ice retrieval relies on passive microwave (PMW) sensors, which offer global coverage but struggle to capture fine-scale features and changes in the sea ice. Synthetic Aperture Radar (SAR) imagery, with its high spatial resolution and independence from sunlight and clouds, is pivotal in the year-round mapping of Arctic sea ice conditions that is carried out manually at the national ice services. Yet, automating SAR-based sea ice retrieval remains challenging due to inherent ambiguities in the observations.

Recent advances in deep learning vision methodologies show promise in SAR-based sea ice retrievals. A robust pan-Arctic SAR-based sea ice retrieval system can serve maritime sectors, national ice services, and local communities by providing timely, high-resolution sea ice information. Furthermore, SAR-based sea ice retrievals can be assimilated in numerical ocean and sea ice models, improving sea ice forecasts crucial for local communities and maritime sectors.

Here, we present a comprehensive deep learning approach to retrieve high-resolution sea ice concentration and calibrated uncertainties from Sentinel-1 SAR and AMSR-2 PMW observations at a pan-Arctic scale for all seasons. Daily pan-Arctic sea ice products based on our methodology will be operationally provided as part of the Copernicus Marine Service portfolio by the end of 2024. Further, we are in the process of producing daily pan-Arctic products for the entire Sentinel-1 era, which began with the launch of Sentinel-1A in 2014. 

Lastly, we present preliminary results for the impact of assimilating level-2 SAR-based sea ice concentrations gap-filled with level-2 PMW-based sea ice concentration in the HYCOM-CICE coupled ocean-sea-ice forecasting system for the pan-Arctic region. 

How to cite: Wulf, T., Buus-Hinkler, J., Singha, S., Ribergaard, M. H., Rasmussen, T. S., and Kreiner, M. B.: Retrieving Sea Ice Information in the Pan-Arctic Region from Synthetic Aperture Radar, EGU General Assembly 2024, Vienna, Austria, 14–19 Apr 2024, EGU24-18063, https://doi.org/10.5194/egusphere-egu24-18063, 2024.

EGU24-18174 | Posters on site | OS4.9

Multi-Resolution Ocean Color roducts to support the Copernicus Marine High-Resolution Coastal Service  

Dimitry van der Zande, Aida Alvera-Azcárate, Joppe Massant, and Kerstin Stelzer

High-quality satellite-based ocean colour products can provide valuable support and insights in the management and monitoring of coastal ecosystems. Today’s availability of Earth Observation (EO) data is unprecedented including traditional medium resolution ocean colour systems (e.g. Sentinel-3/OLCI) and high-resolution land sensors (e.g. Sentinel-2/MSI). Each of these sensors offers specific advantages in terms of spatial, temporal or radiometric characteristics, enabling the provision of different types of ocean colour products. This is also reflected in the portfolio of the Copernicus Marine service providing a number of different OC products to support different types of end users. While “traditional” ocean colour sensors like Sentinel-3 OLCI provide daily temporal resolution, the sensors onboard these satellites do not measure at the necessary high spatial resolution to resolve complex coastal dynamics. High spatial resolution sensors, like MSI onboard Sentinel-2 (10m - 60m resolution), are able to resolve these small scales, but their temporal revisit time is far from optimal (about 5 days considering the Sentinel-2 A & B constellation). Additionally, both high spatial resolution datasets and traditional ones are hindered by the presence of clouds, resulting in a large amount of missing data.

Given the high complementarity of these two measurement strategies, we present a methodology to derive daily cloud-free multi-resolution ocean colour products from the synergistic use of Sentinel-2 and Sentinel-3 data by applying DINEOF (Data Interpolating Empirical Orthogonal Functions). A key processing step in the gap-filling procedure is the harmonization between the ocean colour products (e.g. chlorophyll-a concentration -CHL-, Turbidity -TUR-) between the Sentinel-2/MSI and Sentinel-3/OLCI sensor. Due to differences between the sensors regarding spectral band sets and viewing geometry, CHL algorithms used for Sentinel-3/OLCI cannot be directly transferred to Sentinel-2/MSI resulting in the chlorophyll-a products often having diverging values between both sensors. To increase the coherency between the Sentinel-2/MSI and Sentinel-3/OLCI CHL products, a machine learning technique (LightGBM) was used to transfer the more complex CHL algorithms (e.g. band ratio algorithms, switching algorithms, other machine learning algorithms) from Sentinel-3/OLCI to Sentinel-2/MSI. Subsequently, DINEOF is used to generate the daily multi-resolution products by using the daily OLCI products to support gap-filling in the high-resolution 5-daily coastal products and retaining the high spatial resolution of Sentinel-2/MSI data and the high temporal resolution of OLCI data in the final product.

The machine learning and multi-resolution gap-filling approach will be demonstrated and validated in different regions (e.g. North Sea, North Adriatic Sea) to ensure suitability of the approach for integration into the operational high resolution COPERNICUS Marine Service. An analysis of TUR and CHL daily products at 100m resolution will be presented, alongside an analysis of the spatial and temporal scales retained by the approach. This work was performed in the Copernicus Marine Service Evolution Project MultiRes (21036-COP-INNO-SCI)

How to cite: van der Zande, D., Alvera-Azcárate, A., Massant, J., and Stelzer, K.: Multi-Resolution Ocean Color roducts to support the Copernicus Marine High-Resolution Coastal Service , EGU General Assembly 2024, Vienna, Austria, 14–19 Apr 2024, EGU24-18174, https://doi.org/10.5194/egusphere-egu24-18174, 2024.

EGU24-18271 | Posters on site | OS4.9

Disko Bay ocean and sea ice forecast 

Till Rasmussen, Mads Hvid Ribergaard, and Imke Sievers

The maritime industry continues to expand in the waters around Greenland. Apart from fisheries, which by far is the most important income for Greenland, another important element is transportation of goods and tourist, which in many locations are dependent on the conditions at sea. During the last two winters (2022 and 2023) severe sea ice conditions have been seen in Disko Bay. Especially in 2022, there were discussions on whether or not to fly in supplies instead of using the usual transportation on the ocean. A trustworthy high-resolution forecast of ocean and sea ice conditions could have remedied this decision.

Currently automated retrievals of observations from remote sensing and forecast model are doing a reasonable job when describing the current conditions and forecasting the short-term offshore conditions, however users are often interested in near shore coastal areas, where resolution matters. The near coastal environment is often not well resolved in Arctic/global models forecast models.

This study aim at developing a high-resolution (sub kilometer scale) operational coastal marine forecasting system built on the shoulders of already existing Copernicus services for the area of Disko Bay on the west coast of Greenland. In combination with already, existing products such as automated and manual ice charts it will improve the warning system for the area. A side effect is that the ice service will produce more frequent ice charts for Disko Bay, which will benefit the existing Copernicus Marine Service.

The seamless physical downscaling from the Copernicus Marine Services system to the near coastal area in Disko Bay will utilize boundary conditions from the Arctic Marine forecasting system. The system will be forced by a high-resolution none hydrostatic atmospheric forecast from the Danish Meteorological Institute at 2½km resolution. The study is funded by the Copernicus user demonstration program named “COP-INNO-USER”.

This presentation will focus on the developments within the service, benefits and challenges. It will also discuss how to integrate the results into operations at the Danish Meteorological Institute.


How to cite: Rasmussen, T., Hvid Ribergaard, M., and Sievers, I.: Disko Bay ocean and sea ice forecast, EGU General Assembly 2024, Vienna, Austria, 14–19 Apr 2024, EGU24-18271, https://doi.org/10.5194/egusphere-egu24-18271, 2024.

EGU24-18710 | ECS | Posters on site | OS4.9

Near-real-time maximum wave height estimates over the Mediterranean Sea 

Charikleia L.G. Oikonomou and Gerasimos Korres

The Med-WAV system of the Mediterranean component (MED MFC) of the Copernicus Marine Environment Service has consistently been providing high-resolution wave product analyses, forecasts, and reanalyses. Accurately predicting wave parameters, particularly during storms, is crucial for ensuring maritime safety, the resilience of offshore structures, and managing coastal hazards. Consequently, since November 2023, the Mediterranean Sea Waves Analysis and Forecast product (MEDSEA_ANALYSISFORECAST_WAV_006_017, Korres et al., 2023) has been delivering estimates of the maximum crest-to-trough height, utilising the methodology proposed by Benetazzo et al. (2021). The system's ability to represent short-term maximum wave statistics is assessed through a comprehensive evaluation against buoys positioned in the western part of the basin, accessible via Copernicus Marine in-situ TAC (2023) (product INSITU_GLO_WAV_DISCRETE_MY_013_045). The results confirm that the operational system adeptly estimates maximum wave height over the Mediterranean Sea in accordance with the quality metrics identified in previous literature.

References

Korres, G., Oikonomou, C., Denaxa, D., & Sotiropoulou, M. (2023). Mediterranean Sea Waves Analysis and Forecast (Copernicus Marine Service MED-Waves, MEDWAΜ4 system) (Version 1) [Data set]. Copernicus Marine Service (CMS). https://doi.org/10.25423/CMCC/MEDSEA_ANALYSISFORECAST_WAV_006_017_MEDWAM4

Benetazzo A., Barbariol F., Pezzutto P., Staneva J., Behrens A., Davison S., Bergamasco F., Sclavo M. and Cavaleri L. (2021). Towards a unified framework for extreme sea waves from spectral models: rationale and applications. Ocean Eng. 219, 108263. https://doi.org/10.1016/j.oceaneng.2020.108263

Copernicus Marine in situ TAC (2023). Copernicus Marine In Situ - Global Ocean Wave Observations Reanalysis. SEANOE. https://doi.org/10.17882/70345

How to cite: Oikonomou, C. L. G. and Korres, G.: Near-real-time maximum wave height estimates over the Mediterranean Sea, EGU General Assembly 2024, Vienna, Austria, 14–19 Apr 2024, EGU24-18710, https://doi.org/10.5194/egusphere-egu24-18710, 2024.

EGU24-19810 | Posters on site | OS4.9

Arctic Ocean, North and Baltic Sea GHRSST-compliant SST and IST products for the Copernicus Marine Service 

Ioanna Karagali, Magnus Barfod Suhr, Pia Nielsen-Englyst, Wiebke Kolbe, and Jacob Høyer

Satellite missions carrying Thermal Infrared (TIR) and Passive Microwave Sensors (PMW) allow for high-resolution Sea Surface Temperature (SST) and Sea-Ice Surface Temperature (IST) retrievals under clear skies (TIR) and all weather retrievals (PMW) albeit with coarser resolution. This allows the continuous provision of SST and IST to operational Numerical Weather Prediction systems, climate models and to the wider scientific community. DMI is a Production Unit (PU) for the Sea Ice (SI) and SST Thematic Assembly Centers (TAC) of the Copernicus Marine Monitoring Service (CMS) providing a suite of level 4 SST products for the Arctic Ocean, the Baltic and North Sea daily, hourly and as multi-year products.

The L4 Near-Real-Time (NRT) SST product SST-BAL-SST-L4-NRT-OBSERVATIONS-010-007-b is a daily, multi-sensor, gap-free, optimally interpolated product derived from night-time SST retrievals at high resolution (0.02o), available from 2016 onward. The L4 Multi-Year SST product SST-BAL-SST-L4-REP-OBSERVATIONS-010-016 is a daily, multi-sensor, level 4 optimally interpolated product using infra-red satellite observations from the ESA CCI and Copernicus C3S projects and high resolution sea ice information from SMHI and the SI TAC available from 1982 to 2022. The L4 Near-Real-Time Diurnal SST product SST-BAL-PHY-SUBSKIN-L4-NRT-010-034 is an hourly, gap-free satellite sub-skin SST analysis using L2P and L3 single-sensor SST data as input.

For the Arctic Ocean, the L4 NRT SST/IST product ARC-SEAICE-L4-NRT-011-008 is a daily, multi-sensor, gap-free and optimally interpolated analysis of sea surface and sea-ice surface temperatures at a resolution of 0.05o extending north of 58 oN and available from 2018 onwards. The corresponding MY product, ARC-SEAICE-L4-NRT-011-016, is the first combined SST and IST analysis of the Arctic available from 1982 and up to 2023.

Within the current C3S portfolio, DMI will provide the SST ECV, i.e. a global (up to 90o latitude), sub-skin product (20 cm) with a 0.05o spatial resolution. The aim of the present study is to provide an overview of the available products and their performance along with insights on future developments and products.

How to cite: Karagali, I., Barfod Suhr, M., Nielsen-Englyst, P., Kolbe, W., and Høyer, J.: Arctic Ocean, North and Baltic Sea GHRSST-compliant SST and IST products for the Copernicus Marine Service, EGU General Assembly 2024, Vienna, Austria, 14–19 Apr 2024, EGU24-19810, https://doi.org/10.5194/egusphere-egu24-19810, 2024.

EGU24-20156 | ECS | Posters virtual | OS4.9

Underlying models for the European Digital Twin Ocean, a demonstration of three Focus Applications 

Lőrinc Mészáros, Felix Lucas Dols, Joanna Staneva, Jacob Benjamin, Johannes Pein, Wei Chen, Giovanni Coppini, Gianandrea Mannarini, Ivan Federico, Mario Leonardo Salinas, Momme Butenschön, Jens Murawski, Jun She, Nadia Pinardi, Jacopo Alessandri, Marco Seracini, and Ghada El Serafy

The EDITO-Model Lab project is aiming to develop the next generation of ocean and coastal models, combining artificial intelligence and high-performance computing, to be integrated into the EDITO public infrastructure, providing access to Focus applications. The improved core model suite together with automated model builders and downscaling tools, as well as high-resolution data sources from both numerical simulations and machine learning approaches will be published in an interactive manner on the EDITO platform.

In this work we demonstrate the capabilities of the European Digital Twin Ocean in so called Focus Applications, designed for intermediate users that are interested in ocean and coastal management. The Focus Applications cover three areas in line with the EU Mission "Restore our Ocean and Waters". Biodiversity: Optimizing Marine Protected Areas by simulating biodiversity indicators and habitat suitability; Zero Carbon: Reducing carbon emissions of the marine transportation industry by including waves and currents in optimizing ship routing; and Zero Pollution: Reducing marine pollution by simulating the transport of oil spills and marine plastics, assessing hazards and backtracking to the source.

By developing these Focus Applications and deploying them in the EDITO public infrastructure, the EDITO Model Lab consortium hopes to showcase the value of the next generation of ocean models (DTO engine), moreover contribute to a fruitful discussion with intermediate users around observing, simulating, forecasting and projecting coastal and ocean processes. This work includes interactive demonstrations.

How to cite: Mészáros, L., Lucas Dols, F., Staneva, J., Benjamin, J., Pein, J., Chen, W., Coppini, G., Mannarini, G., Federico, I., Leonardo Salinas, M., Butenschön, M., Murawski, J., She, J., Pinardi, N., Alessandri, J., Seracini, M., and El Serafy, G.: Underlying models for the European Digital Twin Ocean, a demonstration of three Focus Applications, EGU General Assembly 2024, Vienna, Austria, 14–19 Apr 2024, EGU24-20156, https://doi.org/10.5194/egusphere-egu24-20156, 2024.

EGU24-20382 | Posters on site | OS4.9

Time series of major phytoplankton functional types serving as an Ocean Monitoring Indicator (OMI) for Copernicus Marine Service   

Hongyan Xi, Marine Bretagnon, Julien Demaria, Antoine Mangin, and Astrid Bracher

In the framework of Copernicus Marine Service Evolution Program, our project GLOPHYTS aims at establishing a complete and systematic approach for a consistent long-term monitoring of surface ocean phytoplankton function types (PFTs) on global scale. The current global PFT products available on CMEMS are generated based on remote sensing reflectance from multi-sensor merged and Sentinel-3 OLCI data and OSTIA sea surface temperature product, using a set of empirical-orthogonal-function based PFT algorithms that were previously developed and recently updated within GLOPHYTS. These products provide global chlorophyll a data with per-pixel uncertainty for five PFTs spanning from 2002 until today. A correction and merging scheme has been applied to these PFT data sets of different sensors to generate long-term consistent satellite PFT products, which are expected to act as potentially important ocean monitoring indicators (OMI). In providing inter-annual variation and trend analyses of the surface phytoplankton community structure, the OMI is likely to help in the assessment of the ocean health. In the context of this study, we present the PFT time series on global scale and for some key regions, e.g.  the Arctic Ocean. For the latter, we will also show the perspective of improving PFT estimations using machine learning techniques. The proposed improved Arctic PFT products can supplement the current ocean colour data sets for the Arctic Ocean in the Copernicus Marine Service.

How to cite: Xi, H., Bretagnon, M., Demaria, J., Mangin, A., and Bracher, A.: Time series of major phytoplankton functional types serving as an Ocean Monitoring Indicator (OMI) for Copernicus Marine Service  , EGU General Assembly 2024, Vienna, Austria, 14–19 Apr 2024, EGU24-20382, https://doi.org/10.5194/egusphere-egu24-20382, 2024.

EGU24-20729 | ECS | Orals | OS4.9

Combining Neural Networks and Data Assimilation to enhance the spatial impact of Argo floats in the Copernicus Mediterranean biogeochemical model 

Carolina Amadio, Anna Teruzzi, Gloria Pietropolli, Luca Manzoni, Gianluca Coidessa, and Gianpiero Cossarini

Biogeochemical-Argo (BGC-Argo) float profiles provide substantial information for key vertical biogeochemical dynamics and successfully integrated in biogeochemical models via data assimilation approaches. Although results on the BGC-Argo assimilation are encouraging, data scarcity remains a limitation for their effective use in operational oceanography. To address availability gaps in the BGC-Argo profiles, an Observing System Experiment (OSE), that combines Neural Network (NN) and Data Assimilation (DA), has been performed here. NN was used to reconstruct nitrate profiles starting from oxygen profiles and associated Argo variables (pressure, temperature, salinity), while a variational data assimilation scheme (3DVarBio) has been upgraded to integrate BGC-Argo and reconstructed observations in the Copernicus Mediterranean operational forecast system (MedBFM). To ensure high quality of oxygen data, a post-deployment quality control method has been developed with the aim of detecting and eventually correcting potential sensors drift. The Mediterranean OSE features three different setups: a control run without assimilation; a multivariate run with assimilation of BGC-Argo chlorophyll, nitrate, and oxygen; and a multivariate run that also assimilates reconstructed observations. The general improvement of skill performance metrics demonstrated the feasibility in integrating new variables (oxygen and reconstructed nitrate). Major benefits have been observed in reproducing specific BGC process-based dynamics such as the nitracline dynamics, primary production and oxygen vertical dynamics. The assimilation of BGC-Argo nitrate corrects a generally positive bias of the model in most of the Mediterranean areas, and the addition of reconstructed profiles makes the corrections even stronger. The impact of enlarged nitrate assimilation propagates to ecosystem processes (e.g., primary production) at basin wide scale, demonstrating the importance of BGC profiles in complementing satellite ocean colour assimilation.

How to cite: Amadio, C., Teruzzi, A., Pietropolli, G., Manzoni, L., Coidessa, G., and Cossarini, G.: Combining Neural Networks and Data Assimilation to enhance the spatial impact of Argo floats in the Copernicus Mediterranean biogeochemical model, EGU General Assembly 2024, Vienna, Austria, 14–19 Apr 2024, EGU24-20729, https://doi.org/10.5194/egusphere-egu24-20729, 2024.

EGU24-21102 | Posters on site | OS4.9

Improved product quality in WAVE-TAC Copernicus Marine Service 

Annabelle Ollivier, Patricia Zunino, Romain Husson, Adrien Nigou, Alexandre Philip, and Gerald Dibarboure

In the frame of the second phase of the Copernicus Marine Service, starting in 2022, the WAVE Thematic Assembly Centre (TAC), a partnership between CLS and CNES, is responsible for the provision of a near-real-time wave service that started in July 2017. Near-real-time wave products derived from altimetry and SAR measurements are processed and distributed onto the Copernicus Marine Service catalogue.

This presentation will describe the existing products – along-track Level 3 and gridded Level 4 – and their applications such as near-real-time assimilation in wave forecasting systems, validation of wave hindcasts, etc.

In 2023, nadir data from SWOT mission and S6 were added to the constellation, enlarging the number of missions and techniques proposed in this TAC.

R&D work with internal users show that improving nadir data resolution near cost to 5Hz data enlarge the observability of coastal zones and high variability areas.

The product quality from CFOSAT mission dedicated to wave observation get better and better, with non wave signal filtering and a wider observability of wavelength between 30m and 1000m.

Working on the complementarity of observation between the different missions, Sentinel1, altimetry, CFOSAT and now SWOT appears as the new challenge.

The gridded Level-4 SWH and Spectral product directly benefit from the merging of information for NRT products.

How to cite: Ollivier, A., Zunino, P., Husson, R., Nigou, A., Philip, A., and Dibarboure, G.: Improved product quality in WAVE-TAC Copernicus Marine Service, EGU General Assembly 2024, Vienna, Austria, 14–19 Apr 2024, EGU24-21102, https://doi.org/10.5194/egusphere-egu24-21102, 2024.

Ocean regional climate variability is a part of the Earth's complex system that can influence the occurrence and intensity of extreme weather events. Variability in ocean temperature can either amplify or mitigate the impact of these events. For example, the El Niño phenomena affect weather conditions in various parts of the world, leading to droughts, floods, and altered precipitation patterns. Furthermore, regional climate variability is also linked to changes in sea level. Understanding regional variability is crucial for predicting how sea level changes will vary in different parts of the world, which has profound implications for coastal communities and infrastructure. To contribute to this understanding, we have developed a novel method that combines K-means clustering and Principal Component Analysis to extract ocean climate modes at a regional scale worldwide. This integrated approach automatically identifies regions of variability, allowing for the emulation of coastal and regional sea level variations across multiple timescales. It also has the potential to offer valuable insights into the significance of temperature across multiple depth layers extending up to 700 meters. The produced set of regional sea-level emulators are a complementary source of information in coastal areas, especially in situations where satellite altimetry encounters challenges and/or tide-gauge sensor records are incomplete, thereby supporting well-informed decision-making.

How to cite: Radin, C. and Nieves, V.: Exploring Regional Ocean Climate Variability: Insights from Integrated Clustering and Principal Component Analysis., EGU General Assembly 2024, Vienna, Austria, 14–19 Apr 2024, EGU24-120, https://doi.org/10.5194/egusphere-egu24-120, 2024.

EGU24-2297 | ECS | Posters on site | ITS1.2/OS4.10

Parameterizing ocean vertical mixing using deep learning trained from high-resolution simulations 

Rin Irie, Helen Stewart, Tsuneko Kura, Masaki Hisada, and Takaharu Yaguchi

Ocean vertical mixing plays a fundamental role in phenomena such as upwelling of nutrient-rich deep waters, and is crucial for determining net primary productivity in the ocean [1]. Simulating vertical mixing requires careful consideration and ingenuity for stable execution, as vertical mixing is often turbulent. Direct Numerical Simulations, in which the Navier-Stokes equations are solved without a turbulence model, are not realistic due to the enormous computational complexity. Ocean General Circulation Models (OGCMs) have low resolution and cannot directly resolve small-scale turbulence such as vertical mixing. Consequently, OGCMs based on the Reynolds Averaged Navier-Stokes equations use turbulence parameterizations to model the effect of unresolved motions on the mean flow [2]. Although K-Profile Parameterization (KPP) is widely recognized as a method for parameterizing vertical mixing [3], recent advancements in machine learning have triggered active exploration of data-driven approaches to parameterization [4, 5]. This study aims to develop a novel vertical mixing parameterization method using deep learning. High-resolution simulation results (O(103) m) are used as training data for a neural network to estimate vertical diffusion and viscosity. These estimates are then used to parameterize fine-scale dynamics in a low-resolution simulation (O(104) m).

The input parameters of the neural network are the state variables RL = (vL, θL, SL)T, where vL is the flow velocity field, θL is the potential temperature, and SL is the salinity. Here, the L and H subscripts will be used to indicate the low and high-resolution simulations. The output parameters are P = (κh, Ah)T, where κh and Ah are the estimated vertical diffusion and viscosities respectively. The loss function is defined as the mean squared error between the state variables of the high and low-resolution simulations RLRH. Verification experiments for the proposed parameterization method are conducted for an idealized double-gyre configuration, which models western boundary currents such as the Gulf Stream in the North Atlantic Ocean. We confirm the performance and efficiency of the proposed method compared to traditional KPP for conducting high-resolution simulations at low computational cost.

Acknowledgements
This work used computational resources of supercomputer Fugaku provided by the RIKEN Center for Computational Science through the HPCI System Research Project (Project ID: hp230382).

References
[1] D. Couespel et. al (2021), Oceanic primary production decline halved in eddy-resolving simulations of global warming, Biogeosciences, 18(14), 4321-4349.
[2] M. Solano, and Y. Fan (2022), A new K-profile parameterization for the ocean surface boundary layer under realistic forcing conditions, Ocean Modelling, 171, 101958.
[3] W. G. Large et. al (1994), Oceanic vertical mixing: A review and a model with a nonlocal boundary layer parameterization, Reviews of geophysics, 32(4), 363–403.
[4] Y. Han et. al (2020), A moist physics parameterization based on deep learning, Journal of Advances in Modeling Earth Systems, 12(9), e2020MS002076.
[5] Y. Zhu et. al (2022), Physics-informed deep-learning parameterization of ocean vertical mixing improves climate simulations, National Science Review, 9(8), nwac044. 

How to cite: Irie, R., Stewart, H., Kura, T., Hisada, M., and Yaguchi, T.: Parameterizing ocean vertical mixing using deep learning trained from high-resolution simulations, EGU General Assembly 2024, Vienna, Austria, 14–19 Apr 2024, EGU24-2297, https://doi.org/10.5194/egusphere-egu24-2297, 2024.

EGU24-2934 | Posters on site | ITS1.2/OS4.10

Accelerating Marine UAV Drone Image Analysis with Sliced Detection and Clustering (MBARI SDCAT) 

Duane R. Edgington, Danelle E. Cline, Thomas O'Reilly, Steven H.D. Haddock, John Phillip Ryan, Bryan Touryan-Schaefer, William J. Kirkwood, Paul R. McGill, and Rob S. McEwen

Uncrewed Aerial Vehicles (UAVs) can be a cost-effective solution for capturing a comprehensive view of surface ocean phenomena to study marine population dynamics and ecology. UAVs have several advantages, such as quick deployment from shore, low operational costs, and the ability to be equipped with various sensors, including visual imaging systems and thermal imaging sensors. However, analyzing high-resolution images captured from UAVs can be challenging and time-consuming, especially when identifying small objects or anomalies. Therefore, we developed a method to quickly identify a diverse range of targets in UAV images.

We will discuss our workflow for accelerating the analysis of high-resolution visual images captured from a Trinity F90+ Vertical Take-Off and Landing (VTOL) drone in near-shore habitats around the Monterey Bay region in California at approximately 60 meters altitude. Our approach uses a state-of-the-art self-distillation with knowledge (DINO) transformer foundation model and multi-scale, sliced object detection (SAHI) methods to locate a wide range of objects, from small to large, such as schools or individual jellyfish, flocks of birds, kelp forests or kelp fragments, small debris, occasional cetaceans, and pinnipeds. To make the data analysis more efficient, we create clusters of similar objects based on visual similarity, which can be quickly examined through a web-based interface. This approach eliminates the need for previously labeled objects to train a model, optimizing limited human resources. Our work demonstrates the useful application of state-of-the-art techniques to assist in the rapid analysis of images and how this can be used to develop a recognition system based upon machine-learning for the rapid detection and classification of UAV images. All of our work is freely available as open-source code.

How to cite: Edgington, D. R., Cline, D. E., O'Reilly, T., Haddock, S. H. D., Ryan, J. P., Touryan-Schaefer, B., Kirkwood, W. J., McGill, P. R., and McEwen, R. S.: Accelerating Marine UAV Drone Image Analysis with Sliced Detection and Clustering (MBARI SDCAT), EGU General Assembly 2024, Vienna, Austria, 14–19 Apr 2024, EGU24-2934, https://doi.org/10.5194/egusphere-egu24-2934, 2024.

El Niño-Southern Oscillation (ENSO) events have significant impacts on global climate change, and the research on their accurate forecasting and dynamic predictability holds remarkable scientific and engineering values. Recent years, we have constructed two ENSO deep learning forecasting models, ENSO-ASC and ENSO-GTC, which are both incorporated with prior ENSO dynamic mechanisms. Specifically, the former possesses the multivariate air-sea coupler (ASC), which can simulate the occurrence and decay of ENSO events, accompanied by concurrent energy interactions among multiple physical variables in the Pacific Ocean. The latter possesses the global teleconnection coupler (GTC), which can modulate the significant teleconnections of global ocean basins rather than the isolated interactions in the Pacific Ocean. From the perspective of forecasting skill, the Niño 3.4 index correlation skills of these two models can reach 0.78/0.65/0.50 (0.79/0.66/0.51) in 6/12/18 lead-month prediction, which means they exhibit an effective forecasting lead month of more than 18, outperforming the Ham et al.'s Nature-published ENSO forecasting model. The test of the past year's (2022) forecast results shows that the average forecast error of these two models is 0.156, which is less than 10% of the actual ENSO amplitudes. It is worth noting that these two models also encounter the spring presistence barrier (SPB), but indicates a profound improvement compared to the numerical models. From the perspective of ENSO predictability, zonal and meridional winds are two sensitive predictors for ENSO forecasting besides sea surface temperature (SST), which greatly contribute to the Bjerknes positive feedback mechanism and WES mechanism. Walker circulation, acting as the "atmpsphric bridge", induces the teleconnections of the three oceans, which can derive the easterly wind anomalies in the equatorial western Pacific from the Indian Ocean and North Pacific meridional mode in the northeastern Pacific from the Atlantic Ocean, promoting ENSO event development and decay.

How to cite: Qin, B.: Two Physics-informed Enso Deep Learning Forecasting Models: ENSO-ASC and ENSO-GTC, EGU General Assembly 2024, Vienna, Austria, 14–19 Apr 2024, EGU24-3372, https://doi.org/10.5194/egusphere-egu24-3372, 2024.

The assessment and monitoring of microbial plankton biodiversity are essential to obtain a robust evaluation of the health status of marine environments. The PETRI-MED project addresses this imperative by developing novel strategies to monitor the microbial plankton community composition and function, based on satellite observations. PETRI-MED will focus on the Mediterranean Sea as a global biodiversity hotspot with profound ecological and cultural importance. The primary objectives of PETRI-MED project encompass (i) the development of innovative satellite-based indicators to determine the biodiversity status and trends of microbial plankton community, (ii) the identification of spatio-temporal patterns in microbial plankton distribution and diversity, and (iii) the elucidation of key controls of biodiversity patterns, including ecological connectivity, natural and human-related forcings, by focusing on key indicators of ocean’s health and/or biogeochemical state. To do so, PETRI-MED will largely rely on satellite optical radiometric measurements (i.e, Ocean Colour, OC), exploiting the combined temporal and spatial characteristics of latest OC European datasets (i.e., Copernicus Sentinel-3 and European Space Agency OC-CCI) with state-of-the-art remote sensing observations and biogeochemical models (as provided by Copernicus Marine), marine currents modelling, and genomic techniques. To achieve the ambitious goal of merging remote sensing, biogeochemical/physical modelling, and in situ omics measurements, PETRI-MED will rely on Artificial Intelligence (AI). The overarching goal of PETRI-MED is to empower policymakers and stakeholders with the necessary knowledge to adopt prioritization approaches for ecosystem management based on quantitative, real-time metrics. This includes the design and implementation of protection strategies and policies to safeguard biodiversity, quantifying the impact of implemented actions at various levels, and enabling systematic, fact-supported management of Marine Protected Areas (MPAs), Key Biodiversity Areas, and Ecologically or Biologically Significant Marine Areas. Furthermore, PETRI-MED seeks to evaluate the viability of MPA management in response to climate change, ensuring adaptive strategies for the conservation of marine ecosystems in the face of environmental challenges. In summary, PETRI-MED represents a comprehensive and innovative approach to advancing our understanding of microbial plankton biodiversity in the Mediterranean Sea. Through the integration of satellite technology, omics techniques and AI, the project contributes valuable insights and tools for effective marine ecosystem management and conservation strategies.

How to cite: Tinta, T. and the PETRI-MED: PETRI-MED: Advancing Satellite-Based Monitoring for Microbial Plankton Biodiversity in the Mediterranean Sea, EGU General Assembly 2024, Vienna, Austria, 14–19 Apr 2024, EGU24-3523, https://doi.org/10.5194/egusphere-egu24-3523, 2024.

The development of the world economy in recent years has been accompanied by a significant increase in maritime traffic. Accordingly, numerous ship collision incidents, especially in dense maritime traffic zones, have been reported with damage, including oil spills, transportation interruption, etc. To improve maritime surveillance and minimize incidents over the seas, satellite imagery provided by synthetic aperture radar (SAR) and optical sensors has become one of the most effective and economical solutions in recent years. Indeed, both SAR and optical images can be used to detect vessels of different sizes and categories, thanks to their high spatial resolutions and wide swath.

To process a mass of satellite data, Deep Learning (DL) has become an indispensable solution to detect ships with a high accuracy rate. However, the DL models require time and effort for implementation, especially for training, validating, and testing with big datasets. This issue is more significant if we use different satellite imagery datasets for ship detection because data preparation tasks will be multiplied. Therefore, this paper aims to investigate various approaches for applying the DL models trained and tested on different datasets with various spatial resolution and radiometric features. Concretely, we focus on two aspects of ship detection from multi-source satellite imagery that have not been attentively discussed in the literature. First, we compare the performance of DL models trained on one HR or MR dataset and those trained on the combined HR and MR datasets. Second, we compare the performance of DL models trained on an optical or SAR dataset and tested on another. Likewise, we evaluate the performance of DL models trained on the combined SAR and optical dataset. The objective of this work is to answer a practical question of ship detection in maritime surveillance, especially for emergency cases if we can directly apply the DL models trained on one dataset to others having differences in spatial resolution and radiometric features without the supplementary steps such as data preparation and DL models retraining.

When dealing with a limited number of training images, the performance of DL models via the approaches proposed in this study was satisfactory. They could improve 5–20% of average precision, depending on the optical images tested. Likewise, DL models trained on the combined optical and radar dataset could be applied to both optical and radar images. Our experiments showed that the models trained on an optical dataset could be used for radar images, while those trained on a radar dataset offered very poor scores when applied to optical images.

How to cite: La, T.-V., Pham, M.-T., and Chini, M.: Collocation of multi-source satellite imagery for ship detection based on Deep Learning models, EGU General Assembly 2024, Vienna, Austria, 14–19 Apr 2024, EGU24-3954, https://doi.org/10.5194/egusphere-egu24-3954, 2024.

EGU24-4126 | ECS | Posters on site | ITS1.2/OS4.10

Revealing Machine Learning's potential for morphotectonic analysis of marine faults: Application to the North-South faults in the Alboran Sea (Westernmost Mediterranean) 

Ariadna Canari, Léa Pousse-Beltran, Sophie Giffard-Roisin, Hector Perea, and Sara Martínez – Loriente

Seismic hazard assessment requires a detailed understanding of the evolution of fault systems, rupture processes, and linkage between segments. Identifying and characterizing Quaternary surface faulting features, such as fault scarps, provide valuable morphotectonic data on cumulative displacement over time, especially in regions with moderate to low seismic activity. Although fault cumulative vertical surface offsets have been traditionally measured using topographic profiles, these profiles are unevenly spread along the faults and may not reflect all the morphological changes along them. To address this situation, expanding the analysis to encompass a larger number of profiles is a viable option; nevertheless, manually executing this task would prove significantly time-consuming. Machine Learning (ML) has shown unprecedented capacities to evaluate large datasets in reduced time and provide a wealth valuable information with their related uncertainties. With this in mind, we propose a ML algorithm called ScarpLearn based on Convolutional Neural Networks (CNN) to compute the vertical cumulative displacement and its uncertainty for normal fault scarps. Despite ScarpLearn being initially developed to characterize simple scarps in onshore areas, we have enhanced its capabilities so that it can also be used in offshore areas subject to oceanic processes. This includes, among others, more intense diffusion, or the presence of seabed features such as pockmarks. Additionally, we have improved the code's versatility by providing a method modification that allows it to better characterization of scarps in more complex areas where multiple faults offset the seafloor. To this, we have trained the algorithm using a large database of realistic synthetic bathymetric profiles, including different parameters such as fault dip, slip velocity, scarp spread, scarp diffusion coefficient, and variable resolutions to ensure adaptability to all datasets. These modifications have resulted in the improvement of the ScarpLearn algorithm’s adaptability, elevating its accuracy and reliability in capturing the complexity of marine fault systems, but also applicable to terrestrial systems. We have applied the new ScarpLearn version to the North-South faults of the northern Alboran Sea, contributing to the accurate analysis of this Plio-Quaternary transtensional system and its complex geological structures. This innovative approach has allowed us to refine the morphotectonic analysis of the area and to understand better the geodynamics of the North-South faults system. In this research, we have explored the advances of the CNN method achieved in oceanic environments, considering intensive data compilation, computational time, accuracy, uncertainties, and current limitations. Our advances demonstrate the ScarpLearn ML potential, specifically tailored to analyze marine environments and multiple fault segments both onshore and offshore. Our research results contribute to the progress of marine geosciences by improving morphotectonic analysis using ML algorithms.


Keywords: Convolutional Neural Networks (CNN), Oceanic processes, Normal faults, Multiple scarps.


How to cite: Canari, A., Pousse-Beltran, L., Giffard-Roisin, S., Perea, H., and Martínez – Loriente, S.: Revealing Machine Learning's potential for morphotectonic analysis of marine faults: Application to the North-South faults in the Alboran Sea (Westernmost Mediterranean), EGU General Assembly 2024, Vienna, Austria, 14–19 Apr 2024, EGU24-4126, https://doi.org/10.5194/egusphere-egu24-4126, 2024.

Prediction of sea surface current is essential for various marine activities, such as tourist industry, commercial transportation, fishing industries, search and rescue operations, and so on. Numerical forecast models make it possible to predict a realistic ocean with the help of data-assimilation and fine spatial resolution. Nevertheless, complicated numerical prediction model requires heavy power and time for computation, which initiated development of novel approaches with efficient computational costs. In that sense, artificial neural networks could be one of the solutions because they need low computational power for prediction thanks to pre-trained networks. Here, we present a prediction framework applicable to the surface current prediction in the seas around the Korean peninsula using three-dimensional (3-D) convolutional neural networks. The network is based on the 3-D U-net structure and modified to predict sea surface currents using oceanic and atmospheric variables. In the forecast procedure, it is optimized to minimize the error of the next day’s sea surface current field and its recursively predicting structure allows more days to be predicted. The network’s performance is evaluated by changing input days and variables to find the optimal surface-current-prediction artificial neural network model, which demonstrates its strong potential for practical uses near future.

How to cite: Park, J.-H., Chae, J.-Y., and Kim, Y. T.: Surface current prediction in the seas around the Korean peninsula using a CNN-based deep-learning model , EGU General Assembly 2024, Vienna, Austria, 14–19 Apr 2024, EGU24-4488, https://doi.org/10.5194/egusphere-egu24-4488, 2024.

The Indonesian ThroughfFow (ITF) plays a vital role in the global ocean circulation and climate system. The intricate labyrinth of passages around the Indonesian Seas poses a grand challenge in monitoring and understanding the throughflow in the region. In this study, we employ the deep-learning approach to examine to what degree known sea level variations can determine main in- and outflows through the Indonesian Seas. The approach is first validated using the simulated environment from a regional circulation model. Our results show that the Recurrent Neural Network (RNN) models can well represent the temporal variations of throughflows across the Indonesian Seas. Moreover, the skills can be significantly improved if aided by time series of transport from a small number of passages. We also apply the trained model to the satellite derived sea surface height in design of more effective allocations of observation assets.

How to cite: Xue, H., Wang, Z., and Wang, Y.: Applying Deep-learning Models in Observation Simulation Experiments of Throughflows Across the Indonesian Seas, EGU General Assembly 2024, Vienna, Austria, 14–19 Apr 2024, EGU24-4587, https://doi.org/10.5194/egusphere-egu24-4587, 2024.

EGU24-5552 | ECS | Posters on site | ITS1.2/OS4.10

Scalable 3D Semantic Mapping of Coral Reefs with Deep Learning 

Jonathan Sauder, Guilhem Banc-Prandi, Gabriela Perna, Anders Meibom, and Devis Tuia

Coral reefs, which host more than a third of the ocean’s biodiversity on less than 0.1% of its surface, are existentially threatened by climate change and other human activities. This necessitates methods for evaluating the state of coral reefs that are efficient, scalable, and low-cost. Current digital reef monitoring tools typically rely on conventional Structure-from-Motion photogrammetry, which can limit the scalability, and current datasets for training semantic segmentation systems are either sparsely labeled, domain-specific, or very small. We describe the first deep-learning-based 3D semantic mapping approach, which enables rapid mapping of coral reef transects by leveraging the synergy between self-supervised deep learning SLAM systems and neural network-based semantic segmentation, even when using low-cost underwater cameras. The 3D mapping component learns to tackle the challenging lighting effects of underwater environments from a large dataset of reef videos. The transnational data-collection initiative was carried out in Djibouti, Sudan, Jordan, and Israel, with over 150 hours of collected video footage for training the neural network for 3D reconstruction. The semantic segmentation component is a neural network trained on a dataset of video frames with over 80’000 annotated polygons from 36 benthic classes, down to the resolution of prominent visually identifiable genera found in the shallow reefs of the Red Sea. This research paves the way for affordable and widespread deployment of the method in analysis of video transects in conservation and ecology, highlighting a promising intersection with machine learning for tangible impact in understanding these oceanic ecosystems. 

How to cite: Sauder, J., Banc-Prandi, G., Perna, G., Meibom, A., and Tuia, D.: Scalable 3D Semantic Mapping of Coral Reefs with Deep Learning, EGU General Assembly 2024, Vienna, Austria, 14–19 Apr 2024, EGU24-5552, https://doi.org/10.5194/egusphere-egu24-5552, 2024.

EGU24-5926 | ECS | Posters on site | ITS1.2/OS4.10

Reconstructing Global Ocean Deoxygenation Over a Century with Deep Learning 

Bin Lu, Ze Zhao, Luyu Han, Xiaoying Gan, Yuntao Zhou, Lei Zhou, Luoyi Fu, Xinbing Wang, Jing Zhang, and Chenghu Zhou

Oxygen is fundamentally essential for all life. Unfortunately, recent research has shown that global ocean deoxygenation has significantly increased over the past 50 years, and the stock of dissolved oxygen (DO) in the ocean has been continuously decreasing. Breathless ocean has led to large-scale death of fish, seriously affecting the marine ecosystem. Moreover, global warming and human activities have further intensified the expansion of dead zones (low-oxygen area) in the ocean.

Hence, it is of vital importance to quantitatively understand and predict the trend of global ocean deoxygenation. However, despite of the accumulation of in-situ DO observation in recent years, global and long-term observation data is still severely sparse, leading to a critical challenge in reconstructing global ocean deoxygenation over a century. Existing works can be categorized into two ways: (1) Physics-informed numerical models. These methods simulate the DO concentration based on climate models without utilizing in-situ observations, e.g., Coupled Model Intercomparison Project Phase 6 (CMIP6). However, these models fail to adjust biased simulation results based on temporal DO observations and cause error propagation. (2) Spatial interpolation methods. These methods reconstruct the global deoxygenation through available observations by geostatistical regression, Kriging, etc. But these ways are unable to capture the complex spatiotemporal heterogeneity and physical-biogeochemical properties, showing inconsistent performance in different areas.

To this end, we propose a knowledge-infused deep graph learning method called 4D Spatio-Temporal Graph HyperNetwork (4D-STGHN) to reconstruct four-dimensional (including time, latitude, longitude, and depth) global ocean deoxygenation from 1920 till now. To capture the spatio-temporal heterogeneity in different regions, 4D-STGHN utilize hypernetwork to generate non-shared parameters by fusing 4D geographic information and observations. Moreover, we design a chemistry-informed gradient norm mechanism as the loss function by integrating the observation of nitrate and phosphate, hereby further improving the performance of DO reconstruction. 4D-STGHN shows promising reconstruction with mean absolute percentage error (MAPE) of only 5.39%, largely outperforming three CMIP6 experiments (CESM2-omip1, CESM2-omip2 and GFDL-ESM4-historical) on dissolved oxygen and other machine learning methods. Further analysis on the global oxygen minimum zones, as well as regional analysis are conducted to evaluate the effectiveness of our proposed methods.

How to cite: Lu, B., Zhao, Z., Han, L., Gan, X., Zhou, Y., Zhou, L., Fu, L., Wang, X., Zhang, J., and Zhou, C.: Reconstructing Global Ocean Deoxygenation Over a Century with Deep Learning, EGU General Assembly 2024, Vienna, Austria, 14–19 Apr 2024, EGU24-5926, https://doi.org/10.5194/egusphere-egu24-5926, 2024.

EGU24-6735 | Orals | ITS1.2/OS4.10

Analyzing Zooplankton grazing spatial variability in the Southern Ocean using deep learning 

Gian Giacomo Navarra, Aakash Sane, and Curtis Deutsch

To elucidate the complex dynamics of zooplankton grazing and its impact on the organic carbon pump, we leveraged machine learning algorithms to analyze extensive datasets encompassing zooplankton behavior, environmental variables, and carbon flux measurements. Specifically, we employed regression models to establish predictive relationships between zooplankton grazing rates and key environmental factors, such as Potential Temperature, Sea Ice extension and iron availability.

The results demonstrate the potential of machine learning in discerning patterns and nonlinear relationships within the data, offering insights into the factors influencing zooplankton grazing dynamics. Additionally, the models provide a predictive framework to estimate the contribution of zooplankton to the organic carbon pump under varying environmental conditions. We have further analyzed the results by using two explainable AI methods, the Layer Wise Relevance Propagation and Integrated Gradients that informs which physical variables contribute to the prediction.

This research contributes to our understanding of the intricate processes governing carbon sequestration in the ocean, with implications for climate change mitigation and marine ecosystem management. Machine learning techniques assists to unravel the complexities of zooplankton-mediated carbon flux, to unravel the complexities of zooplankton-mediated carbon flux, paving the way for more accurate predictions and proactive conservation strategies in the face of global environmental changes.

How to cite: Navarra, G. G., Sane, A., and Deutsch, C.: Analyzing Zooplankton grazing spatial variability in the Southern Ocean using deep learning, EGU General Assembly 2024, Vienna, Austria, 14–19 Apr 2024, EGU24-6735, https://doi.org/10.5194/egusphere-egu24-6735, 2024.

EGU24-6927 | ECS | Posters on site | ITS1.2/OS4.10 | Highlight

A Deep Learning Model for Tropical Cyclone Center Localization Based on SAR Imagery 

Shanshan Mu, Haoyu Wang, and Xiaofeng Li

Tropical cyclones (TCs) are natural disasters originating over tropical or subtropical oceans. Their landfall is generally accompanied by extensive high winds and persistent precipitation, causing severe economic losses and human casualties yearly. Consequently, conducting effective TC landfall intensity forecasts for disaster risk reduction is imperative. The calm center of a TC, known as the TC eye, serves as a vital indicator of its intensity. Hence, precisely locating TC centers is crucial for determining TC intensity. In this study, a deep-learning model was developed to extract TC centers from satellite remote-sensing images automatically.
Space-borne synthetic aperture radar (SAR) imagery plays a critical role in monitoring natural hazards owing to its high spatial resolution, wide coverage, and day-night imaging capabilities. A total of 110 Sentinel SAR images spanning from 2016 to 2019 were used for TC center localization in this paper. They were acquired in interferometric-wide (IW) mode with a pixel size of 10 m and extra-wide (EW) mode with a pixel size of 40 m. They were resampled by spatial averaging to maintain the same pixel size of 80 m. Additionally, we manually annotated the central area of tropical cyclone images as ground truth data.
For the dataset, we initially divided 110 SAR images and the corresponding truth data into training, validation, and testing sets in an 8:1:1 ratio. Subsequently, we partitioned the SAR images into 256 × 256 pixel-sized slices as the model inputs. 32151/4611/3900 samples were extracted as the training/validation/testing dataset. Considering the target samples containing the center position are far less than compared background samples in TCs, we retained all center-containing samples and randomly selected 1.2 times the number of background samples for each image. Consequently, we obtained a final dataset of 2388/257/245 samples for training, validation, and testing.
As is known, deep learning technology excels in learning non-linear relationships and is good at automatically extracting intricate patterns from SAR imagery. The Res-UNet, a U-Net-like model with the weighted attention mechanism and the skip connection scheme that has been proven effective in solving the problem of contrast reduction caused by signal interference, was ultimately determined as the deep learning model for the automatic positioning of tropical cyclone centers in our study.
We calculated the centroid of the central region and compared the model results with ground truth. Our model outputs agreed well with the visually located TC center with a mean intersection over union (IOU) and a mean TC center location error of 0.71/0.70/0.67 and 3.59/2.24/2.20 km for the training/validation/testing dataset. Moreover, our model greatly simplifies the complexity of traditional methods such as using spiral rainbands and background wind fields for center positioning. At the same time, our method can not only obtain the position of the TC center but also extract the central area, thereby obtaining the morphological characteristics of TCs, which is conducive to better monitoring and intensity determination of TC.

How to cite: Mu, S., Wang, H., and Li, X.: A Deep Learning Model for Tropical Cyclone Center Localization Based on SAR Imagery, EGU General Assembly 2024, Vienna, Austria, 14–19 Apr 2024, EGU24-6927, https://doi.org/10.5194/egusphere-egu24-6927, 2024.

EGU24-8207 | ECS | Posters on site | ITS1.2/OS4.10

Unveiling the Ocean’s Rhythms: Blending Deep Learning and Spectral Analysis Together to Gain Insights into Sunda Shelf Surface Currents using AIS Data 

Jun Yu Puah, Ivan D. Haigh, David Lallemant, Ronan Fablet, Kyle Morgan, and Adam D. Switzer

Surface currents influence ship navigation, coastal heat transfer and sediment transport, and thus necessitate robust models that can reliably predict surface current behaviour. However, our ability to make predictions over long time scales are commonly hampered by a lack of long observational datasets. Remote sensing technologies, which include satellite altimetry and high-frequency radar, are often used to measure global surface currents. However, their ability to reveal insights on ocean dynamics at a regional scale remain limited by restrictions related to space-time sampling. Here, we explore the use of AIS data as a means to derive surface currents in the Sunda Shelf Region in equatorial southeast Asia. Firstly, we apply nearest-neighbour interpolation to map relevant AIS information, that includes the ship’s speed over ground, course over ground and heading, onto a grid with a spatial resolution of 100m and an hourly temporal resolution. Next, we applied a gradient descent approach to derive surface currents at the positions of the ships. We then implement a generative model on PyTorch to reconstruct surface currents in the region. The model performance is evaluated by comparing to observational data from drifters and drifting buoys. Lastly, we employed wavelet analysis, a type of nonstationary spectral analysis, to examine the dominant frequencies or periods where surface currents are strong. Our pilot study highlights the potential of AIS data as a credible alternative to traditional methods of measuring surface currents in data scarce areas.

How to cite: Puah, J. Y., Haigh, I. D., Lallemant, D., Fablet, R., Morgan, K., and Switzer, A. D.: Unveiling the Ocean’s Rhythms: Blending Deep Learning and Spectral Analysis Together to Gain Insights into Sunda Shelf Surface Currents using AIS Data, EGU General Assembly 2024, Vienna, Austria, 14–19 Apr 2024, EGU24-8207, https://doi.org/10.5194/egusphere-egu24-8207, 2024.

EGU24-8942 | ECS | Orals | ITS1.2/OS4.10

Chlorophyll-a satellite climate time series: How machine learning can help distinguish between bias and consistency 

Etienne Pauthenet, Elodie Martinez, Thomas Gorgues, Joana Roussillon, Lucas Drumetz, Ronan Fablet, and Maïlys Roux

Phytoplankton sustains marine ecosystems and influences global carbon dioxide levels through photosynthesis. To grow, phytoplankton rely on nutrient availability in the upper sunlit layer, closely related to ocean dynamics and specifically ocean stratification. Human-caused climate change is responsible, among others, for an increase in global temperature and regional modifications of winds, thus affecting the stratification of the ocean's surface. Consequently, phytoplankton biomass is expected to be impacted by these environmental changes. While most existing studies focus on one or two satellite products to investigate phytoplankton trends in the global ocean, in this study, we analyze surface chlorophyll-a concentration (chl-a), a proxy for phytoplankton biomass, using six merged satellite products from January 1998 to December 2020. Significant regional discrepancies are observed among the different products, displaying opposing trends. To distinguish trends arising from changes in the physical ocean from those potentially resulting from sensor biases, a convolutional neural network is employed to examine the relationship between chl-a and physical ocean variables (sea surface temperature, sea surface height, sea surface currents, wind, and solar radiation). The training is conducted over 2002-2009 when the number of merged sensors is constant, and chl-a is reconstructed over 2010-2020. Our results suggest that the merging algorithm of the Globcolour Garver, Siegel, Maritorena (GSM) bio-optical model is not reliable for trend detection. Specifically, changes in chl-a after 2016 are not supported by changes in the physical ocean but rather by the introduction of the VIIRS sensor. These results emphasize the need for a careful interpretation of chl-a trends and highlight the potential of machine learning to study the evolution of marine ecosystems.

How to cite: Pauthenet, E., Martinez, E., Gorgues, T., Roussillon, J., Drumetz, L., Fablet, R., and Roux, M.: Chlorophyll-a satellite climate time series: How machine learning can help distinguish between bias and consistency, EGU General Assembly 2024, Vienna, Austria, 14–19 Apr 2024, EGU24-8942, https://doi.org/10.5194/egusphere-egu24-8942, 2024.

EGU24-11061 | Posters on site | ITS1.2/OS4.10

Machine-learning-based analysis and reconstruction of high-resolution sea-surface temperatures for the North Sea and Baltic Sea 

Tim Kruschke, Christopher Kadow, Johannes Meuer, and Claudia Hinrichs

The Federal Maritime and Hydrographic Agency of Germany performs weekly analyses of sea surface temperatures (SST) for the North Sea and Baltic Sea on an operational basis. The analysis is based on in-situ observations and satellite retrievals. Existing procedures require manual quality control and subjective decisions on plausibility of measurements combined with simple interpolation techniques. This study presents ongoing work to develop new procedures based on a machine learning approach, designed to fill in gaps in observational data fields. The employed inpainting technique makes use of a convolutional neural network (CNN) that is trained with complete SST-fields from high-resolution (~3 km) ocean model simulations and masks derived from satellite retrievals to ignore regions covered by clouds on respective days.

First validation efforts for the North Sea based on reconstructing modelled fields that were excluded from training data indicate very promising results, that is an RMSE of ~ 0.5 K or less for most regions of the North Sea. However, areas with high variance such as waters very close to the coast and the Norwegian Channel exhibit larger errors up to 1 K. Additionally, we can show that errors tend to be larger when less observational data are available, e.g. on days with lots of clouds.

It will be tested if optional features of the algorithm may help to improve results in these cases. Especially the possibility to use “memory” of preceding days – potentially featuring less clouds – seems promising in this respect. Furthermore, it will be elaborated if the option of overwriting existing observational data with values better fitting the patterns learned by the CNN is suitable to improve the overall results and hence may be an alternative to external (manual) quality control and plausibility checking.

The final aim of this study is to establish an approach suitable for the operational analysis of daily SSTs with a horizontal resolution of approx. 5 km and the production of an SST reanalysis of North Sea and Baltic Sea SSTs starting in 1990.

How to cite: Kruschke, T., Kadow, C., Meuer, J., and Hinrichs, C.: Machine-learning-based analysis and reconstruction of high-resolution sea-surface temperatures for the North Sea and Baltic Sea, EGU General Assembly 2024, Vienna, Austria, 14–19 Apr 2024, EGU24-11061, https://doi.org/10.5194/egusphere-egu24-11061, 2024.

EGU24-12271 | Posters on site | ITS1.2/OS4.10

Harnessing Machine Learning and Principal Components Techniques for Atmospheric and Glint Correction to Retrieve Ocean Color from Geostationary Satellites 

Zachary Fasnacht, Joanna Joiner, Matthew Bandel, David Haffner, Alexander Vassilkov, Patricia Castellanos, and Nickolay Krotkov

Retrievals of ocean color (OC) properties from space are important for better understanding the ocean ecosystem and carbon cycle. The launch of atmospheric hyperspectral instruments such as the geostationary Tropospheric Emissions: Monitoring of Pollution (TEMPO) and GEMS, provide a unique opportunity to examine the diurnal variability in ocean ecology across various waters in North America and prepare for the future suite of hyperspectral OC sensors. While TEMPO does not have as high spatial resolution or full spectral coverage as planned coastal ocean sensors such as the Geosynchronous Littoral Imaging and Monitoring Radiometer (GLIMR) or GeoXO OC instrument (OCX), it provides hourly coverage of US coastal regions and great lakes, such as Lake Erie and the Gulf of Mexico at spatial scales of approximately 5 km. We will apply our newly developed machine learning (ML) based atmospheric correction approach for OC retrievals to TEMPO data. Our approach begins by decomposing measured hyperspectral radiances into spectral features that explain the variability in atmospheric scattering and absorption as well as the underlying surface reflectance. The coefficients of the principal components are then used to train a neural network to predict OC properties such as chlorophyll concentration derived from collocated MODIS/VIIRS physically-based retrievals. This ML approach compliments the standard radiative transfer-based OC retrievals by providing gap-filling over cloudy regions where the standard algorithms are limited. Previously, we applied our approach using blue and UV wavelengths with the Ozone Monitoring Instrument (OMI) and TROPOspheric Monitoring Instrument (TROPOMI) to show that it can estimate OC properties in less-than-ideal conditions such as lightly to moderately cloudy conditions as well as sun glint and thus improve the spatial coverage of ocean color measurements. TEMPO provides an opportunity to improve on this approach since it provides extended spectral measurements at green and red wavelengths which are important particularly for coastal waters. Additionally, our ML technique can be applied to provisional data early in the mission and has potential to demonstrate the value of near real time OC products that are important for monitoring of harmful algae blooms and transient oceanic phenomena.   


How to cite: Fasnacht, Z., Joiner, J., Bandel, M., Haffner, D., Vassilkov, A., Castellanos, P., and Krotkov, N.: Harnessing Machine Learning and Principal Components Techniques for Atmospheric and Glint Correction to Retrieve Ocean Color from Geostationary Satellites, EGU General Assembly 2024, Vienna, Austria, 14–19 Apr 2024, EGU24-12271, https://doi.org/10.5194/egusphere-egu24-12271, 2024.

EGU24-13571 | ECS | Orals | ITS1.2/OS4.10

Application of a Neural Network Algorithm to Estimate the Nutrients Concentration in the Peruvian Upwelling System 

Cristhian Asto, Anthony Bosse, Alice Pietri, François Colas, Raphaëlle Sauzède, and Dimitri Gutiérrez

The Peruvian coastal upwelling system (PCUS) is one of the most productive in the world ocean. The Peruvian Marine Research Institute (IMARPE) has been monitoring the PCUS  since the 1960’s with an increase in the frequency and spatial distribution of measurements since the early 2000’s focusing on temperature, salinity and oxygen. In recent years, autonomous gliders have started to be routinely deployed by IMARPE, collecting a large amount of profiles. However, there is still a gap for the high-resolution  sampling of biogeochemical parameters such as nutrients (nitrate, phosphate and silicate).

New  methods using machine learning to reconstruct missing data have been developed recently with promising results (Sauzède et al, 2017; Bittig et al., 2018; Fourrier et al., 2020). In particular, a recent global approach using neural networks (NN) named CANYON-B (CArbonate system and Nutrientes concentration from hYdrological properties and Oxygen using a Neural network) was developed in order to fill those gaps and infer nutrients’ concentrations from the more sampled variables of temperature, salinity and oxygen (Bittig et al., 2018).

In this work we show the application of this global CANYON-B algorithm to the PCUS using all the historical IMARPE’s CTD casts. Moreover, we trained a new NN and compared its outputs with the ones from CANYON-B, demonstrating the benefits of training the NN with the extensive regional data set collected by IMARPE.

How to cite: Asto, C., Bosse, A., Pietri, A., Colas, F., Sauzède, R., and Gutiérrez, D.: Application of a Neural Network Algorithm to Estimate the Nutrients Concentration in the Peruvian Upwelling System, EGU General Assembly 2024, Vienna, Austria, 14–19 Apr 2024, EGU24-13571, https://doi.org/10.5194/egusphere-egu24-13571, 2024.

EGU24-14839 | ECS | Orals | ITS1.2/OS4.10

Near-real-time monitoring of global ocean carbon sink based on CNN 

Piyu Ke, Xiaofan Gui, Wei Cao, Dezhi Wang, Ce Hou, Lixing Wang, Xuanren Song, Yun Li, Biqing Zhu, Jiang Bian, Stephen Sitch, Philippe Ciais, Pierre Friedlingstein, and Zhu Liu

The ocean plays a critical role in modulating climate change by absorbing atmospheric CO2. Timely and geographically detailed estimates of the global ocean-atmosphere CO2 flux provide an important constraint on the global carbon budget, offering insights into temporal changes and regional variations in the global carbon cycle. However, previous estimates of this flux have a 1 year delay and cannot monitor the very recent changes in the global ocean carbon sink. Here we present a near-real-time, monthly grid-based dataset of global surface ocean fugacity of CO2 and ocean-atmosphere CO2 flux data from January 2022 to July 2023, which is called Carbon Monitor Ocean (CMO-NRT). The data have been derived by updating the estimates from 10 Global Ocean Biogeochemical Models and 8 data products in the Global Carbon Budget 2022 to a near-real-time framework. This is achieved by employing Convolutional Neural Networks and semi-supervised learning methods to learn the non-linear relationship between the estimates from models or products and the observed predictors. The goal of this dataset is to offer a more immediate, precise, and comprehensive understanding of the global ocean-atmosphere CO2 flux. This advancement enhances the capacity of scientists and policymakers to monitor and respond effectively to alterations in the ocean's CO2 absorption, thereby contributing significantly to climate change management.

How to cite: Ke, P., Gui, X., Cao, W., Wang, D., Hou, C., Wang, L., Song, X., Li, Y., Zhu, B., Bian, J., Sitch, S., Ciais, P., Friedlingstein, P., and Liu, Z.: Near-real-time monitoring of global ocean carbon sink based on CNN, EGU General Assembly 2024, Vienna, Austria, 14–19 Apr 2024, EGU24-14839, https://doi.org/10.5194/egusphere-egu24-14839, 2024.

EGU24-15508 | Posters on site | ITS1.2/OS4.10

Data-driven short-term forecast of suspended inorganic matter as seen by ocean colour remote sensing. 

Jean-Marie Vient, Frédéric Jourdin, Ronan Fablet, and Christophe Delacourt

Short-term forecasting (several days in advance) of underwater visibility range is needed for marine and maritime operations involving divers or optical sensors, as well as for recreational activities such as scuba diving (e.g. Chang et al 2013). Underwater visibility mainly depends on water turbidity, which is caused by small suspended particles of organic and mineral origin (Preisendorfer 1986). Modelling the fate of these particles can be complex, encouraging the development of machine learning methods based on satellite data and hydrodynamic simulations (e.g. Jourdin et al 2020). In the field of forecasting visibility, deep learning methods are emerging (Prypeshniuk 2023). Here, in continuation of Vient et al (2022) on the interpolation purpose, this work deals with forecasting subsurface mineral turbidity levels over the French continental shelf of the Bay of Biscay using the deep learning method entitled 4DVarNet (Fablet et al 2021) applied to ocean colour satellite data, with additional data such as bathymetry (ocean depths) and time series of main forcing statistical parameters like wave significant heights and tidal coefficients. Using satellite data alone, results show that 2-day forecasts are accurate enough. When adding bathymetry and forcing parameters in the process, forecasts can go up to 6 days in advance.

References

Chang, G., Jones, C., and Twardowski, M. (2013), Prediction of optical variability in dynamic nearshore environments, Methods in Oceanography, 7, 63-78, https://doi.org/10.1016/j.mio.2013.12.002

Fablet, R., Chapron, B., Drumetz, L., Mémin, E., Pannekoucke, O., and Rousseau, F. (2021), Learning variational data assimilation models and solvers, Journal of Advances in Modeling Earth Systems, 13, e2021MS002572, https://doi.org/10.1029/2021MS002572

Jourdin, F., Renosh, P.R., Charantonis, A.A., Guillou, N., Thiria, S., Badran, F. and Garlan, T. (2021), An Observing System Simulation Experiment (OSSE) in Deriving Suspended Sediment Concentrations in the Ocean From MTG/FCI Satellite Sensor, IEEE Transactions on Geoscience and Remote Sensing, 59(7), 5423-5433, https://doi.org/10.1109/TGRS.2020.3011742

Preisendorfer, R. W. (1986), Secchi disk science: Visual optics of natural waters, Limnology and Oceanography, 31(5), 909-926, https://doi.org/10.4319/lo.1986.31.5.0909

Prypeshniuk, V. (2023), Ocean surface visibility prediction, Master thesis, Ukrainian Catholic University, Faculty of Applied Sciences, Department of Computer Sciences, Lviv, Ukraine, 39 pp, https://er.ucu.edu.ua/handle/1/3948?locale-attribute=en

Vient, J.-M., Fablet, R.;, Jourdin, F. and Delacourt, C. (2022), End-to-End Neural Interpolation of Satellite-Derived Sea Surface Suspended Sediment Concentrations, Remote Sens., 14(16), 4024, https://doi.org/10.3390/rs14164024

How to cite: Vient, J.-M., Jourdin, F., Fablet, R., and Delacourt, C.: Data-driven short-term forecast of suspended inorganic matter as seen by ocean colour remote sensing., EGU General Assembly 2024, Vienna, Austria, 14–19 Apr 2024, EGU24-15508, https://doi.org/10.5194/egusphere-egu24-15508, 2024.

EGU24-15594 | Posters on site | ITS1.2/OS4.10 | Highlight

Conditional Generative Models for OceanBench Sea Surface Height Interpolation 

Nils Lehmann, Jonathan Bamber, and Xiaoxiang Zhu

Rising sea levels are one of many consequences of anthropogenic climate
change. Over the past few decades, several global observational records have
become available that give a more detailed picture of the increasing
impacts. Nevertheless, there continue to be data challenges, such as
sparsity or signal to noise ratio, that need to be dealt with. Machine Learning (ML)
and specifically, Deep Learning (DL) approaches have presented themselves as valuable
tools for such large-scale and complex data sources. To this end, the OceanBench
Benchmark suite was recently developed to provide a
standardized pre-processing and evaluation framework for Sea Surface Height
(SSH) interpolation tasks involving nadir and Surface Water and Ocean Topography
(SWAT) Altimetry Tracks. From the methodological perspective, a reoccurring
issue is the lack of uncertainty quantification for DL applications in Earth
Observation. Therefore, we extend the suite of metrics provided by OceanBench
to probabilistic evaluation metrics and test state-of-the-art uncertainty
quantification models from the DL community. Specifically, we focus on
Conditional Convolutional Neural Processes (ConvCNP) and
Inpainting Diffusion models as methodologies to quantify
uncertainty for the interpolation task and demonstrate their viability and
advantages over other ML methods for both accuracy and probabilistic metrics.

How to cite: Lehmann, N., Bamber, J., and Zhu, X.: Conditional Generative Models for OceanBench Sea Surface Height Interpolation, EGU General Assembly 2024, Vienna, Austria, 14–19 Apr 2024, EGU24-15594, https://doi.org/10.5194/egusphere-egu24-15594, 2024.

EGU24-16166 | ECS | Orals | ITS1.2/OS4.10

A global daily gap-filled chlorophyll-a dataset in open oceans during 2001–2021 from multisource information using convolutional neural networks 

Zhongkun Hong, Di Long, Xingdong Li, Yiming Wang, Jianmin Zhang, Mohamed Hamouda, and Mohamed Mohamed

Ocean color data are essential for developing our understanding of biological and ecological phenomena and processes and also of important sources of input for physical and biogeochemical ocean models. Chlorophyll-a (Chl-a) is a critical variable of ocean color in the marine environment. Quantitative retrieval from satellite remote sensing is a main way to obtain large-scale oceanic Chl-a. However, missing data are a major limitation in satellite remote-sensing-based Chl-a products due mostly to the influence of cloud, sun glint contamination, and high satellite viewing angles. The common methods to reconstruct (gap fill) missing data often consider spatiotemporal information of initial images alone, such as Data Interpolating Empirical Orthogonal Functions, optimal interpolation, Kriging interpolation, and the extended Kalman filter. However, these methods do not perform well in the presence of large-scale missing values in the image and overlook the valuable information available from other datasets for data reconstruction. Here, we developed a convolutional neural network (CNN) named Ocean Chlorophyll-a concentration reconstruction by convolutional neural NETwork (OCNET) for Chl-a concentration data reconstruction in open-ocean areas, considering environmental variables that are associated with ocean phytoplankton growth and distribution. Sea surface temperature (SST), salinity (SAL), photosynthetically active radiation (PAR), and sea surface pressure (SSP) from reanalysis data and satellite observations were selected as the input of OCNET to correlate with the environment and phytoplankton biomass. The developed OCNET model achieves good performance in the reconstruction of global open ocean Chl-a concentration data and captures spatiotemporal variations of these features. The reconstructed Chl-a data are available online at https://doi.org/10.5281/zenodo.10011908. This study also shows the potential of machine learning in large-scale ocean color data reconstruction and offers the possibility of predicting Chl-a concentration trends in a changing environment.

How to cite: Hong, Z., Long, D., Li, X., Wang, Y., Zhang, J., Hamouda, M., and Mohamed, M.: A global daily gap-filled chlorophyll-a dataset in open oceans during 2001–2021 from multisource information using convolutional neural networks, EGU General Assembly 2024, Vienna, Austria, 14–19 Apr 2024, EGU24-16166, https://doi.org/10.5194/egusphere-egu24-16166, 2024.

EGU24-17159 | Posters on site | ITS1.2/OS4.10 | Highlight

Exploring Pretrained Transformers for Ocean State Forecasting 

Clemens Cremer, Henrik Anderson, and Jesper Mariegaard

Traditional physics-based numerical models have served and are serving as reliable tools to gain insights into spatiotemporal behavior of ocean states such as water levels and currents. However, they have significant computational demand that often translates to slower forecasting capabilities. Additionally, these models can encounter difficulties in capturing certain physical processes and struggle to effectively bridge various spatial and temporal scales.

Considering these challenges, machine learning-based surrogate models emerge as a promising alternative. Physical surrogate models that learn multiple physics (on different spatial and temporal scales) from large datasets during extensive pretraining (Multiple physics pretraining, MPP) can enable later applications to poorly observed data domains which are common in ocean sciences. Hence, transfer learning capabilities can help improve the oceanographic forecasting, especially in data-limited regimes.

In this work, we explore the capabilities of pretrained transformer models for prediction on a test case for the North Sea. The results from two-dimensional simulations are used for training and fine-tuning. We utilize 2D datasets from publicly available PDEBench together with domain-specific datasets from DHI’s historical records of simulated 2D metocean data. We forecast water levels and currents with pretrained models and evaluate MPP forecast results against in-situ point observations and numerical model results.

Initial findings suggest that pretraining poses potential for generalizing and transferring knowledge to novel regions and relevance in practical application. A challenge is posed by model interpretability, highlighting an area for further development.

How to cite: Cremer, C., Anderson, H., and Mariegaard, J.: Exploring Pretrained Transformers for Ocean State Forecasting, EGU General Assembly 2024, Vienna, Austria, 14–19 Apr 2024, EGU24-17159, https://doi.org/10.5194/egusphere-egu24-17159, 2024.

EGU24-17199 | ECS | Orals | ITS1.2/OS4.10 | Highlight

A Multi-Fidelity Ensemble Kalman Filter with a machine learned surrogate model 

Jeffrey van der Voort, Martin Verlaan, and Hanne Kekkonen

One of the disadvantages of oceanographic models is that they can be very computationally expensive. When combined with data assimilation, dynamical approaches such as the EnKF become expensive as they need a large number of ensemble members and thus model runs. In this work we investigate the use of a Multi-Fidelity Ensemble Kalman Filter (MF-EnKF), where the lower fidelity model is a machine learned surrogate model and the high fidelity model is the original full model. The idea behind this is to use an ensemble of a few but expensive full model runs, combined with an ensemble of many cheap but less accurate surrogate model runs. In this way we can reach similar or increased accuracy with less full model runs and thus less computational time. We investigate the performance by testing the approach on a simple atmospheric model, namely the Lorenz-96 model, and an oceanographic model, namely the Quasi-Geostrophic model. Results show that the MF-EnKF outperforms the EnKF for the same number of full model runs and that the MF-EnKF can reach similar or improved accuracy with less full model runs.

How to cite: van der Voort, J., Verlaan, M., and Kekkonen, H.: A Multi-Fidelity Ensemble Kalman Filter with a machine learned surrogate model, EGU General Assembly 2024, Vienna, Austria, 14–19 Apr 2024, EGU24-17199, https://doi.org/10.5194/egusphere-egu24-17199, 2024.

EGU24-17320 | ECS | Posters on site | ITS1.2/OS4.10

Assessing data assimilation techniques with deep learning-based eddy detection 

Issam El Kadiri, Simon Van Gennip, Marie Drevillon, Anass El Aouni, Daria Botvinko, and Ronan Fablet

Mesoscale eddies significantly influence ocean circulation, nutrient distribution, and climate patterns globally.  A thorough reconstruction of the eddy field is therefore important, yet classical eddy detection algorithms based on sea level anomaly (SLA) suffer from the low coverage of the current altimetry network.

In this work, we evaluate the efficacy of deep learning techniques in enhancing the oceanic eddy field reconstruction of an operational ocean forecasting system. We use two ocean models from an Observing System Simulation Experiments (OSSE): a free-run high-resolution ocean circulation model representing the ‘truth’ and a second one constrained by synthetic observations mimicking the altimetry network through assimilation techniques to approximate the state of the ’truth’ model. 

We train a neural network model that takes sea surface temperature, sea surface height, and ocean surface currents inputs from the data-assimilation model to recover eddies identified in the ‘truth’ model, which are generated with py-eddy-tracker, a sea surface height-based eddy detection algorithm.

Our investigation centers on a semantic segmentation problem using the U- Net architecture to classify pixels for a given map into non-eddy, cyclonic eddy, and anticyclonic eddy. Our study focuses on the Gulf Stream region, an area renowned for its dynamic oceanic conditions. We find a higher detection rate of eddies and reduced inter-class misclassification when compared to eddy fields reconstructed from the data-assimilated model using the traditional SLA-based algorithm. 

Our data-driven method improves the detection of ‘true’ eddies from degraded data in an OSSE framework, and shows potential for application in operational analysis and forecasting systems.

How to cite: El Kadiri, I., Van Gennip, S., Drevillon, M., El Aouni, A., Botvinko, D., and Fablet, R.: Assessing data assimilation techniques with deep learning-based eddy detection, EGU General Assembly 2024, Vienna, Austria, 14–19 Apr 2024, EGU24-17320, https://doi.org/10.5194/egusphere-egu24-17320, 2024.

EGU24-17465 | Orals | ITS1.2/OS4.10

Deep Sea Surface Height Multivariate Interpolation 

Théo Archambault, Pierre Garcia, Anastase Alexandre Charantonis, and Dominique Béréziat

The Sea Surface Height (SSH) is an important variable of the ocean state. It is currently estimated by satellites measuring the return time of a radar pulse. Due to this remote sensing technology, nadir-pointing altimeters take measures vertically, only along their ground tracks. Recovering fully gridded SSH fields involves a challenging spatiotemporal interpolation. The most widely used operational product, the Data Unification and Altimeter Combination System (DUACS), combines data from several satellites through linear optimal interpolation to estimate the SSH field. However several studies demonstrate that DUACS does not resolve mesoscale structures, motivating our interest in improving interpolation methods. Recently, Deep Learning has emerged as one of the leading methods to solve ill-posed inverse imaging problems. Deep Neural Networks can use multi-variate information to constrain the interpolation. Among them, Sea Surface Temperature (SST) data is based on a different remote-sensing technology, which leads to higher data coverage and resolution. Deep Learning methods have been proposed to interpolate SSH from track measurements, efficiently using SST contextual information. However, training neural networks usually requires either a realistic simulation of the problem on which we have access to SSH ground truth or a loss function that does not require it. Both solutions present limitations: the first is likely to suffer from domain gap issues once applied to real-world data, and training on observations only leads to lower performance than supervision on complete fields. We propose a hybrid method: a supervised pretraining on a realistic simulation, and an unsupervised fine-tuning on real-world observations. This approach was performed using a deep Attention-based Encoder-Decoder architecture. We compare the performances of the same neural network architecture trained in the three described settings: simulation-based training, observation-based training, and our hybrid approach. Preliminary results show an improvement of approximately 25% over DUACS in the interpolation task on the Ocean Data Challenge 2021 dataset. We further explore the ability of the architecture proposed to produce near real-time forecasts of SSH.

How to cite: Archambault, T., Garcia, P., Charantonis, A. A., and Béréziat, D.: Deep Sea Surface Height Multivariate Interpolation, EGU General Assembly 2024, Vienna, Austria, 14–19 Apr 2024, EGU24-17465, https://doi.org/10.5194/egusphere-egu24-17465, 2024.

Global ocean numerical models typically have their first vertical level about 0.5m below the sea surface. However, a key physical quantity like the sea surface temperature (SST) can be retrieved from satellites at a reference depth of a few microns or millimeters below the sea surface. Assimilating such temperatures can lead to bias in the ocean models and it is thus necessary to project the satellite retrievals to the first model level to safely use them in the assimilation process. This projection is non-trivial, since it depends on several factors (e.g., daily cycle, winds, latitude) and it is usually performed either with computationally expensive numerical models or with too simple statistical methods.  

In this work we present an attempt to construct the projection operator with machine learning techniques. We consider three different networks: a convolutional neural network architecture called U-Net, which was first introduced in the field of computer vision and image segmentation, and it is thus optimal to process satellite retrievals; a pix2pix network, which is a U-Net trained in an adversarial way against a patch-classifier discriminator; a random forest model, which is a more traditional machine learning technique. We train the networks with L3 global subskin SST from AVHRR’s infrared channels on MetOp satellites produced by OSISAF and wind speed analysis at 10m by ECMWF to reproduce the ESA SST CCI and C3S global SST reprocessed product by CMEMS, that we take as ground truth during training and validation. The pix2pix network is the most effective in the projection and we thus choose it to shape an observation operator for the CMCC’s OceanVar assimilation system.

Finally, we compare several one-year-long reanalysis-like experiments, based on the CMCC reanalysis system, that assimilate the SST in different ways, e.g. nudging, unbiased approach, as observation operator. We discuss the potential impact of such new scheme in providing the best surface ocean state estimate.

How to cite: Broccoli, M., Cipollone, A., and Masina, S.: Towards an Observation Operator for Satellite Retrievals of Sea Surface Temperature with Convolutional Neural Network, EGU General Assembly 2024, Vienna, Austria, 14–19 Apr 2024, EGU24-17731, https://doi.org/10.5194/egusphere-egu24-17731, 2024.

EGU24-18493 | ECS | Posters on site | ITS1.2/OS4.10 | Highlight

Leveraging recent advances in Large Language Models for the ocean science community 

Redouane Lguensat

Large Language Models (LLMs) have made significant strides in language understanding, including natural language processing, summarization, and translation, and they have the potential to be applied to a range of climate-related challenges. For instance, LLMs can be leveraged for data cleaning and transformation, and also assisting scientists/engineers in their daily work tasks.

For the machine learning community, the year 2023 was arguably the year of breakthroughts in LLM use in production. I present in this work the exciting potential for recent advances in LLMs to revolutionize how the ocean science community can interact with computer code, information gathering, dataset finding, etc. Specifically, I will present simple applications of how these advancements in Natural Language Processing (NLP) can assist the NEMO ocean model community. Examples range from using question answering systems for browsing efficiently NEMO documentation to creating conversational agents or chatbots that can assist not only new members wanting to learn about the NEMO model but also confirmed users. 

An important aspect of this work is relying only on open source LLMs, evaluating the performances of several models and discussing the ethical implications of these tools. I also discuss the question of whether using these LLMs blindly without domain knowledge is a good idea, as an important chunk of this work can arguably be easily done by anyone with good computer science skills thanks to the democratization of data science tools and learning materials.


How to cite: Lguensat, R.: Leveraging recent advances in Large Language Models for the ocean science community, EGU General Assembly 2024, Vienna, Austria, 14–19 Apr 2024, EGU24-18493, https://doi.org/10.5194/egusphere-egu24-18493, 2024.

EGU24-18627 | Posters on site | ITS1.2/OS4.10

Prediction of sill fjord basin water renewals and oxygen levels 

João Bettencourt

The water in the basin of sill fjords is renewed occasionally. In some fjords, this renewal occurs irregularly while in others it has a more regular character. Independently of the renewal period, the renewal mechanism is thought to be common to all sill fjords: subsurface water outside of the fjord mouth lifted above the sill depth will trigger a renewal, provided that the lifted water mass is denser than the water in the basin. In Western Norway, the northerly, upwelling favorable winds that occur during Spring/Summer, provide a forcing for the uplifting of the isopycnals and bring dense, subsurface water to the upper water column, thereby creating the conditions for renewals to occur. The renewal of sill fjord basins is an important aspect of the fjord ecological condition because it supplies oxygen rich water to the fjord basin, whose oxygen is consumed by the degradation of organic matter during the stagnant periods. Byfjorden is the urban fjord in Bergen, Norway. It is heavily urbanized and has been consistently showing lower oxygen levels in its basin, which has ecological implications.

Byfjorden’s basin water is regularly renewed between the months of March and August and a strong link to coastal and atmospheric variability is well known, which makes it an attractive choice for the application of Deep Learning to predict basin water renewal in sill fjords, in the context of the atmospheric and hydrographic setting of the Norwegian coast.

In this work, the prediction of deep water renewal in Byfjorden and the basin’s oxygen levels is investigated with deep learning techniques. After a statistical study of oxygen variability correlation with wind forcing along the Norwegian coast, we develop and test a model to predict renewals and fill gaps in Byfjorden’s oxygenatio record.

How to cite: Bettencourt, J.: Prediction of sill fjord basin water renewals and oxygen levels, EGU General Assembly 2024, Vienna, Austria, 14–19 Apr 2024, EGU24-18627, https://doi.org/10.5194/egusphere-egu24-18627, 2024.

EGU24-18663 | ECS | Orals | ITS1.2/OS4.10

Linking Satellite and physics-informed Data with Phytoplankton communities Using Deep Learning 

Luther Ollier, Roy El Hourany, and Marina Levy

Understanding Phytoplankton community dynamics in response to environmental shifts is crucial for assessing the impact of climate change on marine biology. To this end, satellite observations offer a dataset spanning two decades, capturing diverse sea surface parameters, including temperature, ocean color, and surface height. Notably, ocean color data is processed to derive sea surface chlorophyll-a concentration, widely acknowledged as a reliable proxy for phytoplankton biomass. 

Lately, advances in ocean color observation allow us to describe the phytoplankton community structure in terms of groups (broad functional or taxonomic groups) or size classes. Although these advances provide more detailed information on phytoplankton diversity and structure, these datasets suffer from spatial and temporal coverage limitations due to strict quality control in the presence of atmospheric aerosols, clouds, sea ice, etc... As a result, studies examining phytoplankton trends over the past two decades and future projections rely on incomplete chlorophyll-a and ocean color data. Therefore this compromises the identification of consistent trends within phytoplankton datasets.

In this study, we address this issue using a deep-learning approach. Our method constructs an attention network that learns from the available satellite dataset of Chla and phytoplankton size classes images (weekly and one-degree-degraded spatial resolution) while assimilating information from gap-free sea surface physics data originating from satellite observations and assimilated numerical models). The primary objective is to estimate the phytoplankton dataset based on the knowledge of physical factors, while filling the gaps within this dataset

The trained deep-learning model allows us to discern patterns and correlations between chlorophyll concentration and the phytoplankton size classes on one hand, and the physics-based data on the other hand. From a phytoplankton weekly database spanning from 1997 to 2020, with 50% missing pixels, our approach demonstrates promising results in replicating chlorophyll concentration and accurately inferring phytoplankton size classes.

The methodology shows the potential of deep-learning for robust ecological applications but mainly lays the groundwork for future trend studies on phytoplankton communities.

How to cite: Ollier, L., El Hourany, R., and Levy, M.: Linking Satellite and physics-informed Data with Phytoplankton communities Using Deep Learning, EGU General Assembly 2024, Vienna, Austria, 14–19 Apr 2024, EGU24-18663, https://doi.org/10.5194/egusphere-egu24-18663, 2024.

EGU24-18688 | Posters on site | ITS1.2/OS4.10

Spatial Generalization of 4DVarNet in ocean colour Remote Sensing 

Clément Dorffer, Thi Thuy Nga Nguyen, Fréderic Jourdin, and Ronan Fablet

4DVarNet algorithm is an AI based variational approach that performs spatiotemporal time-series interpolation. It has been used with success on Ocean Color satellite images to fill in the blank of missing data due to e.g., the satellites trajectories or the clouds covering. 4DVarNet has shown impressive interpolation performances compare to other classical approaches such as DInEOF.
We propose to show that 4DVarNet is a flexible model that learns global dynamics instead of local patterns, thus enabling it to interpolate different type of data, i.e., data from different spatio-temporal domain and/or representing different variables, using the same pre-trained model.

The core of our technique involves extrapolating the learned models to other, somewhat larger geographical areas, including the entire Mediterranean and other regions like the North Sea. We achieve this by segmenting larger areas into smaller and manageable sections, and then choosing a section to train the model. Finally the trained model is applied to each segment and seamlessly integrating the prediction results. This method ensures detailed and accurate coverage over extensive areas, significantly enhancing the predictive power of our models while maintaining low computational costs.

Our results demonstrate that this approach not only outperforms traditional methods in terms of accuracy but also provides a scalable solution, adaptable to various geographical contexts. By leveraging localized training and strategic extrapolation, we offer a robust framework for ocean monitoring, paving the way for advanced satellite image applications in diverse settings.

How to cite: Dorffer, C., Nguyen, T. T. N., Jourdin, F., and Fablet, R.: Spatial Generalization of 4DVarNet in ocean colour Remote Sensing, EGU General Assembly 2024, Vienna, Austria, 14–19 Apr 2024, EGU24-18688, https://doi.org/10.5194/egusphere-egu24-18688, 2024.

EGU24-18759 | Posters on site | ITS1.2/OS4.10

Detection and identification of environmental faunal proxies in digital images and video footage from northern Norwegian fjords and coastal waters using deep learning object detection algorithms 

Steffen Aagaard Sørensen, Eirik Myrvoll-Nielsen, Iver Martinsen, Fred Godtliebsen, Stamatia Galata, Juho Junttila, and Tone Vassdal

The ICT+ project:” Transforming ocean surveying by the power of DL and statistical methods” hosted by UiT The Artic University of Norway, aims at employing machine learning techniques in improving and streamlining methods currently used in ocean surveying by private sector partners to the project, MultiConsult and Argeo. The tasks include detection and identification of µm (e.g. foraminifera, microplastics) to m (e.g. boulders, shipwrecks) sized objects and elements at and in the seabed in data that presently is processed manually by skilled workers, but ideally could be wholly or partially processed using an automated approach.

Here we present preliminary work and results related to application of the YOLO (You Only Look Once) algorithms in detection and identification of meio fauna (foraminifera) in - and macro (mollusc) fauna at the seabed. Both proxies are used in evaluation of the environmental state of the seabed. YOLO is a real-time object detection deep learning algorithm that efficiently identifies and locates objects in images or videos in a single pass through the neural network.

Presently the year on year growth or shrinkage of protected mollusc banks in northern Norwegian fjords is manually evaluated via video observation in seabed video sequences annually captured via remotely operated vehicles. The preliminary results suggest that upon moderate training the YOLO algorithm can identify presence/absence of mollusc bank formations in set video sequences, thus supporting and eventually minimizing the task of inspecting the video footage manually.      

Foraminifera are abundant marine meiofauna living in the water column or at and in the seabed. Foraminifera are utilized in research into both modern and past marine environments as they have high turnover rates and individual shells have high preservation potential. Foraminiferal shells are accumulated in the sediments and after sample processing, they subsequently can be manually detected and identified via microscope. This work is very labour-intensive and demands skilled expertise but suffers from errors by and bias of the individual expert.

Preliminary results show that a YOLO network, trained on ca 4100 individuals (20 subgroups; benthic calcareous foraminifera (n=19), Planktic foraminifera (n=1)) in 346 images have model performances of up to 0.96 mAP (mean average precision) when trained, validated and tested on the training set. These promising results will be tested on real world samples. This testing is complicated by real world samples containing many more foraminiferal species/groups that were not trained upon, overlapping or closely set specimens and presence of non-foraminiferal material (e.g. sediment grains, other meio-fauna or –flora, etc.). Thus, additional training with focus on set complicating aspects will likely be necessary and most recent result will be presented.

How to cite: Aagaard Sørensen, S., Myrvoll-Nielsen, E., Martinsen, I., Godtliebsen, F., Galata, S., Junttila, J., and Vassdal, T.: Detection and identification of environmental faunal proxies in digital images and video footage from northern Norwegian fjords and coastal waters using deep learning object detection algorithms, EGU General Assembly 2024, Vienna, Austria, 14–19 Apr 2024, EGU24-18759, https://doi.org/10.5194/egusphere-egu24-18759, 2024.

EGU24-18857 | ECS | Posters on site | ITS1.2/OS4.10

A two-phase Neural Model for CMIP6 bias correction 

Abhishek Pasula and Deepak Subramani

The Coupled Model Intercomparison Project, now in its sixth phase (CMIP6), is a global effort to project future climate scenarios on following certain shared socioeconomic pathways (SSP). For the period 1950-2014, CMIP6 provides a historical model output. From 2015 future projections with four different SSP scenarios, viz. SSP126, 245, 370 and 585 are available. From 2015-2023, we also have reanalysis of the actual ocean and atmosphere variables in these years. From this data, it is observed that CMIP6 future projections of ocean variables have a root mean square error (RMSE) of 1.22 psu in sea surface salinity, 1.24 °C in sea surface temperature, 2.23 m/s in the zonal ocean velocity component, 1.34 m/s in the meridional ocean velocity component. Similarly, the atmospheric variables have a RMSE of 1.34 °C in temperature at 2-meter height, 2.12 m/s in the zonal, and 1.321 m/s meridional wind component. Our goal is to develop an accurate method to correct this bias and provide updated future projections for scientific analysis. To this end, we developed a two phase deep neural network model that accepts monthly fields from the CMIP6 projections (all four SSP scenarios), and outputs a bias corrected field. In the first phase, a deep neural model, which we call as Atmospheric-Ocean Network 1 (AONet1) is used to obtain bias corrected fields for each of the four SSP separately. The AONet1 is trained and validated using the historical CMIP6 data (1950-2014) as input and ORAS5 and ERA5 data as the output (the bias corrected field). In the second phase, the four bias-corrected SSP fields are fed to AONet2 and the final bias corrected single field is produced. The AONet2 is trained and validated using future projection data from 2015-2021 as input and ORAS5 and ERA5 from the same period as output. The testing of the two phase model is performed for years 2022 and 2023, before bias corrected future fields are produced. Results are compared to the statistical EDCDF method using different Image Quality Assessment metrics such as Data structural similarity index measure (DSSIM), Multi-Scale SSIM, and Visual information fidelity. On test data, the RMSE after bias reduction using the two phase AONet model is 40% lower. Image assessment metric values surpassed the EDCDF approach as well.

How to cite: Pasula, A. and Subramani, D.: A two-phase Neural Model for CMIP6 bias correction, EGU General Assembly 2024, Vienna, Austria, 14–19 Apr 2024, EGU24-18857, https://doi.org/10.5194/egusphere-egu24-18857, 2024.

EGU24-19104 | Orals | ITS1.2/OS4.10 | Highlight

Fast data-driven reduced order models for emulating physics-based flexible mesh coastal-ocean models  

Jesper Sandvig Mariegaard, Emil Siim Larsen, and Allan Peter Engsig-Karup

Physics-based coastal ocean models provide vital insights into local and regional coastal dynamics but require significant computational resources to solve numerically. In this work, we develop data-driven reduced order models (ROMs) using machine learning techniques to emulate a 2D flexible mesh hydrodynamic model of Øresund, the Straight between Denmark and Sweden, achieving orders of magnitude speedup while retaining good accuracy. This Øresund model has complex spatio-temporal dynamics driven by time-varying boundary conditions. Two different approaches to generate ROMs offline are developed and compared. Our objective is to assess the advantage of generating such models offline to enable real-time analysis in the online setting.

The first approach extracts patterns in space and time using principal component analysis and learn mappings from previous states and boundary conditions to future states using gradient boosting. The second approach employs Dynamic Mode Decomposition with control (DMDc) to account for boundary forcing. The reduced models are trained offline on a part of the available 12 months of 30-minute resolution snapshots of surface elevation, and u- and v-components of the depth-averaged currents. In both cases a very low number O(100) of latent space dimensions are necessary to get accurate results at the order of 2-4 cm RMSE compared to the full high-fidelity model.

The emulators provide state estimates online in seconds rather than hours, enabling new applications like uncertainty quantification, data assimilation and parameter optimization that require fast model evaluations. Further developments could look to condition the ROMs on a wider range of potential boundary forcings for scenario exploration. This demonstrates machine learning's potential for accelerating coastal simulations for real-time decision support and planning systems facing long-term change and uncertainty.

How to cite: Mariegaard, J. S., Larsen, E. S., and Engsig-Karup, A. P.: Fast data-driven reduced order models for emulating physics-based flexible mesh coastal-ocean models , EGU General Assembly 2024, Vienna, Austria, 14–19 Apr 2024, EGU24-19104, https://doi.org/10.5194/egusphere-egu24-19104, 2024.

EGU24-19157 | ECS | Posters on site | ITS1.2/OS4.10

Estimating global POC fluxes using ML and data fusion on heterogeneous and sparse in situ observations 

Abhiraami Navaneethanathan, Bb Cael, Chunbo Luo, Peter Challenor, Adrian Martin, and Sabina Leonelli

The ocean biological carbon pump, a significant set of processes in the global carbon cycle, drives the sinking of particulate organic carbon (POC) towards the deep ocean. Global estimates of POC fluxes and an improved understanding of how environmental factors influence organic ocean carbon transport can help quantify how much carbon is sequestered in the ocean and how this can change in different environmental conditions, in addition to improving global carbon and marine ecosystem models. POC fluxes can be derived from observations taken by a variety of in situ instruments such as sediment traps, 234-Thorium tracers and Underwater Vision Profilers. However, the manual and time-consuming nature of data collection leads to limitations of spatial data sparsity on a global scale, resulting in large estimate uncertainties in under-sampled regions.

This research takes an observation-driven approach with machine learning and statistical models trained to estimate POC fluxes on a global scale using the in situ observations and well-sampled environmental driver datasets, such as temperature and nutrient concentrations. This approach holds two main benefits: 1) the ability to fill observational gaps on both a spatial and temporal scale and 2) the opportunity to interpret the importance of each environmental factor for estimating POC fluxes, and therefore exposing their relationship to organic carbon transport processes. The models built include random forests, neural networks and Bayesian hierarchical models, where their global POC flux estimates, feature importance and model performances are studied and compared. Additionally, this research explores the use of data fusion methods to combine all three heterogeneous in situ POC flux data sources to achieve improved accuracy and better-informed inferences about organic carbon transport than what is possible using a single data source. By treating the heterogeneous data sources differently, accounting for their biases, and introducing domain knowledge into the models, our data fusion method can not only harness the information from all three data sources, but also gives insights into their key differences.

How to cite: Navaneethanathan, A., Cael, B., Luo, C., Challenor, P., Martin, A., and Leonelli, S.: Estimating global POC fluxes using ML and data fusion on heterogeneous and sparse in situ observations, EGU General Assembly 2024, Vienna, Austria, 14–19 Apr 2024, EGU24-19157, https://doi.org/10.5194/egusphere-egu24-19157, 2024.

EGU24-20454 | ECS | Posters on site | ITS1.2/OS4.10

Arctic Processes Under Ice: Structures in a Changing Climate 

Owen Allemang

The Arctic region is undergoing unprecedented transformations due to Arctic amplification, warming at twice the global average rate. This warming has led to a drastic reduction in sea ice, with predictions of ice-free Arctic summers before 2050. Such profound changes signal a shift to a new climatic regime, posing significant risks to regional communities, industries, and ecosystems.

This research addresses the urgent need to understand the evolving Arctic environment by harnessing machine learning (ML) to analyse sparse oceanic data. Utilising nearly two decades of Ice Tethered Profilers (ITP) data, complemented by ship-based (U-DASH), and ARGO profiles, this study aims to investigate the structure and dynamics of the Arctic Ocean.

We fit a Gaussian Mixture Model (GMM) to our observations, assigning each data point into a different cluster or class. Despite no spatial information being provided to the model, we find coherent classes emerge. We analyse the properties of each class, compare them with standard water masses from the literature, and look at decadal trends in properties such as oxygen saturation. This approach promises to enhance our understanding of Arctic water masses and their evolving role in a changing environment.

How to cite: Allemang, O.: Arctic Processes Under Ice: Structures in a Changing Climate, EGU General Assembly 2024, Vienna, Austria, 14–19 Apr 2024, EGU24-20454, https://doi.org/10.5194/egusphere-egu24-20454, 2024.

EGU24-20799 | ECS | Posters virtual | ITS1.2/OS4.10

Size classification of particulate organic carbon concentration and its link to the ecosystem based on Machine Learning techniques. 

Anna Denvil-Sommer, Corinne Le Quere, Rainer Kiko, Erik Buitenhuis, Marie-Fanny Racault, and Fabien Lombard

Biogeochemical ocean models are usually based on two size classes for particulate organic matter: small classes (1-100 𝜇m) and large classes (100-5000 𝜇m). Based on the measurements of particulate organic carbon (POC) concentration from UVP5 profiles and observations of environmental and ecosystem conditions we estimated an optimal number of size classes for POC that can be introduced in biogeochemical ocean models. 

We identified four size classes based on the correlation between POC concentration and environmental and ecosystem variables. It gives us information on the relationship between POC and surrounding temperature, chlorophyll-a concentration, nitrate, phosphate and oxygen levels as well as plankton functional types (PFTs). 

Further, we applied Machine Learning methods to reconstruct size classes of POC concentration and identify the most important drivers for each class. We showed that the concentration of POC smaller than 0.3 mm mostly depends on environmental characteristics while concentration of POC bigger than 0.3 mm strongly depends on PFTs.  

How to cite: Denvil-Sommer, A., Le Quere, C., Kiko, R., Buitenhuis, E., Racault, M.-F., and Lombard, F.: Size classification of particulate organic carbon concentration and its link to the ecosystem based on Machine Learning techniques., EGU General Assembly 2024, Vienna, Austria, 14–19 Apr 2024, EGU24-20799, https://doi.org/10.5194/egusphere-egu24-20799, 2024.

EGU24-21554 | ECS | Posters on site | ITS1.2/OS4.10

A deep learning pipeline for automatic microfossil analysis and classification 

Iver Martinsen, David Wade, Benjamin Ricaud, and Fred Godtliebsen

Microfossils are important in climate analysis and in exploration of subsea energy resources. The abundance and distribution of species found in sediment cores provide valuable information, but the analysis is difficult and time consuming as it is based on manual work by human experts. It is also a challenge to have enough labelled data to train a standard deep learning classifier on microfossil images. We propose an efficient pipeline for processing and grouping fossils by species from microscope slides using self-supervised learning. First we show how to efficiently extract crops from whole slide images by adapting previously trained object detection algorithms. Second, we provide a comparison of a range of contrastive self-supervised learning methods to classify and identify microfossil from very few labels. We obtain excellent results with convolutional neural networks and vision transformers fine-tuned by self-supervision.

How to cite: Martinsen, I., Wade, D., Ricaud, B., and Godtliebsen, F.: A deep learning pipeline for automatic microfossil analysis and classification, EGU General Assembly 2024, Vienna, Austria, 14–19 Apr 2024, EGU24-21554, https://doi.org/10.5194/egusphere-egu24-21554, 2024.

The Southern Ocean closes the global overturning circulation and is key to the regulation of carbon, heat, biological production, and sea level. However, the dynamics of the general circulation and its leading order controls remain poorly understood, in part because of the challenge of characterizing and tracking changes in ocean physics in complex models. This gap in understanding is especially problematic in the face of climate change. Here, we wish to understand changes in the dynamics of the Southern Ocean under climate change, specifically how bathymetric controls on the general circulation could impact the location of major currents and impact upwelling. We use a suite of CMIP models for our analysis. A physics-informed equation discovery framework guided by machine learning is used to partition and interpret dynamics is used to understand spatial structures, and a supervised learning framework that quantifies its uncertainty and provides explanations of its predictions is leveraged to track change. The method, called Tracking global Heating with Ocean Regimes (THOR). A region undergoing a profound shift is where the Antarctic Circumpolar Current intersects with bathymetry, for example, the Pacific-Antarctic Ridge. We see major changes in areas associated with upwelling between the CMIP models, suggesting the changes in wind stress allow the control bathymetry has in the historical scenario to change. For example, we find that as the Antarctic Circumpolar Current shifts north under intensifying wind stress, when meeting the Pacific-Antarctic Ridge. We note associated change in the regions where gyre circulation favors upwelling, with spatial distributions varying between models. Our efforts go towards a better understanding of what dynamics are driving changes, and could allow reduction of bias between models and decrease uncertainties in future projections.

How to cite: Sonnewald, M., Yik, W., Clare, M. C., and Lguensat, R.: Discovering Dominant Controls on Southern Ocean Dynamics Under Climate Change: New Knowledge Through Physics-Guided Machine Learning , EGU General Assembly 2024, Vienna, Austria, 14–19 Apr 2024, EGU24-21905, https://doi.org/10.5194/egusphere-egu24-21905, 2024.

EGU24-22070 | ECS | Posters on site | ITS1.2/OS4.10 | Highlight

Pushing the Limits of Subseasonal-to-Seasonal Sea Ice Forecasting with Deep Generative Modelling  

Andrew McDonald, Jonathan Smith, Peter Yatsyshin, Tom Andersson, Ellen Bowler, Louisa van Zeeland, Bryn Ubald, James Byrne, María Pérez-Ortiz, Richard E. Turner, and J. Scott Hosking

Conventional studies of subseasonal-to-seasonal sea ice variability across scales have relied upon computationally expensive physics-based models solving systems of differential equations. IceNet, a deep learning-based sea ice forecasting model under development since 2021, has proven competitive to such state-of-the-art physics-based models, capable of generating daily 25 km resolution forecasts of sea ice concentration across the Arctic and Antarctic at a fraction of the computational cost once trained. Yet, these IceNet forecasts leave room for improvement through three main weaknesses. First, the forecasts exhibit physically unrealistic spatial and temporal blurring characteristic of deep learning methods trained under mean loss objectives. Second, the use of 25 km scale OSISAF data renders local forecasts along coastal regions and in regions surrounding maritime vessels inconclusive. Third, the sole provision of sea ice concentration in forecasts leaves questions about other critical ice properties such as thickness unanswered. We present preliminary results addressing these three challenges, turning to deep generative models to capture forecast uncertainty and improve spatial sharpness; leveraging 3 and 6 km scale AMSR-2 sea ice products to improve spatial resolution; and incorporating auxiliary datasets, chiefly thickness, into the training and inference pipeline to produce multivariate forecasts of sea ice properties beyond simple sea ice concentration. We seek feedback for improvement and hope continued development of IceNet can help answer key scientific questions surrounding the state of sea ice in our changing polar climates.

How to cite: McDonald, A., Smith, J., Yatsyshin, P., Andersson, T., Bowler, E., van Zeeland, L., Ubald, B., Byrne, J., Pérez-Ortiz, M., Turner, R. E., and Hosking, J. S.: Pushing the Limits of Subseasonal-to-Seasonal Sea Ice Forecasting with Deep Generative Modelling , EGU General Assembly 2024, Vienna, Austria, 14–19 Apr 2024, EGU24-22070, https://doi.org/10.5194/egusphere-egu24-22070, 2024.

EGU24-1857 | Orals | ESSI2.9

A Replicable Multi-Cloud Automation Architecture for Earth Observation 

Armagan Karatosun, Claudio Pisa, Tolga Kaprol, Vasileios Baousis, and Mohanad Albughdadi

The EO4EU project aims at making the access and use of Earth Observation (EO) data easier for environmental, government and business forecasts and operations.

To reach this goal, the EO4EU Platform will soon be made officially available, leveraging existing EO data sources such as DestinE, GEOSS, INSPIRE, Copernicus and Galileo, and offering advanced tools and services, based also on machine learning techniques, to help users find, access and handle the data they are interested in. The EO4EU Platform relies on a combination of a multi-cloud computing infrastructure coupled with pre-exascale high-performance computing facilities to manage demanding processing workloads.

The EO4EU multi-cloud infrastructure is composed by IaaS resources hosted on the WEkEO and CINECA Ada clouds, leveraged by a set of Kubernetes clusters dedicated to different workloads (e.g. cluster management tools, observability, or specific applications such as an inference server). To automate the deployment and management of these clusters, with advantages in terms of minimisation of dedicated effort and human errors, we have devised an Infrastructure-as-Code (IaC) architecture based on the Terraform, Rancher and Ansible technologies.

We believe that the proposed IaC architecture, based on open-source components and extensively documented and tested on the field, can be successfully replicated by other EO initiatives leveraging cloud infrastructures.

How to cite: Karatosun, A., Pisa, C., Kaprol, T., Baousis, V., and Albughdadi, M.: A Replicable Multi-Cloud Automation Architecture for Earth Observation, EGU General Assembly 2024, Vienna, Austria, 14–19 Apr 2024, EGU24-1857, https://doi.org/10.5194/egusphere-egu24-1857, 2024.

EGU24-6216 | Posters on site | ESSI2.9

Pangeo environment in Galaxy Earth System supported by Fair-Ease 

Thierry Carval, Marie Jossé, and Jérôme Detoc

The Earth System is a complex and dynamic system that encompasses the interactions between the atmosphere, oceans, land, and biosphere. Understanding and analyzing data from the Earth System Model (ESM) is essential, for example to predict and mitigate the impacts of climate change.

Today, collaborative efforts among scientists across diverse fields are increasingly urgent. The FAIR-EASE project aims to build an interdomain digital architecture for integrated and collaborative use of environmental data. Galaxy is a main component of this architecture which will be used by several domains of study chose by FAIR-EASE.

Galaxy, an open-source web platform, provides users with an easy and FAIR tool to access and handle multidisciplinary environmental data. By design, Galaxy manages data analyses by sharing and publishing all involved items like inputs, results, workflows, and visualisations, ensuring reproducibility by capturing the necessary information to repeat and understand data analyses.

From this point on, a Pangeo environment is a tool more than relevant to be used alongside earth-system related data and processing tools in order to create cross domain analyses. The good news is that a Pangeo environment is accessible on Galaxy. It can be exploited as a jupyterlab and allows the user to manage their NetCDF data in a Pangeo environment with the use of notebooks. Multiple tutorials are available on the Galaxy Training Network to learn how to use Pangeo.

The Galaxy Training Network significantly contributes to enhancing the accessibility and reusability of tools and workflows. The Galaxy Training platform hosts an extensive collection of tutorials. These tutorials serve as valuable resources for individuals seeking to learn how to navigate Galaxy, employ specific functionalities like Interactive Tools or how to execute workflows for specific analyses.

In synthetisis, Pangeo in Galaxy provide Pangeo users with an up-to-date data analysis platform ensuring reproducibility and mixing trainings and tools.

On the Earth System side, a first step was the creation of a Galaxy declination for Earth System studies (earth-system.usegalaxy.eu) with dedicated data, models, processing, visualisations and tutorials. It will make Earth System modeling more accessible to researchers in different fields.

In this Galaxy subdomain we choose to have the Pangeo tools. Our hope is to be able to implement cross domain workflows including climate and earth system sciences.

During this session our aim is to present how you can use the Pangeo environment from the Galaxy Earth System.

How to cite: Carval, T., Jossé, M., and Detoc, J.: Pangeo environment in Galaxy Earth System supported by Fair-Ease, EGU General Assembly 2024, Vienna, Austria, 14–19 Apr 2024, EGU24-6216, https://doi.org/10.5194/egusphere-egu24-6216, 2024.

EGU24-7765 | Orals | ESSI2.9

Unleashing the power of Dask with a high-throughput Trust Region Reflectance solver for raster datacubes 

Bernhard Raml, Raphael Quast, Martin Schobben, Christoph Reimer, and Wolfgang Wagner

In remote sensing applications, the ability to efficiently fit models to vast amounts of observational data is vital for deriving high-quality data products, as well as accelerating research and development. Addressing this challenge, we developed a high-performance non-linear Trust Region Reflectance solver specialised for datacubes, by integrating Python's interoperability with C++ and Dask's distributed computing capabilities. Our solution achieves high throughput both locally and potentially on any Dask-compatible backend, such as EODC's Dask Gateway. The Dask framework takes care of chunking the datacube, and streaming each chunk efficiently to available workers where our specialised solver is applied. Introducing Dask for distributed computing enables our algorithm to run on different compatible backends. This approach not only broadens operational flexibility, but also allows us to focus on enhancing the algorithm's efficiency, free from concerns about concurrency. This enabled us to implement a highly efficient solver in C++, which is optimised to run on a single core, but still utilise all available resources effectively. For the heavy lifting, such as performing singular value decompositions and matrix operations we rely on Eigen, a powerful open-source C++ library specialized on linear algebra. To describe the spatial reference and other auxiliary data associated with our datacube, we employ the Xarray framework. Importantly, Xarray integrates seamlessly with Dask. Finally, to ensure robustness and extensibility of our framework, we applied state-of-the-art software engineering practices, including Continuous Integration and Test-Driven Development. In our work we demonstrate the significant performance gains achievable by effectively utilising available open-source frameworks, and adhering to best engineering practices. This is exemplified by our practical workflow demonstration to fit a soil moisture estimation model. 

How to cite: Raml, B., Quast, R., Schobben, M., Reimer, C., and Wagner, W.: Unleashing the power of Dask with a high-throughput Trust Region Reflectance solver for raster datacubes, EGU General Assembly 2024, Vienna, Austria, 14–19 Apr 2024, EGU24-7765, https://doi.org/10.5194/egusphere-egu24-7765, 2024.

The Earth System Grid Federation (ESGF) data nodes are usually the first address for accessing climate model datasets from WCRP-CMIP activities. It is currently hosting different datasets in several projects, e.g., CMIP6, CORDEX, Input4MIPs or Obs4MIPs. Datasets are usually hosted on different data nodes all over the world while data access is managed by any of the ESGF web portals through a web-based GUI or the ESGF Search RESTful API. The ESGF data nodes provide different access methods, e.g., https, OPeNDAP or Globus. 

Beyond ESGF, there has been the Pangeo / ESGF Cloud Data Working Group that coordinates efforts related to storing and cataloging CMIP data in the cloud, e.g., in the Google cloud and in the Amazon Web Services Simple Storage Service (S3) where a large part of the WCRP-CMIP6 ensemble of global climate simulations is now available in analysis-ready cloud-optimized (ARCO) zarr format. The availibility in the cloud has significantly lowered the barrier for users with limited resources and no access to an HPC environment to work with CMIP6 datasets and at the same time increases the chance for reproducibility and reusability of scientific results. 

Following the Pangeo strategy, we have adapted parts of the Pangeo Forge software stack for publishing our regional climate model datasets from the EURO-CORDEX initiative on AWS S3 cloud storage. The main tools involved are Xarray, Dask, Zarr, Intake and the ETL tools of pangeo-forge-recipes. Thanks to similar meta data conventions in comparison to the global CMIP6 datasets, the workflows require only minor adaptations. In this talk, we will show the strategy and workflow implemented and orchestrated in GitHub Actions workflows as well as a demonstration of how to access EURO-CORDEX datasets in the cloud.

How to cite: Buntemeyer, L.: Beyond ESGF – Bringing regional climate model datasets to the cloud on AWS S3 using the Pangeo Forge ETL framework, EGU General Assembly 2024, Vienna, Austria, 14–19 Apr 2024, EGU24-8058, https://doi.org/10.5194/egusphere-egu24-8058, 2024.

EGU24-8343 | ECS | Posters on site | ESSI2.9 | Highlight

Implementation of a reproducible pipeline for producing seasonal Arctic sea ice forecasts 

Vanessa Stöckl, Björn Grüning, Anne Fouilloux, Jean Iaquinta, and Alejandro Coca-Castro

This work highlights the integration of IceNet (https://doi.org/10.1038/s41467-021-25257-4), a cutting-edge sea ice forecasting system leveraging numerous Python packages from the Pangeo ecosystem, into the Galaxy platform—an open-source tool designed for FAIR (Findable, Accessible, Interoperable, and Reusable) data analysis. Aligned with the Pangeo ecosystem's broader objectives, and carried out in the frame of the EuroScienceGateway project (https://eurosciencegateway.eu), this initiative embraces a collaborative approach to tackle significant geoscience data challenges. The primary aim is to democratise access to IceNet's capabilities by converting a Jupyter Notebook, published in the Environmental Data Science book (www.edsbook.org), into Galaxy Tools and crafting a reusable workflow executable through a Graphical User Interface or standardised APIs. IceNet is meant to predict Arctic sea ice concentration up to six months in advance, and it outperforms previous systems. This integration establishes a fully reproducible workflow, enabling scientists with diverse computational expertise to automate sea ice predictions. The IceNet workflow is hosted on the European Galaxy Server (https://climate.usegalaxy.eu), along with the related tools, ensuring accessibility for a wide community of researchers. With the urgency of accurate predictions amid global warming's impact on Arctic sea ice, this work addresses challenges faced by scientists, particularly those with limited programming experience. The transparent, accessible, and reproducible pipeline for Arctic sea ice forecasting aligns with Open and Science principles. The integrated IceNet into Galaxy enhances accessibility to advanced climate science tools, allowing for automated predictions that contribute to early and precise identification of potential damages from sea ice loss. This initiative mirrors the overarching goals of the Pangeo community, advancing transparent, accessible, and reproducible research. The Galaxy-based pipeline presented serves as a testament to collaborative efforts within the Pangeo community, breaking down barriers related to computational literacy and empowering a diverse range of scientists to contribute to climate science research. The integration of IceNet into Galaxy not only provides a valuable tool for seasonal sea ice predictions but also exemplifies the potential for broad interdisciplinary collaboration within the Pangeo ecosystem.

How to cite: Stöckl, V., Grüning, B., Fouilloux, A., Iaquinta, J., and Coca-Castro, A.: Implementation of a reproducible pipeline for producing seasonal Arctic sea ice forecasts, EGU General Assembly 2024, Vienna, Austria, 14–19 Apr 2024, EGU24-8343, https://doi.org/10.5194/egusphere-egu24-8343, 2024.

EGU24-9156 | ECS | Orals | ESSI2.9

DataLabs: development of a cloud collaborative platform for open interdisciplinary geo-environmental sciences  

Michael Tso, Michael Hollaway, Faiza Samreen, Iain Walmsley, Matthew Fry, John Watkins, and Gordon Blair

In environmental science, scientists and practitioners are increasingly facing the need to create data-driven solutions to the environment's grand challenges, often needing to use data from disparate sources and advanced analytical methods, as well as drawing expertise from collaborative and cross-disciplinary teams [1]. Virtual labs allow scientists to collaboratively explore large or heterogeneous datasets, develop and share methods, and communicate their results to stakeholders and decision-makers. 

DataLabs [2] has been developed as a cloud-based collaborative platform to tackle these challenges and promote open, collaborative, interdisciplinary geo-environmental sciences. It allows users to share notebooks (e.g. JupyterLab, R Studio, and most recently VS Code), datasets and computational environments and promote transparency and end-to-end reasoning of model uncertainty. It supports FAIR access to data and digital assets by providing shared data stores and discovery functionality of datasets and assets hosted on the platform’s asset catalogue. Its tailorable design allows it to be adaptable to different challenges and applications. It is also an excellent platform for large collaborative teams to work on outputs together [3] as well as communicating results to stakeholders by allowing easy prototyping and publishing of web applications (e.g. Shiny, Panel, Voila). It is currently deployed on JASMIN [4] and is part of the UK NERC Environmental data service [5]. 

There are a growing number of use cases and requirements for DataLabs and it is going to play a central part in several planned digital research infrastructure (DRI) initiatives. Future development needs of the platform to further its vision include e.g. more intuitive onboarding experience, easier access to key datasets at source, better connectivity to other cloud platforms, and better use of workflow tools. DataLabs shares many of the features (e.g. heavy use of PANGEO core packages) and design principles of PANGEO. We would be interested in exploring commonalities and differences, sharing best practices, and growing the community of practice in this increasingly important area. 

[1]  Blair, G.S., Henrys, P., Leeson, A., Watkins, J., Eastoe, E., Jarvis, S., Young, P.J., 2019. Data Science of the Natural Environment: A Research Roadmap. Front. Environ. Sci. 7. https://doi.org/10.3389/fenvs.2019.00121  

[2] Hollaway, M.J., Dean, G., Blair, G.S., Brown, M., Henrys, P.A., Watkins, J., 2020. Tackling the Challenges of 21st-Century Open Science and Beyond: A Data Science Lab Approach. Patterns 1, 100103. https://doi.org/10.1016/j.patter.2020.100103 

[3] https://eds.ukri.org/news/impacts/datalabs-streamlines-workflow-assessing-state-nature-uk  

[4] https://jasmin.ac.uk/  

[5] https://eds.ukri.org/news/impacts/datalabs-digital-collaborative-platform-tackling-environmental-science-challenges  

How to cite: Tso, M., Hollaway, M., Samreen, F., Walmsley, I., Fry, M., Watkins, J., and Blair, G.: DataLabs: development of a cloud collaborative platform for open interdisciplinary geo-environmental sciences , EGU General Assembly 2024, Vienna, Austria, 14–19 Apr 2024, EGU24-9156, https://doi.org/10.5194/egusphere-egu24-9156, 2024.

EGU24-9781 | Posters on site | ESSI2.9

Optimizing NetCDF performance for cloud computing : exploring a new chunking strategy 

Flavien Gouillon, Cédric Pénard, Xavier Delaunay, and Florian Wery

Owing to the increasing number of satellites and advancements in sensor resolutions, the volume of scientific data is experiencing rapid growth. NetCDF (Network Common Data Form) stands as the community standard for storing such data, necessitating the development of efficient solutions for file storage and manipulation in this format.

Object storage, emerging with cloud infrastructures, offers potential solutions for data storage and parallel access challenges. However, NetCDF may not fully harness this technology without appropriate adjustments and fine-tuning. To optimize computing and storage resource utilization, evaluating NetCDF performance on cloud infrastructures is essential. Additionally, exploring how cloud-developed software solutions contribute to enhanced overall performance for scientific data is crucial.

Offering multiple file versions with data split into chunks tailored for each use case incurs significant storage costs. Thus, we investigate methods to read portions of compressed chunks, creating virtual sub-chunks that can be read independently. A novel approach involves indexing data within NetCDF chunks compressed with deflate, enabling extraction of smaller data portions without reading the entire chunk.

This feature is very valuable in use cases such as pixel drilling or extracting small amounts of data from large files with sizable chunks. It also saves reading time, particularly in scenarios of poor network connection, such as those encountered onboard research vessels.

We conduct performance assessments of various libraries in various use cases to provide recommendations for the most suitable and efficient library for reading NetCDF data in different situations.

Our tests involved accessing remote NetCDF datasets (two files from the SWOT mission) available on the network via a lighttpd server and an s3 server. Additionally, simulations of degraded Internet connections, featuring high latency, packet loss, and limited bandwidth, are also performed.

We evaluate the performance of four Python libraries (netcdf4 lib, Xarray, h5py, and our chunk indexing library) for reading dataset portions through fsspec or fs_s3. A comparison of reading performance using netCDF, zarr, and nczarr data formats is also conducted on an s3 server.

Preliminary findings indicate that the h5py library is the most efficient, while Xarray exhibits poor performance in reading NetCDF files. Furthermore, the NetCDF format demonstrates reasonably good performance on an s3 server, albeit lower than zarr or nczarr formats. However, the considerable efforts required to convert petabytes of archived NetCDF files and adapt numerous software libraries for a performance improvement within the same order of magnitude can raise questions about the practicality of such endeavors and benefits is thus extremely related to the use cases.

How to cite: Gouillon, F., Pénard, C., Delaunay, X., and Wery, F.: Optimizing NetCDF performance for cloud computing : exploring a new chunking strategy, EGU General Assembly 2024, Vienna, Austria, 14–19 Apr 2024, EGU24-9781, https://doi.org/10.5194/egusphere-egu24-9781, 2024.

EGU24-9795 | ECS | Orals | ESSI2.9

Unifying HPC and Cloud Systems; A Containerized Approach for the Integrated Forecast System (IFS) 

Cathal O'Brien, Armagan Karatosun, Adrian Hill, Paul Cresswell, Michael Sleigh, and Ioan Hadade

The IFS (Integrated Forecast System) is a global numerical weather prediction system maintained by the European Centre for Medium-Range Weather Forecasts (ECMWF). Traditionally, ECMWF’s high-performance computing facility (HPCF) is responsible for operationally supporting the IFS cycles. However, with the emergence of new cloud technologies, initiatives such as Destination Earth (DestinE), and growth of OpenIFS users within Europe and around the globe, the need to run IFS outside of ECMWF's computing facilities becomes more evident. Concerning such use cases, IFSTestsuite allows for the complete IFS system and its dependencies (e.g. ecCodes) to be built and tested outside of ECMWF's HPCF and designed to be self-contained, eliminating the need for external tools like MARS or ecCodes. Despite the need for users to perform multiple steps and the dependency of the software availability and versions on the host operating system, this indicates that there might be a potential for more generic and broader approach. 

Containerization might provide the much-needed portability and disposable environments to trigger new cycles with the desired compiler versions, or even with different compilers. In addition, pre-built container images can be executed on any platform, provided there is a compatible container runtime installed on the target system that adheres to Open Container Initiative (OCI) standards like Singularity or Docker. Another benefit of using container images is container image layers which can significantly reduce the image build time. Lastly, despite their differences, both Singularity and Docker adhere to the OCI standards, and converting one container image to another is straightforward. However, despite the clear advantages, there are several crucial design choices to keep in mind. Notably, the available hardware and software stacks varies greatly across different HPC systems. When performance is important, this heterogeneous landscape limits the portability of containers. The libraries and drivers inside the container must be specially selected with regard to the hardware and software stack of a specific host system to maximize performance on that system. If this is done correctly, the performance of containerized HPC applications can match native applications. We demonstrate this process with the use of a hybrid containerization strategy where compatible MPI stacks and drivers are built inside the containers. The binding of host libraries into containers is also used on systems where proprietary software cannot be rebuilt inside the container.  

In this study we present a containerized solution which balances portability and efficient performance, with examples of containerizing the IFS on a variety of systems including cloud systems with generic x86-64 architecture, such as European Weather Cloud (EWC) and Microsoft Azure, on EuroHPC systems such as Leonardo and LUMI and provided container image recipes for OpenIFS. 

How to cite: O'Brien, C., Karatosun, A., Hill, A., Cresswell, P., Sleigh, M., and Hadade, I.: Unifying HPC and Cloud Systems; A Containerized Approach for the Integrated Forecast System (IFS), EGU General Assembly 2024, Vienna, Austria, 14–19 Apr 2024, EGU24-9795, https://doi.org/10.5194/egusphere-egu24-9795, 2024.

EGU24-10741 | Posters on site | ESSI2.9

Harnessing the Pangeo ecosystem for delivering the cloud-based Global Fish Tracking System 

Daniel Wiesmann, Tina Odaka, Anne Fouilloux, Emmanuelle Autret, Mathieu Woillez, and Benjamin Ragan-Kelley

We present our approach of leveraging the Pangeo software stack for developing the Global Fish Tracking System (GFTS). The GFTS project tackles the challenge of accurately modelling fish movement in the ocean based on biologging data with a primary focus on Sea Bass. Modelling fish movements is essential to better understand migration strategies and site fidelity, which are critical aspects for fish stock management policy and marine life conservation efforts.

Estimating fish movements is a highly compute intensive process. It involves matching pressure and temperature data from in-situ biologging sensors with high resolution ocean temperature simulations over long time periods. The Pangeo software stack provides an ideal environment for this kind of modelling. While the primary target platform of the GFTS project is the new Destination Earth Service Platform (DESP), relying on the Pangeo ecosystem ensures that the GFTS project is a robust and portable solution that can be re-deployed on different infrastructure. 

One of the distinctive features of the GFTS project is its advanced data management approach, synergizing with the capabilities of Pangeo. Diverse datasets, including climate change adaptation digital twin data, sea temperature observations, bathymetry, and biologging in-situ data from tagged fish, are seamlessly integrated within the Pangeo environment. A dedicated software called pangeo-fish has been developed to streamline this complex modelling process. The technical framework of the GFTS project includes Pangeo core packages such as Xarray and Dask, which facilitate scalable computations.

Pangeo's added value in data management becomes apparent in its capability to optimise data access and enhance performance. The concept of "data visitation" is central to this approach. By strategically deploying Dask clusters close to the data sources, the GFTS project aims to significantly improve performance of fish track modelling when compared to traditional approaches. This optimised data access ensures that end-users can efficiently interact with large datasets, leading to more streamlined and efficient analyses.

The cloud-based delivery of the GFTS project aligns with the overarching goal of Pangeo. In addition, the GFTS includes the development of a custom interactive Decision Support Tool (DST). The DST empowers non-technical users with an intuitive interface for better understanding the results of the GFTS project, leading to more informed decision-making. The integration with Pangeo and providing intuitive access to the GFTS data is not merely a technicality; it is a commitment to FAIR (Findable, Accessible, Interoperable and Reusable), TRUST (Transparency, Responsibility, User focus, Sustainability and Technology) and open science principles. 

In short, the GFTS project, within the Pangeo ecosystem, exemplifies how advanced data management, coupled with the optimization of data access through "data visitation," can significantly enhance the performance and usability of geoscience tools. This collaborative and innovative approach not only benefits the immediate goals of the GFTS project but contributes to the evolving landscape of community-driven geoscience initiatives.

How to cite: Wiesmann, D., Odaka, T., Fouilloux, A., Autret, E., Woillez, M., and Ragan-Kelley, B.: Harnessing the Pangeo ecosystem for delivering the cloud-based Global Fish Tracking System, EGU General Assembly 2024, Vienna, Austria, 14–19 Apr 2024, EGU24-10741, https://doi.org/10.5194/egusphere-egu24-10741, 2024.

EGU24-12410 | Orals | ESSI2.9

Towards Enhancing WaaS and Data Provenance over Reana 

Iraklis Klampanos, Antonis Ganios, and Antonis Troumpoukis

Interoperability and reproducibility are critical aspects of scientific computation. The data analysis platform Reana [1], developed by CERN, enhances the interoperability and reproducibility of scientific analyses by allowing researchers to describe, execute, and share their analyses. This is achieved via the execution of standardised scientific workflows, such as CWL, within reusable containers. Moreover, it allows execution to span different types of resources, such as Cloud and HPC. 

In this session we will present ongoing work to enhance Reana’s Workflows-as-a-Service (WaaS) functionality and also support Workflow registration and discoverability. Building upon the design goals and principles of the DARE platform [2], this work aims to enhance Reana by enabling users to register and discover available workflows within the system. In addition, we will present the integration of Data Provenance based on the W3C PROV-O standard [3] allowing the tracking and recording of data lineage in a systematic and dependable way across resource types. 

In summary, key aspects of this ongoing work include:

  • Workflows-as-a-Service (WaaS): Extending Reana's service-oriented mode of operation, allowing users to register, discover, access, execute, and manage workflows by name or ID, via APIs, therefore enhancing the platform's accessibility and usability.
  • Data Provenance based on W3C PROV-O: Implementing support for recording and visualising data lineage information in compliance with the W3C PROV-O standard. This ensures transparency and traceability of data processing steps, aiding in reproducibility and understanding of scientific analyses.

This work aims to broaden Reana's functionality, aligning with best practices for reproducible and transparent scientific research. We aim to make use of the enhanced Reana-based system on the European AI-on-demand platform [4], currently under development, to address the requirements of AI innovators and researchers when studying and executing large-scale AI-infused workflows.

References: 

[1] Simko et al., (2019). Reana: A system for reusable research data analyses. EPJ Web Conf., 214:06034, https://doi.org/10.1051/epjconf/201921406034

[2] Klampanos et al., (2020). DARE Platform: a Developer-Friendly and Self-Optimising Workflows-as-a-Service Framework for e-Science on the Cloud. Journal of Open Source Software, 5(54), 2664, https://doi.org/10.21105/joss.02664

[3] PROV-O: The PROV Ontology: https://www.w3.org/TR/prov-o/ (viewed 9 Jan 2024)

[4] The European AI-on-Demand platform: https://aiod.eu (viewed 9 Jan 2024)

This work has been has received funding from the European Union’s Horizon Europe research and innovation programme under Grant Agreement No 101070000.

How to cite: Klampanos, I., Ganios, A., and Troumpoukis, A.: Towards Enhancing WaaS and Data Provenance over Reana, EGU General Assembly 2024, Vienna, Austria, 14–19 Apr 2024, EGU24-12410, https://doi.org/10.5194/egusphere-egu24-12410, 2024.

EGU24-12669 | ECS | Orals | ESSI2.9

DeployAI to Deliver Interoperability of Cloud and HPC Resources for Earth Observation in the Context of the European AI-on-Demand Platform 

Antonis Troumpoukis, Iraklis Klampanos, and Vangelis Karkaletsis

The European AI-on-Demand Platform (AIoD, http://aiod.eu) is a vital resource for leveraging and boosting the European AI research landscape towards economic growth and societal advancement across Europe. Following and emphasising European values, such as openness, transparency, and trustworthiness for developing and using AI technologies, the AIoD platform aims to become the main one-stop shop for exchanging and building AI resources and applications within the European AI innovation ecosystem, whilst also adhering to European values. The primary goal of the DIGITAL-EUROPE CSA initiative DeployAI (DIGITAL-2022-CLOUD-AI-B-03, 01/2024-12/2027) is to build, deploy, and launch a fully operational AIoD platform, promoting trustworthy, ethical, and transparent European AI solutions for the industry, with a focus on SMEs and the public sector.

Building on Open-source and trusted software, DeployAI will provide a number of technological assets such as a comprehensive and Trustworthy AI resource catalogue and marketplace offering responsible AI resources and tools, workflow composition and execution systems for prototyping and user-friendly creation of novel services, responsible foundational models and services to foster dependable innovation, etc. In addition, and building upon the results of the ICT-49 AI4Copernicus project [1], which provided a bridge between the AIoD platform and the Copernicus ecosystem and the DIAS platforms, DeployAI will integrate impactful Earth Observation AI services into the AIoD platform. These will include (but not limited to) satellite imagery preprocessing, land usage classification, crop type identification, super-resolution, and weather forecasting.

Furthermore, DeployAI will allow the rapid prototyping of AI applications and their deployment to a variety of Cloud/Edge/HPC infrastructures. The project will focus on establishing a cohesive interaction framework that integrates with European Data Spaces and Gaia-X initiatives, HPC systems with an emphasis on the EuroHPC context, and the European Open Science Cloud. Interfaces to European initiatives and industrial AI-capable cloud platforms will be further implemented to enable interoperability. This capability enables the execution of Earth Observation applications not only within the context of a DIAS/DAS but also within several other compute systems. This level of interoperability enhances the adaptability and accessibility of AI applications, fostering a collaborative environment where geoscientific workflows can be seamlessly executed across diverse computational infrastructures and made available to a wide audience of innovators.

[1] A. Troumpoukis et al., "Bridging the European Earth-Observation and AI Communities for Data-Intensive Innovation", 2023 IEEE Ninth International Conference on Big Data Computing Service and Applications (BigDataService), Athens, Greece, 2023, pp. 9-16, doi:10.1109/BigDataService58306.2023.00008.

This work has been has received funding from the European Union’s Digital Europe Programme (DIGITAL) under grant agreement No 101146490.

How to cite: Troumpoukis, A., Klampanos, I., and Karkaletsis, V.: DeployAI to Deliver Interoperability of Cloud and HPC Resources for Earth Observation in the Context of the European AI-on-Demand Platform, EGU General Assembly 2024, Vienna, Austria, 14–19 Apr 2024, EGU24-12669, https://doi.org/10.5194/egusphere-egu24-12669, 2024.

EGU24-15366 | ECS | Posters on site | ESSI2.9

Enabling seamless integration of Copernicus and in-situ data 

Iason Sotiropoulos, Athos Papanikolaou, Odysseas Sekkas, Anastasios Polydoros, Vassileios Tsetsos, Claudio Pisa, and Stamatia Rizou

BUILDSPACE aims to combine terrestrial data from buildings collected by IoT devices with aerial imaging from drones equipped with thermal cameras and location annotated data from satellite services (i.e., EGNSS and Copernicus) to deliver innovative services at building scale, enabling the generation of high fidelity multi-modal digital twins and at city scale providing decision support services for energy demand prediction, urban heat and urban flood analysis. A pivotal element and the foundational support of the BUILDSPACE ecosystem is the Core Platform and it plays a crucial role in facilitating seamless data exchange, secure and scalable data storage, and streamlined access to data from three Copernicus services, namely the Land, Atmosphere, and Climate Change.The platform's underlying technology is robust, incorporating two key components: OIDC for user authentication and group authorization over the data, and a REST API to handle various file operations. OIDC stands for OpenID Connect, a standard protocol that enables secure user authentication and allows for effective management of user groups and their access permissions. On the other hand, the platform employs a REST API for seamless handling of file-related tasks, including uploading, downloading, and sharing. This combination ensures efficient and secure data exchange within the system. Additionally, the use of an S3 compatible file system ensures secure and scalable file storage, while a separate metadata storage system enhances data organization and accessibility. Currently deployed on a Kubernetes cluster, this platform offers numerous advantages, including enhanced scalability, efficient resource management, and simplified deployment processes. The implementation of the Core Platform has led to a current focus on integrating APIs from Copernicus services into the Core Platform's API. This ongoing effort aims to enhance the platform's capabilities by seamlessly incorporating external data, enriching the overall functionality and utility of the project.

How to cite: Sotiropoulos, I., Papanikolaou, A., Sekkas, O., Polydoros, A., Tsetsos, V., Pisa, C., and Rizou, S.: Enabling seamless integration of Copernicus and in-situ data, EGU General Assembly 2024, Vienna, Austria, 14–19 Apr 2024, EGU24-15366, https://doi.org/10.5194/egusphere-egu24-15366, 2024.

EGU24-15416 | ECS | Orals | ESSI2.9

XDGGS: Xarray Extension for Discrete Global Grid Systems (DGGS) 

Alexander Kmoch, Benoît Bovy, Justus Magin, Ryan Abernathey, Peter Strobl, Alejandro Coca-Castro, Anne Fouilloux, Daniel Loos, and Tina Odaka

Traditional geospatial representations of the globe on a 2-dimensional plane often introduce distortions in area, distance, and angles. Discrete Global Grid Systems (DGGS) mitigate these distortions and introduce a hierarchical structure of global grids. Defined by ISO standards, DGGSs serve as spatial reference systems facilitating data cube construction, enabling integration and aggregation of multi-resolution data sources. Various tessellation schemes such as hexagons and triangles cater to different needs - equal area, optimal neighborhoods, congruent parent-child relationships, ease of use, or vector field representation in modeling flows.

The fusion of Discrete Global Grid Systems (DGGS) and Datacubes represents a promising synergy for integrated handling of planetary-scale data.

The recent Pangeo community initiative at the ESA BiDS'23 conference has led to significant advancements in supporting Discrete Global Grid Systems (DGGS) within the widely used Xarray package. This collaboration resulted in the development of the Xarray extension XDGGS (https://github.com/xarray-contrib/xdggs). The aim of xdggs is to provide a unified, high-level, and user-friendly API that simplifies working with various DGGS types and their respective backend libraries, seamlessly integrating with Xarray and the Pangeo scientific computing ecosystem. Executable notebooks demonstrating the use of the xdggs package are also developed to showcase its capabilities.

This development represents a significant step forward, though continuous efforts are necessary to broaden the accessibility of DGGS for scientific and operational applications, especially in handling gridded data such as global climate and ocean modeling, satellite imagery, raster data, and maps.

Keywords: Discrete Global Grid Systems, Xarray Extension, Geospatial Data Integration, Earth Observation, Data Cube, Scientific Collaboration

How to cite: Kmoch, A., Bovy, B., Magin, J., Abernathey, R., Strobl, P., Coca-Castro, A., Fouilloux, A., Loos, D., and Odaka, T.: XDGGS: Xarray Extension for Discrete Global Grid Systems (DGGS), EGU General Assembly 2024, Vienna, Austria, 14–19 Apr 2024, EGU24-15416, https://doi.org/10.5194/egusphere-egu24-15416, 2024.

EGU24-15872 | Posters on site | ESSI2.9

Deploying Pangeo on HPC: our experience with the Remote Sensing Deployment Analysis environmenT on SURF infrastructure 

Francesco Nattino, Meiert W. Grootes, Pranav Chandramouli, Ou Ku, Fakhereh Alidoost, and Yifat Dzigan

The Pangeo software stack includes powerful tools that have the potential to revolutionize the way in which research on big (geo)data is conducted. A few of the aspects that make them very attractive to researchers are the ease of use of the Jupyter web-based interface, the level of integration of the tools with the Dask distributed computing library, and the possibility to seamlessly move from local deployments to large-scale infrastructures. 

The Pangeo community and project Pythia are playing a key role in providing training resources and examples that showcase what is possible with these tools. These are essential to guide interested researchers with clear end goals but also to provide inspiration for new applications. 

However, configuring and setting up a Pangeo-like deployment is not always straightforward. Scientists whose primary focus is domain-specific often do not have the time to spend solving issues that are mostly ICT in nature. In this contribution, we share our experience in providing support to researchers in running use cases backed by deployments based on Jupyter and Dask at the SURF supercomputing center in the Netherlands, in what we call the Remote Sensing Deployment Analysis environmenT (RS-DAT) project. 

Despite the popularity of cloud-based deployments, which are justified by the enormous data availability at various public cloud providers, we discuss the role that HPC infrastructure still plays for researchers, due to the ease of access via merit-based allocation grants and the requirements of integration with pre-existing workflows. We present the solution that we have identified to seamlessly access datasets from the SURF dCache massive storage system, we stress how installation and deployment scripts can facilitate adoption and re-use, and we finally highlight how technical research-support staff such as Research Software Engineers can be key in bridging researchers and HPC centers. 

How to cite: Nattino, F., Grootes, M. W., Chandramouli, P., Ku, O., Alidoost, F., and Dzigan, Y.: Deploying Pangeo on HPC: our experience with the Remote Sensing Deployment Analysis environmenT on SURF infrastructure, EGU General Assembly 2024, Vienna, Austria, 14–19 Apr 2024, EGU24-15872, https://doi.org/10.5194/egusphere-egu24-15872, 2024.

EGU24-17111 | Posters on site | ESSI2.9

Cloudifying Earth System Model Output 

Fabian Wachsmann

We introduce eerie.cloud (eerie.cloud.dkrz.de), a data server for efficient access to prominent climate data sets stored on disk at the German Climate Computing Center (DKRZ). We show how we “cloudify” data from two projects, EERIE and ERA5, and how one can benefit from it. 

The European Eddy-rich Earth System Model (EERIE) project aims to develop state-of-the-art high-resolution Earth System Models (ESM) that are able to resolve ocean mesoscale processes. These models are then used to perform simulations over centennial scales and make their output available for the global community. At present, the total volume of the EERIE data set exceeds 0.5PB  and is rapidly growing, posing challenges for data management.
ERA5 is the fifth generation ECMWF global atmospheric reanalysis. It is widely used as forcing data for climate model simulations, for model evaluation or for the analysis of climate trends. DKRZ maintains a 1.6 PB subset of ERA5 data at its native resolution.

We use Xpublish to set up the data server. Xpublish is a python package and a plugin for Pangeo's central analysis package Xarray. Its main feature is to provide ESM output by mapping any input data to virtual zarr data sets. Users can retrieve these data sets as if they were cloud-native and cloud-optimized.

eerie.cloud features

  • Parallel access to data subsets on chunk-level
  • Interfaces to make the data more FAIR
    • User friendly content overviews with displays of xarray-like dataset representations
    • Simple browsing and loading data with an intake catalog
  • On-the-fly server-side computation 
    • Register simple xarray routines for generating customized variables
    • Compression for speeding up downloads
  • Generation of interactive geographical plots, including animations

Eerie.cloud is a solution to make EERIE data more usable by a wider community.

How to cite: Wachsmann, F.: Cloudifying Earth System Model Output, EGU General Assembly 2024, Vienna, Austria, 14–19 Apr 2024, EGU24-17111, https://doi.org/10.5194/egusphere-egu24-17111, 2024.

EGU24-17150 | ECS | Posters on site | ESSI2.9

Data access patterns of km-scale resolution models 

Janos Zimmermann, Florian Ziemen, and Tobias Kölling

Climate models produce vast amounts of output data. In the nextGEMS project, we have run the ICON model at 5 km resolution for 5 years, producing about 750 TB of output data from one simulation. To ease analysis, the data is stored at multiple temporal and spatial resolutions. The dataset is now analyzed by more than a hundred scientists on the DKRZ levante system. As disk space is limited, it is crucial to obtain information, which parts of this dataset are accessed frequently and need to be kept on disk, and which parts can be moved to the tape archive and only be fetched on request.

By storing the output as zarr files with many small files for the individual data chunks, and logging file access times, we obtained a detailed view of more than half a year of access to the nextGEMS dataset, even going to regional level for a given variable and time step. The evaluation of those access patterns offers the possibility to optimize various aspects such as caching, chunking, and archiving. Furthermore, it provides valuable information for designing future output configurations.

In this poster, we present the observed access patterns and discuss their implications for our chunking and archiving strategy. Leveraging an interactive visualization tool, we explore and compare access patterns, distinguishing frequently accessed subsets, sparsely accessed variables, and preferred resolutions. We furthermore provide information on how we analyzed the data access to enable other users to follow our approach.

How to cite: Zimmermann, J., Ziemen, F., and Kölling, T.: Data access patterns of km-scale resolution models, EGU General Assembly 2024, Vienna, Austria, 14–19 Apr 2024, EGU24-17150, https://doi.org/10.5194/egusphere-egu24-17150, 2024.

EGU24-18256 | Orals | ESSI2.9

Data access for km-scale resolution models 

Florian Ziemen, Tobias Kölling, and Lukas Kluft

With the transition to global, km-scale simulations, model outputs have grown in size, and efficient ways of accessing data have become more important than ever. This implies that the data storage has to be optimized for efficient read access to small sub-sets of the data, and multiple resolutions of the same data need to be provided for efficient analysis on coarse as well as fine-grained scales.

In this high-level overview presentation, we present an approach based on datasets. Each dataset represents a coherent subset of a model output (e.g. all model variables stored at daily resolution). Aiming for a minimum number of datasets makes us enforce consistency in the model output and thus eases analysis. Each dataset is served to the user as one zarr store, independent of the actual file layout on disks or other storage media. Multiple datasets are grouped in catalogs for findability.

By serving the data via https, we can implement a middle layer between the user and the storage systems, allowing to combine different storage backends behind a unifying frontend. At the same time, this approach allows us to largely build the system on existing technologies such as web servers and caches, and efficiently serve data to users outside the compute center where the data is stored.
The approach we present is currently under development in the BMBF project WarmWorld with contributions by the H2020 project nextGEMS, and we expect it to be useful for many other projects as well.

How to cite: Ziemen, F., Kölling, T., and Kluft, L.: Data access for km-scale resolution models, EGU General Assembly 2024, Vienna, Austria, 14–19 Apr 2024, EGU24-18256, https://doi.org/10.5194/egusphere-egu24-18256, 2024.

EGU24-18585 | ECS | Posters on site | ESSI2.9

STAC catalogs for time-varying in-situ data 

Justus Magin

The ability to search a collection of datasets is an important factor for the usefulness of the data. By organizing the metadata into catalogs, we can enable dataset discovery, look up file locations and avoid access to the data files before the actual computation. Spatio-Temporal Asset Catalogs (STAC) is a increasingly popular language-agnostic specification and vibrant ecosystem of tools for geospatial data catalogs, and is tailored for raster data like satellite imagery. It allows for a search using a variety of patterns, including the spatial and temporal extent.

In-situ data is heterogenous and would benefit from being cataloged, as well as the ecosystem of tools. However, due to the strict separation between the spatial and temporal dimensions in STAC the time-varying nature of in-situ data is not optimally captured. While for approximately stationary sensors like tide gauges, moorings, weather stations, and high-frequency radars this is not an issue (see https://doi.org/10.5194/egusphere-egu23-8096), it becomes troublesome for moving sensors, especially if the sensor moves at a high speed, covers big distances, or if the dataset contains a long time series.

To resolve this, we extend the STAC specification by replacing the geojson data with the JSON-encoded ODC moving feature standard.

How to cite: Magin, J.: STAC catalogs for time-varying in-situ data, EGU General Assembly 2024, Vienna, Austria, 14–19 Apr 2024, EGU24-18585, https://doi.org/10.5194/egusphere-egu24-18585, 2024.

EGU24-20779 | Orals | ESSI2.9

Project Pythia: Building an Inclusive Geoscience Community with Cookbooks 

John Clyne, Brian Rose, Orhan Eroglu, James Munroe, Ryan May, Drew Camron, Julia Kent, Amelia Snyder, Kevin Tyle, Maxwell Grover, and Robert Ford

Project Pythia is the educational arm of the Pangeo community, and provides a growing collection of community driven and developed training resources that help geoscientists navigate the Pangeo ecosystem, and the myriad complex technologies essential for today’s Big Data science challenges. Project Pythia began in 2020 with the support of a U.S. NSF EarthCube award. Much of the initial effort focused on Pythia Foundations: a collection of Jupyter Notebooks that covered essential topics such as Python language basics; managing projects with GitHub; authoring and using “binderized” Jupyter Notebooks; and many of Pangeo’s core packages such as Xarray, Pandas, and Matplotlib. Building upon Foundations, the Pythia community turned its attention toward creating Pythia Cookbooks: exemplar collections of recipes for transforming raw ingredients (publicly available, cloud-hosted data) into scientifically useful results. Built from Jupyter Notebooks, Cookbooks are explicitly tied to reproducible computational environments and supported by a rich infrastructure enabling collaborative authoring and automated health-checking – essential tools in the struggle against the widespread notebook obsolescence problem.


Open-access, cloud-based Cookbooks are a democratizing force for growing the capacity of current and future geoscientists to practice open science within the rapidly evolving open science ecosystem. In this talk we outline our vision of a sustainable, inclusive open geoscience community enabled by Cookbooks. With further support from the NSF, the Pythia community will accelerate the development and broad buy-in of these resources, demonstrating highly scalable versions of common analysis workflows on high-value datasets across the geosciences. Infrastructure will be deployed for performant data-proximate Cookbook authoring, testing, and use, on both commercial and public cloud platforms. Content and community will expand through annual workshops, outreach, and classroom use, with recruitment targeting under-served communities. Priorities will be guided by an independent steering board; sustainability will be achieved by nurturing a vibrant, inclusive community backed by automation that lowers barriers to participation.

How to cite: Clyne, J., Rose, B., Eroglu, O., Munroe, J., May, R., Camron, D., Kent, J., Snyder, A., Tyle, K., Grover, M., and Ford, R.: Project Pythia: Building an Inclusive Geoscience Community with Cookbooks, EGU General Assembly 2024, Vienna, Austria, 14–19 Apr 2024, EGU24-20779, https://doi.org/10.5194/egusphere-egu24-20779, 2024.

EGU24-20909 | ECS | Orals | ESSI2.9

UXarray: Extensions to Xarray to support unstructured grids 

Orhan Eroglu, Hongyu Chen, Philip Chmielowiec, John Clyne, Corrine DeCiampa, Cecile Hannay, Robert Jacob, Rajeev Jain, Richard Loft, Brian Medeiros, Lantao Sun, Paul Ullrich, and Colin Zarzycki

The arrival of kilometer-scale climate and global weather models presents substantial challenges for the analysis and visualization of the resulting data, not only because of their tremendous size but also because of the employment of unstructured grids upon which the governing equations of state are solved. Few Open Source analysis and visualization software tools exist that are capable of operating directly on unstructured grid data. Those that do exist are not comprehensive in the capabilities they offer, do not scale adequately, or both. Recognizing this gap in much-needed capability, Project Raijin - funded by an NSF EarthCube award - and the DOE SEATS project, launched a collaborative effort to develop an open source Python package called UXarray. 

UXarray extends the widely used Xarray package, providing support for operating directly (without regridding) on unstructured grid model outputs found in the Earth System Sciences, such as CAM-SE, MPAS, SCRIP, UGRID, and in the future, ICON. Much like Xarray, UXarray provides fundamental analysis and visualization operators, upon which more specialized, domain-specific capabilities can be layered. This talk will present an overview of the current capabilities of UXarray, provide a roadmap for near term future development, and will describe how the Pangeo community can contribute to this on-going effort.

How to cite: Eroglu, O., Chen, H., Chmielowiec, P., Clyne, J., DeCiampa, C., Hannay, C., Jacob, R., Jain, R., Loft, R., Medeiros, B., Sun, L., Ullrich, P., and Zarzycki, C.: UXarray: Extensions to Xarray to support unstructured grids, EGU General Assembly 2024, Vienna, Austria, 14–19 Apr 2024, EGU24-20909, https://doi.org/10.5194/egusphere-egu24-20909, 2024.

EGU24-506 | ECS | Posters on site | ESSI4.5

Remote Sensing Observations of Sulfides and Sulfates for the Geologic Mapping of the Extreme Acidic Environment of Rio Tinto, Spain 

Giacomo Panza, Alessandro Frigeri, James Skinner, Felipe Gómez, Barbara Cavalazzi, Duccio Rocchini, Francesca Altieri, and Maria Cristina De Sanctis

After its long reputation as an extremely polluted water river and anthropogenic mining waste dump, studies support Rio Tinto (southern Spain, Iberian Pyrite Belt) to be an extremely acidic environment where life relentlessly thrived long before human history. It has become clear that in this extreme environment, there are strong relationships between living and nonliving components at the microscale, resulting in the formation of micro-niche-based ecosystems. The site has therefore become a terrestrial analog of first interest for astrobiological and planetary science studies in terms of the search for life on Mars. The acidic environment is the product of the chemolithotrophic activity of microorganisms aggressively targeting sulfides (pyrite, chalcopyrite), here abundant, causing the leaching of iron and sulfur. This contributes to the formation of a variety of minerals, mainly gypsum, jarosite, goethite, and hematite, all of which have been detected on the Red Planet. 

Identifying and discretizing sulfides and iron-bearing sulfates from orbit and landed missions has been a relevant method for searching for life on Mars, notably distinguished by its iron-sulfur-rich composition. Similar mapping sulfide and sulfate distributions on easy-to-access terrestrial analog are critical to improving our ability to interpret data from other worlds and contextualize astrobiological observations.  

In this work, we present the spectroscopic analysis of remote sensing data over Rio Tinto, focusing on mapping the distribution of sulfides and sulfates as a proxy for the presence of biosignatures. We have studied multi- and hyper-spectral data from orbital and airborne spectrometers, cross-checking evidence from different datasets.   

The results of our work have been cartographically formatted and served to support the geologic mapping fieldwork campaign held at the Rio Tinto in November 2023.

How to cite: Panza, G., Frigeri, A., Skinner, J., Gómez, F., Cavalazzi, B., Rocchini, D., Altieri, F., and De Sanctis, M. C.: Remote Sensing Observations of Sulfides and Sulfates for the Geologic Mapping of the Extreme Acidic Environment of Rio Tinto, Spain, EGU General Assembly 2024, Vienna, Austria, 14–19 Apr 2024, EGU24-506, https://doi.org/10.5194/egusphere-egu24-506, 2024.

EGU24-3411 | Posters on site | ESSI4.5

The art of geological mapping in a precisely defined world: do only extreme environments pose a challenge for 2D geological mapping? 

Urszula Stępień, Katarzyna Jóźwik, Marcin Słodkowski, and Dariusz Gałązka

Geological map is mainly a result of the subjective interpretation of geological data collected as point (e.g. boreholes) and linear data (e.g. geophysical surveys), followed by their interpolation and extrapolation to areas where there is no data available. Currently, Geographic Information Systems (GIS) systems replace traditional cartographic methods that were widely used in the geosciences in the past. The unambiguous interpretation of analogue/paper geological maps is often a challenge, especially in those cases where the uncertainties and their extent were represented using artistic methods such as shading, hatching or using different symbols. 

In the past, the digitisation of geological maps involved the use of GIS software only as a graphical tool, resulting in a map developed for a paper publication. Such map was a redrawn version of a paper map, representing exactly the same vision as the author of the analogue map had. Today, GIS tools offer many spatial data processing functions that provide new information, which was not possible in case of paper maps. GIS analysis can be used to assess the quality of collected data, allowing geological data to be harmonised.
Today, to classify a digital map, geological data have to be structured at much deeper level than before The heterogeneity of geological data and the difficulty of acquiring it results in the necessity of introducing artificial boundaries on maps, especially when it comes to geological structures covered and/or deformed by overlying structures - such as the Carpathian substrate deformed and covered by the structures of the Alpine orogeny - These boundaries separate detailed structures from those that have not been identified. Some boundaries are entirely artificial and indicate the extent of possible interpretations rather than the extent of occurrence of geological structures. Similar problems arise with Quaternary substrates, which may have been subjected to strong stresses during glaciations, resulting in glaciotectonic deformations. Despite an apparently thoroughly investigated Quaternary cover, the discovery of glaciotectonic disturbances can still be a stroke of luck.

How to cite: Stępień, U., Jóźwik, K., Słodkowski, M., and Gałązka, D.: The art of geological mapping in a precisely defined world: do only extreme environments pose a challenge for 2D geological mapping?, EGU General Assembly 2024, Vienna, Austria, 14–19 Apr 2024, EGU24-3411, https://doi.org/10.5194/egusphere-egu24-3411, 2024.

EGU24-7774 | ECS | Posters on site | ESSI4.5

Reuse and recycle: how the merging of opportunistic data could be used to produce a 3D model of complex seafloor topography at the Aurora vent field - Gakkel ridge, Arctic Ocean 

Tea Isler, Tom Kwasnitschka, Christopher R. German, Michael Jakuba, and Autun Purser

The evidence of abundant hydrothermal activity at the Gakkel ridge, the slowest spreading mid-ocean ridge, led scientists to reconsider the relationship between hydrothermal cooling and the spreading rate of mid-ocean ridges. Beneath the year-round ice-cover of the Artic Ocean, images of active hydrothermal vents have now been recorded at the western-most end of this ridge, at the Aurora seamount. The presence of abundant micro-organisms living in hydrothermal vent sites in such extreme conditions has implications for the habitability of other ocean worlds and, hence, the search of life beyond Earth, given the evidence for submarine venting  that has been inferred from Enceladus’ ice-covered ocean.

A series of deployments of increasingly sophisticated deep-tow camera and ROV systems over the past decade have resulted in the collection of bathymetric, sonar and optical data sets from the Aurora site. Dives have primarily targeted the sampling of rocks and fluids, with platform cameras mainly used for navigation and identification of new vents and species. Nevertheless, the high number of still images and video footage obtained from that work can also be used for 3D reconstruction of this topographically complex environment: an approach that allows for further investigations (e.g., for habitat mapping) which would not be possible using classic ship based multibeam and backscatter technologies.

This study highlights the usefulness of opportunistic data, especially when surveying in extreme environments, where data collection requires time consuming operations, expensive devices and experienced operators. We describe the methodological steps undertaken to produce a 3D reconstruction of the recently discovered hydrothermal vents from such opportunistic data.

Additionally, the findings of this study highlight the challenges raised by the use of opportunistic data. Regardless of the powerful instrumentation currently available, careful pre-dive planning can help reduce the amount of manual labor required during post-processing steps, which is not only time-consuming but also adds uncertainty and errors to the final product.

How to cite: Isler, T., Kwasnitschka, T., German, C. R., Jakuba, M., and Purser, A.: Reuse and recycle: how the merging of opportunistic data could be used to produce a 3D model of complex seafloor topography at the Aurora vent field - Gakkel ridge, Arctic Ocean, EGU General Assembly 2024, Vienna, Austria, 14–19 Apr 2024, EGU24-7774, https://doi.org/10.5194/egusphere-egu24-7774, 2024.

EGU24-10302 | Posters on site | ESSI4.5

Gone with the currents? – Seabed erosion data of EMODnet Geology 

Susanna Kihlman, Anu Kaskela, Aarno Kotilainen, Ulla Alanen, Henry Vallius, and EMODnet Geology partners

Increasing anthropogenic pressure in marine and coastal environments emphasizes the importance of the easily accessible, reliable, and suitable data on marine environment, to support conservation, research, and sustainable marine management decisions. The EMODnet (European Marine Observation and Data network) Geology project has been aiming to address this demand by collecting and harmonizing geological data at different scales from all the European sea areas since 2009, at present with a collaboration of about 40 partners and subcontractors.


Multiscale Seabed substrate is one of the key data products of EMODnet Geology that has been collected since the beginning of the project. The seabed substrate map, harmonized from the national data by the sediment grain size, has evolved and complementary data products have been developed during the years. Sedimentation rates information has been collected since the beginning, and the seabed substrate database also includes information on the seabed surface characteristics that have significance for marine environment but cannot be defined by grain size only (e.g., seagrass meadows, glacial clay, moving sediments, ferromanganese concretion bottoms and bioclastic features). Similarly, the geographical scope has expanded currently including the Caspian Sea and Caribbean Sea.


Seabed dynamics, sediment accumulation and erosion, provide an indication of potential temporal seabed-sediment variability, and thus of uncertainty. To obtain this essential information, the latest addition in the seabed substrate data products is the seabed erosion index database, i.e. literature catalogue of erosion studies. The first version of the database was published in September 2023, including metadata information (e.g., purpose, time frame, erosion rate and data availability) about known erosional studies and different erosional areas. The index data collection will continue within the current phase of the EMODnet Geology, and it will serve as the basis for the discussion which kind of erosional data information could be the most valuable, but also as widely as possible feasible and useful. The development of usable and valuable data products requires the careful consideration and preferably collaboration with different stakeholders and end users. At best, this kind of data could be a valuable addition to understand and define marine environment in dealing with various challenges the future will hold us.


The EMODnet Geology project is funded by The European Climate, Environment, and Infrastructure Executive Agency (CINEA) through contract EASME/EMFF/2020/3.1.11 - Lot 2/SI2.853812_EMODnet – Geology.

How to cite: Kihlman, S., Kaskela, A., Kotilainen, A., Alanen, U., Vallius, H., and partners, E. G.: Gone with the currents? – Seabed erosion data of EMODnet Geology, EGU General Assembly 2024, Vienna, Austria, 14–19 Apr 2024, EGU24-10302, https://doi.org/10.5194/egusphere-egu24-10302, 2024.

EGU24-10756 | ECS | Posters on site | ESSI4.5

A Compact Gamma-Ray and Neutron Detector for Abundance Mapping on the Moon 

Anja Kohfeldt, Ramsey Al Jebali, and Luis Teodoro

Neutron detection, as well as gamma-ray spectroscopy are powerful tools for in-situ resources utilization. They allow for characterizing the abundance of hydrogen and elemental composition of the top meter of moons, airless planets, or asteroids. Compact instruments can be deployed both on orbiters and landers/rovers for either mapping larger areas or narrowing down locations with targeted materials. A more specific application is the abundance mapping of water in the lunar polar regions. To improve the Lunar Prospector resolution maps, a satellite in a low altitude orbit, below 30km, of the lunar surface is needed. This can be accomplished by a small satellite, like a CubeSat. 

We propose a hybrid gamma-ray and neutron detector based on scintillator technology for space exploration, sensitive to gamma-rays in the spectral range of 30keV to 8MeV as well as to thermal and epithermal neutrons. The detector consists of an array of CLLBC scintillators that are read out by silicon photomultipliers attached to partially space-qualified read-out electronics provided by IDEAS. In the targeted configuration, the compact instrument will have the size of tow CubeSat units (2U), where one unit is covered in Cd to allow for the distinction between epithermal and thermal neutrons.

A good understanding of the targeted radiation environment is vital for simulating and characterizing the instrument’s performance before deployment. We performed an environmental analysis for the Moon that provides the input parameters for detector response simulation in GEANT4.  With the detector response simulation, the detector design can be optimized, and characterization measurement data from the physical instrument can be verified.

In this paper, we present the mechanism behind the detection of targeted elements, such as hydrogen, KREEP, Fe, Ti and Sm, the results from the lunar radiation environment simulation and first results from the detector response simulation. A demonstrator instrument was assembled and tested in a laboratory, the first results look promising, showing that the targeted energy range for gamma-ray and neutrons can be detected. The performance of the lab demonstrator will be presented, as well.

How to cite: Kohfeldt, A., Al Jebali, R., and Teodoro, L.: A Compact Gamma-Ray and Neutron Detector for Abundance Mapping on the Moon, EGU General Assembly 2024, Vienna, Austria, 14–19 Apr 2024, EGU24-10756, https://doi.org/10.5194/egusphere-egu24-10756, 2024.

EGU24-12233 | ECS | Posters on site | ESSI4.5

Application of very high-resolution satellite imagery to identify silica-rich rock for future cosmogenic exposure dating in remote unvisited areas of Antarctica. 

Jonathan R Adams, Philippa J Mason, Stephen J Roberts, Dylan H Rood, John L Smellie, and Joanne S Johnson

Rock outcrops protruding above the ice surface in Antarctica (nunataks) can provide direct geologic evidence for past ice sheet fluctuations through the measurement of concentrations of cosmogenic nuclides that accumulate in their surfaces once the rock is exposed. Felsic lithologies, which are typically pale in colour and dominated by quartz, feldspars, and micas, are suitable for exposure age dating since quartz is the often-preferred target mineral for extraction of the rare cosmogenic isotopes which make deglacial reconstructions possible. The geology of rock outcrops in Antarctica are, however, often sparsely mapped and many exposures are challenging to access due to both their remoteness and the extreme conditions typically encountered on the continent. Satellite based spectral mapping offers an effective way to characterise the geology of large areas of exposed rock rapidly and safely in regions where it is logistically very challenging and expensive to conduct fieldwork. Remote sensing therefore offers a valuable method for preliminary characterisation of an area’s suitability for eventual targeted retrieval of cosmogenic nuclide samples.


Previous studies found that the Thermal Infra-Red (TIR) sensor onboard the Advanced Spaceborne Thermal Emission and Reflection Radiometer (ASTER) is very effective at discriminating rock types by their silica content, but spectral mapping of smaller felsic rock outcrops in Antarctica has been constrained by its low spatial resolution (90 m). Here we assess the potential of multispectral remote sensing using both ASTER and very high-resolution Worldview-3 (WV-3) imagery to distinguish felsic from mafic rock outcrops at visible-near infrared (VNIR) and shortwave infrared (SWIR) wavelengths. At Mount Murphy, a remote site in West Antarctica more than 1,600 kilometres from both the US Antarctic Program’s McMurdo Station and the British Antarctic Survey’s Rothera Research Station, we identify four dominant rock types from our spectral mapping: granites, gneisses, basalt and fragmental hydrovolcanic rocks (hyaloclastite). Image derived spectral profiles of these four rock types were used as input for spectral classification and lithological mapping of the Mount Murphy site. Supervised classification results indicate that WV-3 performs well at differentiating felsic from mafic rock types and that ASTER imagery, while coarser in resolution, can also achieve satisfactory results, and could therefore be used in concert with more targeted WV-3 image acquisitions. We also demonstrate that separation of mafic (fragmental) hydrovolcanic and basalt rock types can be achieved at VNIR-SWIR wavelengths, a result that will be useful for future spectral mapping of volcanic rocks on other planets. We used spectral mapping and supervised classification results to produce a new geologic map of Mt Murphy. Overall, our results demonstrate the potential of spectral mapping and classification using WV-3 and ASTER datasets to identify and characterise suitable sites for future cosmogenic nuclide sampling campaigns.

How to cite: Adams, J. R., Mason, P. J., Roberts, S. J., Rood, D. H., Smellie, J. L., and Johnson, J. S.: Application of very high-resolution satellite imagery to identify silica-rich rock for future cosmogenic exposure dating in remote unvisited areas of Antarctica., EGU General Assembly 2024, Vienna, Austria, 14–19 Apr 2024, EGU24-12233, https://doi.org/10.5194/egusphere-egu24-12233, 2024.

EGU24-15149 | ECS | Posters on site | ESSI4.5

Revealing the continuity of offshore faults in the Seferihisar-İzmir (Turkey) Geothermal Area by modeling with Marine Seismic and Field Geology 

Gizem Köktentürk, Günay Çifçi, Savaş Gürçay, Seda Okay Günaydın, Altuğ Hasözbek, Talip Güngör, Zülfü Demirkıran, and Melih Çobanoğlu

This study aims to evaluate the geothermal potential and geological features of the Seferihisar area in Turkey by integrating marine seismic data with terrestrial geological observations. Additionally, the research highlights the significance of marine geophysics in exploring the existing geothermal systems in Seferihisar. In this scope, high-resolution marine multichannel seismic reflection data, collected in Seferihisar Bay along the Tuzla Fault is correlated with onshore drilling data obtained from the same fault.

A 2D conceptual section and a 3D model were developed using the data from onshore geology, geochemistry, and geophysics to well better understanding of the geological structures related to the geothermal system in the study area. The results of geochemistry data in the geothermal wells indicated that the nutrition of the geothermal fluid is of both meteoric and sea water origin. The synthesis of onshore and offshore data facilitated the identification of the marine extension of the Tuzla Fault using a 3D model, emphasizing its influence on marine contributions and fluid dynamics within the geothermal system. Thus, revealing the continuity of Quaternary faults offshore and onshore will contribute to EMODnet Geology maps.

The integration of a multidisciplinary approach enhanced our understanding of geothermal wells. This advancement not only aids in identifying new potential wells but also provides deeper insights into the risks associated with geothermal energy production.

Keywords: Tuzla fault, geothermal energy, 3D modelling, onshore-offshore integration, marine seismic reflection,  EMODnet Geology maps

How to cite: Köktentürk, G., Çifçi, G., Gürçay, S., Okay Günaydın, S., Hasözbek, A., Güngör, T., Demirkıran, Z., and Çobanoğlu, M.: Revealing the continuity of offshore faults in the Seferihisar-İzmir (Turkey) Geothermal Area by modeling with Marine Seismic and Field Geology, EGU General Assembly 2024, Vienna, Austria, 14–19 Apr 2024, EGU24-15149, https://doi.org/10.5194/egusphere-egu24-15149, 2024.

EGU24-16342 | ECS | Posters on site | ESSI4.5

Using ASTER Multispectral and EnMAP Hyperspectral Remote Sensing for Lithological Mapping of Salt Diapirs in the Zagros Mountains, Iran 

Mugabo Wilson Dusingizimana, Anke M. Friedrich, Beth Kahle, Stefanie M. Rieger, Soraya Heuss-Aßbichler, Prokop Závada, and Mjahid Zebari

Over a hundred salt diapirs, which are fed by the Precambrian Hormuz Evaporites, extrude through anticlines of the fold and thrust belt of the Zagros Mountains in southern Iran. The sheer number of diapirs, the arid climate, and the mountainous landscape have presented a long-standing challenge for traditional geological field mapping to produce high-resolution lithological maps of prominent salt features. Such maps are crucial for comprehending the role of salt diapirism in the evolution of the landscape and exploring hydrocarbon and mineral resources within the region.

To overcome this challenge, we take advantage of the rapidly expanding satellite imagery database to explore the potential of employing satellite-based multispectral and hyperspectral remote sensing for producing lithological maps of salt diapirs in arid environments. Enhancing this analysis with mineral and rock spectroscopy, our goal is to map diverse lithologies characteristic of salt diapir cupolas and genetically associated salt glaciers at the resolution permitted by currently available satellite imagery.

To test the utility of satellite-based remote sensing to lithological mapping of salt diapir features, our study focuses on three salt diapirs — Karmostaj, Siah Taq, and Champeh — in the Zagros Mountains. We used previously established ASTER-based NIR and SWIR mineral indices (Cudahy et al., 2020; Hewson et al., 2005; Rowan & Mars, 2003; Shuai et al., 2022) to delineate the distribution of SO42--, Al-OH-, Mg-OH-, and CO32--bearing minerals, and of ferric and clay minerals. We also investigated potential temporal and seasonal changes in the distribution of the target minerals and the strength of the spectral signals of the mineral groups. Furthermore, we calculated mineral indices from ASTER thermal imagery suggested in previous work (Guha & Vinod Kumar, 2016; Ninomiya et al., 2005; Rockwell & Hofstra, 2008) to map quartz-, sulfate-, and carbonate-bearing rocks. To validate the accuracy and precision of the ASTER-based mineral indices, we carried out Raman and FTIR spectroscopic analysis to spectrally characterize rock and mineral samples collected from cupolas, caprocks, and country rocks of various salt diapirs in the region. We subsequently applied Spectral Information Divergence (SID) classification on multispectral ASTER and hyperspectral EnMAP optical imageries.

As we extend the mapping technique to other salt diapirs across the Zagros and Arabian Peninsula regions, our findings suggest that satellite-based remote sensing offers a cost-effective and labour-saving approach for generating high-resolution lithological maps. This method has the potential to advance our understanding of the halo-tectonic evolution of the Zagros landscape once a sufficient number of salt diapirs are mapped at the current resolution. However, we note that the accuracy of lithological mapping is influenced by the spectral and spatial resolution of the available satellite imagery. Furthermore, the strength of the spectral signal of gypsiferous outcrops exhibits distinct seasonality, weakening in warm periods and strengthening in cold seasons. In conclusion, our study demonstrates the efficiency as well as the limitations of satellite-based remote sensing in improving lithological maps of exposed salt diapirs in desert environments, providing valuable insights for geological research and resource exploration in the Zagros Mountains.


How to cite: Dusingizimana, M. W., Friedrich, A. M., Kahle, B., Rieger, S. M., Heuss-Aßbichler, S., Závada, P., and Zebari, M.: Using ASTER Multispectral and EnMAP Hyperspectral Remote Sensing for Lithological Mapping of Salt Diapirs in the Zagros Mountains, Iran, EGU General Assembly 2024, Vienna, Austria, 14–19 Apr 2024, EGU24-16342, https://doi.org/10.5194/egusphere-egu24-16342, 2024.

EGU24-17592 | Posters on site | ESSI4.5

EMODNET Geology delivers marine geological data products from Europe’s seas and beyond 

Anu Kaskela, Henry Vallius, Susanna Kihlman, Aarno T. Kotilainen, Ulla Alanen, and EMODnet Geology Partners

Effective maritime spatial planning, coastal zone management, management of marine resources, environmental assessments and forecasting require comprehensive understanding of the seabed. The European Commission established the European Marine Observation and Data Network (EMODnet) in 2008 and in response to these needs. The EMODnet concept is to assemble existing but often fragmented and partly inaccessible marine information into harmonized, interoperable, and freely available data layers and data products encompassing whole marine basins. As the data layers and data products are open for use, the program is supporting any European maritime activities in promotion of sustainable use and management of the European seas.

The EMODnet Geology project is delivering integrated and harmonized geological data products that include seabed substrates, sediment accumulation rates and seabed erosion index database, seafloor geology including lithology and stratigraphy, Quaternary geology and geomorphology, coastal behaviour, geological events such as submarine landslides and earthquakes, marine mineral resources, as well as submerged landscapes of the European continental shelf at various timeframes. All data products are openly available at the EMODnet Central Portal. They are presented at a scale of 1:100,000 or finer but also coarser scales to ensure maximum areal coverage. The current EMODnet Geology project phase is executed by a consortium of 40 partners and subcontractors which core is made up by members of European geological surveys (EuroGeoSurveys) backed up by other partner organizations with valuable expertise and data.

The EMODnet concept is expanding beyond European Seas, as also the Caspian and the Caribbean Seas are included in the geographical scope of the EMODnet Geology project. During the current project phase, the focus is to ensure collection and inclusion of Caribbean Sea data to the geology data layers on the EMODnet Central portal. For this purpose, EMODnet Geology is establishing collaboration with Asociación de Servicios de Geología y Minería Iberoamericanos (ASGMI) that is active in the Caribbean Sea area. Previously selected methods have been shared with the EMODnet PArtnership for China and Europe (EMOD-PACE) project (2019-2022).

The EMODnet Geology project is funded by The European Climate, Environment, and Infrastructure Executive Agency (CINEA) through contract EASME/EMFF/2020/3.1.11 - Lot 2/SI2.853812_EMODnet – Geology.

Discover Europe’s seabed geology at: https://emodnet.ec.europa.eu/en/geology

How to cite: Kaskela, A., Vallius, H., Kihlman, S., Kotilainen, A. T., Alanen, U., and Partners, E. G.: EMODNET Geology delivers marine geological data products from Europe’s seas and beyond, EGU General Assembly 2024, Vienna, Austria, 14–19 Apr 2024, EGU24-17592, https://doi.org/10.5194/egusphere-egu24-17592, 2024.

EGU24-17849 | Posters on site | ESSI4.5

Mapping the intensity of brittle deformation through ice covered regions: a study from Antarctica (North Victoria Land) 

Paola Cianfarra, Alessio Bagnasco, Michele Locatelli, Laura Federico, Danilo Morelli, Francesco Salvini, and Laura Crispini

North Victoria Land (NVL), Antarctica is one of the most remote and inaccessible outposts of our planet where few outcrops are available for direct geological investigation. The long-lasting tectonic evolution of this region results in a complex architecture characterized by the presence of regionally sized, crustal scale faults whose structural characteristics (e.g. geometry, thickness, location of transfer zones and off-shore prosecution) are still debated.

In this work we present a map of the intensity of brittle deformation measured in 113 field outcrops along the Rennick-Aviator km-scale fault corridor, and quantified through the non-dimensional and scale invariant H/S parameter (H = fracture dimension and S = spacing among fractures belonging to the same azimuthal family; see Cianfarra et al. 2022). The sparse fracture measurements where then interpolated with Surfer® (Golden Software, LLC) v. 23.2.17 to analyse the spatial variability of deformation with the aim of clarifying the tectonic link between the Rennick and Aviator faults.

The thematic map is prepared by a polymodal regression by full cubic surface that was applied to the field measurements (between 70.5°-71 °S and 160-165.5°E) collected during scientific expeditions funded and logistically supported by the Italian National Antarctic Program (e.g.; PNRA16-00056_G-IDEA and PNRA18-00338_LARK projects). Measurements were normalized by a weighting factor to take into account the brittle strength variability of the analysed lithotypes (e.g., basalts-dolerites, well cemented sandstone-conglomerates, granites-migmatites, gneiss)

The comparison of our georeferenced thematic map with existing maps of satellite-derived potential fields, bed subglacial topography and off-shore bathymetry, and Antarctic geology which are available as free dataset in the web (e.g. ADMAP, BEDMAP, Quantarctica, GeoMAP dataset, among the others) allows to supply constraints for modelling ice covered tectonic structures, to better highlight the active role of the main tectonic lineaments of NVL, as well as to clarify the relationship, connection and link between onshore and offshore tectonic structures (this last topic is being investigated in the frame of the ongoing PNRA19-00051_BOOST project).

Cianfarra et al. 2022, Tectonics 41, e2021TC007124, https://doi.org/10.1029/2021TC007124

How to cite: Cianfarra, P., Bagnasco, A., Locatelli, M., Federico, L., Morelli, D., Salvini, F., and Crispini, L.: Mapping the intensity of brittle deformation through ice covered regions: a study from Antarctica (North Victoria Land), EGU General Assembly 2024, Vienna, Austria, 14–19 Apr 2024, EGU24-17849, https://doi.org/10.5194/egusphere-egu24-17849, 2024.

EGU24-17877 | Posters on site | ESSI4.5

Bedmap3: improved ice bed, surface and thickness datasets for Antarctica 

Hamish Pritchard, Peter Fretwell, Alice Fremand, and Geir Moholdt

We present Bedmap3, the latest suite of gridded products describing the surface elevation, ice-thickness and the seafloor and subglacial bed elevation of Antarctica south of 60°S. Bedmap3 incorporates and adds to all post-1950s datasets previously used for Bedmap1 and Bedmap2, including 84 new aerogeophysical surveys by 15 data providers, that represent an additional 52 million data points and 1.9 million line-kilometres of measurement. These latest data have filled major gaps particularly in East Antarctica, including the South Pole and Pensacola basin, Dronning Maud Land, Recovery Glacier and Dome Fuji, Princess Elizabeth Land, plus the Antarctic Peninsula, West Antarctic coastlines, and the Transantarctic Mountains. Our newly defined Bedmap3/RINGS grounding line product similarly consolidates multiple recent mappings of this spatially varying boundary into a single, spatially coherent feature. Using these new datasets plus updated rock-outcrop mappings, we have improved our interpolation of grounded ice thickness particularly in representing linear troughs under the ice sheet and in mountain ranges such that, in many parts of Antarctica, the subglacial landscape is visible in much greater detail than was previously available. Combined with updated surface topography, ice shelf thickness and bathymetry data, these products provide new opportunities for interpreting continental-scale landscape evolution, and detailed modelling of the past and future evolution of the Antarctic ice sheets.

How to cite: Pritchard, H., Fretwell, P., Fremand, A., and Moholdt, G.: Bedmap3: improved ice bed, surface and thickness datasets for Antarctica, EGU General Assembly 2024, Vienna, Austria, 14–19 Apr 2024, EGU24-17877, https://doi.org/10.5194/egusphere-egu24-17877, 2024.

The project of the International Quaternary Map of Europe project (IQUAME 2500) is a major international initiative coordinated by BGR under the auspices of the CGMW (Commission of the Geological Map of the Word, Sub-Commission Europe) and with support of INQUA.
The project is collecting  and compiling information from more than 40 partner institutions on numerous aspects of the European Quaternary. This includes the lithology and geochronological age of Quaternary units, genetic descriptions of the units, maximum extent of the ice sheets, extent of Arctic sea ice, off-shore Quaternary information,, directions of ice movement, postglacial rebound, active faults, extent of permafrost and key localities (e.g. geologically and anthropologically interesting sites),
The IQUAME is based on hundreds of past mapping campaigns all over Europe. A considerable amount took place in extreme environments such as in polar, mountainous and/or glaciated regions. For example, the mapping of Lateglacial moraines in the Eastern Alps in Austria indicating extensive multiple glacier advances after the breakdown of the Last Glacial Maximum ice cap that occur in a high alpine environment with peaks of 3000 m altitude and steep slopes. The IQUAME also presents offshore map information, as the geology does not end on the shoreline. These data are based on  data of  European Marine Observation and Data Network (EMODnet) Geology project, established in 2009 by the European Commission. Within EMODnet Geology the Workpackage “Seafloor geology” compiles and harmonizes offshore geological map layers  also from the Quaternary, from the EMODnet partners all over Europe.
Participation of the numerous international partners and the many different topics requires considerable data harmonization (semantics, structure and geometry). To achieve this, common standards and guidelines were set up and are used by all participants:  structured vocabularies to describe the IQUAME's contents, a common topographic base, technical procedures to include the map data and guidelines to aid the partners to submit their data to the project. The harmonization is still in progress.
This contribution shows the pathway from regional mapping campaigns such as the one from the Lateglacial moraines in high alpine valleys and cirques to an overall harmonized Quaternary map layer of the entire Europe.

How to cite: Asch, K. and Reitner, J. M.: The International Quaternary Map of Europe and Adjacent Areas: Results from mapping of extreme environments inclusive, EGU General Assembly 2024, Vienna, Austria, 14–19 Apr 2024, EGU24-19240, https://doi.org/10.5194/egusphere-egu24-19240, 2024.

EGU24-20264 | Posters on site | ESSI4.5

Evidence of volcanism and former rift axis within the southern extent of the Iceland-Faroe Ridge 

Ögmundur Erlendsson, Anett Blischke, Davíð Þór Óðinsson, and Sigvaldi Thordarson

The Iceland-Faroe Ridge (IFR) is an elevated area between Iceland, the Faroe Islands, and the Hatton Bank with water depths from 300–1800 m. It is believed that the Iceland hotspot is responsible for the formation of the IFR. During the opening of the Northeast Atlantic, the Reykjanes mid-ocean ridge formed by interlinking with the Iceland hotspot. These processes created a complex wide volcanic breakup margin of volcanic rift zones or intraplate volcanism that brought magma to the surface. These processes resulted in the formation of morphologic features, as seen onshore in Iceland today, such as ridges, volcanic cones and lava flows that are a physical record of the plates being rifted and spread apart. Therefore, the IFR has been in development since the opening of the NE-Atlantic (<55 Ma), standing out as a prominent feature on bathymetric and geophysical datasets. Volcanic features such as craters, eruptive fissures, submerge lava boarders and volcanic ridges have been identified on the ridge in recent multibeam and sub-bottom profiler data from the southern part of the Iceland-Faroe Ridge acquired by Marine and Freshwater Research Institute (Iceland) and SHOM (France). With northeast-southwest trending structures, the most preserved features lies at around 1500-2000 m water depth in the southern slopes of the Iceland-Faroe Ridge. There are also evidences of volcanism in shallower depths of the IFR, however, these features are not as well preserved and have been affected by subaerial erosions and glacier erosional processes during the last ice age. These volcanic features are thought to be part of former rift axes that was probably active 30-55 Ma years ago compared to the age correlations of the surrounding oceanic floor. In the deeper part these ridge volcanic cone or ridge features are well preserved and only partly buried in sediments. They are not age dated but appear to be younger in formation time than the surrounding oceanic floor (30-55 Ma), where volcanic ridges appear to break through the sediments and older crust with evidence of sill intrusions seen on sub-bottom profiler seismic reflection data. This may Indicate a younger volcanic activity and possible still active intraplate volcanic zones that only can be confirmed by sampling, age and petrophysical analysis.

How to cite: Erlendsson, Ö., Blischke, A., Óðinsson, D. Þ., and Thordarson, S.: Evidence of volcanism and former rift axis within the southern extent of the Iceland-Faroe Ridge, EGU General Assembly 2024, Vienna, Austria, 14–19 Apr 2024, EGU24-20264, https://doi.org/10.5194/egusphere-egu24-20264, 2024.

EGU24-911 | ECS | Orals | GM9.7

The role of substrate attributes as a driver for benthic epifaunal communities investigated applying OBIA techniques and image analysis on the Norskebanken cold seep site (Arctic Ocean) 

Fereshteh Hemmateenejad, Luca Fallati, Giuliana Panieri, Pedro A. Ribeiro, Chiara Fusca, Benedicte Ferré, and Alessandra Savini

Cold seeps are hotspots of biodiversity and can deeply impact the local sediment geochemistry in marine environments (e.g., promoting the formation of authigenic carbonate crusts) throughout all the oceans. Natural gas seepage can lead to changes in sediment properties and nutrient cycling supporting unique benthic fauna living in or near the substrate, eventually promoting the establishment of chemosynthetic biological communities. In this study, a relatively shallow water area offshore northern Svalbard (located at roughly 150m of water depth), where evidence of gas seepage has been observed, is investigated using optical, high-resolution seafloor imagery, and OBIA (Object-Based Image Analysis) techniques. Visual data consists of two photomosaics assembled from frames extracted from videos acquired by means of a work-class Remotely Operated Vehicle (i.e. the ROV ÆGIR 6000), and processed by applying underwater Structure from Motion (SfM) photogrammetry technique. The study aims to detect, classify, and count each single specimen representing benthic epifaunal communities at the seafloor and describe changes in seafloor substrates (i.e. sediment grain size and morphometric attributes) across all the photo-referenced datasets. ArcMap software and direct ROV-based video analysis were used to annotate all visible epibenthic fauna (more than 20,000 individuals), identified to the lowest possible taxonomic level based on discernible external morphological characteristics. In a further step, OBIA techniques (using Trimble eCognition® software) were applied on seafloor geomorphological characteristics, to provide quantitative and repeatable classification of the substrate into four distinct classes. Finally, annotated benthic epifauna and seafloor substrate classes’ data were combined to quantify patterns of community diversity, abundance, and structure in relation to seafloor morphometric parameters. Cluster analysis revealed substrate class similarities, as well as colonization preferences exhibited by the fauna, especially where methane-derived authigenic carbonates (MDAC) occur at the seafloor. All the fauna and substrate classification outcomes are reported in a catalogue which can be used as a bionomic guide for future studies. This work comprises data collected during the CAGE 20-7 cruise conducted in November 2020 as part of the Centre of Excellence for Arctic Gas Hydrate, Environment and Climate (CAGE) at UiT – The Arctic University of Norway and within the framework of the INTPART-AKMA “Advancing Knowledge on Methane in the Arctic (AKMA)”.

How to cite: Hemmateenejad, F., Fallati, L., Panieri, G., Ribeiro, P. A., Fusca, C., Ferré, B., and Savini, A.: The role of substrate attributes as a driver for benthic epifaunal communities investigated applying OBIA techniques and image analysis on the Norskebanken cold seep site (Arctic Ocean), EGU General Assembly 2024, Vienna, Austria, 14–19 Apr 2024, EGU24-911, https://doi.org/10.5194/egusphere-egu24-911, 2024.

EGU24-1975 | ECS | Posters on site | GM9.7

Comprehensive review of pockmarks and first "Susceptibility Map" of the Italian Continental Margins 

Daniele Spatola, Daniele Casalbore, Francesco Latino Chiocci, Ashok Dahal, Stéphanie Dupré, Gemma Ercilla, Martin Torvald Hovland, Luigi Lombardo, Marzia Rovere, Attilio Sulli, and Juan Tomás Vázquez

Fluids, encompassing gases and liquids, possess lesser density than solids, therefore exhibit an upward movement within sedimentary strata due to buoyancy. Seafloor "fluid flow" is a well-established phenomenon in diverse geodynamic settings, spanning active and rifted continental margins, compression zones (subductions), and depositional environments characterized by high-rate sedimentation such as deltas and contourite drifts. This phenomenon manifests in a range of positive (e.g., mud volcanoes) and/or negative seafloor morphologies (pockmarks).

Pockmarks, recognized since the 1970s, represent the dominant morphological features associated with fluid escaping from the seafloor. These seafloor morphologies can reach diameters and depths of several kilometers and over 100 meters, respectively, featuring circular to elongated planforms and flat-bottomed to conical cross-section profiles. Despite insights from geological and geophysical data, the comprehensive understanding of the mechanisms governing pockmark formation, growth and maintenance remains elusive. Various hypotheses and conceptual models, including those involving near-bottom currents, have been proposed to elucidate the genesis and development of pockmarks. These models encompass continuous processes (seeps) or sudden episodic events of fluid releases and blowouts (vents).

Pockmarks hold significance for various reasons. Pockmarks are often linked to fluid-driven sedimentary failures, highlighting their role as a significant geohazard associated with fluid migration, excess pore pressure, and potential landslide triggering. Therefore, studying pockmarks is crucial for geohazard assessment and the planning of submarine and seafloor infrastructures, where their inherent instability at the seafloor requires safety assessments. Studies on seismicity in marine areas suggest that pockmarks may serve as important earthquake precursors, with observed increase in seeping water temperature before seismic events and continued venting of gas bubbles immediately afterward. The plausible relationship between fluids and seismicity is due to the lubricating effect of fluids on faults. Furthermore, pockmarks release hydrocarbons, which are of great importance for the global carbon cycle, their implication in the climate change and in the sustaining of specialized biological communities. Pockmarks are also indicators of petroleum generation, making their study pertinent in oil and gas exploration.

This study, concerning the assessment of approximately 6,000 pockmarks mapped on the central Mediterranean Sea, utilizes morphological, sedimentological, and tectonics evidences, employing a GIS-based and data-driven approach to generate the pockmark susceptibility map for the Italian continental margins. The map is the outcome of a deep learning architecture tasked with the classification of the seafloor based on binary classification obtained by training a neural network with locations where pockmarks have been mapped and locations where the same are certain to be absent.

How to cite: Spatola, D., Casalbore, D., Chiocci, F. L., Dahal, A., Dupré, S., Ercilla, G., Hovland, M. T., Lombardo, L., Rovere, M., Sulli, A., and Vázquez, J. T.: Comprehensive review of pockmarks and first "Susceptibility Map" of the Italian Continental Margins, EGU General Assembly 2024, Vienna, Austria, 14–19 Apr 2024, EGU24-1975, https://doi.org/10.5194/egusphere-egu24-1975, 2024.

EGU24-2587 | Posters on site | GM9.7

Geochemical, geophysical and biological features of Black Point shallow hydrothermal vent at Panarea island (Italy) 

Fabio Sposito, Anna Maria Gallo, Agostino Semoprebello, Manfredi Longo, Lorenzo Brusca, Gianluca Lazzaro, Sergio Scirè Scappuzzo, Cinzia Caruso, Valeria Alduina, Marco Arculeo, Alessandro Gattuso, and Francesco Italiano

Shallow Hydrothermal Vents (SHVs) are fluid emission spots in which water dynamics are characterised by interactions between seawater and free gas due to low hydrostatic pressure. This characteristic marine environment represents a peculiar natural laboratory where the study of geo-biological conditions needs a multidisciplinary approach to better understand the extreme ecosystem dynamics.

Although many studies have been already performed on physical-chemical conditions, analysing major chemical species, just a few studies have adopted multidisciplinary approaches, giving a broader and more detailed view of the observed phenomenon.

We propose a multidisciplinary study carried out in the period May-August 2022, based on the geophysical, geochemical and biological analysis of Black Point (23m b.s.l.), a hydrothermal spring belonging to the system located at about 2 miles off the coast of Panarea island (Aeolian Archipelago, Italy). Here a multiparametric seafloor observatory is installed (IPANEMA Project funds), equipped with chemical-physical sensors, a hydrophone and a seismometer. The area is periodically monitored by scientific divers performing discrete geochemical sampling, in addition, acoustic radiation studies are regularly conducted close to the emission, to characterise their acoustic signatures and peculiarities in turn. The gained expertise has led to the development of custom algorithms to perform spectral analysis of the acoustic features.

Comparing the variation of the flux, investigated through the inversion of acoustic energy (radiated in the band [35 - 55] Hz likely associated with the mass flux variation), with fluctuations related to the environmental seafloor temperature, both series exhibit synchronous relative maxima over the investigated period.

Coupling these trends with geochemical and biological variations in terms of Minor, Trace elements and Rare Earth Elements (REEs) concentrations and in the microbial community, simultaneous variations have been highlighted as well.

In detail, the highest concentrations of minor elements (Al, Fe, Mn), trace elements (As, V) and REEs correspond to spectral energy and temperature peaks. Moreover, pH is inversely correlated to Fe, Al and Mn, indicating its role in dissolution/precipitation of Fe, Al and Mn oxy-hydroxides; inversely, REEs are positively correlated to Fe, Al and Mn indicating the role of the oxy-hydroxide ligands in fractionation of these elements, as a consequence, REEs patterns shapes show LREE depletion (Lan/Ybn < 1).

Furthermore, the composition and diversity of microbial communities were investigated by extracting metagenomic DNA from different matrices (vent fluid, marine sediment near the vent and seawater at a short distance from the vent) and through the next-generation sequencing of a bacterial marker gene (16S rRNA gene). The results show significant differences in the microbial community between the samples and in the two samplings (May and August), especially in the fluid vent. These results are in accordance with the geochemical flux variations and the seafloor temperature, suggesting that each sample carries its specific bacterial fingerprint and the microbial community changes depending on the physicochemical conditions.

This study confirms the importance of a multidisciplinary approach as the key to highlight different features of SHVs and how geo-biological fields are strictly linked in extreme environments.

How to cite: Sposito, F., Gallo, A. M., Semoprebello, A., Longo, M., Brusca, L., Lazzaro, G., Scirè Scappuzzo, S., Caruso, C., Alduina, V., Arculeo, M., Gattuso, A., and Italiano, F.: Geochemical, geophysical and biological features of Black Point shallow hydrothermal vent at Panarea island (Italy), EGU General Assembly 2024, Vienna, Austria, 14–19 Apr 2024, EGU24-2587, https://doi.org/10.5194/egusphere-egu24-2587, 2024.

Hydrothermal vents (HVs) and cold seeps (CSs) are typical deep-sea extreme ecosystems with their own geochemical characteristics to supply the unique living conditions for local communities. Once the fluid vents stop emission, the dramatically environmental change would pose survival risks to deep-sea organisms and further shape the whole ecosystems. Up to now, limited knowledge was available to understand the biological responses and adaptive strategies to these extreme environments and their dual-state from active to extinct stage. In this study, bathymodiolin mussels, the dominant and successful species surviving in diverse deep-sea extreme ecosystems, were sampled from active and extinct HVs (Southwest Indian Ocean) or CSs (South China Sea) via two individual cruises. The transcriptomic analysis, determination of multiple biological indexes in stress defense and metabolic systems were conducted in both gill and digestive gland of mussels, together with the metagenomic analysis of symbionts in mussels. The results revealed the fluid-specific transcriptional regulation in mussels, addressing the autologous adaptations in successful antioxidant defense, varied energy utilization and key compounds (i.e. sulfur) metabolism due to distinction in different fluid environments. Coordinately, a heterologous adaptation, characterized by the functional compensation between symbionts and mussels in energy utilization, sulfur and carbon metabolism, was also evidenced by the bacterial metagenomic analysis in these chemosynthetic ecosystems. Taken together, a new insight was proposed that the dual-state of fluid vents drives symbiotic bathymodiolin mussels to develop an autologous and heterologous combined adaptation for successful survival.

How to cite: Zhao, R., Xu, J., and Di, Y.: Systemic comparisons of the adaptations in symbiotic bathymodiolin mussels from diverse stages of hydrothermal vents and cold seeps , EGU General Assembly 2024, Vienna, Austria, 14–19 Apr 2024, EGU24-5051, https://doi.org/10.5194/egusphere-egu24-5051, 2024.

EGU24-5523 | Orals | GM9.7 | Highlight

The unique geomorphology of submarine venting features as revealed by dropping lake levels in the Dead Sea  

Michael Lazar, Danny Ionescu, and Christian Siebert

The presence of submarine springs and seepages within the hypersaline Dead Sea appears to be a common feature. Hydrothermal fluid escape was first proposed in the mid-1980s based on temperature anomalies measured in the lake, and acoustic blanking observed on high-resolution seismic reflection data. However, the actual existence of such springs was not verified until recently, since the phenomenon only became the focus of dedicated scientific studies during the last decade. As a result of combined anthropogenic intervention and climate change, lake levels have been dropping since the 1960s by over 1 m per year. This has led to large expanses of the lake floor becoming dry land and for submarine springs and other venting features that were previously in deeper water to become shallower. As a consequence, such features are now accessible for direct study either by skilled scuba divers or even along the coast where some have become exposed. Underwater observations include pockmark-like structures, fast and slow-flowing springs, and even salt chimneys formed when brines with different ionic composition than Dead Sea water escape from these vents and come in contact with chlorine-saturated hypersaline background brine leading to the precipitation of halite and other minerals. Diverse microbial communities seem to thrive at these venting locations. Here we will discuss the different types of features, their connection to regional tectonics, and their evolution and development from water to land.

How to cite: Lazar, M., Ionescu, D., and Siebert, C.: The unique geomorphology of submarine venting features as revealed by dropping lake levels in the Dead Sea , EGU General Assembly 2024, Vienna, Austria, 14–19 Apr 2024, EGU24-5523, https://doi.org/10.5194/egusphere-egu24-5523, 2024.

EGU24-6358 | Posters on site | GM9.7

Influence of focused fluid flow on the development of submarine lateral spreading. Aguilas high (Gulf of Vera, Western Mediterranean) 

Mariano Yenes, José Nespereira, David Casas, Serafín Monterrubio, Gemma Ercilla, Máximo García, and Belén Alonso

The Gulf of Vera (Western Mediterranean) presents a complex geomorphology that is the result of the sedimentary response to the Aguilas tectonic indentation Arc in the framework of the Eurasian–Africa plate collision. This indentation has caused the quasi-continuous oversteepening of the entire margin, which has favored the gravitational instability of the 97% of its seafloor. This margin is one of the most affected by mass movements in the SW Mediterranean Sea. With a characteristic instability of 0.356 km2 and a mean volume of 0.0108 km3, the continental slope shows moderate events comparable to those of other Mediterranean areas.

The Aguilas high is one of the structural highs shaping the margin. Its top is characterized by a smooth surface shaped by sedimentary deposits (contourites). Those deposits are affected on the southern edge by a pockform field, erosive features (scars) and deposits with the characteristic ridges of spreading processes.

The aim of this work is to define from morphological and geotechnical point of view the instabilities observed on the summit of the high as well as to evaluate the role of fluid flow over those instability processes. Different data set have been merged and combined, including very high-resolution bathymetric data, gravity cores and in-situ geotechnical data (CPTu tests).

The results obtained define a geotechnical weak interval at depths between 10 and 15 m below seafloor which is compatible with a detachment surface where lateral spreads developed. The processes would be driven by liquefaction (cyclic softening) triggered by seismic events that affects the clayey sediments present on the stratigraphic record. This process may also favour the vertical fluid flow due to overpressure that may explain the pockform field observed. The spatial association between pockforms and scars observed, evidence a strong link between liquefaction, fluid flow and instability in the study area.


This research was funded by the Spanish MCIN/AEI/10.13039/501100011033. Grant PID2022-138258OB-I00 (inGRAVITAS). 

How to cite: Yenes, M., Nespereira, J., Casas, D., Monterrubio, S., Ercilla, G., García, M., and Alonso, B.: Influence of focused fluid flow on the development of submarine lateral spreading. Aguilas high (Gulf of Vera, Western Mediterranean), EGU General Assembly 2024, Vienna, Austria, 14–19 Apr 2024, EGU24-6358, https://doi.org/10.5194/egusphere-egu24-6358, 2024.

EGU24-8298 | Orals | GM9.7 | Highlight

Fluid escape submarine geomorphological features in the NW Black Sea 

Gabriel Ion, Adrian Popa, Constantin Lazăr, Vlad Apotrosaei Apotrosaei, and Florin Duțu

By means of Digital Terrain Models, produced based on multibeam echosounding data and underwater photography, spectacular sea floor geomorphologies and features have been discovered and mapped.

In some parts of the NW Black Sea, the submarine geomorphology is characterized by the presence of fluid escape features. These very specific features are present in the flexure area and the upper continental slope. There are prevailing the so-called pockmarks (large depressions on the sea floor) and carbonate chimnies - positive small morphological items on top of the sea bottom, micro-biogeochemically build as the result of the fluid escapes from the sea floor. These kind of submarine geomorphologies are the result of the high dynamics of the fluid escapes that occur in areas with high sedimentation rates, both of sediments and organic matter. The sediments are of Quaternary age and are subject of consolidation processes, that means expulsion of pore water, sometimes accompanied by important amounts of gases, mainly biogenic methane. These submarine sea bottom elements are the best testimonies for the high dynamics of fluids in the pile of young sediments and point out that subjacent to these underwater morphologies could be located hot spots of organic matter accumulations.

The pockmarks could be isolated or clustered in groups of scattered elements or linear patterns. Often, mostly the linear clusters of pockmarks, are associated to the local highs of the sea floor geomorphology. The carbonate chimnies cannot be detected by means of multibeam technologies, but in some upper parts of the Danube and Dnieper deep sea fans such structures can by observed by means of underwater photography.

How to cite: Ion, G., Popa, A., Lazăr, C., Apotrosaei, V. A., and Duțu, F.: Fluid escape submarine geomorphological features in the NW Black Sea, EGU General Assembly 2024, Vienna, Austria, 14–19 Apr 2024, EGU24-8298, https://doi.org/10.5194/egusphere-egu24-8298, 2024.

EGU24-8501 | Posters on site | GM9.7

EMAN7: understanding methane seepage dynamics in the Hola Trough 

Bénédicte Ferré, Thibaut Barreyre, stefan Bünz, Claudio Argentino, Jorge Corrales-Guerrero, Knut Ola Dølven, Marie Stetzler, Luca Fallati, Muhamed Fatih Sert, Giuliana Panieri, Samuel Rastrick, Tina Kutti, and Manuel Moser

The Hola Trough, offshore Norway’s Lofoten-Vesterålen (LoVe) area, has been of interest for many years due to its rich marine life and potential oil and gas resources. There, coral mounds thrive around methane seepage. The LoVe observatory network monitors this unique environment. Using this observatory platform, associated dataset and research expeditions at sea, the project EMAN7 (Environmental impact of Methane seepage and sub-seabed characterization at LoVe-Node 7) aims to understand the environmental impact of methane seepage as well as its spatio-temporal variability.

The comparison of methane seep activity during two summers with different environmental conditions revealed 3.5 times more seeps when a combination of warmer bottom water and low tide changes the sediment pore pressure. Piezometer data, recording subseafloor pore pressure and bottom temperature, support these findings. Sub-seafloor investigations identified pathways for gas migration in methane seep areas, influenced by topography.

This study is supported by the Research Council of Norway, project number 320100, through the project EMAN7.

How to cite: Ferré, B., Barreyre, T., Bünz, S., Argentino, C., Corrales-Guerrero, J., Dølven, K. O., Stetzler, M., Fallati, L., Sert, M. F., Panieri, G., Rastrick, S., Kutti, T., and Moser, M.: EMAN7: understanding methane seepage dynamics in the Hola Trough, EGU General Assembly 2024, Vienna, Austria, 14–19 Apr 2024, EGU24-8501, https://doi.org/10.5194/egusphere-egu24-8501, 2024.

EGU24-10370 | Orals | GM9.7

Discovery of a major seafloor methane release site in Europe: The Landsort deep, Baltic Sea. 

Marcelo Ketzer, Christian Stranne, Cheng Chang, Satoko Owari, Changxun Yu, Sebastien Migeon, Matt O'Regan, and Martin Jakobsson

A recently acquired multidisciplinary dataset comprising acoustic surveys (high-resolution sub-bottom profiles, multi-beam bathymetry, and broad band mid-water echo sounder), geochemistry (gas chemical and isotopic composition, porewater chemistry), and sedimentology (core lithology and X-ray CT) in the area of the Landsort deep (450 m of depth), south of Stockholm Archipelago, revealed the existence of an extensive (20 km2) region of the seafloor where massive gas release is occurring in the form of multiple bubble streams. This new discovery represents a major seafloor methane release site in Europe and is comparable in area to other large sites worldwide such as the ones in Svalbard and in the South Atlantic Ocean associated with gas hydrate provinces. The gas is formed mostly by methane of microbial origin. Surprisingly, bubbles rise 100’s of meters above the seafloor and reach surface waters above the halocline/oxycline at around 80 m of depth. Some bubbles appear to reach the sea-air interface and their potential methane contribution to the atmosphere is under investigation. Another surprising observation is the absence of major seafloor features like pockmarks in the gas release area. The reasons for the seafloor methane release in the Landsort deep are still not entirely clear, but our preliminary acoustic and sedimentological data suggest that bottom currents may have acted to facilitate the accumulation of organic-rich sediments in a thick drift deposit during the Holocene and the modern warm period (latest 100 years). Our data further suggest that the high sedimentation rate in the drift deposit continuously supplies fresh organic matter that is quickly buried below a thin sulphate reduction zone, fueling vigorous methanogenesis and abundant methane formation. Similar methane release sites might be discovered in other known large drift deposits in the Baltic Sea.

How to cite: Ketzer, M., Stranne, C., Chang, C., Owari, S., Yu, C., Migeon, S., O'Regan, M., and Jakobsson, M.: Discovery of a major seafloor methane release site in Europe: The Landsort deep, Baltic Sea., EGU General Assembly 2024, Vienna, Austria, 14–19 Apr 2024, EGU24-10370, https://doi.org/10.5194/egusphere-egu24-10370, 2024.

EGU24-10885 | Posters on site | GM9.7

Case study on the multi-year geophysical and acoustic survey in a gas flare site on the southeastern continental shelf of the East Sea, Korea 

Young-Jun Kim, Mario Enrique Veloso Alarcon, Gee-Soo Kong, Jong-Hwa Chun, Deniz Cukur, Youngho Yoon, and Dong-Geun Yoo

Shallow gas escaping from the seafloor is normally observed in poor sedimentary layers and geological structures accompanied by faults, cracks, and fractures. Gas venting, the migration of the fluid between pores, causes seafloor deformation such as pockmarks and can trigger large-scale geohazards such as submarine sliding and tsunamis, so multi-year monitoring is required.

After first discovering a gas flare in the southeastern continental shelf area of the East Sea, Korea in 2019, we conducted multi-scaled seismic and acoustic surveys using R/V TamhaeⅡ from 2021 to 2023, except for 2020. In 2019, EK60, sub-bottom profiler (SBP), and high-resolution seismic (HRS) data were acquired, and EK60 and SBP data were acquired in 2021. In 2022, EK60, multi-beam echo sounder (MBES), SBP, and conventional seismic data were acquired, and in 2023, EK60, MBES, and SBP data were acquired. In 2019 and 2021, MBES data was only acquired to detect seafloor deformation such as the pockmark, while water column data using MBES began to be recorded to detect flares from 2022. The flare size from the seafloor to the sea surface was measured in the EK60 data, while the quantification study on the gas flow rate using the ESP3 software and the VBALab plugin has been tried since 2022. Through EK60 data acquired over 4 years, it can be estimated that gas venting periodically rather than continuously. MBES data presents evidence of a lot of gas-related seafloor deformation in the study area.

 Since the first exploration of a new R/V TamhaeⅢ installed EK80, parametric SBP, and acoustic Doppler current profiler (ADCP) will begin this May, we expect that a high-quality seismic and acoustic dataset will be obtained for the site of gas flare. For further research, it will be necessary for sea-water and geological sampling to analyze gas components, and detailed monitoring using ROV and seafloor observation systems installed with a camera should be accompanied to quantify the gas flow rate.

How to cite: Kim, Y.-J., Veloso Alarcon, M. E., Kong, G.-S., Chun, J.-H., Cukur, D., Yoon, Y., and Yoo, D.-G.: Case study on the multi-year geophysical and acoustic survey in a gas flare site on the southeastern continental shelf of the East Sea, Korea, EGU General Assembly 2024, Vienna, Austria, 14–19 Apr 2024, EGU24-10885, https://doi.org/10.5194/egusphere-egu24-10885, 2024.

Seabed fluid activity involves the transport and migration processes of liquids, gases, and seawater beneath the seafloor which is primarily controlled by factors such as fault activity, sediment overpressure, seismic events, sea level changes, tidal activity, and submarine landslides. Based on different formation mechanisms, the sources of fluids include such as thermal, biological, and natural gas hydrate decomposition. The southwestern offshore Taiwan experiences compressional stress, leading to the formation of numerous folds and thrust faults that establish conduits for fluid migration. The presence of a series of mud volcanoes and mounds of natural gas hydrates points to a substantial methane flux in this region. While previous studies have used single-beam echo sonar (SBES) data to detect seabed gas discharge phenomena, analyses relied on 2D sonar images, making results susceptible to the influence of single survey lines and temporal variations. We aim to develop processing programs for SBES data to obtain 3D sonar image distribution and intensity analysis, providing a more precise analysis of fluid and gas-related activities in southwestern offshore Taiwan. Three research vessels' SBES data from the past decade have been reexamined. The possible flare signals are transformed into a 3D point cloud distribution by computing the receiving angle of the data. The near-surface point cloud effectively illustrates the precise discharge area. Comparing changes at the same location over different times may provide insights into the correlation between geological structural activities and gas emissions. However, due to the significant period and differing equipment configurations on each vessel, consolidating the data to a uniform standard poses certain challenges. The complex changes in seafloor bathymetry also increase the difficulty of discerning gas emission signals.

How to cite: Lin, Y.-C. and Lin, J.-Y.: Investigating seabed fluid activities using historical single-beam echo sounder data in the offshore southwestern Taiwan, EGU General Assembly 2024, Vienna, Austria, 14–19 Apr 2024, EGU24-14435, https://doi.org/10.5194/egusphere-egu24-14435, 2024.

EGU24-14838 | Posters on site | GM9.7

Geomorphology of the Montenegro slope (eastern Adriatic Sea): A tale of slump scars, corals and a chimney forest 

Andrea Argnani, Lorenzo Angeletti, Federica Foglini, and Marco Taviani

The submarine slope offshore Montenegro is a segment of the eastern slope of the Southern Adriatic Sea, which represents the current foredeep basin of the Dinaride-Hellenide fold-and-thrust belt. In this part of the Adriatic Sea shelf is 10 to 40 km wide and is receiving only a limited amount of clastic sediments. The N-NW-trending shelf break has a water depth of about 400 m, over 200 m deeper than the last sea-level low-stand because of the foreland subsidence. The submarine morphology of the Montenegro slope has been investigated using a high-resolution multibeam bathymetry. The slope appears carved by a set of closely spaced canyons that only rarely scratch the shelf break. A drainage system connected to the slope canyons is not visible on the shelf, and the canyons appear to be originated by the coalescence of multiple landslide scars. The incised canyons are closely spaced along the slope, suggesting a high maturity of the drainage system, in accordance with a destructive-type slope, dominated by mass wasting. In the head of one of the southernmost canyons a field of fossil chimneys has been exhumed by erosion at the seafloor. The stable carbon isotope signature indicates that these chimneys originated because of hydrocarbon fluid seepage within the sedimentary cover. A small field of pockmarks is present at the shelf edge, not far from the fossil chimneys, and located in an intra-canyon position, between canyon headscarps that incised the shelf break. The co-existence of chimneys and pockmarks suggests the occurrence of long-lasting fluid flow in the slope. The system of focussed fluid flow might have played a pivotal role in destabilizing the slope sediments, promoting landsliding. Standing and abated chimneys, together with their rubble and other nearby hardgrounds, have become habitat to relevant benthic fauna in the poorly sedimented slope. Megabenthic cnidarian assemblages are commonly found, also including the emblematic cold-water corals Madrepora oculata, Desmophyllum pertusum, and D. dianthus, the octocoral Callogorgia verticillata, the antipatharian Leiopathes glaberrima, and sponges.

How to cite: Argnani, A., Angeletti, L., Foglini, F., and Taviani, M.: Geomorphology of the Montenegro slope (eastern Adriatic Sea): A tale of slump scars, corals and a chimney forest, EGU General Assembly 2024, Vienna, Austria, 14–19 Apr 2024, EGU24-14838, https://doi.org/10.5194/egusphere-egu24-14838, 2024.

EGU24-15075 | Orals | GM9.7

Are the foraminiferal assemblages useful proxy for detecting methane emissions in shallow water environments? the case of Scoglio d’Africa (Tuscan Archipelago, Northern Tyrrhenian Sea) ? 

Letizia Di Bella, Daniele Casalbore, Aida Maria Conte, Alessia Conti, Irene Cornacchia, Andrea D’Ambrosi, Giovanni Gaglianone, Michela Ingrassia, Daniele Spatola, Martina Pierdomenico, Claudio Provenzani, Tania Ruspandini, and Francesco Latino Chiocci

In this research benthic foraminiferal response to shallow water methane (CH4) emissions located in the area around Scoglio d’Africa (Tuscan Archipelago, Northern Tyrrhenian Sea were used as proxy for the individuation of) was investigated. The site is located in the southernmost part of the Elba-Pianosa Ridge, a mainly submarine, north-south elongated morpho-structural high separating the Tuscany Shelf to the east from the Corsica Basin to the west. In the study area, submarine methane emissions have been studied since the 1960s and they are linked to the combined action of two processes: biogenic (microbial process called methanogenesis) and thermogenic origin. The aim of this study is to verify the use of foraminifera as a proxy for detecting the presence of methane emissions and elaborate a microfaunal pattern distribution to apply in recent, future and fossil record. Methane (CH4) is an important greenhouse gas, with a global warming potential about 20 times as large as carbon dioxide (CO2) on a 100-year horizon. In the marine environment, coastal areas represent methane hotspots highly exceeding emissions from the open ocean. In this view, Scoglio d’Africa provides a much-promising study site for multidisciplinary marine research like carbon capture and storage, geochemistry of hydrothermal fluids and ocean acidification vs. benthic and pelagic organisms. The microfaunal analyses were carried out from sediment samples coming from 11-16 m depth are shown. The samples were collected by grab and scuba during two sampling surveys in 2021 and 2022. The preliminary results of this research highlighted a very patch distribution and variability in density and biodiversity probably linked to the irregular distribution of the venting activity on the ground floor. The complexity of the interaction of the ecological factors characterizing extreme environments such as shallow hydrothermal vents did not allow us to carry out a real pattern of biota responses in situ. However, some significant considerations can be highlighted. Firstly, a strong loss of biodiversity and collapse in faunal density are recorded due to the combined effects by the CH4 emissions and the mud flow setting. Secondarily, the rare living specimens are represented by agglutinated species like Lepidodeuterammina ochracea and Ammodiscus sp., miliolid taxa like Quinqueloculina stelligera and Siphonaperta agglutinans, and among hyaline species, Rosalinids and H. depressula resulted the more resilient taxa. Moreover, the research provides new constrain on the ecological behaviour of some foraminiferal species in response to extreme conditions due to methane release.

How to cite: Di Bella, L., Casalbore, D., Conte, A. M., Conti, A., Cornacchia, I., D’Ambrosi, A., Gaglianone, G., Ingrassia, M., Spatola, D., Pierdomenico, M., Provenzani, C., Ruspandini, T., and Chiocci, F. L.: Are the foraminiferal assemblages useful proxy for detecting methane emissions in shallow water environments? the case of Scoglio d’Africa (Tuscan Archipelago, Northern Tyrrhenian Sea) ?, EGU General Assembly 2024, Vienna, Austria, 14–19 Apr 2024, EGU24-15075, https://doi.org/10.5194/egusphere-egu24-15075, 2024.

EGU24-16419 | Orals | GM9.7 | Highlight

Insights into Seabed Fluid flows: Pockmark dynamics mapping and monitoring in Patras Gulf, Greece, Unveil Correlations to local tectonics and Earthquakes. The BLUEL project. 

George Papatheodorou, Maria Geraga, Dimitris Christodoulou, Elias Fakiris, Efthimios Sokos, Zafeiria Roumelioti, Giuseppe Etiope, Sotiris kokkalas, Nikos Giannopoulos, Xenophon Dimas, Nikos Georgiou, Vasileios Giannakopoulos, and George Ferentinos

Seabed fluid flows (SFF) refer to the movement of fluids (gases and liquids) from sediments to seawater. SFF has broad implications for (i) human activity in the ocean, which is often associated with geohazards, (ii) global climate, and (iii) benthic ecology. BLUEL project aimed to long-term monitor the submarine active pockmark field in the Gulf of Patras, Greece, and investigate its relationship to seismic activity, examining the occurrence of changes in their fluid flow behavior during local earthquakes towards evaluating their potential for use as earthquake precursors. The pockmark field extends to an area of 2.4 km2, in water depths of 17 to 45 meters and consists of 115 pockmarks of which 92 are visible and 23 are buried under the infrastructure of the recently constructed South Port of Patras. The formation and activity of the field appears to be controlled by tectonics (faults) while methane fluxes and fluid escapes into the water column were recorded in the past, increased after strong earthquakes.

A high-resolution mapping and monitoring of the Patras Gulf pockmark filed (PGPF) was carried out through high resolution acoustic mapping techniques, including swath bathymetry, sidescan sonar backscatter and sub-bottom profiling, revealing pockmarks morphological evolution through time and assessing the spatial patterns of bubble flares after major seismic events. Results showed that the main mechanisms for the development of the field are local tectonism and internal characteristics of gas-charged sedimentary layers. Sediment and water samples were collected and in-situ measurements of CH4 concentration were performed using a methane sensor. The chemical composition and origin of the fluids in the seawater and the sediments were assessed and implications about the volume of greenhouse gases escaping to the atmosphere were made. The geochemical analysis showed that heavy metal concentrations are always higher in sediments collected inside the pockmarks than those collected outside the sites. Isotopic analysis also revealed that CH4 of microbial origin is the dominant component of the released gas. The annual emissions of methane from the pockmark field wider area to the atmosphere have been also estimated between 7.6 to 8.4 tons per year.

A 200m long submarine optical fiber was installed inside a selected active pockmark to measure the water temperature through a Distributed Temperature Sensing (DTS) system, acquiring data over 1.5 years. Spectral analysis methods were applied to fill missing data, reconstruct the temperature time series along the cable length and reveal any underlying periodicities or anomalous events. The above measurements were supported by meteorological and tidal data collected in the area, as well as by a microseismic network to record the seismic activity over the corresponding period. Comparisons were performed between the above datasets, revealing significant relationships between anomalous thermal events and local seismicity.

How to cite: Papatheodorou, G., Geraga, M., Christodoulou, D., Fakiris, E., Sokos, E., Roumelioti, Z., Etiope, G., kokkalas, S., Giannopoulos, N., Dimas, X., Georgiou, N., Giannakopoulos, V., and Ferentinos, G.: Insights into Seabed Fluid flows: Pockmark dynamics mapping and monitoring in Patras Gulf, Greece, Unveil Correlations to local tectonics and Earthquakes. The BLUEL project., EGU General Assembly 2024, Vienna, Austria, 14–19 Apr 2024, EGU24-16419, https://doi.org/10.5194/egusphere-egu24-16419, 2024.

EGU24-17022 | Orals | GM9.7

Discovery of a unique submarine hydrothermal system between shallow photic and deep dark sites around the Greek island of Milos (Aegean Sea, Greece) 

Solveig Bühring, Andrea Koschinsky, Wolfgang Bach, Marcus Elvert, Charlotte Kleint, Palash Kumawat, Joely Maak, Eva-Maria Meckel, Paraskevi Nomikou, Clemens Röttgen, and Enno Schefuß

On the Greek island Milos and in shallow water at its coast, many spots with hydrothermal activity have been found and studied in the past. The M192 cruise in August 2023 with the German research vessel METEOR followed the idea that these systems may continue along a tran­sect from shal­low, nearshore, photic to the deeper, off­shore, aphotic zone around the island, accompanied by changes in terms of environmental parameters. 

Volcanism along the Hellenic volcanic arc started during the Early to Middle Pliocene, while the last eruption occurred in 1950 (Nea Kammeni volcano). The intense seismic activity in the area is associated with important geothermal gas venting, with the major systems being found in relatively shallow waters (1–500m depth) at Methana, Milos, Santorini (Kolumbo submarine volcano), Kos and Nisyros.

Systematic bathymetry and water column acoustic survey work with METEOR's multibeam with the autonomous underwater vehicle (AUV) MARUM-SEAL on the M192 cruise revealed several previously uncharted hydrothermal vent fields offshore Milos. They are located in the southeast extending from the bays Kiriaki to Paleochori and Thiorychia, as well as in an area northwest of Milos, offshore the bay of Vani. The distribution of the hydrothermal vents seems to be tectonically controlled and follow the prominent faults that have been mapped on Milos.

The areal extents of venting were identified by echosounding using the acoustic anomaly the presence of gas bubbles causes in the water column. But selected hydrothermal vents were furthermore visually observed and sampled using the remotely operated vehicle (ROV) MARUM-SQUID. These individual vents revealed pronounced differences; whereas the shallower vents (around 100 m water depth) were noticed as white patches (of sulfur-oxidizing bacteria) on the sandy seafloor with diffuse venting comparable to the shallow vents close to the coast, the deeper vents (around 200 m water depth) featured remarkable chimney structures sometimes several meters in height that are covered with white biofilms and vent fluids reaching temperatures up to 180 °C. Sampled fluids showed mildly reducing and slightly acidic (pH between 5.0 and 7.9) conditions and were rich in dissolved hydrogen sulfide and dissolved metals. These signals extended up to about 10 m into the water column, as recorded by CTD-rosette water sampler stations.

To date, shal­low-wa­ter and deep-sea hy­dro­thermal sys­tems have been treated as in­de­pend­ent, seem­ingly un­re­lated en­tit­ies; the results of the M192 expedition presented here are the first foray into re­mov­ing this ar­bit­rary bound­ary.

How to cite: Bühring, S., Koschinsky, A., Bach, W., Elvert, M., Kleint, C., Kumawat, P., Maak, J., Meckel, E.-M., Nomikou, P., Röttgen, C., and Schefuß, E.: Discovery of a unique submarine hydrothermal system between shallow photic and deep dark sites around the Greek island of Milos (Aegean Sea, Greece), EGU General Assembly 2024, Vienna, Austria, 14–19 Apr 2024, EGU24-17022, https://doi.org/10.5194/egusphere-egu24-17022, 2024.

EGU24-19650 | Posters on site | GM9.7

Repeated multibeam surveys and direct observations for the characterization of fluid-related features off Scoglio d’Affrica islet (Northern Tyrrhenian Sea) 

Daniele Casalbore, Martina Pierdomenico, Daniele Spatola, Anna Saroni, Federica Maurantonio, Massimo Coltorti, Roberta Ivaldi, Maurizio Demarte, Denise Petronelli, and Francesco Chiocci

Scoglio d’Affrica islet lies in the southern part of the Elba-Pianosa Ridge, a north-south elongated morpho-structural between the Tuscany shelf and the Corsica Basin. A violent gas outburst occurred in 2017 offshore Scoglio d’Affrica islet, with the formation of columns of dirty water rising up to 10 m above the sea surface as reported by local fishermen. Since then, the collection of multibeam bathymetries coupled with seafloor observations realized through remotely operated vehicles and scuba dives showed the occurrence of widespread fluid-related morphological features, including mud volcanoes of variable size and morphology as well as hundreds of pockmarks. In this work, we present the preliminary results of this integrated analysis, providing insights on the small-scale morphological evolution of these features in the last 5 years linked to fluid seepage processes. This is a particularly relevant issue considering the few studies on shallow-water mud volcanoes as well as the potential hazard associated with these processes.

How to cite: Casalbore, D., Pierdomenico, M., Spatola, D., Saroni, A., Maurantonio, F., Coltorti, M., Ivaldi, R., Demarte, M., Petronelli, D., and Chiocci, F.: Repeated multibeam surveys and direct observations for the characterization of fluid-related features off Scoglio d’Affrica islet (Northern Tyrrhenian Sea), EGU General Assembly 2024, Vienna, Austria, 14–19 Apr 2024, EGU24-19650, https://doi.org/10.5194/egusphere-egu24-19650, 2024.

Fluid expulsion and sediment mobilization are typical processes in accretionary prisms, where sediments are scraped off the subducting plate and piled up and squeezed to originate a tectonic prism, resulting in fluid venting, mud volcanoes and mud diapirs. The Mediterranean region is characterized by subduction zones where residual portions of the Tethyan oceans have survived the Aftica-Eurasia continental collision. Among these subduction zones, the Calabrian accretionary prism is known to be populated by mud volcanoes. The Ionian offshore of the Crotone promontory offers examples where the expressions of fluid expulsion and sediment mobilization are visible both in the subsurface and at the seafloor. The analysis of a proprietary 3D seismic cube allows to characterize patterns of pockmarks, which are direct expression of fluid expulsion at the seafloor, and to identify a mud diapir which appears at the seafloor as a large mud pool, ca. 1200 m in diameter. The high resolution 3D seismic profiles also allow to infer differences in the  mechanisms of fluid focussing at very shallow depth. Small, closely spaced normal faults, produced by outer arc extension, and dilation in the shallow unconsolidated sediments, due to sharp slope gradient increase, both favour fluid focussing. In some instances it can be shown that fluid venting also contributed to destabilize the uppermost sedimentary strata, triggering small landslides along the slope. A Pliocene extensional system has  developed within a mobile shale domain. The diapir that surfaces as a mud pool has been mobilized along a recent extensional fault, which tapped into the mobile shale domain. Furthermore, a fossil mud pool has also been recognized in the study area. This fossil mud pool is sealed by undeformed sedimentary strata which allow to constrain a minimum age for fluid and sediment mobilization in the accretionary prism. Seismic reflections amplitude suggests that the fossil conduit still acts as a preferential fluid seepage pathway, contributing to destibilize the overlaying slope sediments.

How to cite: Argnani, A. and Rovere, M.: Submarine Morphology Offshore Crotone (Calabrian Accretionary Prism, Central Mediterranean): Pockmark Fields and a Mud Diapir in a Mobile Shale Domain, EGU General Assembly 2024, Vienna, Austria, 14–19 Apr 2024, EGU24-21390, https://doi.org/10.5194/egusphere-egu24-21390, 2024.

EGU24-110 | Orals | AS1.31

Observed structure of an internal tide beam over the Mid-Atlantic Ridge 

Clément Vic and Bruno Ferron

Internal tides are key players in ocean dynamics above mid-ocean ridges. The generation and propagation of internal tides over the Mid-Atlantic Ridge (MAR) have been studied through theoretical and numerical models, as well as through moored, that is, one-dimensional, observations. Yet, observations remain sparse and often restricted to the vertical direction. Here we report on the first two-dimensional in situ observation of an internal tide beam sampled by a shipboard acoustic Doppler current profiler through a vertical section over the MAR. The beam is generated by the interaction of the barotropic tidal current with a supercritical abyssal hill that sits in the rift valley of the MAR. A vertical mode decomposition is carried out to characterize the spatio-temporal variability of the beam. Although the modal content of the velocity field is dominated by modes 1 to 3, higher modes display localized and not persistent bursts of energy. The use of an analytical theory for linear internal waves allows us to rationalize the observed velocity field and interpret it as the superposition of modal waves generated on the hill and propagating in the same direction. The observed beam is qualitatively reconstructed as the superposition of waves of modes 2 to 6. The velocity field was sampled seven times across the same section and displayed qualitatively different patterns, unveiling the complexity of the dynamics above the MAR. A ray tracing of modal waves shows that the refraction by mesoscale currents could explain the observed variability of the tidal beam.

How to cite: Vic, C. and Ferron, B.: Observed structure of an internal tide beam over the Mid-Atlantic Ridge, EGU General Assembly 2024, Vienna, Austria, 14–19 Apr 2024, EGU24-110, https://doi.org/10.5194/egusphere-egu24-110, 2024.

EGU24-687 | ECS | Posters on site | AS1.31

3D modelling of internal tide generation 

Cécile Le Dizes, Matthieu Mercier, Nicolas Grisouard, and Olivier Thual

Internal tides, generated by the interaction of tidal flows with underwater topographies, play a pivotal role in ocean dynamics. They significantly contribute to energy transport in the oceans and can lead to deep-ocean mixing, influencing large-scale ocean circulation and ecosystems through nutrient transport. Their accurate representation in large-scale numerical models is essential to improve our understanding of oceanic processes and assess their impact on climate scenarios. However, implementing internal tide generation is challenging due to the variety of spatial and temporal scales involved. It cannot be tackled by estimations from observations and/or numerically expensive regional models alone. In this context, analytical methods offer insights to accurately describe the internal tide wavefield, enabling more precise parameterizations in global ocean models. Existing analytical approaches are based on specific (limiting) assumptions, often considering two-dimensional situations or weak amplitude topographies.

Here, we present a boundary element method to compute the internal tide radiated for a prescribed barotropic tidal flow over any arbitrary localized three-dimensional topography. This method, based on a Green's functions approach, assumes linear Boussinesq generation for harmonic tidal forcing (hence with a weak-amplitude excursion) and uses vertical mode decomposition to express the wave velocity field and the energy flux of the internal waves radiated in all directions. The properties of the internal tide generated by an axisymmetric Gaussian topography for constant stratification are discussed in detail. Results for the sub-critical regime (internal wave slopes larger than the topography) are consistent with the Weak Topography Approximation in the limit of small seamounts and when the influence of the Coriolis frequency is negligible. A specific discussion is made regarding the influence of the Coriolis frequency on the direction of emission for the internal tide radiated by axisymmetric seamounts. An important result is that the direction where the internal tide flux is maximum is controlled by the relative importance of the Coriolis frequency with respect to the tidal frequency, the orientation of the tidal flow, and the geometrical properties of the topography. Interestingly, for topographies elongated in one specific direction, the role of the Coriolis effect becomes negligible; the orientation of the tidal forcing and the one associated with the topography alone control the angular dependency of the energy flux radiated.

Our work is a first approach to realistic analytical modeling of internal tide generation. It emphasizes the importance of considering the 3D effects for this problem.

How to cite: Le Dizes, C., Mercier, M., Grisouard, N., and Thual, O.: 3D modelling of internal tide generation, EGU General Assembly 2024, Vienna, Austria, 14–19 Apr 2024, EGU24-687, https://doi.org/10.5194/egusphere-egu24-687, 2024.

EGU24-1666 | ECS | Posters on site | AS1.31

Internal wave topography interactions in the presence of a steady surface current 

Saranraj Gururaj and Anirban Guha

Wave--topography interaction is one of the primary mechanisms through which internal wave energy cascades to small length scales in the oceans. At small length scales, internal waves become unstable and break down, leading to turbulent diffusion and mixing. Precise diffusivity parametrisations are crucial for modeling ocean flows accurately. We study the interactions of a mode-1 internal wave with an isolated topography in the presence of a steady, stable surface current. For various amplitudes of the surface current, we investigate scattering caused by Gaussian shaped topographies by independently varying height and slope. In the presence of a surface current, a mode-1 wave that propagates in the direction of the current (denoted by M1W) has different properties compared to a mode-1 wave that propagates against the current (denoted by M1C), and we focus on both M1W and M1C. For all the heights considered, for both M1W and M1C, the current does not have a singular effect: it can reduce or increase scattering depending on the slope of the topography. Scattering due to large amplitude topographies (even with a small slope) can be quite different in the presence of a surface current. However, scattering caused by small amplitude topographies does not change significantly even in the presence of strong surface currents. Topographies with very high slopes (commonly known as supercritical topographies) scatter M1C more compared to M1W. Finally, we provide a brief analysis of the generation of superharmonic waves due to wave--topography interactions that occur in the presence of a surface current.

How to cite: Gururaj, S. and Guha, A.: Internal wave topography interactions in the presence of a steady surface current, EGU General Assembly 2024, Vienna, Austria, 14–19 Apr 2024, EGU24-1666, https://doi.org/10.5194/egusphere-egu24-1666, 2024.

EGU24-1700 | ECS | Posters on site | AS1.31

Generation and paths of internal waves on a tropical continental shelf 

Arian Dialectaquiz, Marcelo Dottori, and Piero Mazzini

Through wavelet analysis of temperature and current data, and remote imaging via Synthetic Aperture Radar and True Color, internal waves were identified in the South Brazil Bight (SBB). These waves have predominant semi-diurnal tidal frequencies as well frequencies associated with cold fronts.

Through baroclinic energy flows and coarse graining kinetic energy budget calculated from results of the Regional Ocean Modeling System (ROMS), the energy cascade associated with this internal phenomenon was quantified, as well the contribution of topography in the generation of internal waves due to the instability of the internal tide.

The internal energy paths on the shelf were discretized with the correlation of sub - and supratidal energy flows with the Barotropic - Baroclinic conversion, thus identifying energy conversion hotspots by topography, and the spatial variability in the generation and propagation of internal waves.

The results indicate that while a supercritical regime of baroclinic tide generation prevails in the SBB, from the barotropic tide, with propagation towards the open sea, some regions on the continental shelf are close to a critical regime. In these areas, the lateral distance for the internal tide excursion is less than 5 km, which promotes shearing, local instability dissipation, and the generation of nonlinear internal waves. Simultaneously, in regions with a supercritical regime, subtidal frequency phenomena act as a force for internal waves towards the coast.

How to cite: Dialectaquiz, A., Dottori, M., and Mazzini, P.: Generation and paths of internal waves on a tropical continental shelf, EGU General Assembly 2024, Vienna, Austria, 14–19 Apr 2024, EGU24-1700, https://doi.org/10.5194/egusphere-egu24-1700, 2024.

This talk will present our recent published study of Li et al. (2023, QJ). With the development of advanced data assimilation and computing techniques, many modern global reanalysis datasets aim to resolve the atmospheric mesoscale spectrum. However, large uncertainties remain with respect to the representation of mesoscale motions in these reanalysis datasets, for which a clear understanding is lacking. The aforementioned challenges have served as a strong motivation to reveal and quantify their mesoscale differences. This study presents the first comprehensive global intercomparison of the tropospheric and stratospheric mesoscale kinetic energy and its spectra over two selected periods of summer and winter events among six leading high-resolution atmospheric reanalysis products: European Centre for Medium-Range Weather Forecasts (ECMWF) Reanalysis v5 (ERA5), China Meteorological Administration Reanalysis (CRA), Modern-Era Retrospective Analysis for Research and Applications version 2 (MERRA2), National Centers for Environmental Prediction's Climate Forecast System version 2 (CFSv2), Japanese 55-year Reanalysis (JRA-55), and ECMWF Reanalysis-Interim (ERA-I). A state-of-the-art global operational model is adopted as a supplementary reference. Although all reanalysis datasets can reproduce broad distribution characteristics that are grossly consistent with the 9 km model, there are substantial discrepancies among them in magnitudes. The ability to capture mesoscale signals is closely linked to their resolutions, but it is also impacted by other factors, including, but not limited to, the selected types of energy, seasons, altitudes, latitudes, model diffusions, parametrization schemes, moist condition, assimilation methods, and observation inputs. Moreover, all datasets illustrate conclusive behaviors for the prevalence of the rotational component in the troposphere, whereas only very few products fail to exhibit the dominance of the divergent component in the stratosphere. Overall, stratospheric ERA5 and CFSv2 outperform the other reanalysis datasets, and only these two can reproduce the feature of the canonical kinetic energy spectrum with a distinct shift from a steeper slope (approximately −3) at lower wave numbers to a shallower slope (approximately −5/3) at higher wave numbers. In addition, the relative disparities among datasets increase dramatically with height, and they are more pronounced in the divergent component. It is also found that the correlations among these datasets are much weaker in the Tropics.

Reference:

Li, Z., J. Wei, X. Bao, and Y. Q. Sun, 2023: Intercomparison of tropospheric and stratospheric mesoscale kinetic energy resolved by the high-resolution global reanalysis datasets. Quarterly Journal of the Royal Meteorological Society, 149(757), 3738–3764, https://doi.org/10.1002/qj.4605.

How to cite: Li, Z., Wei, J., Bao, X., and Sun, Y. Q.: Intercomparison of Tropospheric and Stratospheric Mesoscale Kinetic Energy Resolved by the High-Resolution Global Reanalysis Datasets, EGU General Assembly 2024, Vienna, Austria, 14–19 Apr 2024, EGU24-1826, https://doi.org/10.5194/egusphere-egu24-1826, 2024.

EGU24-2227 | ECS | Posters on site | AS1.31

Observations of near-inertial internal wave amplification and enhanced mixing after surface reflection 

Kun Liu, Xu Chen, Peng Zhan, and Hui Wang

The overreflection process of near-inertial internal waves (NIWs) has been theoretically predicted for several decades; however, to the best of our knowledge, this phenomenon has never been comprehensively investigated in real ocean scenarios. Based on the buoy observations collected several days after the passage of Typhoon Lekima in the Yellow Sea, a NIW surface overreflection event is clearly captured. The observed NIWs undergo nearly total reflection meridionally but are amplified zonally after reflection by approximately 20% in amplitude and 56% in vertically integrated horizontal kinetic energy. Ray tracing analysis indicates that the NIW was generated in the wake of Typhoon Lekima in the area north of the Shandong Peninsula and may propagated to the buoy station as coastal-trapped internal Kelvin waves. A simulation using a slab mixed layer model suggests that local wind work was insufficient to generate the amplified NIWs. The temporal evolution of near-inertial energy also implies that the intensified near-inertial waves cannot be attributed to the spontaneous generation resulting from unbalanced flows or the parametric subharmonic instability of M2 internal tides during the reflection period. We found a high temporal correlation between the zonal NIW enhancement and the duration of a meridional lens-type shear flow after reflection, which is consistent with the Stern’s overreflection theory (Stern, 1977) that perpendicular background shear flow can feed energy to the incident NIWs. This indicates that the enhanced NIW may be stimulated by the near-surface reflection and the rotation effect plays a crucial role in the NIWs overreflection process in the real ocean. Furthermore, enhanced instability are found between the ocean surface and the upper thermocline after reflection. This study provides observational evidence that the background field could inject energy into the near-inertial band through NIW overreflection process, and may shed some light on understanding upper ocean mixing caused by NIW reflection.

How to cite: Liu, K., Chen, X., Zhan, P., and Wang, H.: Observations of near-inertial internal wave amplification and enhanced mixing after surface reflection, EGU General Assembly 2024, Vienna, Austria, 14–19 Apr 2024, EGU24-2227, https://doi.org/10.5194/egusphere-egu24-2227, 2024.

EGU24-2472 | Orals | AS1.31

Comparison between non orographic gravity wave drag parameterizations used in QBOi models and Strateole2 constant level balloons                  

Raj Rani, François Lott, Charles McLandress, Aurélien Podglagen, Andrew Bushell, Martina Bramberger, Hyun-Kyu Lee, M. Joan Alexander, James Anstey, Hye-Yeong Chun, Albert Hertzog, Bernard Legras, Elisa Manzini, Scott Osprey, Riwal Plougonven, John Scinocca, Javier Serrano, Federico Serva, Tim Stockdale, and Stefan Versick and the Strateole 2 and QBOi contributors

Gravity Waves (GWs) parameterizations from 14 General Circulation Models (GCMs) participating to the Quasi-Biennial Oscillation initiative (QBOi) are directly compared to Strateole-2 balloon observations made in the lower tropical stratosphere from November 2019 to February 2020 (phase 1) and from October 2021 and January 2022 (phase 2). The parameterizations span the 3 leading edge techniques used in GCMs to represent subgrid scale non-orographic GWs, the two globally spectral techniques developed by Hines (1997) and Warner and McIntyre (1999) respectively and the "multiwaves" approaches following Lindzen (1981). The input meteorological fields necessary to run the parameterizations offline are extracted from the ERA5 reanalysis and correspond to the instantaneous meteorological conditions found underneath the balloons.  In general, the amplitudes are in fair agreement between measurements of the momentum fluxes due to waves with periods less than 1 hr and the parameterizations. The correlation of the daily values between the observations and the results of the parameterization can be around 0.4, which is statistically significant elevated considering that we analyse around 1200 days of data and quite good considering that the parameterizations have not been tuned: the schemes used are just the standard ones that help producing a Quasi-Biennial Oscillation (QBO) in the corresponding model. These correlations nevertheless vary considerably between schemes and depend little on their formulation (globally spectral versus multiwaves for instance). We therefore attribute this agreement to dynamical filtering, which all schemes take good care of, whereas only a few relate gravity waves to their sources. Except for one parameterization, significant correlations are mostly found for eastward propagating waves, which may be due to the fact that during both Strateole 2 phases the QBO phase is easterly at the altitude of the balloon flights. On the other hand, statistical properties, like pdf of momentum fluxes seem better represented in spectral schemes with constant sources than in schemes ("spectral" or "multiwaves") that relate GWs to their convective sources.

How to cite: Rani, R., Lott, F., McLandress, C., Podglagen, A., Bushell, A., Bramberger, M., Lee, H.-K., Alexander, M. J., Anstey, J., Chun, H.-Y., Hertzog, A., Legras, B., Manzini, E., Osprey, S., Plougonven, R., Scinocca, J., Serrano, J., Serva, F., Stockdale, T., and Versick, S. and the Strateole 2 and QBOi contributors: Comparison between non orographic gravity wave drag parameterizations used in QBOi models and Strateole2 constant level balloons                 , EGU General Assembly 2024, Vienna, Austria, 14–19 Apr 2024, EGU24-2472, https://doi.org/10.5194/egusphere-egu24-2472, 2024.

EGU24-3251 | ECS | Posters on site | AS1.31

A constrained spectral approximation of subgrid-scale orography on unstructured grids 

Ray Chew, Stamen Dolaptchiev, Maja-Sophie Wedel, and Ulrich Achatz

The representation of subgrid-scale orography is a challenge in the physical parameterisation of orographic gravity-wave sources in weather forecasting. A significant hurdle is encoding as much physical information with as simple a spectral representation as possible on unstructured geodesic grids with non-quadrilateral grid cells, such as the one used in the German Weather Service's Icosahedral Nonhydrostatic Model. Other issues include scale awareness, i.e., the orographic representation has to change according to the grid cell size. This work introduces a novel spectral analysis method approximating a scale-aware spectrum of subgrid-scale orography on unstructured geodesic grids. The dimension of the physical orographic data is reduced by more than two orders of magnitude in its spectral representation. Simultaneously, the power of the approximated spectrum is close to the physical value. The method is based on well-known least-squares spectral analyses. However, it is robust to the choice of the free parameters, and tuning the algorithm is generally unnecessary. Numerical experiments involving an idealised setup show that this novel spectral analysis performs significantly better than a straightforward least-squares spectral analysis in representing the physical energy of a spectrum. Studies involving real-world topographic data are conducted, and competitive error scores within 10% error relative to the maximum physical quantity of interest were achieved across different grid sizes and background wind speeds. The deterministic behaviour of the method is investigated along with its principal capabilities and potential biases, and it is shown that the error scores can be iteratively improved if an optimisation target is known.

How to cite: Chew, R., Dolaptchiev, S., Wedel, M.-S., and Achatz, U.: A constrained spectral approximation of subgrid-scale orography on unstructured grids, EGU General Assembly 2024, Vienna, Austria, 14–19 Apr 2024, EGU24-3251, https://doi.org/10.5194/egusphere-egu24-3251, 2024.

EGU24-3904 | Posters on site | AS1.31

Generation of secondary gravity waves in idealized UA-ICON simulations 

Christoph Zülicke, Mozhgan Amiramjadi, and Sebastian Borchert

Gravity waves are an important driver of the circulation in the mesosphere / lower thermosphere and connect it to the atmospheric layers below. This vertical coupling is realized in multiple steps – primary waves rise, break and initiate secondary waves, which further rise. We study this process for stationary mountain waves in idealized simulations with the upper-atmosphere extension of the ICON model. The setup is for constant wind and stratification up to 120 km, where a sponge layer begins. In a series of simulations with various winds and mountain sizes, we follow the evolution of mountain waves including their breaking. Particular focus is on the diagnosis of wave-mean flow interaction and the associated generation of secondary gravity waves. In the vertical wavenumber spectra we find three peaks of them, all associated with lower frequency and longer horizontal wavelengths than the primary mountain wave. The parameters of primary and secondary waves are closely correlated, which adds to the understanding of multi-step vertical coupling.

How to cite: Zülicke, C., Amiramjadi, M., and Borchert, S.: Generation of secondary gravity waves in idealized UA-ICON simulations, EGU General Assembly 2024, Vienna, Austria, 14–19 Apr 2024, EGU24-3904, https://doi.org/10.5194/egusphere-egu24-3904, 2024.

The quasi-biennial oscillation (QBO) is the dominant mode of atmospheric variability in the tropical stratosphere. It has effects on the weather and climate in the tropics and the extratropics. The QBO is a wave-driven circulation pattern of alternating easterly and westerly winds that propagate downward with time. Climate models have problems in simulating a realistic QBO because of problems in simulating the QBO wave driving in a realistic way. Both mesoscale gravity waves and global-scale tropical waves contribute to the wave driving of the QBO, but the relative contribution of the different wave types is not well known.
For the period 2018 until mid 2023 we estimate the QBO driving by gravity waves from the residual in the TEM momentum budget for three modern reanalyses (ERA5, MERRA2, and JRA55) and compare absolute values of the QBO gravity wave driving with estimates derived from temperature observations of the SABER satellite instrument. Qualitatively, good agreement is found, but MERRA2 gravity wave driving seems to be too strong in the upper stratosphere. Further, we derive the QBO eastward driving by global-scale Kelvin waves for the reanalyses and from SABER observations. The QBO eastward driving by Kelvin waves is similarly strong as the gravity wave eastward driving, and again good agreement is found between SABER and the reanalyses. In the reanalyses below 30km the total westward driving of the QBO by global-scale waves, however, seems to be weaker than the estimated gravity wave driving.

How to cite: Ern, M.: Driving of the QBO by gravity waves and global-scale waves: a comparison between satellite data and reanalyses, EGU General Assembly 2024, Vienna, Austria, 14–19 Apr 2024, EGU24-3929, https://doi.org/10.5194/egusphere-egu24-3929, 2024.

EGU24-5181 | ECS | Posters on site | AS1.31

Comparison between the gravity wave stress parameterized in a climate model and simulated by the high-resolution non-hydrostatic global model ICON 

Iman Toghraei, François Lott, Laura Köhler, Claudia Stephan, and Joan Alexander

We compare the parameterization schemes that represent gravity waves in the Atmospheric Component of the IPSL Climate Model (LMDZ6A) and the high-resolution ICOsahedral Nonhydrostatic Weather and Climate Model (ICON). Our focus lies in assessing the capabilities of the gravity wave drag schemes to predict zonal momentum fluxes derived from ICON. The parameterization is run offline using ICON meteorological fields coarse grained to a healpix grid with size representative of an ESM grid (around 100km x 100km). We then examine the temporal mean, horizontal mean, and zonal mean gravity wave stresses predicted by the parameterizations and compare them to the zonal momentum fluxes associated with the ICON subgrid scale fields (e.g. the motions that are filtered out during the coarse-graining). The investigation reveals that in the stratosphere, the parameterizations have some skill at predicting zonal momentum fluxes of ICON, and this without prior tuning. More specifically, the parameterized gravity wave stresses due to mountains, convection and fronts align reasonably well with the zonal momentum fluxes from ICON in the stratosphere, each scheme consistently playing a dominant role where it should (frontal waves dominating in the midlatitude storm tracks, convective waves in the tropics, and mountain waves over orography). This permits physical interpretations of the origin of the gravity waves predicted by ICON, but raises challenges when extending this comparison to the troposphere. There, the agreement between the parameterized stress and the ICON subgrid scale stress is much weaker, which is likely attributable to the fact that in the troposphere subgrid scale forced motions like convective cells produce stresses much larger than the gravity wave stresses.

How to cite: Toghraei, I., Lott, F., Köhler, L., Stephan, C., and Alexander, J.: Comparison between the gravity wave stress parameterized in a climate model and simulated by the high-resolution non-hydrostatic global model ICON, EGU General Assembly 2024, Vienna, Austria, 14–19 Apr 2024, EGU24-5181, https://doi.org/10.5194/egusphere-egu24-5181, 2024.

EGU24-7411 | ECS | Posters on site | AS1.31

Impact of small-scale gravity waves on tracer transport 

Irmgard Knop, Stamen Dolaptchiev, and Ulrich Achatz

The zonal-mean transport of tracers on a large scale, such as ozone and water vapor, is predominantly governed by the Brewer-Dobson circulation. However, this transport undergoes modifications influenced by small-scale gravity waves (GW) and turbulence resulting from GW breaking. As these dynamics are not completely resolved in weather and climate models, they necessitate parameterization. Given the significant impact of tracers on the Earth's energy budget and surface climate, understanding their transport variations is crucial for accurate atmospheric modeling. Presently, existing GW parameterization schemes neither account for the direct effects of GW tracer transport nor the enhanced tracer mixing due to GW breaking, but only for the indirect effect by driving the mean meridional circulation. Therefore, it becomes imperative to ascertain how and to what extent these small-scale phenomena modify the large-scale transport of tracers. To address this, we employ wave-resolving simulations, specifically investigating the impact of a three-dimensional wavepacket on tracer distribution using a pseudo-incompressible flow solver. Additionally, we extend a GW parameterization scheme, a Lagrangian ray tracer, to incorporate GW-induced tracer transport. Our research demonstrates the non-negligible direct impact of GW on tracer transport. Furthermore, we possibly discuss the influence of turbulent diffusive mixing on tracers. Our aim is to provide a comprehensive understanding of the intricate processes shaping large-scale tracer transport in the atmosphere.

How to cite: Knop, I., Dolaptchiev, S., and Achatz, U.: Impact of small-scale gravity waves on tracer transport, EGU General Assembly 2024, Vienna, Austria, 14–19 Apr 2024, EGU24-7411, https://doi.org/10.5194/egusphere-egu24-7411, 2024.

EGU24-7578 | ECS | Orals | AS1.31

Internal tide generation from linear theory: Supercritical slopes, directionality, and ocean mixing implications 

Friederike Pollmann, Jonas Nycander, Gaspard Geoffroy, Carsten Eden, and Dirk Olbers

The main forcing of the ocean’s internal gravity wave field is the interaction of the barotropic tide with the rough seafloor. This process is inherently anisotropic: the orientation of the topographic obstacles and the direction of the tidal currents determine the amount and direction of the generated internal wave of tidal frequency, the internal tide. Available global estimates of the internal tide generation, however, do not take this directionality into account. We present estimates of the global M2-tide generation into the first 10 vertical normal modes using a new method based on linear theory that resolves both magnitude and direction. Linear theory breaks down once the slope of the topographic obstacle exceeds that of the generated tidal beam. We discuss the role of such supercritical slopes at continental shelves and in the open ocean. Finally, we will use the anisotropic M2-tide generation as forcing of the internal wave model IDEMIX, the backbone of an energetically consistent parameterization of wave-induced turbulent mixing for ocean general circulation models. Both wave energy levels and turbulent kinetic energy dissipation differ substantially compared to the reference scenario with the previously used isotropic tidal forcing. This underlines the importance of resolving the directionality of the internal tide generation in parameterizations of wave-induced turbulent mixing.

How to cite: Pollmann, F., Nycander, J., Geoffroy, G., Eden, C., and Olbers, D.: Internal tide generation from linear theory: Supercritical slopes, directionality, and ocean mixing implications, EGU General Assembly 2024, Vienna, Austria, 14–19 Apr 2024, EGU24-7578, https://doi.org/10.5194/egusphere-egu24-7578, 2024.

EGU24-8235 | ECS | Orals | AS1.31

Observations of internal wave generation in Madeira island  

Jesus Reis, Juan Gomiz-Pascual, Álvaro Peliz, Rui Caldeira, and Miguel Bruno

There is a considerable number of coastal regions where the interaction of barotropic tidal currents with the stratified water column over seamounts or sill topographies generates large amplitude internal waves. An example of this is the internal bores generated around the main sill of the Strait of Gibraltar. It is known that the vertical mixing induced by these phenomena induces a relevant biological response in both the generation place and remote areas. The present work analyses the generation of this kind of internal waves in the northern half of the submarine ridge between Madeira and the Desertas Islands (Portugal). Here, the interaction of a rather intense barotropic tidal current with the stratified water column and the abrupt ridge topography leads to the creation of hydraulic jumps that evolve into internal bores and solitons, which radiate outwards from the sill. These bores can be formed at both sides of the sill (eastern and western sides) in synchrony with the barotropic flow direction. The hydraulic jump that gives rise to the internal waves is generated after supercritical conditions are established over the sill (internal Froude number, Fr >1). While supercritical conditions prevail, the internal bore stands trapped on the downstream side of the sill. With the weakening of the barotropic current, the supercritical conditions are lost (Fr <1), and the internal bore and subsequent solitons are released from the sill. Internal bores formed on the western side of the sill have greater amplitudes than those formed on the eastern side, and it seems to be related to the different orientations of the barotropic current concerning the longitudinal axis of the sill depending on the flow being eastward or westward. A smaller hydraulic jump is also formed during the eastward phase of the barotropic tidal current. This study is the first to document the internal wave activity in the SE of Madeira Island. It combines data from satellite images, in-situ campaigns, and moored instruments to allow the observation of the hydraulic conditions before, during, and after the generation events. Estimates of the vertical mixing using Richardson number and energy fluxes calculations helped identify internal wave events.

How to cite: Reis, J., Gomiz-Pascual, J., Peliz, Á., Caldeira, R., and Bruno, M.: Observations of internal wave generation in Madeira island , EGU General Assembly 2024, Vienna, Austria, 14–19 Apr 2024, EGU24-8235, https://doi.org/10.5194/egusphere-egu24-8235, 2024.

EGU24-8354 | ECS | Posters on site | AS1.31

Parameterized orographic gravity wave drag controls extratropical stratospheric dynamics in CMIP6 models. 

Petr Šácha and Dominika Hájková

Orographic gravity waves (OGWs) are an important mechanism for coupling of the free atmosphere with the surface, mediating the momentum and energy transport and influencing the dynamics and circulation especially in the stratosphere and above. Current global climate models are not able to resolve a large part of the OGW spectrum and hence, OGW effects have to be parameterized in the models. Typically, the only parameterized effect is the OGW induced drag. Despite producing the same quantity as an output and relying on similar assumptions (e.g. instantaneous vertical propagation), the individual OGW parameterization schemes differ in many aspects such as handling of the orography, the inclusion of non-linear effects near the surface and the tuning of the emergent free parameters.

This presentation introduces a recently published study by the authors, reviewing 7 different parameterizations used in 9 different CMIP6 models and reporting on pronounced intermodel differences in the vertical distribution and magnitude of the parameterized OGW drag that are partly tuning-dependent. Finally, we demonstrate how the OGW drag differences project to the intermodel differences in the stratospheric dynamics, documenting the crucial importance of the lower- stratospheric OGW drag that controls the resolved wave propagation from the troposphere to the stratosphere in both winter hemispheres.

How to cite: Šácha, P. and Hájková, D.: Parameterized orographic gravity wave drag controls extratropical stratospheric dynamics in CMIP6 models., EGU General Assembly 2024, Vienna, Austria, 14–19 Apr 2024, EGU24-8354, https://doi.org/10.5194/egusphere-egu24-8354, 2024.

EGU24-9667 | ECS | Posters on site | AS1.31

Validation of an orographic source in a Lagrangian gravity wave parameterization 

Felix Jochum, Ulrich Achatz, Ray Chew, and François Lott
Many operational gravity wave parameterizations rely on the single column and steady state approximations, thus neglecting horizontal propagation and transience. Recent studies indicate that these assumptions can lead to faulty predictions, motivating the development of more complex models. MS-GWaM, a Lagrangian gravity wave parameterization that has been in development for about a decade, is one such model that is based on a multi-scale WKB theory allowing for both transience and horizontal propagation. So far, it has been validated mainly for non-orographic gravity waves, however, a simple orographic source has already been implemented in a test version of the model, which is coupled to a pseudo-incompressible flow solver (PincFlow). The present study investigates that source in an idealized setting. For this purpose, the model is adjusted to PincFlow's recently implemented terrain-following coordinate system. In addition, the orographic source is supplemented with a blocked flow drag and a wave amplitude reduction that accounts for blocked layer formation. These are derived from background flow tendencies and gravity wave momentum fluxes in highly idealized, wave-resolving simulations. The model is then tested against the latter, using both the transient configuration and a newly implemented steady state mode. The comparison shows that allowing for transience results in a more accurate forcing of the resolved mean flow, especially when the orographic source is changing in time.

How to cite: Jochum, F., Achatz, U., Chew, R., and Lott, F.: Validation of an orographic source in a Lagrangian gravity wave parameterization, EGU General Assembly 2024, Vienna, Austria, 14–19 Apr 2024, EGU24-9667, https://doi.org/10.5194/egusphere-egu24-9667, 2024.

EGU24-9725 | Posters on site | AS1.31 | Highlight

High-resolution nested UA-ICON simulation compared to mesospheric observations of the NASA VortEx campaign at ALOMAR 

Markus Kunze, Tarique Siddiqui, Christoph Zülicke, Claudia Stolle, Claudia Stephan, Irina Strelnikova, Gerd Baumgarten, Robin Wing, Michael Gerding, and Sebastian Borchert

We carry out high-resolution nested simulations over Andøya (ALOMAR) with UA-ICON to compare and interpret observational data in the mesosphere collected during the NASA VortEx sounding rocket campaign in March 2023.

We apply UA-ICON with 250 levels and a model top at 150 km at a global horizontal resolution of R2B7 (~20 km) with subsequent one-way nesting with nests at R2B8 (~10 km), R2B9 (~5 km), R2B10 (~2.5 km) and R2B11 (~1.25 km) horizontal resolution. For the global domain, the dynamic situation during the campaign is specified (specified dynamics, SD) by nudging to ECMWF operational analyses up to an altitude of 50 km. At the 1.25 km resolution, UA-ICON resolves a substantial fraction of the GW spectrum. Therefore, GW parameterizations are turned off at this resolution to isolate the effects of resolved GWs.

The Rayleigh-Mie-Raman (RMR) lidars, operated by IAP in Kühlungsborn, Germany, and at ALOMAR on Andøya, Norway, support the VortEx campaign through observations of temperatures and winds up to about 80 km by providing detailed information about GW activity including vertical wavelengths.

We present first comparison results between the high-resolution nested UA-ICON simulation and the RMR observations for the VortEx campaign in March 2023.

The emphasis is on estimating the vertical energy spectra of resolved gravity waves for the different grid refinements, compared to vertical energy spectra from the lidar observations.

How to cite: Kunze, M., Siddiqui, T., Zülicke, C., Stolle, C., Stephan, C., Strelnikova, I., Baumgarten, G., Wing, R., Gerding, M., and Borchert, S.: High-resolution nested UA-ICON simulation compared to mesospheric observations of the NASA VortEx campaign at ALOMAR, EGU General Assembly 2024, Vienna, Austria, 14–19 Apr 2024, EGU24-9725, https://doi.org/10.5194/egusphere-egu24-9725, 2024.

EGU24-10077 | Posters on site | AS1.31

Parameterized internal wave mixing in three ocean general circulation models 

Nils Brüggemann, Martin Losch, Patrick Scholz, Friederike Pollmann, Sergey Danilov, Oliver Gutjahr, Johann Jungclaus, Nikolay Koldunov, Peter Korn, Dirk Olbers, and Carsten Eden

We evaluate the parameterization IDEMIX for vertical mixing by breaking internal gravity waves in three different non-eddy resolving ocean models, namely ICON-O, FESOM and MITgcm. 
To assess the impact of the new closure, we prescribe three different products for wave forcing by tidal flow over topography that encompass the current uncertainty of this process. 
We compare these sensitivity simulations with a reference simulation without IDEMIX of each model and analyze the model-independent effects on the ocean circulation and mixing.
In particular, we observe a stronger mixing work once IDEMIX is used which better agrees with observations.
Coherent model responses to the stronger mixing work from IDEMIX are a deepening of thermocline depth, a warming of the upper-ocean thermocline water masses and an increased strength of the upper Atlantic overturning cell.

How to cite: Brüggemann, N., Losch, M., Scholz, P., Pollmann, F., Danilov, S., Gutjahr, O., Jungclaus, J., Koldunov, N., Korn, P., Olbers, D., and Eden, C.: Parameterized internal wave mixing in three ocean general circulation models, EGU General Assembly 2024, Vienna, Austria, 14–19 Apr 2024, EGU24-10077, https://doi.org/10.5194/egusphere-egu24-10077, 2024.

EGU24-11094 | ECS | Posters on site | AS1.31

Interaction of cirrus clouds and gravity waves: towards a coupled representation in coarse resolution model 

Alena Kosareva, Stamen Dolaptchiev, Ulrich Achatz, and Peter Spichtinger

Cirrus clouds have a notable influence on radiation and, consequently, the energy balance. Therefore detailed understanding of ice physics processes is one of the keys to improving climate representation. Major drivers of the physical processes in ice clouds such as nucleation, freezing, sedimentation etc. are mostly triggered by local dynamical causes. The variability in vertical velocity, along with temperature and pressure fluctuations induced by gravity waves (GW), significantly impacts the formation and life cycle of cirrus clouds. However, conventional climate models and Numerical Weather Prediction (NWP) systems typically limit ice formation mechanisms to turbulent forcing.

This study is focused on the interaction between ice clouds and gravity waves, aiming to enhance the representation of these processes within coarse-grid model. Building upon a double-moment scheme for ice particles, a prototype parameterisation for the nucleation process induced by gravity waves was previously proposed in [1] and has been implemented in the ICON model for numerical verification and assessment. The current approach is targeting a comprehensive coupled description of ice physics and gravity wave interaction.

Information on subgrid-scale dynamical fields impacting cirrus formation is retrieved from Multi-Scale Gravity Wave Model (MS-GWaM) [2-5]. This gravity-wave parameterisation relies on WKB-theory and employs a raytracing-based technique. It allows for the consideration of transient wave dynamics and horizontal wave propagation. The chosen approach for joined description seeks to refine the physical representation of cirrus formation associated with both convectively generated gravity waves and gravity waves generated by sources other than orography and convection.

Preliminary results, incorporating an artificial periodic forcing term, demonstrate a good agreement of ice physics parameterisation with results from an explicitly integrated double-moment scheme, where processes such as nucleation are resolved in time. Ongoing efforts involve further coupling with the MS-GWaM parameterisation, with the goal of achieving a more physically accurate representation of ice formation zones. Additionally, an analysis of time-averaged characteristic quantities is planned for a comprehensive understanding of the system.

References

[1] S. I. Dolaptchiev, P. Spichtinger, M. Baumgartner, and U. Achatz. Interactions between gravity waves and cirrus clouds: Asymptotic modeling of wave-induced ice nucleation. Journal of the Atmospheric Sciences, 80(12):2861 – 2879, 2023.

[2] G. Bölöni, Y.-H. Kim, S. Borchert, and U. Achatz. Toward transient subgrid-scale gravity wave representation in atmospheric models. Part I: Propagation model including nondissipative wave–mean-flow interactions. Journal of the Atmospheric Sciences, 78(4):1317–1338, 2021.

[3] Y.-H. Kim, G. Bölöni, S. Borchert, H.-Y. Chun, and U. Achatz. Toward transient subgrid-scale gravity wave representation in atmospheric models. Part II: Wave intermittency simulated with convective sources. Journal of the Atmospheric Sciences, 78(4):1339–1357, 2021.

[4] U. Achatz, Y.-H. Kim, and G. S. Voelker. Multi-scale dynamics of the interaction between waves and mean flows: From nonlinear WKB theory to gravity-wave parameterizations in weather and climate models. Journal of Mathematical Physics, 64(11), 2023.

[5] Y.-H. Kim, G. S. Voelker, G. Bölöni, G. Zängl, and Ulrich Achatz. Crucial role of obliquely propagating gravity waves in the quasi-biennial oscillation dynamics. EGUsphere, 2023:1–18, 2023.

How to cite: Kosareva, A., Dolaptchiev, S., Achatz, U., and Spichtinger, P.: Interaction of cirrus clouds and gravity waves: towards a coupled representation in coarse resolution model, EGU General Assembly 2024, Vienna, Austria, 14–19 Apr 2024, EGU24-11094, https://doi.org/10.5194/egusphere-egu24-11094, 2024.

EGU24-12622 | ECS | Orals | AS1.31

The Role of Inertia-Gravity Waves in the Mesoscale Energy Transfers from Global Storm-Resolving Simulations 

Yanmichel A. Morfa Avalos and Claudia C. Stephan

This study investigates the spectral energy budget of the atmosphere using storm-resolving simulations from two state-of-the-art global circulation models. We examine different hypotheses to explain the mesoscale κ-5/3 spectrum of horizontal kinetic energy (HKE). These hypotheses include the direct forcing due to inertia-gravity waves (IGWs), a downscale cascade mediated by weakly interacting IGWs, or interactions between waves and the mean flow. The resolved mesoscale energy fluxes within the upper troposphere and the lower stratosphere reveal different dynamics between the two layers. The lower stratosphere is mainly energized by direct forcing due to vertically propagating IGWs, with a negligible HKE cascade. The primary contribution to the mesoscale energy spectrum in the troposphere is from spectral transfers across scales, while the direct forcing due to IGWs is limited. However, the normal mode decomposition of the circulation into linear Rossby waves and IGWs suggests that their interactions dominate the downscale cascade at mesoscales. This result aligns with the hypotheses that explain the downscale cascade based on resonant triad interactions between vortical and gravity-wave modes. Furthermore, it is shown that wave-wave interactions do not contribute to the resolved energy transfers, challenging the hypothesis that the downscale cascade is due to weakly nonlinearly interacting IGWs.

How to cite: Morfa Avalos, Y. A. and Stephan, C. C.: The Role of Inertia-Gravity Waves in the Mesoscale Energy Transfers from Global Storm-Resolving Simulations, EGU General Assembly 2024, Vienna, Austria, 14–19 Apr 2024, EGU24-12622, https://doi.org/10.5194/egusphere-egu24-12622, 2024.

Internal waves propagate on the ocean stratification and carry energy and momentum through the ocean interior. The two most significant sources of these waves in the ocean are surface winds and oscillatory tidal flow across topography. We propose a hybrid of these two mechanisms, in which wind induced oscillations of sea surface and isopycnal heights are rapidly communicated to the seafloor via hydrostatic pressure. In the presence of topography, the resulting oscillatory bottom velocity may then generate internal waves in a similar manner to the barotropic tide. We investigate this mechanism in an idealised numerical isopycnal model of a storm passing over a mid ocean ridge, and perform several perturbation experiments in which ocean and wind properties are varied. Bottom-generated internal waves are identified propagating away from the ridge in the wake of the storm. Estimates of the total wave energy suggest that in the right circumstances these waves could be a significant source of internal wave energy, with a local wind work to wave energy conversion rate of up to 50% of the corresponding conversion to surface generated near-inertial waves in our domain. Our results suggest a need for further investigation in less idealised scenarios to more precisely quantity this novel mechanism of deep ocean wave generation, and how it may affect abyssal mixing. 

How to cite: Barnes, A.: Topographically-generated near-internal waves as a response to winds over the ocean surface, EGU General Assembly 2024, Vienna, Austria, 14–19 Apr 2024, EGU24-13389, https://doi.org/10.5194/egusphere-egu24-13389, 2024.

In this talk, we pursue the investigation of the relation between the large-scale flows and observed gravity wave momentum fluxes (GWMFs), starting from parameterizations and machine learning as two alternatives for predicting the gravity wave momentum fluxes in the lowermost tropical stratosphere. We investigate how much aggregation methods may allow to further improve on both alternatives, and what complementarity there may be between them. Observed gravity wave momentum fluxes are obtained from superpressure balloons during the Strateole 2 mission. The parameterizations come from the different climate models involved in the QBOi project, that have been compared to balloon measurements in Lott et al. (2023). The other predicted features are three tree-based ensemble machine learning algorithms, trained on part of the Strateole 2 dataset.  Three groups of aggregations are performed: aggregation among machine learning models, aggregation among parametrizations, and the aggregation between parametrizations and machine learning models. For the methodology, three aggregation methods are employed; two methods treat predictions from different models (parametrizations or machine learning) as features or information to be aggregated, while the remaining one uses both, inputs and predictions provided by those models.

The outcomes indicate that, despite struggling to estimate GWMFs individually, the collective information from various parametrizations proves valuable, particularly when combined with the large-scale flow variables. Additionally, the performance of the aggregation methods is sensitive to the choice of balloons. When the description of large-scale flows aligns well with the target GWMFs (balloon 2 and 8), all aggregation methods perform just as well as machine learning or the best-case scenario of parametrizations. Interestingly, there are also a few cases where machine learning and parametrizations perform poorly (correlation less than 0.2), yet their predictions, combined with large-scale information, can significantly elevate their performances more than 2 times (correlation larger than 0.5) in the aggregation methods (balloon 5). This suggests that existing parameterizations and machine learning approaches trained on observations have a complementarity that remains to be exploited. The present study was entirely offline, with no issue about the costs of computation. For practical applications, further investigation will be required to narrow down on the specific elements of parameterizations that are most informative.

How to cite: Has, S.: Aggregations of parametrizations and machine learning for gravity wave momentum flux reconstruction, EGU General Assembly 2024, Vienna, Austria, 14–19 Apr 2024, EGU24-17446, https://doi.org/10.5194/egusphere-egu24-17446, 2024.

EGU24-17716 | ECS | Posters on site | AS1.31

The diurnal cycle of gravity waves in GNSS-RO data 

Emily Lear, Corwin Wright, and Neil Hindley

Gravity wave sources such as convection are known to have a diurnal cycle, so it is expected that gravity waves should also follow a diurnal cycle. However, although this cycle can be simulated in models and observed in ground based data at fixed locations, it is difficult to observe in global satellite observations, due to their low time resolution, particularly since most gravity wave resolving instruments have sun-synchronous orbits and therefore always observe the same local solar time. In this study, GNSS radio occultation (GNSS-RO) data are used to investigate whether a diurnal cycle in gravity wave amplitudes can be seen in the stratosphere using these observations. Radio occultation uses GNSS signals received by a satellite that measures the bending angles and phase delay, due to these signals passing through the atmosphere. These measurements are randomly distributed in local solar time and have the high vertical resolution required to accurately resolve gravity waves. Specifically, in this work, GNSS-RO dry temperature data are used from multiple satellite missions, including COSMIC 1 and 2, Metop-A, -B and -C, and CHAMP. Wave amplitudes are found using the 1D S-Transform and the amplitudes are then binned in local solar time and averaged for each month, using all available data from the years 2001-2023. Consistent with theoretical observations, a diurnal cycle in gravity wave activity can be seen in the results and comparisons to convection data sets suggest this is strongly linked to convection. These results are also compared to wind data, which will affect the generation and filtering of the waves.

How to cite: Lear, E., Wright, C., and Hindley, N.: The diurnal cycle of gravity waves in GNSS-RO data, EGU General Assembly 2024, Vienna, Austria, 14–19 Apr 2024, EGU24-17716, https://doi.org/10.5194/egusphere-egu24-17716, 2024.

EGU24-18359 | ECS | Posters on site | AS1.31 | Highlight

MATS satellite mission - observing gravity waves in the MLT region with tomographic limb imaging 

Lukas Krasauskas, Jörg Gumbel, Linda Megner, Ole Martin Christensen, Nickolay Ivchenko, Björn Linder, and Donal Murtagh

MATS (Mesospheric airglow/Aerosol Tomography and Spectroscopy) is as Swedish satellite launched in November 2022. It observes O2 A-band airglow in near-infrared and UV light scattered from noctilucent clouds (NLCs) in limb imaging geometry and provides global 3-D temperature and NLC data products. These data sets can be used to characterise individual gravity waves (GWs) by determining their amplitudes, wavelengths and propagation directions (i.e. determining the 3-D wave vector for each wave). This enables determination of GW momentum fluxes in the MLT region, as well as detailed studies on GW spectra, propagation and interactions with the mean flow. MATS data, in combination with some GW modelling, can also be used to study GW sources and dissipation.

This presentation will provide an overview of the MATS mission and the 3-D data products with the focus on GW observations. We will include examples of data along with some initial GW analysis, instrument sensitivity estimates and data quality evaluation.

How to cite: Krasauskas, L., Gumbel, J., Megner, L., Christensen, O. M., Ivchenko, N., Linder, B., and Murtagh, D.: MATS satellite mission - observing gravity waves in the MLT region with tomographic limb imaging, EGU General Assembly 2024, Vienna, Austria, 14–19 Apr 2024, EGU24-18359, https://doi.org/10.5194/egusphere-egu24-18359, 2024.

EGU24-18795 | ECS | Orals | AS1.31

The effect of transient lateral internal gravity wave propagation on the resolved atmosphere in ICON/MS-GWaM 

Georg Sebastian Voelker, Young-Ha Kim, Gergely Bölöni, Günther Zängl, and Ulrich Achatz

Internal gravity waves are commonly parametrized in both weather and climate models to capture their important impacts on the large-scale resolved flow. To reduce the model complexity and increase the performance, these parametrizations typically neglect both the horizontal wave propagation, assuming a horizontally homogeneous local flow (columnar approximation), and the time dependence of the gravity wave dynamics (steady-state approximation). However, a number of studies have shown that these assumptions do not hold in general and might lead to systematic biases in the simulated atmosphere.

The recently introduced Multi-Scale Gravity Wave Model (MS-GWaM), implemented into the ICOsahedral Non-hydrostatic model (ICON), aims to relax the above-mentioned simplifications. In particular, the model simulates gravity waves with Lagrangian ray tracing methods while being coupled to the mean flow and allowing for a transient, three-dimensional propagation. In the current implementation, the model replaces the non-orographic wave drag parametrization.

We find that the 3-dimensional propagation and refraction of gravity waves and the correspondingly modified momentum/energy transport pathways have a significant impact on the middle atmosphere. For instance, the wave refraction around the Antarctic winter jet leads to the often observed convergence near the jet edges. Moreover, the horizontal propagation introduces wave drag at latitudes around 60°S and altitudes around 40 km – a region where it is typically missing in atmospheric models. The probability density functions of wave momentum fluxes exhibit the commonly observed long tails (i.e., wave intermittency) which cannot be reproduced with steady-state parameterizations. Additionally, the intermittent wave field's horizontal distribution displays significantly altered patterns. As an important consequence, the structure of the Quasi-biennial Oscillation (QBO) is significantly improved.

Recent efforts have focused on enhancing the model's efficiency, transforming it into a modular configuration, improving its general usability, and adapting it to work with the most recent version of ICON. By implementing these modifications, we aim to increase the accessibility of MS-GWaM to the community and thus establish a robust contribution to the ICON ecosystem.

How to cite: Voelker, G. S., Kim, Y.-H., Bölöni, G., Zängl, G., and Achatz, U.: The effect of transient lateral internal gravity wave propagation on the resolved atmosphere in ICON/MS-GWaM, EGU General Assembly 2024, Vienna, Austria, 14–19 Apr 2024, EGU24-18795, https://doi.org/10.5194/egusphere-egu24-18795, 2024.

EGU24-20640 | ECS | Posters on site | AS1.31

The Stratospheric Gravity Wave Field and Momentum Fluxes Produced by Isolated Supercells 

Luke Rosamond, David Nolan, Yi Dai, and Chris Heale

Alongside topographic forcing, deep moist convection makes a significant contribution to the global budget of upward momentum transport by gravity waves. Long-lived thunderstorms with rotating updrafts, known as supercells, produce strong and highly variable vertical motions over several hours. This study uses an idealized modeling framework in WRF to simulate supercells and their associated gravity waves up to 60 km altitude for multiple different wind profiles and convective modes. In contrast to many previous studies, the supercell is brought to an end and the simulations continue until most of the wave energy has dissipated. Thus, upward momentum transport can be computed over the entire life cycle of the storm and its associated waves, providing a more complete picture of the total impact of the event. The shapes of the wind profiles in the upper troposphere and lower stratosphere are found to strongly control the total momentum and energy transported into the upper stratosphere, so varying the stratospheric wind profile illuminates the behavior of the gravity waves in the stratosphere, particularly their vertical propagation. We also investigate the extent to which different modes of supercell structure, such as high-precipitation, low-precipitation, and classic supercells, lead to different intensities and spectra of the resulting gravity waves. In addition, the WRF model diabatic heating and vertical motions will be used as forcing conditions for stratospheric models such as MAGIC and CGCAM for the purposes of 1) comparison to WRF results between 20 and 60 km, and 2) so that wave propagation, momentum transport, wave breaking, and momentum deposition can be evaluated to altitudes above 80 km.

How to cite: Rosamond, L., Nolan, D., Dai, Y., and Heale, C.: The Stratospheric Gravity Wave Field and Momentum Fluxes Produced by Isolated Supercells, EGU General Assembly 2024, Vienna, Austria, 14–19 Apr 2024, EGU24-20640, https://doi.org/10.5194/egusphere-egu24-20640, 2024.

EGU24-20995 | Posters on site | AS1.31

Gravity Wave Lateral Propagation Prominence in the Extratropical Stratosphere 

Aman Gupta, Aditi Sheshadri, and M. Joan Alexander

Internal gravity waves (GWs) exhibit both vertical and horizontal (lateral) propagation in the atmosphere, influenced by the background shear of the flow that supports them. GW model parameterizations, however, represent them in climate models assuming strict vertical propagation. This modeling assumption can have implications for modeled large-scale stratospheric circulation and variability. We use ERA5 reanalysis to produce the climatological distribution of resolved GW momentum fluxes and forcing in the stratosphere, and their composite evolution around prominent modes of extratropical stratospheric variability like sudden stratospheric warmings (SSWs) and springtime final warmings (FWs). The climatology reveals that lateral propagation leads to the formation of a belt of rich GW activity in the upper winter stratosphere, which is otherwise localized over orographic hotspots in the lower stratosphere. The resolved forcing due to lateral GW propagation is found to be roughly the same order of magnitude as resolved forcing due to vertical fluxes, underlining the importance of lateral propagation for future GW parameterizations. Strikingly different GW forcing profiles before vs. after SSWs and FWs, highlighting the strong two-way connection between GWs and the stratospheric mean flow.

How to cite: Gupta, A., Sheshadri, A., and Alexander, M. J.: Gravity Wave Lateral Propagation Prominence in the Extratropical Stratosphere, EGU General Assembly 2024, Vienna, Austria, 14–19 Apr 2024, EGU24-20995, https://doi.org/10.5194/egusphere-egu24-20995, 2024.

EGU24-21740 | Orals | AS1.31

How realistic are resolved gravity waves in ERA5 reanalysis compared to satellite observations? 

Neil Hindley, M. Joan Alexander, Martina Bramberger, Manfred Ern, Lars Hoffmann, Laura Holt, Riwal Plougonven, Inna Polichtchouk, Claudia Stephan, Annelize van Niekerk, and Corwin Wright

Modern numerical modelling simulations of the Earth's atmosphere have developed over the recent decades to ever finer spatial resolutions, allowing for a greater portion the atmospheric gravity wave (GW) spectrum to be resolved. Specialised global simulations with kilometre-scale resolutions have been performed offline that can resolve very large portions of the GW spectrum in the lower stratosphere and, as such, the balance between resolved and parameterised (unresolved) GW forcing in today's numerical simulations of the middle atmosphere is shifting. However, these kilometre-scale simulations are still too computationally costly to perform routinely and can quickly deviate from their initial conditions, which makes validating the resolved gravity waves in these simulations with satellite observations challenging. For this reason, a growing number of studies are using resolved GWs in lower-resolution stratospheric reanalyses as proxies for GWs in the real atmosphere, due to the apparent reliability, long timescale, global coverage and real-date data assimilation of these reanalysis products. However, these resolved GWs in reanalyses have not been widely tested or compared to satellite observations of GWs to assess their realism. One reason why such a comparison has been so challenging is due to the different ranges of GW wavelengths to which any given model or observational instrument is sensitive due to its grid spacing or sampling and resolution limits, an effect known as the observational filter. Therefore, any like-for-like assessment of resolved GWs in reanalysis using satellite observations must be able to sample the model using the exact sampling and resolution of the instrument. Here we use 3-D satellite observations from AIRS/Aqua to evaluate the realism of resolved stratospheric gravity waves in ERA5 reanalysis produced by the European Centre for Medium Range Weather Forecasts (ECMWF). We carefully apply the sampling and resolution limits of AIRS to the model using a full 3-D weighting function for each measurement footprint to create synthetic measurements of the ERA5 stratosphere as if were viewed by AIRS. We then follow identical processing steps to detrend, regrid and spectrally analyse both the real and synthetic measurements to recover localised GW amplitudes, wavelengths and directional momentum fluxes between 25 and 45 km altitude. We investigate the global momentum budget of GWs in reanalysis compared to observations and compare the seasonality and spectral properties of GWs over known stratospheric hot spots. Our preliminary results suggest that AIRS measurements exhibit more frequent large-amplitude wave events at larger horizontal wavelengths (greater than 150km) and larger net momentum fluxes overall than equivalent ERA5 measurements. Our satellite-sampling approach is applicable to any GW-resolving model, and sets out a potential roadmap towards more direct validation and comparison of resolved mesoscale dynamics in numerical models that could help to guide developments in the coming era of high-spatial resolution atmospheric modelling.

How to cite: Hindley, N., Alexander, M. J., Bramberger, M., Ern, M., Hoffmann, L., Holt, L., Plougonven, R., Polichtchouk, I., Stephan, C., van Niekerk, A., and Wright, C.: How realistic are resolved gravity waves in ERA5 reanalysis compared to satellite observations?, EGU General Assembly 2024, Vienna, Austria, 14–19 Apr 2024, EGU24-21740, https://doi.org/10.5194/egusphere-egu24-21740, 2024.

EGU24-327 | ECS | Orals | G3.1

Using Inverse GNSS Methods for the Determination of C20 and C30 Gravity Field Coefficients for the Support of GRACE Solutions    

Adrian Nowak, Radosław Zajdel, Filip Gałdyn, and Krzysztof Sośnica

The distribution of atmospheric, hydrological, and oceanic mass loads on the lithosphere affects the deformation of the Earth's surface over time. Monitoring of the relative displacements of the dense global network of permanent Global Navigation Satellite System (GNSS) stations enables the direct measurement of these loads on a global scale. The application of inverse GNSS methods provides an independent tool to retrieve the time variable gravity (TVG) models of the Earth system and to support hydrogeodesy studies, including the monitoring of the water storage cycle or polar ice mass loss.

The goal of this study is to investigate the effectiveness of using inverse GNSS methods to provide independent C20 and C30 coefficients. These coefficients are essential for deriving highly accurate Gravity Recovery and Climate Experiment (GRACE)-based TVG models. In this study, surface mass variations of low-degree TVG coefficients are derived from the displacements of continuously tracking GNSS sites based on the 21 years (2000-2021) of the Center for Orbit Determination in Europe solutions of the 3rd data reprocessing campaign of the International GNSS Service in the framework of the preparation of the International Terrestrial Reference Frame 2020. The geometrical displacements of the GNSS stations calculated by inverse methods are compared with changes in the gravity field based on independent estimates obtained from the GRACE and GRACE Follow-On (GRACE-FO) satellite missions and the Satellite Laser Ranging (SLR).

As an alternative to the solutions provided by SLR, it is shown that the C20 and C30 coefficients can be derived based on GNSS station displacements. The challenge of the inverse GNSS approach is to properly choose the maximum degree of TVG expansion. Compared with the SLR-based solution, the most consistent GNSS estimate of the temporal gravity variation rate of the C20 coefficient (−1.73 ± 0.10 × 10⁻¹¹/year) and annual variation (4.7 ± 0.6 × 10⁻¹¹/43.9° ± 7.5°) was obtained by expansion of the spherical harmonics to degree and order of 8. The GNSS-based C30 series is superior to the SLR-based estimates before the launch of the Laser Relativity Satellite. From August 2016, when the C30 estimates are essential for correcting the GRACE solutions, the root mean square between GNSS and SLR solutions is 4.2 × 10⁻¹¹. GNSS could potentially support GRACE/GRACE-FO solutions that face problems in deriving C20 and C30, which are fundamental to estimates of ice mass changes in the polar regions. Recovery of mass change in the Antarctic ice sheet from April 2002 to December 2020 based on the coefficients replaced by GNSS estimates results in a linear trend of −111 ± 3 Gt/year. In comparison, the trend for the SLR-based replacement from Technical Note 14 shows a trend of −114 ± 2 Gt/year.

How to cite: Nowak, A., Zajdel, R., Gałdyn, F., and Sośnica, K.: Using Inverse GNSS Methods for the Determination of C20 and C30 Gravity Field Coefficients for the Support of GRACE Solutions   , EGU General Assembly 2024, Vienna, Austria, 14–19 Apr 2024, EGU24-327, https://doi.org/10.5194/egusphere-egu24-327, 2024.

EGU24-385 | Posters on site | G3.1

Long-term gravity field changes from SLR data and the combination with GRACE  for improving low-degree coefficients 

Filip Gałdyn, Krzysztof Sośnica, and Radosław Zajdel

In recent two decades, monitoring of changes in the Earth’s gravity field has been carried out mainly by the Gravity Recovery And Climate Experiment (GRACE) and its successor GRACE Follow-On. However, before the GRACE era,  very little information is available on the temporal evolution of the Earth's gravity field prior to that date. Moreover, through these missions, we have many gaps between 2010 and 2019. Fortunately, GRACE and GRACE Follow-On are not the only missions that can be used to recover variations in the Earth's gravity field. For the recovery of the mass redistribution processes on a large scale, we may employ precise Satellite Laser Ranging (SLR) observations.

We propose a set of long-term, continuous solutions based on SLR data. In our solutions, we use observations from spherical geodetic satellites. The gravity field is expanded up to a degree and order 10 with a monthly resolution from 1/1995 to 10/2021. The main solution has been decomposed into solutions expanded to degree and order 4, 6, 8, and 10 and stacked, taking advantage of the stability of the low-degree expansion and the better resolution of the high-degree expansion. The results show the reduction of the correlations between obtained parameters, stabilization of the ice mass estimates in polar regions – in Greenland and Antarctica, and a reduction of the noise over oceans by a factor of four.

In the GRACE and GRACE Follow-On datasets, the replacement of the spherical harmonics C20 and C30 with SLR-derived data is necessitated by suboptimal quality resulting from thermal effects impacting satellites and accelerometer malfunctions. In both SLR and GRACE solutions, coefficients of the same order and parity exhibit strong correlations. Merely replacing two specific coefficients could introduce bias into the solution. Therefore, we propose a comprehensive approach, combining GRACE with SLR solutions up to a degree and order of 10x10. This strategy ensures a proper consideration of the sensitivity of each technique to gravity field coefficients. The combined solution exhibits reduced noise compared to standard GRACE COST-G solution and effectively address the distinct sensitivities of SLR and GRACE techniques to low-degree time-variable gravity field coefficients.

How to cite: Gałdyn, F., Sośnica, K., and Zajdel, R.: Long-term gravity field changes from SLR data and the combination with GRACE  for improving low-degree coefficients, EGU General Assembly 2024, Vienna, Austria, 14–19 Apr 2024, EGU24-385, https://doi.org/10.5194/egusphere-egu24-385, 2024.

EGU24-891 | ECS | Posters on site | G3.1

Vertical Land Motion Detection Using Satellite Altimetry Data at the Hadera Tide Gauge Station 

Milaa Murshan, Balaji Devaraju, Nagarajan Balasubramanian, and Onkar Dikshit

Vertical Land Motion (VLM) estimation involves various methods such as Global Navigation Satellite Systems (GNSS), Very Long Baseline Interferometry (VLBI), Doppler Orbitography and Radiopositioning Integrated by Satellite (DORIS), and Satellite Laser Ranging (SLR). However, satellite altimetry presents an alternative approach for estimating VLM independently. This study compares altimetry-based VLM estimates with those obtained from Tide Gauge (TG) devices. The VLM is determined by calculating the difference between the linear trends of sea-level time series derived from altimetry-based data Instantaneous Sea Surface Height (ISSH) and TG data. Additionally, VLM can be estimated by comparing the linear trends of altimetry-based Sea Level Anomalies (SLA) and TG SLA time series.
 To estimate VLM, absolute ISSH measurements from satellite altimetry, unaffected by the Earth's crust, are contrasted with relative sea level measurements recorded by TG stations with respect to a fixed land point. By differentiating and aligning temporal pairs of TG and altimetry data, only the linear trend remains, representing the vertical displacement of the TG station relative to the reference surface. Removing satellite altimetry instrumentation drifts enables the extraction of VLM from the difference in linear trends. 
The VLM estimate obtained for the Hadera TG station, covering 1992-2016, shows a positive trend of 0.24 ± 0.07 mm/year. This finding aligns with GNSS-based VLM estimations at the same station, indicating land uplifting in the region. Consequently, the study suggests that there is no immediate concern about the rise of sea level. These findings enhance our understanding of regional geodetic processes and their implications for assessing sea level changes. By providing valuable information on VLM estimation, this research contributes to our knowledge of vertical displacement on land and its significance for future studies.

How to cite: Murshan, M., Devaraju, B., Balasubramanian, N., and Dikshit, O.: Vertical Land Motion Detection Using Satellite Altimetry Data at the Hadera Tide Gauge Station, EGU General Assembly 2024, Vienna, Austria, 14–19 Apr 2024, EGU24-891, https://doi.org/10.5194/egusphere-egu24-891, 2024.

EGU24-3658 | ECS | Orals | G3.1

A Geodetic Drought Index Driven by Hydrologic Loading Estimates Calculated from Three-Dimensional GPS Displacements   

Zachary M. Young, Hilary R. Martens, Zachary H. Hoylman, and W. Payton Gardner

During periods of drought, quantifying the intensity of water loss within hydrologic reservoirs, both on and below the surface, is critical to sustain water resources. Drought intensity is typically characterized using drought indices which are driven by meteorologic observations, such as precipitation. These drought indices provide good insight into the quantity of water entering the hydrologic system, however, they are unable to quantify the amount of water retained in a watershed or the amount lost due to runoff and evapotranspiration. We address this by leveraging the sensitivity of three-dimensional Global Positioning System displacements to local and regional hydrologic-storage fluctuations, and produce a new geodetic drought index (GDI), derived from estimated hydrologic-storage deviations, to directly characterize hydrologic storage anomalies. The GDI is derived comparably to the Standardized Precipitation Evapotranspiration Index such that it may be easily incorporated into current drought management workflows. We directly compare the GDI to hydrologic observations within California and find strong associations between specific time scales of the GDI and groundwater well, artificial-reservoir storage, and stream discharge observations. The GDI is most sensitive to groundwater, exhibiting a correlation coefficient of 0.87 at the 3-month time scale. Both artificial-reservoir storage and stream discharge exhibit peak correlation coefficients when considering the 1-month GDI, at 0.81 and 0.47 respectively. No relationship is observed with soil moisture observations. The correlation coefficients decline rapidly away from the optimal time scale, indicating the 1- and 3-month GDI are strong predictors of hydrologic variation within California. In addition to capturing long-term trends, rapid changes in the GDI initiate during clusters of large atmospheric-river events that closely mirror fluctuations in the hydrologic observations. The GDI provides an opportunity to improve hydrologic models for drought-management and to advance our understanding of the water cycle.


How to cite: Young, Z. M., Martens, H. R., Hoylman, Z. H., and Gardner, W. P.: A Geodetic Drought Index Driven by Hydrologic Loading Estimates Calculated from Three-Dimensional GPS Displacements  , EGU General Assembly 2024, Vienna, Austria, 14–19 Apr 2024, EGU24-3658, https://doi.org/10.5194/egusphere-egu24-3658, 2024.

EGU24-5267 | ECS | Posters on site | G3.1

Reconciling ocean mass changes from 20 years of GRACE and GRACE Follow On observations 

Carsten Bjerre Ludwigsen, Ole Baltazar Andersen, Christopher Watson, and Matt King

The total mass change of the Earth's land surface precisely offsets the combined changes in the atmosphere and oceans, resulting in a net-zero change for the entire system (land+ocean+atmosphere).

Closing the ocean mass budget is crucial for understanding current and future sea-level changes. Recent efforts to reconcile ocean mass observations from GRACE and GRACE-Follow On satellites (hereafter unitedly referred to as ‘GRACE’) with both steric-corrected altimetry and and land/ice to ocean estimates have revealed a discrepancy in the mass budget (Wang et al, 2022; Barnoud et al, 2022). This finding indicates a concerning misalignment in our global observation system or understanding of earth mass transport.

This study uses GRACE-independent estimates/models of land surface mass changes to validate 20 years of GRACE observations. By calculating the monthly Gravitational, Rotational, and Deformational (GRD) response to 20 years of land mass changes, we reconstruct the global, regional, and seasonal ocean mass changes observed by GRACE from 2003 to 2022.

Over the 20-year period, the ocean mass reconstruction aligns well with the GRACE observations. However, a significant deviation emerges after 2020, with the reconstruction showing a larger ocean mass change than GRACE. We demonstrate that this deviation is likely caused by an underestimation of Western Africa precipitation in the ERA5 reanalysis, commonly used by hydrological models to estimate changes in land water storage. Land mass observations from GRACE further confirmvthis underestimation and shows great alignment between models and observations when excluding sub-Saharan Africa.

Our results show a global agreement between GRACE and GRD-induced ocean mass changes, suggesting that the misalignment between GRACE and steric-corrected altimetry is likely due to errors in the ARGO observing system. A reported 'salinity-drift' is the primary source of error, and together with an error in the wet path delay originating from drift in the radiometer of the Jason-3 satellite explains most of the post-2016 difference between GRACE and steric-corrected altimetry is identified. The remaining differences likely originate from GIA and/or Argo-biases.

How to cite: Ludwigsen, C. B., Andersen, O. B., Watson, C., and King, M.: Reconciling ocean mass changes from 20 years of GRACE and GRACE Follow On observations, EGU General Assembly 2024, Vienna, Austria, 14–19 Apr 2024, EGU24-5267, https://doi.org/10.5194/egusphere-egu24-5267, 2024.

The accuracy of global ocean tide models (OTMs) in shallow waters and along coasts impacts on their numerous applications. For example, the use of OTMs to provide tide corrections (‘de-tiding’) for satellite altimetry observations is required for, e.g., sea level studies and marine gravity field recovery. OTMs are also indispensable in the mitigation of striping errors in GRACE and GRACE-FO time-variable gravity field solutions. It therefore follows that OTM errors in coastal and shelf ocean may then introduce biases into the ‘corrected’ satellite altimetry and gravimetry observations with the potential to impact models using these data. The purpose of our study is to assess the accuracy of two high resolution assimilated OTMs (TPXO9v5, and FES2014b) using an updated set of >100 coastal and shelf tide gauges across the northern Australia and Papua New Guinea region. TPXO9v5 and FES2014b are used here because they have previously compared better than other tidal models in adjacent coastal and shelf areas. This study will also provide insight into the tides in this region which contain a mix of shallow and medium depth waters adjacent to the coast, in addition to land and island barriers that result in a complex tidal regime. This study takes advantage of the large number of short-term tide gauges situated on the coast or offshore islands in Northern Australia and Papua New Guinea. This set of tide gauges have observation periods of >30 days, with a number being more than 90 days long which allows the resolution of the major semidiurnal and diurnal tidal constituents. We use harmonic analysis to estimate tidal constants of major diurnal and semi-diurnal constituents from tide gauges then compare them with corresponding values from TPXO9v5 and FES2014b at the tide gauge location. This comparison identifies improvements and also limitations in these OTMs in this region, and their potential impact on tide corrections provided for satellite altimetry products that may propagate into coastal sea surface, and gravity at the coast. The results also provide additional insight into the local tidal patterns in this region, with particular interest in the Torres Strait and surrounding area.

How to cite: Filmer, M., Seifi, F., and Claessens, S.: Evaluation of ocean tide models in coastal ocean regions of northern Australia and Papua New Guinea using an updated set of short term tide gauges, EGU General Assembly 2024, Vienna, Austria, 14–19 Apr 2024, EGU24-7127, https://doi.org/10.5194/egusphere-egu24-7127, 2024.

EGU24-7430 | ECS | Posters on site | G3.1

Regional modelling of water storage variations from combined GRACE/-FO and GNSS data in a Kalman filter framework 

Viviana Wöhnke, Annette Eicker, Matthias Weigelt, Marvin Reich, and Andreas Güntner

Water mass changes at and below the surface of the Earth cause changes in the Earth’s gravity field which can be observed by at least three geodetic observation techniques: ground-based point measurements using terrestrial gravimeters, space-borne gravimetric satellite missions (GRACE and GRACE-FO) and geometrical deformations of the Earth’s crust observed by GNSS. Combining these techniques promises the opportunity to compute the most accurate (regional) water mass change time series with the highest possible spatial and temporal resolution, which is the goal of a joint project with the interdisciplinary DFG Collaborative Research Centre (SFB 1464) "TerraQ – Relativistic and Quantum-based Geodesy".

A method well suited for data combination of time-variable quantities is the Kalman filter algorithm, which sequentially updates water storage changes by combining a prediction step with observations from the next time step. As opposed to the standard way of describing gravity field variations by global spherical harmonics, we introduce space-localizing radial basis functions as a more suitable parameterisation of high-resolution regional water storage change. An estimation environment has been set up for the combination of GRACE/-FO satellite gravimetry with GNSS station displacements. The feasibility and stability of the approach is first demonstrated in a closed-loop simulation to test the setup and tune the algorithm. Subsequently, it is applied to real GRACE and GNSS observations to sequentially update the parameters of a regional gravity field model for Central Europe. The implementation was designed to flexibly include further observation techniques (e.g. terrestrial gravimetry) at a later stage. This presentation will outline the Kalman filter framework and regional parameterisation approach, and addresses challenges such as the relative weighting between the GRACE and GNSS data, and the appropriate choice of the Kalman filter process model and radial basis function parameterisation.

How to cite: Wöhnke, V., Eicker, A., Weigelt, M., Reich, M., and Güntner, A.: Regional modelling of water storage variations from combined GRACE/-FO and GNSS data in a Kalman filter framework, EGU General Assembly 2024, Vienna, Austria, 14–19 Apr 2024, EGU24-7430, https://doi.org/10.5194/egusphere-egu24-7430, 2024.

EGU24-7669 | ECS | Orals | G3.1

Evaluation of extreme events in global coupled climate models by satellite gravimetry 

Klara Middendorf, Annette Eicker, Laura Jensen, and Henryk Dobslaw

Under the assumption that a warming climate leads to an intensification of the global water cycle, it can be hypothesized that also the occurrence frequency and severity of extreme events such as droughts or floods will increase in the upcoming decades to centuries. Global coupled climate models, which project the future evolution of various variables of the Earth's climate system are important tools for the analysis of such expected changes. To assess the reliability of the models and to identify possible systematic discrepancies, it is essential to evaluate the model output against observations.

In this study, present and future occurrences of extreme events are analysed in water storage time series simulated by coupled global climate models participating in the Coupled Model Intercomparison Project Phase 6 (CMIP6) and compared against spatio-temporal changes in water mass derived from GRACE and GRACE-FO. This comparison is based on Extreme Value Theory, as the exact timing of modelled extreme events cannot be assessed by observations due to the stochastic behavior of climate variability in unconstrained model experiments. From estimated extreme value distributions return levels are calculated, a quantity describing the magnitude or frequency of extreme values.  Challenges that have to be overcome in the analysis are the non-stationary data and the relatively short time span of the GRACE observations. The latter issue is addressed by additionally assessing GRACE-based water storage reconstructions available over many decades.

This study provides insights into the ability of global climate models to model the occurrence of TWS extremes, namely unusual dry and wet phases. It also examines whether the climate model projections predict an increasing intensity of extreme events.

How to cite: Middendorf, K., Eicker, A., Jensen, L., and Dobslaw, H.: Evaluation of extreme events in global coupled climate models by satellite gravimetry, EGU General Assembly 2024, Vienna, Austria, 14–19 Apr 2024, EGU24-7669, https://doi.org/10.5194/egusphere-egu24-7669, 2024.

Changes in soil water storage can be studied on a global scale using a variety of satellite observations. With active or passive microwave remote sensing, we can study the upper few centimeters of the soil, while satellite gravimetry allows us to detect changes in the entire column of terrestrial water storage (TWS). The combination of both types of data can provide valuable insight into hydrological dynamics in different soil depths towards a better understanding of changes in subsurface water storage.

We use daily Gravity Recovery and Climate Experiment (GRACE) data and satellite soil moisture data to identify extreme hydroclimatic events, focusing on prolonged droughts. To enhance our comprehension of the subsurface, we utilize not just surface soil moisture data but also integrate information on root zone soil moisture. Original level-3 surface soil moisture data sets of SMAP and SMOS are compared to post-processed level-4 data products (both surface and root zone soil moisture) and a multi-satellite product provided by the ESA CCI.

We analyse the correspondence between high and low percentiles in TWS and soil moisture time series, which allows us to identify extreme events in different integration depths and storage compartments. Furthermore, we compute the rate of change of anomalies to assess how quickly the system accumulates storage deficits during drought conditions and recovers from them for different soil depths. Our investigation focuses on the temporal dynamics of near-surface soil moisture and TWS, highlighting the cascading effects that propagate from the surface into the subsurface. The results we obtained indicate characteristic patterns of the temporal dynamics of drought recovery in varying soil depths. Specifically, our analysis shows that surface soil moisture recovers faster than TWS, and that this recovery process slows down as soil integration depth increases.

How to cite: Blank, D., Eicker, A., and Güntner, A.: From surface to subsurface: Investigating drought cascades and recovery patterns with (daily) satellite observations of soil moisture and terrestrial water storage, EGU General Assembly 2024, Vienna, Austria, 14–19 Apr 2024, EGU24-7888, https://doi.org/10.5194/egusphere-egu24-7888, 2024.

EGU24-8727 | Posters on site | G3.1

20-year-long sea level changes along the world’s coastlines from satellite altimetry: a new data set of coastal virtual stations 

Anny Cazenave, Lancelot Leclercq, Fabien Leger, Florence Birol, Fernando Nino, Marcello Passaro, and Jean Francois Legeais

In the context of the ESA Climate Change Initiative (CCI) Coastal Sea Level project, a complete reprocessing (including retracking of the radar waveforms) of high resolution (20 Hz, i.e. 350 m) along-track altimetry data of the Jason-1, Jason-2 and Jason-3 missions since January 2002 was performed along the world coastal zones. Different versions have been provided so far. The latest release (SL_cci+ coastal altimeter sea level dataset, v2.3) is now available to users. It is an extension in time of the previous data set (v2.2) which covers the period January 2002 to June 2021. A new improved processing for the waveform retracking and computation of the coastal sea level anomalies was developed and a new editing procedure for the coastal sea level trend computation was implemented. This new data set shows spectacular reduction of the data noise compared to previous versions, both in terms of sea level anomaly time series and trends. As a consequence, compared to the previous versions we now obtain an important increase of the number of virtual coastal stations (i.e., the location of the first valid point along the satellite track, with about 1200 sites at an average distance from the coast of about 3 km, including more than 200 stations at less than 2 km from the coast). The coastal sea level anomalies and trends of the altimetry-based virtual stations have been validated with tide gauge data where possible. An example in the Mississippi Delta is presented.

How to cite: Cazenave, A., Leclercq, L., Leger, F., Birol, F., Nino, F., Passaro, M., and Legeais, J. F.: 20-year-long sea level changes along the world’s coastlines from satellite altimetry: a new data set of coastal virtual stations, EGU General Assembly 2024, Vienna, Austria, 14–19 Apr 2024, EGU24-8727, https://doi.org/10.5194/egusphere-egu24-8727, 2024.

EGU24-8830 | Orals | G3.1 | Highlight

Will the MAGIC mission improve the observability of extreme hydrological events? 

Eva Boergens, Josefine Wilms, Markus Hauk, Christoph Dahle, Henryk Dobslaw, and Frank Flechtner

NASA and DLR will launch in 2028 GRACE-C (Gravity Recovery and Climate Experiment – Continuation). This mission will again be launched into a polar orbit at 500 km initial altitude and extend the observation of the time-variable Earth’s gravity field from GRACE (2002-2017) and GRACE-FO (GRACE Follow-On, 2018-today). ESA plans to launch a Next Generation Gravity Mission (NGGM) in 2032, which shall fly in a lower and inclined orbit and be based on improved instrumentation. GRACE-C and NGGM will then form the double-pair Mass-Change and Geosciences International Constellation (MAGIC) to significantly increase the spatial and temporal resolution of mass transport products and deduce water mass redistribution over the oceans, ice sheets and continents.

Thanks to the 20+ years period of GRACE and GRACE-FO observations, scientists are able to analyse extreme hydrological events, such as flooding and droughts. However, due to the rather coarse spatial resolution of the GRACE and GRACE-FO data sets of approximately 350 km, finer spatial details of such extreme events are kept hidden. Further, spatial leakage limits the value of these data for smaller-scale regional investigations.

In this contribution, we will employ five years of simulated data for both a single polar pair (GRACE-FO-like) and a MAGIC baseline scenario. Thanks to the simulation, we can also assess the true values of the hydrological input models. Both simulated data sets are filtered with the same DDK filters for comparison. The filter strength can be reduced for the MAGIC baseline scenario without introducing more striping errors.

With these simulated data sets, we investigate extreme hydrological events. For example, the localisation of extreme wet events along the northern coast of Australia is much improved, with less signal leakage into the surrounding ocean.

How to cite: Boergens, E., Wilms, J., Hauk, M., Dahle, C., Dobslaw, H., and Flechtner, F.: Will the MAGIC mission improve the observability of extreme hydrological events?, EGU General Assembly 2024, Vienna, Austria, 14–19 Apr 2024, EGU24-8830, https://doi.org/10.5194/egusphere-egu24-8830, 2024.

EGU24-8938 | Orals | G3.1

Strategies for assimilating GRACE/-FO terrestrial water storage anomalies into hydrological models 

Anne Springer, Yorck Ewerdwalbesloh, Helena Gerdener, Kerstin Schulze, and Jürgen Kusche

After more than 15 years of experience with GRACE/-FO data assimilation (DA) into hydrological models, numerous studies have conducted various tests on GRACE product and preprocessing options as well as DA strategies. However, a commonly accepted standard procedure has yet to emerge. This contribution comprises (1) a review on the prevalence of GRACE-DA options based on existing studies together with (2) insights from applying two GRACE assimilating frameworks: the high-resolution CLM-DA framework over Europe and the global WGHM-based calibration and data assimilation framework.

We discuss the selection of different GRACE/-FO products for DA into hydrological models, including spherical harmonics, MASCONS, level 3 products, and the recently evolved along-orbit line-of-sight gravity differences. Additionally, we explore processing choices such as filtering and rescaling, possible corrections for phenomena like glacial isostatic adjustment, large lakes and reservoirs or earthquakes, observation grid representation, and various approaches to handle observation errors. We evaluate the impact of these processing strategies on simulated water storage trends and the representation of selected extreme events.

Through this research, we contribute to understanding optimal strategies in assimilating GRACE/-FO data, addressing critical aspects influencing hydrological model reliability.

How to cite: Springer, A., Ewerdwalbesloh, Y., Gerdener, H., Schulze, K., and Kusche, J.: Strategies for assimilating GRACE/-FO terrestrial water storage anomalies into hydrological models, EGU General Assembly 2024, Vienna, Austria, 14–19 Apr 2024, EGU24-8938, https://doi.org/10.5194/egusphere-egu24-8938, 2024.

EGU24-10138 | ECS | Posters on site | G3.1

Reconstructing GRACE-like TWSA maps from 1992 on by combining data-driven methods with time-variable gravity fields from SLR range analyses 

Charlotte Hacker, Jürgen Kusche, Anno Löcher, and Fupeng Li

The Gravity Recovery And Climate Experiment (GRACE) and its follow-on mission, GRACE-FO, have observed global mass changes and transports, expressed as total water storage anomalies (TWSA), for over two decades. However, for climate change attribution and other applications, multi-decadal TWSA time series are required. This need has triggered several studies on reconstructing TWSA via regression approaches or machine learning techniques, with the help of predictor variables such as rainfall or sea surface temperature. Here, we combine such an approach, for the first time, with low-resolution information from geodetic satellite laser ranging (SLR). The reconstruction is formulated on a GRACE-derived empirical orthogonal functions (EOFs) basis and complemented with the Löcher and Kusche (2021) approach, in which global gravity fields are solved from SLR ranges in a GRACE EOF basis for the pre-GRACE time frame. Although our technique works globally, we focus mainly on European basins and reconstruct water storage anomalies from 1992 onward.

How to cite: Hacker, C., Kusche, J., Löcher, A., and Li, F.: Reconstructing GRACE-like TWSA maps from 1992 on by combining data-driven methods with time-variable gravity fields from SLR range analyses, EGU General Assembly 2024, Vienna, Austria, 14–19 Apr 2024, EGU24-10138, https://doi.org/10.5194/egusphere-egu24-10138, 2024.

EGU24-10234 | ECS | Posters on site | G3.1

Sub-Monthly Mass Change Signal in Greenland from GRACE-FO Laser Interferometry Data 

Barbara Jenny, Marcus Jepsen, Sebastian Bjerregaard Simonsen, René Forsberg, and Tim Enzlberger Jensen

GRACE and GRACE-FO have proven valuable for monitoring the health of ice sheets by showing seasonal mass changes along with the decadal trends of mass loss. Two years stand out in the Greenland ice sheet mass loss record with record melt: 2012 and 2019. On the West coast of Greenland, the ice mass fluctuations act on remarkably short time scales during these events, as evident at Ilulissat isbræ, which nearly doubled its ice speed in just one week. Here, we study if these sub-monthly ice mass change variations can be measured using GRACE-FO line-of-sight measurements.

It has been shown several times that using dynamic orbits and Laser Ranging Interferometer (LRI) data, one can calculate residual Line-of-sight gravity signals. This method was primarily used to study hydrological signals such as storm surges or heavy rainfall. In this study, we focus on ice mass changes in Greenland, and we compare these GRACE-FO measurements to the expectation based on the monthly gravity field and the signal from mass change based on IceSat2 data for 2019-2021.

How to cite: Jenny, B., Jepsen, M., Simonsen, S. B., Forsberg, R., and Jensen, T. E.: Sub-Monthly Mass Change Signal in Greenland from GRACE-FO Laser Interferometry Data, EGU General Assembly 2024, Vienna, Austria, 14–19 Apr 2024, EGU24-10234, https://doi.org/10.5194/egusphere-egu24-10234, 2024.

EGU24-10483 | ECS | Orals | G3.1

Resolving the interannual to multi-decadal variability in ocean heat content, a simulation study of current and future satellite gravity missions 

Marius Schlaak, Roland Pail, Alejandro Blazquez, Benoit Meyssignac, and Jean-Michel Lemoine

Ocean Heat Content (OHC) is an essential indicator of Earth’s climate state. Climate change is driven by the disequilibrium of Earth’s radiation budget. This abundant energy in the system is the Earth Energy Imbalance (EEI), which is challenging to measure globally. About 90% of EEI is accumulated in the oceans, resulting in an increase in ocean heat content. Therefore, OHC is a suitable proxy for EEI and can be measured globally using a combination of geodetic satellite techniques. By combining satellite altimetry and satellite gravimetry, it is possible to measure the change in global ocean heat content over the mission’s lifetime. While the altimeter record covers several decades, satellite gravity missions have been observing global mass transports for two decades. To steadily estimate the system’s long-term behavior, an extended observation period of the satellite systems is needed. The upcoming satellite gravity mission Grace-C, planned to be launched in 2028 by NASA, is meant to ensure continuity and extension of the data record. At the beginning of the 2030s, an additional inclined pair will be launched by ESA to form together with GRACE-C the Mass change And Geosciences International Constellation (MAGIC), for which higher spatial and temporal resolutions are expected.

This contribution presents the results of multi-decadal closed-loop simulations of current and future satellite gravity observations. It shows the benefit of an increased duration of the observation and an improved observational system while comparing processing strategies for long-term trends in ocean mass changes. The observed climate signal is based on projections of mass change signals of oceans, ice sheets, and glaciers derived from CMIP6 climate projection under a shared socio-economic pathway scenario without drastic reduction of Greenhouse gases emissions (SSP5-8.5). A particular focus here is on the accuracy of long-term ocean trends. The direct estimation of long-term trends benefits from an increasing observation period and allows improved spatial resolution compared to trends estimated from monthly temporal gravity fields. The global ocean heat content is estimated from the steric sea-level change which is derived by subtracting the observed ocean mass change from the overall sea level change. The resulting long-term trends in ocean heat content are then compared to initial inputs to the simulation to illustrate the difference in performance between current and future satellite gravity constellations.

How to cite: Schlaak, M., Pail, R., Blazquez, A., Meyssignac, B., and Lemoine, J.-M.: Resolving the interannual to multi-decadal variability in ocean heat content, a simulation study of current and future satellite gravity missions, EGU General Assembly 2024, Vienna, Austria, 14–19 Apr 2024, EGU24-10483, https://doi.org/10.5194/egusphere-egu24-10483, 2024.

EGU24-10526 | Orals | G3.1

Assessment of global high-resolution water storage simulations from the LISFLOOD hydrological model 

Henryk Dobslaw, Laura Jensen, Robert Dill, and Kyriakos Balidakis

Simulated terrestrial water storage (TWS) data from global hydrological models are indispensable for various geodetic applications, e.g., for simulating Earth orientation parameters, deriving time series of deformations of the Earth’s surface needed for the realization of global reference systems, or de-aliasing purposes of GRACE/-FO gravity products. So far, the Land Surface Discharge Model (LSDM) has been routinely used for such tasks at the GFZ. However, the current standard experiment of LSDM is already several years old, and many limitations are known, in particular a limited spatial resolution of 0.5°, which limits the accuracy of crustal deformation predictions close to rivers and lakes. In this contribution, we evaluate the suitability of LISFLOOD (https://ec-jrc.github.io/lisflood/), an open source, high-resolution hydrological rainfall-runoff-routing model, for geodetic purposes.

We compare the performance of various global LISFLOOD model runs for the time period 2000 – 2022 against the current LSDM configuration. In addition to two LISFLOOD model generations, which differ in their spatial resolution (0.1° and 0.05°) and their input land surface parameter data set, we also explore a number of high-resolution (0.05°) model runs with respect to the influence of the soil depth on simulated TWS. Model results are validated against mass anomalies from the satellite gravimetry missions GRACE and GRACE-FO on different spatial and temporal scales. Furthermore, to demonstrate the benefit of the higher spatial resolution of LISFLOOD, we utilize data from selected ground based GNSS stations to validate the models’ performance regarding mass-induced loading.

We find that LISFLOOD significantly outperforms LSDM in many regions, especially on interannual time scales, in terms of various validation metrics (i.e., correlation, root mean squared deviation, and explained variance). Analyzing the different LISFLOOD runs reveals advantages of the new (0.05°) over the old (0.1°) model version, and a large impact of the choice of soil depth on simulated TWS.

How to cite: Dobslaw, H., Jensen, L., Dill, R., and Balidakis, K.: Assessment of global high-resolution water storage simulations from the LISFLOOD hydrological model, EGU General Assembly 2024, Vienna, Austria, 14–19 Apr 2024, EGU24-10526, https://doi.org/10.5194/egusphere-egu24-10526, 2024.

EGU24-11213 | Posters on site | G3.1

GNSS Precipitable Water Vapour for Climate Monitoring 

Galina Dick, Florian Zus, Jens Wickert, Benjamin Männel, and Markus Ramatschi

Aside from main geodetic applications, the Global Navigation Satellite System (GNSS) is now an established observing system for atmospheric water vapour which is the most important greenhouse gas as it is responsible for around 60% of the natural greenhouse effect. Water vapour is under-sampled in the current climate-observing systems. Obtaining and exploiting more high-quality humidity observations is essential for climate research.

Established in 2006, the Global Climate Observing System (GCOS) Reference Upper-Air Network (GRUAN), is an international reference observing network of sites measuring essential climate variables above the Earth's surface. Currently, this network comprises more than 30 reference sites worldwide, designed to detect long-term trends of key climate variables such as temperature and humidity in the upper atmosphere. GRUAN observations are required to be of reference quality, with known biases removed and with an associated uncertainty value, based on thorough characterization of all sources of measurement.

A complementary small scale regional climate station network is the Austrian WegenerNet, which provides since 2007 measurements of hydrometeorological variables with very high spatial and temporal resolution. GNSS precipitable water vapour (GNSS-PWV) measurement has been included as a priority one measurement of the essential climate variable water vapour to both GRUAN and WegenerNet climate station networks.

GFZ contributes to climate research within GRUAN and WegenerNet with its expertise in processing of ground-based GNSS network data to generate precise PWV products. GFZ is responsible for the installation of GNSS hardware, data transfer, processing and archiving, derivation of GNSS-PWV data products according to GRUAN and WegenerNet requirements including PWV uncertainty estimation. GNSS-PWV products and results of selected validation studies will be presented.

How to cite: Dick, G., Zus, F., Wickert, J., Männel, B., and Ramatschi, M.: GNSS Precipitable Water Vapour for Climate Monitoring, EGU General Assembly 2024, Vienna, Austria, 14–19 Apr 2024, EGU24-11213, https://doi.org/10.5194/egusphere-egu24-11213, 2024.

EGU24-11433 | ECS | Posters on site | G3.1

Solid Earth’s response to climate change in Svalbard monitored by space geodesy  

Alicia Tafflet, Joelle Nicolas, Jean-Paul Boy, Jean-Michel Lemoine, Félix Perosanz, Frédéric Durand, Achraf Koulali, Lissa Gourillon, Agnès Baltzer, and Jérôme Verdun

The Svalbard archipelago in the Arctic is extremely sensitive to climate change. The resulting redistribution of mass, including recent and past ice melt, induces deformations of the Earth's surface and temporal variations in its gravity field, which can be detected by space geodesy. The cross-comparison of different techniques takes advantage of their complementary temporal and spatial resolutions, helping to distinguish between local, regional and global signals. We analyse more than 20 years of GNSS (Global Navigation Satellite System) satellite 3D positionning solutions at 17 permanent sites. The results are compared with deformations computed from time gravity field variations observed by the space gravimetry missions GRACE (Gravity Recovery and Climate Experiment) and GRACE Follow-On. The mean vertical motion is of about 9 mm/year and can reach 15 mm/year. We then compare these GNSS and GRACE datasets with Little Ice Age (LIA) and Global Isostatic Adjustment (GIA) models as well as with satellite altimetry observations from Cryosat-2 and IceSat-2. We infer the various contributions and quantify the impact of the current climate change on Svalbard. In addition to better estimate the acceleration of the current ice melting we apply an innovative seasonal adjustment method. The results are then discussed in relation to in situ observations.

How to cite: Tafflet, A., Nicolas, J., Boy, J.-P., Lemoine, J.-M., Perosanz, F., Durand, F., Koulali, A., Gourillon, L., Baltzer, A., and Verdun, J.: Solid Earth’s response to climate change in Svalbard monitored by space geodesy , EGU General Assembly 2024, Vienna, Austria, 14–19 Apr 2024, EGU24-11433, https://doi.org/10.5194/egusphere-egu24-11433, 2024.

Since March 2002, the Gravity Recovery and Climate Experiment (GRACE) satellite and its following mission GRACE-FO have measured the time-variable gravity fields of the Earth, by which water shifts around Earth can be captured. Among its innovations, GRACE has monitored the change of ice mass from Earth's ice sheets and glaciers, which is essential for the better understanding of the changing climate system. Over the past few decades, glacier mass loss has been significant across the globe. The European Alps are among the regions experiencing the greatest shrinkage of glaciers, which becomes the main focus of this work.
In this work, we will challenge the information of satellite gravimetry, hydrological models, and satellite geodesy to monitor the ice mass loss in the Alps in central Europe. The temporal variations of total water storage (TWS) in the Alpine region are determined from GRACE- and GRACE-FO-based Level-2 products provided by COST-G and Mascon surface mass change fields calculated by JPL. Furthermore, the correction of GIA effects and hydrological signals in the study area is indispensable to isolate the estimate of glacier melting. For the GIA correction, the GIA model ICE-6G_D and the regional dataset of surface displacements obtained from geodetic observation techniques are applied to GRACE data respectively, resulting in obvious different results. For the hydrological correction, the WaterGAP Global Hydrology Model (WGHM) model and the Global Land Data Assimilation System (GLDAS) model are used to estimate the mass change of the liquid part. In addition, the ice mass loss in the Alps between 2000 and 2014 based on glacier inventory was estimated in another publication, which can be a reference (-1.34 Gt/yr). Glaciers in the Alps lost mass at a rate of around -1.4 Gt/yr and around -2.2 Gt/yr depending on different ways of GIA correction during the 21-year period, which have similar magnitudes with the reference value.

How to cite: Liu, S. and Pail, R.: The estimation of glacier changes in the Alps in 2002-2022 with the use of satellite gravimetry data, EGU General Assembly 2024, Vienna, Austria, 14–19 Apr 2024, EGU24-11913, https://doi.org/10.5194/egusphere-egu24-11913, 2024.

EGU24-11918 | ECS | Posters on site | G3.1

Estimating terrestrial water storage trends by developing a joint inversion scheme using GRACE and GRACE-FO data 

Sedigheh Karimi, Amin Shakya, Roelof Rietbroek, Marloes Penning de Vries, and Christiaan van der Tol

Climate change and global warming can affect the water cycle, leading to increased hydrological extremes, such as droughts affecting the environment, agricultural activities, and human life and causing serious social and economic problems worldwide. Therefore, monitoring changes in the water cycle can be helpful for effective water resources management and provide a management plan for sharing with stakeholders, water managers, and local people.

This study focuses on terrestrial water storage changes (e.g., trends and seasonal shifts) that potentially indicate climate change patterns like droughts and large scale flooding events within watersheds across the Horn of Africa.

In this study, an inversion scheme is being developed to process level-2 data obtained from the Gravity Recovery and Climate Experiment (GRACE) and subsequent measurements from GRACE Follow-On (GRACE-FO) spanning the period from 2002 to 2023 considering the variance-covariance matrix (error matrix) of observations for estimating TWS variations monthly at basin scale. We expect that our inversion scheme will be independent of filters, and there will be no need for empirical rescaling factors to amplify the primary signal after filtering and damping effect. The TWS changes estimated from the developed inversion scheme will be compared with the TWS trends of basins that have been derived using the basin averaging standard approach and Mascon solutions TWS changes products. Additionally, the atmospheric reanalysis products will be used, along with hydrological model discharge estimates, to assess the accuracy of time derivatives of TWS changes.

How to cite: Karimi, S., Shakya, A., Rietbroek, R., Penning de Vries, M., and van der Tol, C.: Estimating terrestrial water storage trends by developing a joint inversion scheme using GRACE and GRACE-FO data, EGU General Assembly 2024, Vienna, Austria, 14–19 Apr 2024, EGU24-11918, https://doi.org/10.5194/egusphere-egu24-11918, 2024.

EGU24-11963 | ECS | Orals | G3.1

Combination of GRACE/GRACE-FO and CryoSat-2 data resolves Glacial Isostatic Adjustment spatially and temporally in the Amundsen Sea Embayment, West Antarctica 

Matthias O. Willen, Bert Wouters, Taco Broerse, Eric Buchta, and Veit Helm

An effective spatial resolution of a few hundred kilometres, typically assessed for mass variations derived from GRACE/GRACE-FO data, is a major limitation for the rigorous investigation of local causes of mass variations. This is crucial for analyzing mass changes of the West Antarctic Ice Sheet, which is one of the tipping elements in the Earth’s climate system. In this region, ice mass changes occur on spatial scales smaller than the typical GRACE/GRACE-FO resolution. Furthermore, this is also the case for the solid-Earth deformation induced by ice load changes, which in turn can affect the glacier flow. Especially in the Amundsen Sea Embayment, mass changes due to the ongoing Glacial Isostatic Adjustment (GIA) have been postulated to vary on spatial scales smaller than 200 km and to feed back significantly on ice flow dynamics. Here, we present results from a data combination approach with a focus on the Amundsen Sea Embayment, West Antarctica. This approach utilizes data from GRACE/GRACE-FO and CryoSat-2 satellite altimetry with regional climate and firn model results over a time span of 10 years from 2011 to 2020. Improved GRACE/GRACE-FO gravity-field processing and a study area in a high latitude region, where the signal-to-noise is high, benefit a high spatial resolution of the results. One processing step is the smoothing of the input data sets in order to unify their different spatial resolution. We find a best fit of the combination results with independent GNSS observations by applying a Gaussian smoother of 135 km half-response width. The weighted rms difference is 3.8 mm/a in terms of estimated bedrock motion. It is almost twice as large when the input data sets are smoothed with a 300 km half-response filter. The determined effects of solid-Earth deformation may be a useful boundary information for GIA modelling in this region, e.g. for testing rheological models or (centennial) glacial histories.

How to cite: Willen, M. O., Wouters, B., Broerse, T., Buchta, E., and Helm, V.: Combination of GRACE/GRACE-FO and CryoSat-2 data resolves Glacial Isostatic Adjustment spatially and temporally in the Amundsen Sea Embayment, West Antarctica, EGU General Assembly 2024, Vienna, Austria, 14–19 Apr 2024, EGU24-11963, https://doi.org/10.5194/egusphere-egu24-11963, 2024.

Drought is one of the most complex recurring natural disasters, defined by a deficiency of precipitations that causes prolonged water scarcity. Failure to manage drought risk has the potential to have dire consequences for people, livelihoods, economy and ecosystems.
In northern Italy, particularly in the highly productive industrial area of the Po river basin, the 2021-2022 period culminated in the most severe drought of the last two centuries.
In order to evaluate the best policies to address the problems caused by water scarcity, it is crucial to measure and monitor variations in terrestrial water storage (TWS). For drought monitoring, in fact, changes or anomalies in TWS provide direct observations of total water availability, complementing model-based measures such as drought severity indices.
To estimate the quantities and spatial distribution of TWS loss, we analyze vertical ground displacement time-series data from Global Navigation Satellite System (GNSS) stations in the Po river basin.
We use a regularization model, based on L1-norm, to reconstruct the long-term temporal evolution of vertical ground displacement trends. Next, we performed a Principal Component Analysis (PCA) on GNSS time series to extract a spatially consistent signal in vertical ground displacements. The temporal evolution of the first principal component is well-correlated with trend changes of the Po river level and with the  SPEI-12 drought index, with stations moving upward during periods of river/index level decrease and vice versa, indicating that common long-term variations in vertical ground displacements are driven by the hydrology of the area.
The inversion of the displacements associated with the first principal component allows us to estimate variations in equivalent water height (EWH) and find that between January 2021 and August 2022, the GNSS stations underwent uplift, up to 7 mm, which corresponds to ~70 Gtons of water loss. The results are compared with the Global Land Data Assimilation System (GLDAS) model and the Gravity Recovery and Climate Experiment (GRACE) data: while the temporal evolution of the three products, when averaged over the study area, is similar, the spatial distributions are different. This is likely due to the fact that GLDAS only takes surface water into account, and GRACE has a too-coarse spatio-temporal resolution.
Our results show that multi-year changes in water storage can be effectively monitored both in terms of temporal evolution and spatial distribution using space geodetic measurements, such as GNSS. This approach eliminates the need to rely solely on large-scale models or satellite measurements, which cannot reach the spatial resolution required at the scale of river basins such as the Po.

How to cite: Pintori, F. and Serpelloni, E.: Drought‐Induced Vertical Displacements and Water Loss in the Po River Basin (Northern Italy) From GNSS Measurements, EGU General Assembly 2024, Vienna, Austria, 14–19 Apr 2024, EGU24-12650, https://doi.org/10.5194/egusphere-egu24-12650, 2024.

Since the beginning of the precision satellite altimeter era in the early 1990s, efforts have been focused on computing the mean height of the ocean surface for use in various geodetic and oceanographic studies. With 30 years of satellite measurements now available, it is time to rethink how we model the mean sea surface (MSS) in the era of climate change.

There are linear changes in the height of the ocean surface due to melting ice and increasing ocean heat content that will not average to zero when computing the mean. Today, there are places in the ocean that are 15 cm higher than they were at the start of the altimetric era some 30 years ago. Today, conventional MSS models like CLS15/22 or DTU15/21 are roughly 5 cm lower than what is observed by present-day satellites like Sentinel6-MF.

We propose that linear sea level changes are estimated simultaneously and consistently with the mean sea surface computation and added to the definition of the MSS, which is tied to a particular date in time. This is possible because the MSS are tied to the 2003.01.01 period for the DTU MSS models. 

We also investigated the acceleration of sea surface height but found these small and still unstable [Nerem et al., 2018]. We also found that these are still somewhat dependent on the Side A correction of the TOPEX mission. We conclude that a longer time series is needed before a stable map of the accelerations can be computed and applied.

There is considerable evidence that using a 30-year trend pattern in sea surface height is stable and is driven by the “forced response” of Greenhouse gases and aerosols. These patterns will be reasonably persistent as we move forward in time.

Testing a new DTU23MSS mean surface tailored to the year 2023 to our processing of the recently available 2023 SWOT data, we find this new DTU23MSS reduces the spatial variability of the SWOT data which is important to the processing and particularly the roll-error correction applied to the 2D SWOT sea surface height data. Applying the new DtU21MSS to conventional satellites like Sentinel-3A/B and 6 reduces both offset and spatial variability of the data indicating that the new MSS is actually very close to a “present-day mean”


How to cite: Andersen, O. B., Nerem, S., and Nielsson, B.: Consistent Mean Sea Surface and sea level change estimation in the Era of Climate Change – application to SWOT processing. , EGU General Assembly 2024, Vienna, Austria, 14–19 Apr 2024, EGU24-12785, https://doi.org/10.5194/egusphere-egu24-12785, 2024.

EGU24-13313 | ECS | Posters on site | G3.1

On the uncertainty of the uncertainty of long-term trends derived from geophysical and climate time series 

Kevin Gobron, Paul Rebischung, Roland Hohensinn, Janusz Bogusz, and Anna Klos

Quantifying the uncertainty associated with parameter estimates is crucial for a wide range of geophysical and climate applications. This is particularly important for interpreting the long-term trends of quantities of interest, such as ground displacement, sea level, and water storage (among others), estimated from geophysical time series. Unfortunately, our imperfect understanding of measurement error sources and of the intrinsic stochastic behavior of the quantities of interest often makes it difficult to realistically assess the uncertainty of long-term trend estimates. 

One pragmatic approach to obtaining realistic trend uncertainties is to model all the stochastic variations observed in the time series (that is, the “noise”) by stochastic processes, and then derive the trend uncertainty using the variance propagation law. In practice, such noise models often include unknown stochastic parameters controlling, e.g., the amplitudes or time correlations of the stochastic processes, which need to be estimated from the observations. Estimated stochastic parameters, however, come with uncertainty, just like any estimated quantity. And an uncertainty on the parameters of the noise model implies an uncertainty on the long-term trend uncertainty based on that noise model. In view of trend analysis from geophysical and climate time series data, the importance of considering such “uncertainty on the uncertainty” remains so far to be investigated.

In this study, we address this issue by assessing, using numerical simulation, how the uncertainty of stochastic models derived from sparse geophysical time series (a few hundred data points) translates into the uncertainty of long-term trend uncertainty estimates. We demonstrate that uncertainty in the time-correlation structure can result in significant uncertainty on trend uncertainty estimates. We then discuss the impact of such “uncertainty on the uncertainty” on the assessment of long-term trend significance from geodetic time series and provide recommendations on how to deal with the issue in practice.

How to cite: Gobron, K., Rebischung, P., Hohensinn, R., Bogusz, J., and Klos, A.: On the uncertainty of the uncertainty of long-term trends derived from geophysical and climate time series, EGU General Assembly 2024, Vienna, Austria, 14–19 Apr 2024, EGU24-13313, https://doi.org/10.5194/egusphere-egu24-13313, 2024.

EGU24-14224 | ECS | Orals | G3.1

Climate Change Studies through SWOT Phenomenology Research 

Jessica Fayne

Climate change is driving extreme spatial and temporal variability in surface water resources. This is particularly important for lake and wetland features, which have been under-characterized on the global scale. This under-characterization is largely due to the complex structural properties of these surfaces relative to available remote sensing data.  

The Surface Water and Ocean Topography Mission, as the first-of-its-kind 2D mapping and satellite interferometer using Ka-band SAR, was developed for mapping water surface extents and water surface elevations, providing a significant improvement in how we characterize and monitor surface water. Because of the novelty of the Ka-band SAR data for surface mapping, there have been limited studies of additional utilities SWOT can provide to complement water surface extent and elevation observations.  

First-look images from SWOT over Toulouse, France and Long Island, New York, USA, revealed strong signal returns over non-water surfaces, including agricultural fields and urban regions. Subsequent images highlighted by the SWOT Science Team also demonstrated wind-driven water surface signal variability, akin to NASA-JPL airborne AirSWOT investigations.  

This project provides early assessments of SWOT phenomenology for estimating characteristics that could contribute to novel datasets, such as wind speed, wind direction (for long wave formations), vegetation moisture, vegetation structure, and land surface moisture fraction. This work provides the foundation for a multi-year study to further develop the Ka-band Phenomenology Scattering Model (KaPS), and the wind model Ka-SWOT Model (Ka-SMOD), and will additionally discuss necessary reference datasets, models, and in-situ sampling necessary to complete this these assessments.

This project will increase the utility of the SWOT mission for studying diverse water and land features and significantly improve our understanding of fine-scale terrestrial hydrology. Given the relatively short temporal availability of the preliminary SWOT data, this work will focus on spatial variability across global sites, within the fast-sampling orbit, for observations taken for available dates in 2023. This preliminary analysis of the spatial and temporal variability of SWOT-derived phenomena aims to demonstrate how SWOT can be used in novel ways to study climate change. 

How to cite: Fayne, J.: Climate Change Studies through SWOT Phenomenology Research, EGU General Assembly 2024, Vienna, Austria, 14–19 Apr 2024, EGU24-14224, https://doi.org/10.5194/egusphere-egu24-14224, 2024.

EGU24-14655 | Orals | G3.1

The Big Soak:  Change in Water in 2023 in North America's Pacific Mountain System  

Donald Argus, Hilary Martens, Wiese David, Swarr Matthew, Borsa Adrian, Peidou Athina, Nicholas Lau, Dain Kim, Kevin Gaastra, Matthias Ellmer, Zachary Young, Ellen Knappe, Noah Molotch, Sarfaraz Alam, Felix Landerer, Payton Gardner, and Reager John

We are strengthening the application of GPS's capability to estimate change in total water using measurements of elastic displacements of Earth's surface; breaking down total water into its components such as snow, soil moisture, and groundwater; and integrating GRACE gravity data to infer change in total water in groundwater basins.

In California's Sierra Nevada, GPS each day tracks the dumping and dissipation of storm water.  In Water Year 2023, total water increased abruptly during each of two sequences of snow-dominated atmospheric rivers.  Subsurface water, which we take to be total water inferred from GPS minus snow water equivalent, to rise in early January at the time of the first AR sequence, remain constant from late Jan through March (with no increase during the second AR sequence), and rise from April to June as the snowpack melts.  Subsurface water increases in the Sierra Nevada by 0.6 m from Oct 2022 to Jun 2023, 45 per cent of cumulative precipitation of 1.4 m.  Such a big rise in subsurface water begins to rejuvenate the Sierra Nevada critical zone (Earth's living outer layer between the top of the trees and the bottom of groundwater) and to replenish subsurface water lost during the prior 3 years of drought from 2020 to 2022.

Change in total water in California's Central Valley can be determined neither by GRACE alone nor GPS alone.  There GPS records primarily Earth's poroelastic response, from which water change is difficult to infer.  GRACE cannot distinguish water change in Central Valley from water change in the Sierra Nevada without assuming a hydrology model.  We integrate GPS elastic displacements and GRACE gravity to estimate water change in the Central Valley.  In the rigorous inversion, GPS determines water change in the Sierra Nevada and Coast Ranges and the remaining water change from GRACE is placed in the Central Valley.  We find Central Valley groundwater increased by 0.75 m in the first nine months of Water Year 2023 (the biggest gain ever recorded), replenishing more groundwater than lost during the prior 3 years of drought.

How to cite: Argus, D., Martens, H., David, W., Matthew, S., Adrian, B., Athina, P., Lau, N., Kim, D., Gaastra, K., Ellmer, M., Young, Z., Knappe, E., Molotch, N., Alam, S., Landerer, F., Gardner, P., and John, R.: The Big Soak:  Change in Water in 2023 in North America's Pacific Mountain System , EGU General Assembly 2024, Vienna, Austria, 14–19 Apr 2024, EGU24-14655, https://doi.org/10.5194/egusphere-egu24-14655, 2024.

EGU24-14952 | ECS | Posters on site | G3.1

Impact of Climate Change and Terrestrial Water Storage on the Himalayan Seismicity  

Sukanta Malakar and Abhishek K. Rai

The Himalayan terrain epitomises continuing convergence and geodetic deformation caused by tectonic and non-tectonic factors. Climate change and induced secondary factors are some of the dominant non-tectonic forces. A small change in stress and pore-fluid pressure caused by precipitation and temperature fluctuations may trigger seismic activity in the vicinity of already critically stressed faults and fractures at local and regional scales. The increase in temperature has also resulted in the melting of mountain glaciers in the Himalayan region and the release of the glacial load, leading to post-glacial rebound and elastic deformation. This study investigates the correlation and causal relationship between climatic parameters and earthquakes in the Himalayas. Further, we study the hydrological loading effect (derived from the GRACE/GRACE-FO satellite) and correlate it with the seismic hazard map. The results show that temperature anomalies have a relatively strong influence (r ~0.36-0.54) on the occurrence of minor-magnitude earthquakes in the Eastern Himalayas. However, the North-western Himalayas show a moderately positive correlation with precipitation anomalies (r ~0.23-0.37). Furthermore, a positive correlation has been found between regional terrestrial water storage (TWS) influence and the seismic hazard, ranging from 0.04-0.45. The result shows higher positive correlation values in the post-monsoon period for the North-western and Eastern Himalayas, whereas the Central Seismic Gap and Eastern Nepal and Sikkim show a higher value for the pre-monsoon period.

How to cite: Malakar, S. and Rai, A. K.: Impact of Climate Change and Terrestrial Water Storage on the Himalayan Seismicity , EGU General Assembly 2024, Vienna, Austria, 14–19 Apr 2024, EGU24-14952, https://doi.org/10.5194/egusphere-egu24-14952, 2024.

EGU24-15227 | Orals | G3.1

Homogenization of GNSS IWV time series and estimation of climatic trends 

Olivier Bock, Ninh Khanh Nguyen, and Emilie Lebarbier

Water vapor plays a key role in the Earth's climate as a dominant greenhouse gas. It is also the most efficient actor of heat transfer from the surface to the atmosphere and from low to high latitudes which shapes the global atmospheric circulation and weather systems. Monitoring and understanding the spatial and temporal variability and changes of water vapor are thus of crucial importance.

This work aims at computing decadal trends of total column Integrated Water Vapour (IWV) from a global network of ground-based GNSS observations. Although GNSS observations are available with high accuracy in all weather conditions, it has been shown that, over long periods of time, changes in instrumentation, in station location and environment, and in processing methods can introduce spurious shifts in the IWV time series and bias trend estimates. Homogenization is a crucial step to detect and correct such non-climatic signals.

We have developed a relative homogenization method which involves three steps.

  • Segmentation. First, change-points are detected from the difference series (GNSS – reference) with the help of the GNSSseg segmentation package (Quarello et al., 2022). The method uses a difference series in order to cancel out the common climatic variations. It also accounts for changes in the variance on fixed intervals (monthly) and a periodic bias (annual) due to representativeness differences between GNSS and the reference (in our case the ERA5 reanalysis). Because the change-points detected in the difference series could be either due to GNSS or to the reference (ERA5), the next step is the attribution.
  • Attribution. Second, the detected change-points are attributed to either GNSS or to the reference (ERA5) using a statistical test based on linear regression and a predictive rule based on the Random Forest learning algorithm (Nguyen et al., 2023). This step requires additional neighbors stations (at least one).
  • Correction. The last step is the correction. Here the initial GNSS series is corrected only for the shifts which are attributed to the GNSS in the second step.

We will present results of the homogenization procedure applied to a global network of GNSS stations and discuss the impact of homogenization on linear trend estimates for stations that have more than 20 years of observations.

Quarello et al., 2022, https://doi.org/10.3390/rs14143379

Nguyen et al., 2023, https://hal-obspm.ccsd.cnrs.fr/IGN-ENSG/hal-04014145v1

How to cite: Bock, O., Nguyen, N. K., and Lebarbier, E.: Homogenization of GNSS IWV time series and estimation of climatic trends, EGU General Assembly 2024, Vienna, Austria, 14–19 Apr 2024, EGU24-15227, https://doi.org/10.5194/egusphere-egu24-15227, 2024.

EGU24-15647 | ECS | Posters on site | G3.1

Spatio-temporal analysis of the ice mass changes over Greenland from GRACE and GRACE-FO. 

Florent Cambier, José Darrozes, Muriel Llubes, Lucia Seoane, and Guillaume Ramillien

Prediction of the trends of ice mass loss in Greenland can help for understanding what occurred during the last 20 years and in the future. The Level-2 GRACE and GRACE-FO solutions provided by the official computing centres CSR and ITSG as well as the combined products of the COST-G project give access to the spatio-temporal variations of the ice mass balance of Greenland from 2002 to present. We first reduce the GRACE data from post-glacial rebound. We propose to analyse these solutions by applying Singular Value Decomposition (SVD) and Empirical Mode Decomposition (EMD) to extract the trend. This trend is then removed from the timeseries for the Fast Fourier Transform (FFT) and 1-D Continuous Wavelet Transform (CWT) analysis. CWT and FFT analysis enable to unravel the long-term trend of the ice loss ranging from 6-9 years, as well as the annual and semi-annual part. The period of 6 to 9 years shows some correlation with meteorological and climate indexes such as North Atlantic Oscillation (NAO). The spatial component of the first SVD mode indicates that the ice melting is the most important along the west and southeast coast at the rate of -30 to -40 Gt/yr. Globally, the trend is not linear, it consist of different phases of acceleration and deceleration with rates between -60 and -340 Gt/yr.

How to cite: Cambier, F., Darrozes, J., Llubes, M., Seoane, L., and Ramillien, G.: Spatio-temporal analysis of the ice mass changes over Greenland from GRACE and GRACE-FO., EGU General Assembly 2024, Vienna, Austria, 14–19 Apr 2024, EGU24-15647, https://doi.org/10.5194/egusphere-egu24-15647, 2024.

EGU24-16124 | ECS | Orals | G3.1

ACC Volume Transport: A Geodetic Analysis via Satellite Data 

Juan Adrián Vargas Alemañy, Isabel Vigo Aguiar, David García García, and Ferdous Zid

Geostrophic currents, driven by the Coriolis and pressure gradient forces, are crucial for understanding ocean circulation. The Antarctic Circumpolar Current (ACC) in the Southern Ocean, encircling Antarctica, has substantial global impact, and its volume transport (VT) remains challenging to measure. We utilize satellite data, combining Altimetry and Gravity Satellite missions, to estimate VT within the ACC. Our study offers a comprehensive spatial and temporal analysis, encompassing barotropic and baroclinic VT components. We validate our results with in-situ measurements from the Drake Passage. Our analysis reveals a steady spatial VT of 210.44 ± 3.4 Sv, with maxima near critical choke points. Temporally, we identify a mean VT of 15.86 ± 0.05 Sv per 1º grid cell, a linear trend of -0.007 ± 0.002 Sv per month, and significant seasonal and biannual signals. Zonal VT predominantly influences total VT, while meridional VT remains near zero. The baroclinic component drives low-frequency variations, while the barotropic component controls high-frequency variations. We propose a specific ACC zonal VT of 201.63 ± 0.71 Sv. In summary, our satellite-based approach offers valuable insights into ACC VT. This methodological extension enhances our understanding of the ACC's ocean circulation dynamics, showcasing the utility and robustness of satellite data in oceanographic research.

How to cite: Vargas Alemañy, J. A., Vigo Aguiar, I., García García, D., and Zid, F.: ACC Volume Transport: A Geodetic Analysis via Satellite Data, EGU General Assembly 2024, Vienna, Austria, 14–19 Apr 2024, EGU24-16124, https://doi.org/10.5194/egusphere-egu24-16124, 2024.

EGU24-16767 | Posters on site | G3.1

A seafloor deformation study using A-0-A pressure instruments and ocean models to contribute to the monitoring of the Mayotte volcanic crisis. 

Valerie Ballu, Yann-Treden Tranchant, Denis Dausse, and Laurent Testut

The sudden 2018 volcanic eruption offshore Mayotte, in the western Indian Ocean, demonstrated, once again, the crucial need for means to monitor telluric activity occurring on the seafloor and threatening coastal zones. In the Mayotte case, on-land GNSS stations were of primary importance to detect the subsidence induced by the emptying of a deep magma chamber (Peltier et al. 2022), however they are not adequate to properly characterize and monitor the deformation created by further offshore or shallower processes.

Ocean bottom pressure (OBP) records can be used to monitor seafloor motion. However, detecting small or slow deformation is challenging due to instrumental drift and oceanic variations at different timescales. New Ambient-Zero-Ambient (A0A) pressure systems allow the estimation of the instrumental drift in situ by periodic venting from ocean pressures to a reference atmospheric pressure (Wilcock et al., 2021) and therefore allow access to the accurate monitoring of slow deformation. A A0A drift-controlled pressure gauge has been deployed since 2020 (four successive deployments) to monitor the seafloor vertical deformation on the flank of Mayotte island. The deployment site is located within a seismically active circular-shape zone, called the proximal cluster (Lavayssière et al., 2022). During the last deployment (2022-2023), an additional reference instrument was installed outside the proximal cluster, to allow for differential deformation analysis.

Beside volcanic activity monitoring, the objective of this study is to assess the performance of these new A0A pressure gauges and our ability to reduce the oceanic “noise” in corrected OBP records and characterize seafloor deformation in the Mayotte region. We investigate the use of numerical models, including available global ocean circulation reanalyses (OGCMs) and barotropic simulations, to account for the different oceanic processes contributing to the seafloor pressure variations and therefore limiting our ability to identify crustal deformation in the integrated pressure records.

We also use temperature and salinity profiles from repetitive glider transects to validate OGCMs in the region and quantify the contribution of unresolved fine-scale processes to OBP records. Our results provide valuable insights into the feasibility of using numerical modeling for improving the accuracy of OBP-based monitoring at different timescales, in the context of the Mayotte seismic crisis as well as for other seafloor deformation monitoring. Finally, we present a preliminary work on the combination of sparse regional altimetric data with the glider observations to compute a seafloor pressure series to be compared to the recorded data. Current altimetry spatio-temporal coverage is limited, however, newcoming SWOT observations are likely to provide new perspectives in seafloor geodesy.

Our results bring insights for future A0A deployments, especially in the perspective of the planned MARMOR seafloor cabled observatory offshore Mayotte.

How to cite: Ballu, V., Tranchant, Y.-T., Dausse, D., and Testut, L.: A seafloor deformation study using A-0-A pressure instruments and ocean models to contribute to the monitoring of the Mayotte volcanic crisis., EGU General Assembly 2024, Vienna, Austria, 14–19 Apr 2024, EGU24-16767, https://doi.org/10.5194/egusphere-egu24-16767, 2024.

EGU24-16813 | Orals | G3.1

Global mean and local sea level budget from updated observations andresiduals analysis (SLBC_cci+ project) 

Marie Bouih, Anne Barnoud, Robin Fraudeau, Gilles Larnicol, Anny Cazenave, Benoit Meyssignac, Alejandro Blazquez, Martin Horwath, Thorben Döhne, Jonathan Bamber, Anrijs Abele, Stéphanie Leroux, Nicolas Kolodziejcyk, William Llovel, Giorgio Spada, Andrea Storto, Chunxue Yang, Sarah Connors, Marco Restano, and Jérôme Benveniste and the SLBC_cci+ team

The closure of the Sea Level Budget (SLB) at monthly, yearly, and interannual scales, with the utmost precision, remains a fundamental challenge in modern physical oceanography. Firstly, this closure is crucial to assert that all major contributors to sea level variability are accurately identified and quantified. Secondly, it serves as a valuable means for cross-validating complex global observation systems, such as the Argo in-situ network, satellite gravimetry missions GRACE/GRACE-FO, and the satellite altimetry constellation, while closely monitoring their performances. Thirdly, this closure proves to be an effective approach for testing the consistency of various observed variables within the climate system, including sea level, ocean temperature and salinity, ocean mass, land ice melt, and changes in land water storage, in accordance with conservation laws, notably those governing mass and energy.

In this presentation, we will share the latest results obtained for the sea level budget, including 1) an up-to-date estimate of the global mean budget closure from 1993 to 2022; 2) advancements in the analysis of regional patterns of each component of the budget, as well as of the budget residuals, allowing the identification of regions where the SLB does not close, with a focus on the North Atlantic and the Arctic Ocean where the residuals are significantly high. When and where the SLB closes, we can interpret the causes of the total sea level variations. The analysis at regional scales allows us to assess the relative importance of the individual components all over the oceans. When the SLB does not close, we investigate in each component the potential errors causing non-closure (e.g., in-situ data sampling, geocenter correction in gravimetric data) and how potential inconsistencies in their processing can impact large-scale patterns (e.g., geocenter and atmosphere corrections).

Future works will address questions related to the structural deficiency of the observing system, inconsistent effective resolution across different observing subsystems (in-situ data, satellite gravimetry, and satellite altimetry), potential measurement errors in a single observing subsystem, and the isolation of errors in terms of time and space. To address these questions, we will assess an SLB using synthetic components derived from oceanic models. This novel approach will enable us to estimate the spatial and temporal resolutions inherent in each observation, thereby enhancing the estimation of their respective uncertainties. We will also analyse the signature of internal climate variability on sea level budget components interannual changes, by using state-of-the-art model simulations and reanalyses.

This work is performed within the framework of the Sea Level Budget Closure Climate Change Initiative (SLBC_cci+) programme of the European Space Agency (ESA).

How to cite: Bouih, M., Barnoud, A., Fraudeau, R., Larnicol, G., Cazenave, A., Meyssignac, B., Blazquez, A., Horwath, M., Döhne, T., Bamber, J., Abele, A., Leroux, S., Kolodziejcyk, N., Llovel, W., Spada, G., Storto, A., Yang, C., Connors, S., Restano, M., and Benveniste, J. and the SLBC_cci+ team: Global mean and local sea level budget from updated observations andresiduals analysis (SLBC_cci+ project), EGU General Assembly 2024, Vienna, Austria, 14–19 Apr 2024, EGU24-16813, https://doi.org/10.5194/egusphere-egu24-16813, 2024.

EGU24-17367 | Orals | G3.1

Assessing daily to interannual geocenter motion variations from Low Earth Orbiters 

Alexandre Couhert, Flavien Mercier, John Moyard, and Pierre Exertier

The ever-changing fluid mass (oceans, continental water, snow, atmosphere, …) redistributions on the Earth's surface give rise to a motion of the deformable terrestrial crust, that is its geometrical center-of-figure (CF), with respect to the center-of-mass (CM) of the Earth, about which satellites naturally orbit. This motion, called “geocenter motion”, is the largest scale variability of mass within the Earth system. Yet, non-tidal geocenter motion, which reflects major water and atmosphere mass transports occurring over large regions, is traditionally neglected.

However, new climate-driven precise monitoring of geocenter motion is needed. Indeed, satellite altimetry and gravimetry precise orbits connect sea level and global water budgets to the Earth’s center of mass. As such, the geocenter motion is now the leading error term in Regional Mean Sea Level and mass changes over polar ice sheets estimates. Reliable solutions of geocenter motion are thus crucial for assessing the current status of climate change and its future evolution (e.g., for the Earth’s Energy Imbalance).

Global Navigation Satellite Systems (GNSS) measurement models and derived products are currently aligned to the International Terrestrial Reference Frame (ITRF) origin (which is referenced to the crust), instead of CM. Looking at sub-daily cross-track perturbations estimated with the GNSS receivers on board the Jason-3 and Sentinel-6 MF altimetry satellites during their tandem phase (December 18, 2020 – April 7, 2022) revealed consistent diurnal oscillations with an impressive temporal resolution. These could only be related to the miscentering effect of the constellation solution around the Earth’ CM. In this paper, a parametric model is derived, representing the translation of the GNSS ground station networks with respect to the center of mass of the whole Earth system. This model is estimated with GNSS-based low Earth satellite precise orbits and unambiguously validated with independent altimetry satellite missions (e.g., Sentinel-3A, Sentinel-6 MF, Jason-3). It helps to clearly identify interannual variations in the geocenter motion, as short as a day long.

How to cite: Couhert, A., Mercier, F., Moyard, J., and Exertier, P.: Assessing daily to interannual geocenter motion variations from Low Earth Orbiters, EGU General Assembly 2024, Vienna, Austria, 14–19 Apr 2024, EGU24-17367, https://doi.org/10.5194/egusphere-egu24-17367, 2024.

EGU24-18031 | Posters on site | G3.1

Inferring North Atlantic Deep Water Transports from Ocean Bottom Pressure at the Western Boundary 

Maik Thomas, Linus Shihora, and Henryk Dobslaw

Estimating oceanic transports of volume, heat, carbon, and freshwater is fundamental to understanding the ocean’s role in the evolving climate system. Unique in this context is the Atlantic Meridional Overturning Circulation (AMOC) that comprises a net northward transport of relatively warm water at depths of ≲1 km throughout the Atlantic basin, compensated at ≳1–5 km by a colder net southward return flow.
While in-situ measurements, such as the RAPID array at 26.5°N, are considered the 'gold standard' to monitore changes in the AMOC, measurements at many latitudes and the detection of e.g. basin-wide modes are non feasible.
However, variations in the overturning are to a good degree accompanied by associated changes in oceanic bottom pressure which opens up new avenues of AMOC monitoring through bottom pressure recorders or even through future satellite gravimetry measurements. 

Here, we investigate the connection between changes in the Atlantic overturning and associated variations in bottom pressure along the western continental shelf in a suite of ocean models. This includes high resolution simulations from a CMIP6 FESOM run by AWI, the regional VIKING20X model by GEOMAR. We investigate to what degree the transport variations can be inferred from bottom pressure signatures alone, limitations of the approach and especially how such signatures could be implemented into a future iteration of the ESA ESM. This would allow the inclusion the these transport-related OBP changes in dedicated simulation studies for future satellite gravimetry missions.

How to cite: Thomas, M., Shihora, L., and Dobslaw, H.: Inferring North Atlantic Deep Water Transports from Ocean Bottom Pressure at the Western Boundary, EGU General Assembly 2024, Vienna, Austria, 14–19 Apr 2024, EGU24-18031, https://doi.org/10.5194/egusphere-egu24-18031, 2024.

EGU24-18783 | Posters on site | G3.1

A New Knowledge Portal on Mass Transport Satellite Missions: www.globalwaterstorage.info 

Ulrike Sylla, Pia Klinghammer, Antonia Cozacu, Frank Flechtner, Henryk Dobslaw, Julian Haas, Eva Boergens, Josef Zens, and Jörn Krupa

Dedicated satellite gravity missions orbiting the Earth at very low altitudes have greatly improved our knowledge about mass transport processes. That includes the terrestrial water cycle, ice sheet and glacier dynamics, ocean mass variability, and changes deep within the solid Earth, like the adjustment in the upper mantle in response to massive deglaciations since the last ice age. Initiated with the original GRACE (Gravity Recovery and Climate Experiment) mission launched in 2002, the record of monthly gravity fields now spans 22 years and is still being extended by GRACE-FO which has been in orbit since 2018. To enhance the visibility of the missions within society and to inform about the various contributions of GRACE/GRACE-FO to various scientific fields, GFZ  is maintaining a new knowledge portal accessible via www.globalwaterstorage.info.

On the one hand, this new portal provides overview information on satellite technology, various geophysical applications, and the numerous industrial and scientific partners who were vital for the success of the GRACE/GRACE-FO missions with the specific aim of informing European stakeholders. On the other hand, we also work towards developing the portal into a publicity channel for the gravimetry community to highlight recent developments towards future satellite missions or new research insights  based on mission data. International colleagues interested in advertising their latest achievements through a blog post (ca. 5000 characters) in the knowledge portal are kindly invited to contact globalwaterstorage@gfz-potsdam.de.

How to cite: Sylla, U., Klinghammer, P., Cozacu, A., Flechtner, F., Dobslaw, H., Haas, J., Boergens, E., Zens, J., and Krupa, J.: A New Knowledge Portal on Mass Transport Satellite Missions: www.globalwaterstorage.info, EGU General Assembly 2024, Vienna, Austria, 14–19 Apr 2024, EGU24-18783, https://doi.org/10.5194/egusphere-egu24-18783, 2024.

EGU24-21332 | ECS | Orals | G3.1 | Highlight

Mass Balance of Greenland and Antarctic Ice Sheets since the 1970s 

Athul Kaitheri, Ines Otosaka, and Andrew Shepherd

Ice sheets in Antarctica and Greenland have continued to undergo rapid changes since the 1970s causing a significant rise in global mean sea level. The Ice Sheet Mass Balance Inter-comparison Exercise (IMBIE) community has produced reconciled estimates of ice sheet mass changes for both ice sheets from the 1970s till 2021 by combining more than 50 independent mass balance estimates produced from varied satellite observations. Ice sheet mass changes are driven by competing processes due to their interaction with the atmosphere (surface mass balance) and ocean (ice dynamics). Here, we present an updated IMBIE assessment and partition mass trends into their surface mass balance (SMB) and ice dynamics components. This new assessment shows that Antarctica and Greenland contributed 29.3 mm to the global mean sea level between 1979 and 2021. While in Antarctica, almost all ice losses were driven by ice dynamical imbalance, we find that 60 % of Greenland’s ice losses were caused by increased ice discharge with reduced SMB accounting for the remainder. This exercise reveals the different drivers of Antarctica and Greenland mass changes and highlights their high interannual variability. Finally, we are aiming at producing reconciled regional ice sheet mass balance estimates for the main drainage basins of Antarctica and Greenland for the first time and will be presenting preliminary results for some of the key regions of the ice sheets that have been undergoing rapid changes. Partitioning mass trends and producing regional assessments will contribute to a better understanding of the remaining differences between the different satellite geodesy techniques employed within IMBIE and will provide a key dataset for both the Earth Observation and ice sheet modelling communities. 

How to cite: Kaitheri, A., Otosaka, I., and Shepherd, A.: Mass Balance of Greenland and Antarctic Ice Sheets since the 1970s, EGU General Assembly 2024, Vienna, Austria, 14–19 Apr 2024, EGU24-21332, https://doi.org/10.5194/egusphere-egu24-21332, 2024.

EGU24-1089 | ECS | Posters on site | CL4.5

Evaluation of Mesoscale Eddy-Ice Interaction in the Southern Ocean using High-Resolution Models 

Stephy Libera, Hugues Goosse, and Dian Putrasahan

Antarctic sea ice plays an important role in the global climate through its influence on local and global oceanic and atmospheric circulations, planetary radiative balance, and the crucial support it provides for Southern Ocean ecosystem. Understanding the physical processes influencing Antarctic sea ice, and the drivers of its change are therefore of broad interest. The sea ice–covered the Southern Ocean, has relatively weak stratification in the upper ocean, where a relatively thin halocline separates the cold winter mixed layer from significantly warmer ocean interior. When warmer waters from the ocean interior enter the mixed layer, it can melt sea ice at its base. Features in the upper ocean, like mesoscale eddies can impact the thermohaline structure and stratification in this region and can impact the heat delivered to the surface. However, the mesoscale dynamics in the polar regions, especially under sea ice cover, is little known due to the limited observations and the inability of many numerical models to resolve mesoscale processes in the high latitudes.   

This study aims to understand better the interaction between ocean mesoscale eddies and sea ice using high-resolution European Eddy RIch Earth System Models (EERIE) models. We investigate the effect of mesoscale eddies locally, and the integrated effect of eddy-sea ice interaction in the circumpolar Southern Ocean. Previous studies have identified eddy ice interactions to vary within regions of varying sea ice concentrations, such as in the high concentration pack ice and low-concentration marginal ice zones. The variations in the eddy-sea ice interaction in the Southern Ocean, within the open ocean, pack ice, and marginal ice zones are further investigated in this study.  

How to cite: Libera, S., Goosse, H., and Putrasahan, D.: Evaluation of Mesoscale Eddy-Ice Interaction in the Southern Ocean using High-Resolution Models, EGU General Assembly 2024, Vienna, Austria, 14–19 Apr 2024, EGU24-1089, https://doi.org/10.5194/egusphere-egu24-1089, 2024.

EGU24-1430 | Orals | CL4.5

Evaluation of the K-scale model hierarchy across MetOffice models. 

Claudio Sanchez, Huw Lewis, Richard Jones, James Warner, and Dasha Shchepanovska

Models resolving km-scale processes, such as deep convection, improve the representation of precipitation associated to several processes at sub-synoptic scales, e.g. diurnal cycle, mesoscale convective systems or tropical cyclones. These models generally improve extremes and add value to hazard forecasting, in particular over the tropics. However, these models have been unaffordable to run on a pseudo-global scale until recently and thus their impact in large scale processes is not well known.

Aiming to develop the next generation of Met Office weather and climate prediction systems, the UK K-scale project has been established to evaluate the technical challenges, the scientific improvements and the predictability benefits of km-scale models. The first step of the program is the development of a K-scale “model hierarchy”, a family of simulations across several resolutions and two scientific configurations under the same MetOffice Unified Modelling framework (MetUM). Such hierarchy comprises a generic global model at 12km resolution, realizations at different resolutions of the Cyclic Tropical Channel (CTC), which is a global model in the zonal with north and south boundaries at 26N and 44S respectively, and limited area models (LAMS) over several locations at 2.2km. The two scientific configurations are (i) a global-like aimed at global resolutions above 10km, which includes a parametrization of shallow and mid-level convection, and (ii) a regional-like aimed to km- and sub-km-scale LAM which does not parametrize convection at any level.

Our results from simulations of the 40-day DYAMOND summer and winter periods show than differences between global-like and regional-like configurations at the same resolution can be as large as differences between models at 12km and 4.4km resolution with the same configuration. When all convective processes are not parametrized in the whole tropics at km-scale resolution, the PDF of precipitation shift towards higher intensities, the diurnal cycle improves in several regions, and the wet and dry biases around the E-W boundaries of LAMs are reduced.

The African tropical easterly jet is represented differently across the simulations; with a stronger jet in global-like configurations with convective parametrization. A significant change in mean-state upper wind over the Indian Ocean has potential implications on both subsidence over East Africa, and wind shear over West Africa. These are both tied to widespread rainfall patterns over Africa.

Regional-like configurations at km-scale resolution capture the kinetic energy spectra slope -5/3, poorly represented by the global-like model at 12km. The uncertainty growth across the kscale hierarchy is explored with the use of a twin experiment methodology, and in particular the role of equatorial waves in the error growth across resolutions and science configurations.

How to cite: Sanchez, C., Lewis, H., Jones, R., Warner, J., and Shchepanovska, D.: Evaluation of the K-scale model hierarchy across MetOffice models., EGU General Assembly 2024, Vienna, Austria, 14–19 Apr 2024, EGU24-1430, https://doi.org/10.5194/egusphere-egu24-1430, 2024.

EGU24-2040 | ECS | Posters on site | CL4.5

The representation of tropical cyclones in high resolution coupled climate simulations 

Paolo Ghinassi and Paolo Davini

Tropical cyclones (TCs) are one of the most impactful weather phenomena on Earth. Their formation and development depends on small-scale processes like air-sea interaction and convection. These processes pose challenges for climate models since they are often misrepresented and act as sources of uncertainty. Additionally, TCs interact with both tropical and extratropical large-scale circulation, contributing to the upscale error propagation. The accurate representation of such physical processes in climate models therefore is crucial for the correct simulation not only of TCs but of the entire climate system. Until a few years ago, these small scale processes could not be resolved explicitly in traditional state-of-the-art coupled climate simulations due to a too coarse horizontal resolution. Nowadays that we are able to run climate simulations at a very high resolution (less than 10 km) and explicitly resolve such processes we expect to have a much more realistic representation of the intensity, frequency, and structure of TCs in climate models.

For this study, we consider data from the nextGEMS and Climate Digital Twin (part of the Destination Earth initiative) experiments (with an horizontal resolution up to 2.5 km), assessing model performance comparing them with both ERA5 reanalysis and with observational data sets such as IBTrACS to detect model biases. An algorithm for the detection and tracking of TCs based on the TempestExtremes library is used to detect and track TCs at first on a coarser resolution grid on a single time step (e.g., every 6 hours). Then, a series of variables at the original model resolution are saved in the vicinity of the TC centres, to allow examining their finer structure with an unprecedented level of detail. This diagnostic is part of the Application for Quality assessment and Uncertainty quAntification (AQUA) model evaluation framework developed within the Destination Earth project. Our analysis considers the TCs intensity (e.g. cyclones classification, wind pressure relationship), TCs structure (e.g. examining wind gusts and rain bands) and TCs temporal and spatial distribution (computing and analysing TCs trajectories). Preliminary results enlight the ability of these very high-resolution climate simulations to represent TCs features in a much more realistic way, especially close to the smallest resolved scales. Moreover, an increased horizontal resolution is beneficial to reduce model biases, enabling climate models to simulate TCs with a magnitude comparable to the observations.

How to cite: Ghinassi, P. and Davini, P.: The representation of tropical cyclones in high resolution coupled climate simulations, EGU General Assembly 2024, Vienna, Austria, 14–19 Apr 2024, EGU24-2040, https://doi.org/10.5194/egusphere-egu24-2040, 2024.

EGU24-2359 | ECS | Posters on site | CL4.5

Simulating the Earth system with interactive aerosols at the kilometer scale 

Philipp Weiss and Philip Stier

Aerosols originate from natural processes and human activities. They scatter and absorb radiation but also act as condensation nuclei in clouds. How these interactions influence the climate is still uncertain. New climate simulations at the kilometer-scale allow us to examine long-standing questions related to these interactions such as the complex effects on convective clouds. To perform kilometer-scale simulations with interactive aerosols, we developed the reduced-complexity aerosol module HAM-lite and coupled it to the climate model ICON-Sapphire. HAM-lite is based on and fully traceable to the complex aerosol module HAM. Aerosols are represented as an ensemble of log-normal modes with prescribed sizes and compositions.

We present first global simulations with ICON-Sapphire and HAM-lite at resolutions of about five kilometers and over periods of a few months. The sea surface temperature and sea ice are prescribed with boundary conditions of AMIP, and the initial conditions of the atmosphere and land are derived from the operational analysis of ECMWF. The aerosols are represented by two pure modes, one of dust and one of sea salt, and two internally mixed modes, both of organic carbon, black carbon, and sulfate. The first mixed mode represents aerosols from biomass burning emissions and the second mixed mode represents aerosols from anthropogenic and volcanic emissions.

The simulations capture key elements of the global aerosol cycle, of which some are missing entirely in coarse-scale simulations. For example, cold pool fronts drive intense dust storms over the Sahara and tropical cyclones interact with sea salt aerosols in the Pacific. We observe the transport of dust aerosols across the ocean, the wash out of sea salt aerosols by rain bands, and the updraft of biomass burning aerosols over land. We evaluate the observations with a combination of remote-sensing and in-situ data. We also compare the results to coarse-scale climate simulations. To understand processes like updraft by convection or deposition by rain, we examine the distribution of aerosols throughout the vertical column.

How to cite: Weiss, P. and Stier, P.: Simulating the Earth system with interactive aerosols at the kilometer scale, EGU General Assembly 2024, Vienna, Austria, 14–19 Apr 2024, EGU24-2359, https://doi.org/10.5194/egusphere-egu24-2359, 2024.

We propose a protocol for observational intensive intercomparison experiments of global storm-resolving models, targeting for evaluation by the EarthCARE satellite, the new satellite scheduled to be launched in May 2024. Previously, a month-long or 40-day simulation of an intercomparison of global storm-resolving models was conducted under the DYAMOND (the DYnamics of the Atmospheric general circulation Modeled On Non-hydrostatic Domains) project. Global storm-resolving models can simulate meso-scale systems in the global domain, and it has been shown that the month-long simulations under the DYAMOND project reproduce the evolution of meso-scale convective systems comparable to nature in many aspects. As a next step of the feasibility of the global storm-resolving models, two directions of the intercomparison experiments are considered. One is to extend the simulation time to cover a longer period, such as a one-year experiment with a seasonal march (Takasuka et al. 2024, in preparation). The other is to evaluate with intensive observations. Here, we propose a possible protocol for the short-term (a few weeks to a month) intercomparison experiment to evaluate GSRM results with observation by the EarthCARE satellite and the coordinated grand observation campaign called ORCESTRA.

The EarthCARE satellite will enable the world's first observations of Doppler velocities from space using radar. This groundbreaking capability allows for the observational understanding of global snow and raindrop falling velocities. In numerical climate and weather forecasting models, falling velocities of snow and raindrops have traditionally relied on empirical formulas based on fragmented observations, lacking comprehensive validation through global observations. These falling velocities have frequently been used as tuning parameters for numerical models. The falling velocity of upper-level clouds directly impacts radiation balance through variations in cloud amount. In contrast, the raindrop velocity influences the formation of cold pools and the organization of convective clouds. After obtaining Doppler velocity observations from the EarthCARE satellite, reliance on these falling velocities as tuning parameters becomes obsolete, introducing observational constraints. Conversely, altering these falling velocities from traditional prescribed values in numerical models leads to deviations in model climatology and equilibrium states from observations, necessitating refinement of other processes, which require the resolution of new compensatory errors. This presentation analyzes the characteristics of Doppler velocities using the global non-hydrostatic model NICAM and discusses the impact of snow and raindrops falling velocities. Specifically, utilizing the EarthCARE-like simulated data based on a global 220m mesh NICAM simulation, we aim to comprehend the global view of falling velocity characteristics and gain insights to analyze the EarthCARE satellite observational data.

How to cite: Satoh, M., Roh, W., and Matsugishi, S.: Proposal for an Intensive Short-term Intercomparison Experiment of Global Storm Resolution Models for Evaluation by EarthCARE Satellite Observations, EGU General Assembly 2024, Vienna, Austria, 14–19 Apr 2024, EGU24-3359, https://doi.org/10.5194/egusphere-egu24-3359, 2024.

EGU24-5731 | ECS | Orals | CL4.5

Identifying cloud objects in the km-scale earth system model ICON 

Vanessa Rieger, Paul Splechtna, and Aiko Voigt

Clouds crucially impact Earth’s climate. The distribution of clouds, horizontally and vertically, influences the radiative transfer through the atmosphere. Hence, to correctly compute the radiative transfer, it is important to understand the horizontal and vertical distribution of clouds.  Km-scale earth system models enable to resolve convection explicitly and offer the potential to represent cloud patterns more realistically. We investigate simulations of the earth system model ICON with a horizontal resolution of 5 km performed within the project nextGEMS. We identify cloud objects using connected component labelling. The method is applied to the vertically integrated cloud field as well as to the global three-dimensional cloud field. We analyse the distribution of cloud objects, their water and ice content as well as their fractal dimension on a global and regional scale. The choice of the threshold for identifying cloud objects strongly influences the analysis of the objects.

How to cite: Rieger, V., Splechtna, P., and Voigt, A.: Identifying cloud objects in the km-scale earth system model ICON, EGU General Assembly 2024, Vienna, Austria, 14–19 Apr 2024, EGU24-5731, https://doi.org/10.5194/egusphere-egu24-5731, 2024.

EGU24-6596 | ECS | Orals | CL4.5

Improved northern hemispheric atmospheric blocking properties in two storm-resolving climate models 

Edgar Dolores Tesillos and Olivia Martius

Atmospheric blocking and its associated extreme phenomena, such as hot and cold spells represent a risk to society. Current climate models struggle to simulate the atmospheric blocking properties, making it difficult to understand the underlying physical processes and raising uncertainty about their evolution under warming. Today, several climate models attempt to better resolve small-scale processes and have demonstrated their ability to convincingly simulate them; however, few studies have evaluated the impact of these tunings on large-scale flow.

Here, we investigate the representation of Atmospheric blocking characteristics in the two new generations of storm-resolving Earth-system models (nextGEMS), consisting of the Icosahedral Nonhydrostatic Weather and Climate Model (ICON) and the ECMWF Integrated Forecasting System (hereafter only IFS). These models are run at high horizontal resolution, ICON at 5 km (convective parameterization off) and IFS at 4.4 km and 28 km (convective parameterization on). Both models are fully coupled models with eddy-resolving ocean models. The five years of simulations are compared with the reanalysis ERA5 and one CMIP6 model (MPI-ESM1-2-LR). Atmospheric blockings are identified and tracked using a Lagrangian approach based on the geopotential height anomaly at 500 hPa. Properties such as intensity, size, and zonal speed are evaluated.

The nextGEMS showed an increased skill in reproducing atmospheric blocking at the system scale. Firstly, the Atmospheric blocking intensity, spatial extension, and zonal speed are closer to the ERA5 than the CMIP6 model. However, the block intensity and size in the IFS model are simulated better than in the ICON model, and its improvement increases at the finest resolution, 4.4 km. This improvement at higher resolution coincides with more precipitation upstream to the block center than at lower resolution during the onset phase. The latter is consistent with recent studies, indicating that increased moist processes contribute to stronger and bigger blocks. Thus, we provide insights into how the large-scale flow can benefit from the storm-resolving climate models by increasing their skill to simulate atmospheric blocking characteristics and the diabatic processes at higher resolution in a fully coupled system. A more comprehensive evaluation of the large-scale flow in the nextGEMS models will be performed with longer runs.

How to cite: Dolores Tesillos, E. and Martius, O.: Improved northern hemispheric atmospheric blocking properties in two storm-resolving climate models, EGU General Assembly 2024, Vienna, Austria, 14–19 Apr 2024, EGU24-6596, https://doi.org/10.5194/egusphere-egu24-6596, 2024.

EGU24-7170 | Orals | CL4.5

Projections of future climate changes from the cloud-permitting greenhouse warming simulations 

Sun-Seon Lee, Ja-Yeon Moon, Axel Timmermann, Jan Streffing, Tido Semmler, and Thomas Jung

Assessing the future risk of natural disasters, securing sustainable energy and water resources, and developing strategies for adapting to climate change remain challenging due to the large uncertainties in regional-scale climate projections. Recent efforts to address this issue include km-scale coupled climate model simulations that resolve mesoscale processes in the atmosphere and ocean, as well as their interactions with the large-scale environment and small-scale topographic features. Our presentation shows the first results from a series of global 9 km-scale greenhouse warming simulations using the AWI Climate Model Version 3 which is based on the OpenIFS atmosphere model at TCO1279 resolution and 137 vertical levels and the FESOM2 ocean model at 4-15 km resolution. By comparing a set of consecutive 10-year time-slice simulations forced by the CMIP6 SSP585 scenario with a transient simulation at a lower-resolution (31 km in the OpenIFS), we identify key differences in weather and climate-related phenomena, including tropical cyclones, ENSO, and regional climate change features that can be attributed to km-scale dynamics in clouds and atmospheric circulation patterns. The findings from our cloud-permitting climate simulations provide valuable insights into the role of small-scale processes in the sensitivity of the regional and global climate.

How to cite: Lee, S.-S., Moon, J.-Y., Timmermann, A., Streffing, J., Semmler, T., and Jung, T.: Projections of future climate changes from the cloud-permitting greenhouse warming simulations, EGU General Assembly 2024, Vienna, Austria, 14–19 Apr 2024, EGU24-7170, https://doi.org/10.5194/egusphere-egu24-7170, 2024.

EGU24-8254 | ECS | Orals | CL4.5

Demonstrating the potential of km-scale multi-annual coupled global simulations in nextGEMS: a (urban) surface perspective 

Xabier Pedruzo-Bagazgoitia, Tobias Becker, Sebastian Milinski, Thomas Rackow, Irina Sandu, Souhail Boussetta, Emanuel Dutra, Ioan Hadade, Joao Martins, Joe McNorton, Birgit Sützl, and Nils Wedi

The nextGEMS project is dedicated to develop global coupled earth-system models for multidecadal climate projections at a kilometre-scale resolution. By harnessing the strengths of high spatial resolution, the project seeks to improve the representation of physical processes and provide climate information at spatial scales that align with real-world measurements. Preparing for 30-year production runs, nextGEMS has achieved significant milestones, including the successful completion of five-year global coupled runs with a 5 km spatial resolution by two different Earth-System models: ICON, and ECMWF’s Integrated Forecasting System (IFS) coupled to the sea ice-ocean model FESOM. In this work we focus on the km-scale IFS-FESOM configuration, along with a comparable set of coarser IFS simulations coupled to either FESOM or NEMO ocean models.

We first provide a brief overview of the most relevant scientific modifications on IFS and FESOM through the development cycles needed to perform multi-annual simulations: a reduction of the global water and energy imbalance by orders of magnitude, as well as the modification in cloud physics parameters to provide a stable climate, improved coupling of ocean surface currents and fluxes, and the addition of improved high-resolution land use and land cover maps.

We further investigate the impact that the new refined surface maps have on the representation of climate at the surface and near-surface. We first explore the spatio-temporal surface-atmosphere coupling in these km-scale simulations. We then focus on more local phenomena: In particular, we pioneer the study of urban climate via coupled global multiannual simulations and explore surface-atmosphere interactions over urbanized areas, by combining refined land use/land cover maps with the active urban scheme in IFS. We find a more realistic spatial distribution of surface temperature in both urban and rural areas, especially noticeable at spatial resolutions of 9km and finer. By showing that the diurnal cycle of urban heat island intensity exhibits improved accuracy in numerous large European urban areas, our global simulations can provide local granularity at the scale of individual cities The enhancements in representing urban climate features are quantified through reduced bias, root-mean square error, and increased correlation with successively increasing model resolution.

How to cite: Pedruzo-Bagazgoitia, X., Becker, T., Milinski, S., Rackow, T., Sandu, I., Boussetta, S., Dutra, E., Hadade, I., Martins, J., McNorton, J., Sützl, B., and Wedi, N.: Demonstrating the potential of km-scale multi-annual coupled global simulations in nextGEMS: a (urban) surface perspective, EGU General Assembly 2024, Vienna, Austria, 14–19 Apr 2024, EGU24-8254, https://doi.org/10.5194/egusphere-egu24-8254, 2024.

EGU24-8565 | Orals | CL4.5

Ocean Eddy-rich Climate Simulation with IFS-FESOM 

Rohit Ghosh, Suvarchal K Cheedela, Nikolay Koldunov, Amal John, Jan Streffing, Vasco Müller, Sebastian Beyer, Thomas Rackow, Dmitry Sidorenko, Sergey Danilov, and Thomas Jung

Efforts to enhance climate model simulations by achieving higher resolutions to explicitly capture sub-grid scale processes constitute a central objective in contemporary climate modeling. In this pursuit, our focus is on resolving a pivotal element of the climate system—the ocean meso-scale eddies. At the Alfred-Wegener-Institute, we are working towards this objective by employing the ocean-sea ice model FESOM at approximately 5km horizontal resolution (NG5), coupled with the atmospheric model IFS at a 9km horizontal resolution (tco1279).

This presentation showcases preliminary results from the control simulations of IFS-FESOM under 1950 radiative conditions. Furthermore, we provide an initial glimpse into results from a historical simulation starting in 1950 with the same model configuration. Our analysis illuminates how ocean eddy-rich regions are portrayed in our simulations relative to observations. We delineate the changes and improvements in key climate components, encompassing North Atlantic/Southern Ocean temperatures, NAO, atmospheric blocking, midlatitude storm tracks, ENSO, Monsoon, ITCZ, Hadley/Walker Cells, MJO, meridional overturning, gyre circulations, as well as Arctic/Antarctic Sea ice dynamics under such high resolution.

Moreover, we endeavor to demonstrate how regional high-frequency weather and climate processes can be accurately represented in such simulations, including capturing the nature of regional extremes. In essence, our goal is to illustrate how advancing model resolution to resolve ocean eddies contributes to a more comprehensive representation of the climate system.


How to cite: Ghosh, R., Cheedela, S. K., Koldunov, N., John, A., Streffing, J., Müller, V., Beyer, S., Rackow, T., Sidorenko, D., Danilov, S., and Jung, T.: Ocean Eddy-rich Climate Simulation with IFS-FESOM, EGU General Assembly 2024, Vienna, Austria, 14–19 Apr 2024, EGU24-8565, https://doi.org/10.5194/egusphere-egu24-8565, 2024.

EGU24-8603 | Orals | CL4.5

Cloud-feedbacks in global km-scale earth system model simulations 

Ja-Yeon Moon, Sun-Seon Lee, Axel Timmermann, Jan Streffing, Tido Semmler, and Thomas Jung

Clouds are an important regulator of earth’s radiation balance. Therefore, future changes in clouds and corresponding feedbacks are likely to influence global climate sensitivity. How clouds respond to greenhouse warming on global and regional scales is still not well understood. Here we present first results from a km-scale, cloud-permitting greenhouse warming simulation conducted with the coupled OpenIFS-FESOM2 model (AWI-CM3) with ~9 km atmosphere resolution, 137 vertical levels and  4-15 km variable ocean resolution. Our analysis is based on a  set of 10-year time-slice simulations, which branched off from a lower-resolution (31 km) SSP585 transient scenario run with relatively high climate sensitivity. We will quantify the effect of atmosphere resolution and cloud granularity on cloud radiative feedbacks. We will further present results from the calculation of radiative kernels to determine the role of high cloud feedbacks in polar amplification. 

How to cite: Moon, J.-Y., Lee, S.-S., Timmermann, A., Streffing, J., Semmler, T., and Jung, T.: Cloud-feedbacks in global km-scale earth system model simulations, EGU General Assembly 2024, Vienna, Austria, 14–19 Apr 2024, EGU24-8603, https://doi.org/10.5194/egusphere-egu24-8603, 2024.

EGU24-9221 | ECS | Orals | CL4.5

Autocorrelation – A Simple Diagnostic for Tropical Precipitation in Global Kilometer-Scale Climate Models 

Dorian Spät, Aiko Voigt, Michela Biasutti, and David Schuhbauer

Tropical precipitation is the result of a complex interplay of processes across a wide range of atmospheric scales and is highly variable from place to place. A particularly interesting geographical pattern is obtained for the lag 1 autocorrelation of daily precipitation. Generally, this metric displays a relatively uniform distribution of positive values throughout the tropics. However, certain land regions, such as the Sahel, stand out due to exceptionally low autocorrelation values. These low values correspond to a dominance of high frequency precipitation events in the power spectrum.

In accordance with previous work, we show that CMIP6 climate models struggle to create a similar autocorrelation pattern. Global kilometer-scale models circumvent many of the shortcomings of the conventional coarse models, by resolving deep convection. We find that the two global kilometer-scale models developed as part of the nextGEMS project produce an autocorrelation pattern that is quite similar to the observations. These models also provide an opportunity to study the processes associated with the autocorrelation pattern.

We compare simulations with deep convection parameterization turned on and off to investigate how the parameterization scheme affects the autocorrelation pattern and the underlying power spectrum. Additionally, we perform a precipitation variance analysis based on filtering of convectively coupled equatorial waves to study the genesis of the autocorrelation pattern.

How to cite: Spät, D., Voigt, A., Biasutti, M., and Schuhbauer, D.: Autocorrelation – A Simple Diagnostic for Tropical Precipitation in Global Kilometer-Scale Climate Models, EGU General Assembly 2024, Vienna, Austria, 14–19 Apr 2024, EGU24-9221, https://doi.org/10.5194/egusphere-egu24-9221, 2024.

EGU24-10275 | ECS | Posters on site | CL4.5

Precipitation impacting upper-ocean currents: an analysis using a km-scale Earth System model 

Hans Segura, Angel Peinado, Swantje Bastin, Marius Winkler, Rodomyra Schevchenko, Ian Dragaud, and Divya Patruri

In this study, we assess the impact of precipitation on the ocean current acceleration using an Earth System model resolving deep convection and ocean eddies using a horizontal grid spacing of 5 km. Punctual studies using observations show that precipitation events with intensities higher than 24 mm d^-1 could impact the upper-ocean dynamics. Basically, the increase in buoyance flux equals half buoyancy resulting in the absorption of shortwave radiation (200 W m-2) under clear sky conditions. Due to the spatial sparse of observational sites, there is still the question of whether this number holds only in specific locations. With a grid spacing of 5 km, the simulation shows that precipitation events in the tropical Atlantic with a mean intensity greater than 20 mm d-1 impact tremendously in the stratification due to salinity in the upper ocean with two consequences. First, the mixed layer depth shallows, even in cases with strong wind forcing. Second, the momentum trapped in this shallow layer accelerates the surface currents. This is also accompanied by an increase in the turbulent kinetic energy in the mixed layer depth. These results point to the fact that precipitation, in particular in the deep tropics, could impact the upper ocean dynamic.

How to cite: Segura, H., Peinado, A., Bastin, S., Winkler, M., Schevchenko, R., Dragaud, I., and Patruri, D.: Precipitation impacting upper-ocean currents: an analysis using a km-scale Earth System model, EGU General Assembly 2024, Vienna, Austria, 14–19 Apr 2024, EGU24-10275, https://doi.org/10.5194/egusphere-egu24-10275, 2024.

EGU24-10935 | ECS | Orals | CL4.5

AQUA: a novel quality assessment tool for km-scale simulations in the Destination Earth Climate Digital Twin - the core framework 

Matteo Nurisso, Jost von Hardenberg, Silvia Caprioli, Supriyo Ghosh, Nikolay Koldunov, Bruno P. Kinoshita, Natalia Nazarova, Paolo Ghinassi, and Paolo Davini

Destination Earth (DestinE) is a major initiative by the European Commission aiming to create a highly accurate global digital twin of Earth. The Climate Adaptation Digital Twin in DestinE is an ambitious project of several different climate simulations at the km-scale producing a large amount of heavy dataset, difficult to access and analyse with standard data processing  pipelines. Each project and each model produces data that may differ in format (NetCDF, GRIB, Zarr), structure and metadata, leading to the necessity of tweaks and complex pipelines in order to prepare data for analysis.

We thus introduce AQUA, an Application for Quality assessment and Uncertainty quAntification. AQUA is composed of a core engine facilitating data access, combined with a series of modular and independent diagnostics to be run continuously to monitor and evaluate climate simulations. In this contribution we present the core engine and its features. 

Though many available suites already exist to analyse data from global climate models, AQUA has been specifically developed to deal with large km-scale datasets, with the goal of unifying and simplifying climate data access for all users. AQUA responds to the need for users to have the focus on the development of their data analysis, while datasets are found, retrieved and homogenised by an external tool to which they can connect their pipeline. 

Developed in Python, leveraging the power of Dask and Xarray libraries, AQUA prioritises efficiency through lazy data access. Noteworthy is the utilisation of cdo for one-time weight computation, enhancing performances in regridding and averaging operations. A key strength lies in its ability to handle high-resolution, high-frequency data, loading into memory only when necessary. AQUA not only unifies and simplifies climate data access for users but also addresses the crucial need for responsive feedback to climate model developers.

How to cite: Nurisso, M., von Hardenberg, J., Caprioli, S., Ghosh, S., Koldunov, N., P. Kinoshita, B., Nazarova, N., Ghinassi, P., and Davini, P.: AQUA: a novel quality assessment tool for km-scale simulations in the Destination Earth Climate Digital Twin - the core framework, EGU General Assembly 2024, Vienna, Austria, 14–19 Apr 2024, EGU24-10935, https://doi.org/10.5194/egusphere-egu24-10935, 2024.

EGU24-11230 | ECS | Orals | CL4.5

AQUA: a novel quality assessment tool for km-scale simulations in the Destination Earth Climate Digital Twin - the diagnostics suite 

Silvia Caprioli, Jost von Hardenberg, Paolo Ghinassi, Supriyo Ghosh, Lukas Kluft, Nikolay Koldunov, François Massonnet, Natalia Nazarova, Matteo Nurisso, Pablo Ortega, Susan Sayed, Tanvi Sharma, and Paolo Davini

Destination Earth (DestinE) is a major initiative by the European Commission aiming to create a highly accurate global digital twin of Earth. This model, supported by advanced high-performance computing and artificial intelligence, will monitor and simulate interactions between natural phenomena and human activities with unprecedented accuracy. Developed within the Climate Adaptation Digital Twin of the Destination Earth project, AQUA (Application for Quality assessment and Uncertainty quAntification) is a specialized model evaluation framework for running climate data diagnostics.

While existing diagnostic suites for global climate model data are already available, AQUA stands out by specifically addressing extensive kilometer-scale datasets, to simplify climate data access for all possible users. AQUA features two diagnostic families:

  • "state-of-the-art” diagnostics, which compare low-resolution data with observations to assess general model performance and to identify biases and drifts (performance indices, radiation budget, atmospheric global mean time series and biases, teleconnection indices, ocean circulation evaluation, tropical cyclones detection, tracking and zoom-in)
  • “frontier” diagnostics, which exploit new high-resolution (i.e., km-scale hourly) climate data to provide insight at climatological scales of physical/dynamical processes that could not be investigated before (sea surface height variability, tropical rainfall) 

Beyond offering a flexible and efficient framework for processing and analyzing large volumes of climate data, AQUA’s modular design offers the possibility of seamless integration of new diagnostic tools, with plans for further expansion in the future phases of the project.
In this contribution, we will introduce the current suite of AQUA diagnostics and outline its planned future developments.

How to cite: Caprioli, S., von Hardenberg, J., Ghinassi, P., Ghosh, S., Kluft, L., Koldunov, N., Massonnet, F., Nazarova, N., Nurisso, M., Ortega, P., Sayed, S., Sharma, T., and Davini, P.: AQUA: a novel quality assessment tool for km-scale simulations in the Destination Earth Climate Digital Twin - the diagnostics suite, EGU General Assembly 2024, Vienna, Austria, 14–19 Apr 2024, EGU24-11230, https://doi.org/10.5194/egusphere-egu24-11230, 2024.

EGU24-11656 | ECS | Posters on site | CL4.5

Climate storylines using the spectral nudged simulations with IFS-FESOM 

Amal John, Sebastian Beyer, Marylou Athanase, Antonio Sánchez Benítez, Helge Goessling, and Thomas Jung

We are presenting our efforts to incorporate spectral nudging capabilities into the development and assessment of model-driven storyline scenarios using a km-scale coupled climate model. Working within the framework of the EU’s Destination Earth project, we are working towards this objective by employing the ocean sea-ice model FESOM coupled with the atmospheric model IFS.

We showcase our preliminary results from the nudged runs of IFS-FESOM for the present day which will eventually lead the way into the storyline scenarios where the same winds would be imposed in different climates. We also show a glimpse of how the nudged simulations for the present-day climate serve to assess model quality against observations based on relatively short simulations, incorporating field campaign data like MOSAiC. In the future, these capabilities could be used to produce “storylines” that help to address the question of how recent extreme events would unfold in preindustrial, +1.5K, +2K, +3K and +4K climates.

Ultimately, our novel storyline scenarios have the potential to illustrate the impact of climate change on extreme events in a way that is more tangible and relatable and nicely complements the probabilistic approach. Since they are based on recent extreme events and explore probable variations in diverse plausible climates, these storylines establish a more profound connection to users' experiences. When these scenarios are presented to users it can foster discussions on future activities and necessary adaptation measures.

How to cite: John, A., Beyer, S., Athanase, M., Sánchez Benítez, A., Goessling, H., and Jung, T.: Climate storylines using the spectral nudged simulations with IFS-FESOM, EGU General Assembly 2024, Vienna, Austria, 14–19 Apr 2024, EGU24-11656, https://doi.org/10.5194/egusphere-egu24-11656, 2024.

The amplitude of precipitation extremes across Europe is expected to increase through the 21st century under most climate change scenarios. Current CMIP-style global climate models broadly project increased flooding and drought extremes; however, they often rely on parametrization schemes or downscaling methods for inferring about potential future extreme events. These methods often introduce errors leading to high levels of uncertainty for policymakers and infrastructure planning. The need for accurate extreme event projections became further evident after the July 2021 floods and summer 2022 record-breaking heatwaves and droughts across Western Europe.

The ongoing H2020 Next Generation Earth Modelling Systems (nextGEMS) project aims to address these issues with the development of storm-resolving, fully-coupled, Earth-system models. Using the latest Cycle 3 runs from the Integrated Forecast System from ECMWF and ICON from MPI-M, we examine the dynamical representation of extreme precipitation events across Europe and compare it against a suite of observations (station and satellite based), reanalysis datasets, and CESM2 simulations. Focusing on tail-end extremes, the results focus on the realism of high precipitation extremes, value of upscaling to CMIP6 resolution, representation of precipitation drivers, and dry extremes (dry day percentages and consecutive dry days). Overall, both ICON and IFS perform reasonably well in representing high precipitation extremes although issues related to the ICON non-parameterized, deep convection causes overly frequent precipitation events.

How to cite: Wille, J. and Fischer, E.: Representation of extreme precipitation events in storm-resolving global climate models within the nextGEMS project, EGU General Assembly 2024, Vienna, Austria, 14–19 Apr 2024, EGU24-11797, https://doi.org/10.5194/egusphere-egu24-11797, 2024.

EGU24-12427 | ECS | Posters on site | CL4.5

Km-scale climate simulations with IFS-FESOM 

Sebastian Beyer, Dmitry Sidorenko, Rohit Ghosh, Amal John, Thomas Rackow, Jan Streffing, Suvarchal Kumar Cheedela, Bimochan Niraula, Nikolay Koldunov, and Thomas Jung

Within the EU’s Destination Earth (DestinE) initiative we are developing a digital climate twin with km-scale resolution. This enables us to resolve physical processes that, so far, have only been represented by approximations. This core model setup (called digital twin engine)  is able to run multidecadal simulations for historic periods as well as different future scenarios in unprecedented resolution which will be used by decision makers.

In phase one of DestinE, our goal is to run a control simulation (under 1950 pre industrial conditions), a historic simulation from 1990 to 2020 and finally, projection simulations from 2020 to 2040. The control run will be performed with a global atmospheric resolution of 9km, while the projection simulations use 4km. The ocean component uses the unstructured NG5 mesh, which means an approximate resolution of 5km.

In this work we present the latest iteration of the IFS-FESOM model, the Integrated Forecasting System coupled to the Finite volumE Sea Ice-Ocean Model FESOM2. We explain its components and recent improvements, including  the integration of ECMWF’s IO-server and post processing toolkit multio into the FESOM2 component and the introduction of a novel runoff mapper. Preliminary results from our kilometre-scale simulations are shown and compared to preindustrial conditions, with the primary objective to quantify effects of a ~1K warming world.

How to cite: Beyer, S., Sidorenko, D., Ghosh, R., John, A., Rackow, T., Streffing, J., Cheedela, S. K., Niraula, B., Koldunov, N., and Jung, T.: Km-scale climate simulations with IFS-FESOM, EGU General Assembly 2024, Vienna, Austria, 14–19 Apr 2024, EGU24-12427, https://doi.org/10.5194/egusphere-egu24-12427, 2024.

Global nonhydrostatic models that cover the globe with a kilometer (km)-scale mesh have been developed by various organizations worldwide and are expected to be next-generation models that can explicitly calculate deep convective clouds. However, it is known that convective upward motions are not sufficiently represented at the km-scale resolution, and the mesh size of O(100m) is required to obtain convergence of upward motions. To understand the limitation of global km-scale models, we investigate the representation of cloud, precipitation, and circulation with the resolution in the global simulations between km-scale to sub-km-scales.

We conduct the global atmospheric simulations by the Nonhydrostatic Icosahedral Atmospheric Model (NICAM) for the mesh size of 3.5 km, 1.7 km, 870 m, 440 m, and 220 m using the Supercomputer "Fugaku."  The 3.5 km experiment started on August 1, 2016, the same day as DYAMOND-summer, and the next higher resolution was run using the lower resolution simulation results as initial conditions. We analyzed data on August 5, 2016. We conducted the global 220m simulation for 8 hours.

The resolution dependence of cloud, precipitation, and convection was investigated. Lower clouds decrease with increasing resolution. High cloud increased or decreased with respect to resolution depending on the turbulence scheme. The precipitation distribution and zonal mean humidity do not change significantly, but the precipitation intensity changes with resolution. For the grid spacing of less than km, it eliminates overconcentration of precipitation, and the rain area widens as the resolution becomes finer. The coarse-grained rainfall distribution is smoother in the sub-km scale model than in the km scale model. A finer scale convection core is reproduced in the sub-km scale model. Vertical wind speed at grid point scales increases with increasing resolution. However, when horizontally averaged over a few-degree grid, the vertical wind speed decreases, and the circulation becomes weaker with higher resolution. We found that the km-scale model may be creating large strong convection. Uncertainties resulting from the turbulence scheme also appear to be large in the km/sub-km models.

How to cite: Matsugishi, S., Ohno, T., and Satoh, M.: Differences in the cloud, precipitation, and convection representation between the global sub-km mesh simulation and km simulations, EGU General Assembly 2024, Vienna, Austria, 14–19 Apr 2024, EGU24-14676, https://doi.org/10.5194/egusphere-egu24-14676, 2024.

EGU24-15657 | ECS | Orals | CL4.5

Towards a global km-scale flood forecasting system 

Jasper Denissen, Gabriele Arduini, Ervin Zsoter, Cinzia Mazzetti, Christel Prudhomme, Shaun Harrigan, Gianpaolo Balsamo, Iria Ayan-Miguez, Peter Dueben, Irina Sandu, and Benoit Vanniere

River discharge has direct influence on the water-food-energy-environment nexus and can have devastating impacts during extreme events with rapid onsets such as floods. Floods often occur after extreme precipitation events, which are challenging to forecast accurately, both in time and space. Unresolved small-scale processes and features, including convection and orography, have a detrimental effect on precipitation and consequently hydrological forecast skill. This calls for a spatial resolution increase in Numerical Weather Prediction (NWP) models, including their land component.

The Destination Earth programme of the European Commission addresses this with globally coupled forecasts at spatial resolutions down to the km-scale with lead times of 5 days: the Digital Twin on Weather-Induced Extremes (EDT). These meteorological forecasts are used to force ECMWF’s Land Surface Modelling System (ECLand), the land component of the Integrated Forecasting System (IFS), to generate runoff. Subsequently, the river-routing scheme CaMa-Flood, effectively 1-way coupled to the IFS, is used to route runoff in rivers and to produce hydrological simulations. Essentially, CaMa-Flood will be part of the continuous component of the EDT, which in phase 2 of Destination Earth will provide daily high-resolution forecasts to monitor extreme events, such as floods, in real time. As river discharge acts as a natural integrator of the water cycle, CaMa-Flood can be used as a diagnostic tool to assess the hydrological response to increases in spatial resolution of the forcing and the river-routing network.

In this study, two data products are derived: i) long-term hydrological simulations forced by atmospheric analysis data (e.g. ERA5 or ECMWF operational analysis) and ii) hydrological forecasts (daily forecasts in June - July 2021 and January - February 2022 as well as selected flood cases). To assess their quality, these data are validated with point-observed river-discharge time series. Analysis shows that the long-term hydrological simulations benefit from spatial resolution increases in the meteorological forcing and to a lesser extent from spatial resolution increases in the river-routing network. This is evidenced by higher Kling-Gupta Efficiency (KGE), higher correlations and lower biases across 876 river stations in Europe. Further, hydrological forecasts also benefit from higher spatial resolution meteorological forcing, evidenced both by higher correlations of the continuous summer/winter forecasts against river discharge observations from 798 river stations across Europe and by more pronounced flood peak magnitude for selected flood cases. These results highlight the added value of high resolution for hydrological forecast accuracy.

How to cite: Denissen, J., Arduini, G., Zsoter, E., Mazzetti, C., Prudhomme, C., Harrigan, S., Balsamo, G., Ayan-Miguez, I., Dueben, P., Sandu, I., and Vanniere, B.: Towards a global km-scale flood forecasting system, EGU General Assembly 2024, Vienna, Austria, 14–19 Apr 2024, EGU24-15657, https://doi.org/10.5194/egusphere-egu24-15657, 2024.

Cloud microphysics are a prime example of processes that remain unresolved in atmospheric modelling with storm-resolving resolution. In this study, we explore how uncertainties in the representation of microphysical processes affect the tropical energy budget in a global storm-resolving model (SRM). We use the global SRM ICON with a one-moment or a two-moment microphysics schemes and do several sensitivity runs, where we vary one parameter of the applied microphysics scheme in its range of uncertainty. We find that the two microphysics schemes have distinct signatures, e.g., in how condensate is distributed among the different hydrometeor categories or in the intensity distribution of precipitation, but their tropical mean cloud fraction and total condensate profiles are rather robust. Precipitation efficiency sets the amount of condensate in the atmosphere and thereby links microphysical processes to the radiative properties of the atmosphere. Uncertainties in the representation of microphysical processes cause substantial spread in the top-of-the-atmosphere (TOA) energy balance. In agreement with the robustness of the cloud fraction, changes in the radiative balance at TOA are dominated by changes in the radiative properties of cloudy points. A shift towards higher cloud-ice concentrations in simulations with the two-moment microphysics scheme leads to more reflected shortwave radiation that is not fully compensated by less outgoing longwave radiation and results in a slight cooling of the atmospheric column. Overall, microphysical sensitivities at storm-resolving resolution are substantial and resemble part of the inter-model spread of a multi-model ensemble.

How to cite: Naumann, A. K., Esch, M., and Stevens, B.: How the representation of microphysical processes affects the tropical energy budget in a global storm-resolving model, EGU General Assembly 2024, Vienna, Austria, 14–19 Apr 2024, EGU24-16801, https://doi.org/10.5194/egusphere-egu24-16801, 2024.

EGU24-17906 | ECS | Orals | CL4.5

Multifractal analysis for evaluating the representation of clouds in global km-scale models 

Lilli Freischem, Philipp Weiss, Hannah Christensen, and Philip Stier

Clouds are one of the largest sources of uncertainty in climate predictions. Emerging next-generation km-scale climate models need to simulate clouds and precipitation accurately to reliably predict future climates. To isolate issues in their representation of clouds, and thereby facilitate their improvement, km-scale models need to be thoroughly evaluated via comparisons with observations.

Traditionally, climate models are evaluated using spatio-temporally averaged observations. However, aggregated evaluation loses crucial information about underlying physical processes, such as convective updrafts, and the resulting cloud macrophysical structures. We postulate that a novel spatio-temporal evaluation strategy using satellite observations provides direct constraints on physical processes.

Here, we introduce multifractal analysis as a method for evaluating km-scale simulations. We apply it to top-of-atmosphere outgoing longwave radiation (OLR) fields to investigate structural differences between observed and simulated clouds in the tropics. For this purpose, we compute structure functions from OLR fields to which we fit scaling exponents. We then parameterise the scaling exponents to compute scaling parameters. The parameters compactly characterise OLR variability and can be compared across simulations and observations. We use this method to evaluate the ICON-Sapphire and IFS-FESOM simulations run for cycle 3 of the nextGEMS project via comparison with data from the geostationary satellite GOES-16.

We find that clouds in both models exhibit multifractal scaling from 50 to 1000km. However, the scaling parameters are significantly different between ICON and IFS, and neither match observations. In the ICON model, multifractal scaling exponents are lower than in observations whereas in IFS, they are larger. The observed differences indicate how the modelling approaches in ICON and IFS impact the organisation of clouds. More specifically, the deep convection scheme in ICON is switched off completely whereas it is still active in IFS, which could explain the difference in scaling behaviour we observed.

Our results show that spatio-temporal analysis is a promising new way to constrain global km-scale models. It can provide key insights into model performance and shed light on issues in the representation of clouds.

How to cite: Freischem, L., Weiss, P., Christensen, H., and Stier, P.: Multifractal analysis for evaluating the representation of clouds in global km-scale models, EGU General Assembly 2024, Vienna, Austria, 14–19 Apr 2024, EGU24-17906, https://doi.org/10.5194/egusphere-egu24-17906, 2024.

In recent years, great efforts have been made to reduce the horizontal grid spacing of atmospheric models to a few kilometers to build so-called Global Storm-Resolving Models (GSRMs). However, the vertical grid spacings used in these models are generally of the same order of magnitude as those used in classical climate models with horizontal grid spacings of a few hundred kilometers. From previous sensitivity experiments with a variety of model types, from direct numerical simulations to these classical climate models, it is known that especially the simulation of clouds can strongly depend on the vertical model resolution. To test the importance of the vertical grid spacing in GSRMs we have performed simulations with the ICON atmospheric model at 5 km horizontal grid spacing and with between 55 and 540 vertical layers, corresponding to maximum tropospheric vertical grid spacings between 800 and 50 m.  

Here we present results of these simulations. They results show that for most of the variables considered, halving the vertical grid spacing by half has a less pronounced impact than halving the horizontal grid spacing, but the effect is not negligible. For example, for each halving of the vertical grid spacing, coupled with necessary reductions in the time step length, cloud liquid water increases globally by approximately 7%, while it decreases by roughly 16% when halving the horizontal grid spacing. Both the grid spacing and the time step contribute to these effects. Comparison of selected climate variables with observations shows that model biases are only in some cases reduced by higher vertical resolution, because of the dominance of model biases with other origins.

How to cite: Schmidt, H.: Exploring the impact of the vertical grid spacing for the climate simulated in a global storm-resolving model, EGU General Assembly 2024, Vienna, Austria, 14–19 Apr 2024, EGU24-18060, https://doi.org/10.5194/egusphere-egu24-18060, 2024.

EGU24-18483 | Posters on site | CL4.5

Eulerian and Lagrangian Perspectives on Mesoscale Air-Sea Interactions 

Dian Putrasahan and Jin-Song von Storch
Mesoscale ocean eddies can be likened to weather events of the sea, influencing a multitude of coupled air-sea processes that help in regulating heat and carbon uptake and consequently the climate. With the advancements in high-performance computing, we can now employ multi-decadal kilometre-scale coupled global climate models (GCMs) that effectively captures the intricacies of mesoscale ocean-atmosphere interactions and shed light on their implications at larger scales. While low resolution CMIP-type GCMs show a dominance of atmospheric-forced coupled variability, e.g. faster winds over ocean surface can enhance turbulent heat flux and thus cool sea surface temperatures (SSTs), satellite observations and eddy-resolving coupled models show a prevalence of mesoscale ocean-forced coupled variability over eddy-rich regions like SST front areas. Two ocean mesoscale dynamical processes can promote such ocean-forced coupled variability, namely through thermal feedback and current feedback. Consider the thermal feedback as an example; the destabilisation of the atmosphere above warm mesoscale anomalies amplifies the downward transfer of momentum from higher-altitude winds to the surface, known as the vertical or downward mixing mechanism. This, in turn, leads to enhanced surface winds and increased turbulent heat flux over warm SST anomalies. We employ a coupled 5km-ocean 10km-atmosphere ICON model to assess the global distribution of mesoscale air-sea coupling associated with these feedbacks and their implications on wind work and eddy-induced Ekman upwelling. Additionally, we show examples of such mesoscale coupling from a Lagrangian perspective through composites of tracked eddies, their impact on ocean upwelling/downwelling and their imprint on the overlying atmosphere beyond the surface like precipitation.

How to cite: Putrasahan, D. and von Storch, J.-S.: Eulerian and Lagrangian Perspectives on Mesoscale Air-Sea Interactions, EGU General Assembly 2024, Vienna, Austria, 14–19 Apr 2024, EGU24-18483, https://doi.org/10.5194/egusphere-egu24-18483, 2024.

EGU24-18761 | Posters on site | CL4.5

Modelling of the Hunga Tonga eruption for testing the GPU port of ICON 

Luis Kornblueh and the Port ICON to Lumi

Porting weather and climate models such as ICON to GPU-based computer production systems requires serious testing of the code adapted to the
additional hardware and its software stack. The high resolution of storm resolving models poses problems for porting ICON and very short simulations facilitate this task.

The 2022 eruption of the Hunga Tonga–Hunga Haʻapai submarine volcano had a very strong water vapour signal, which is modelled by adjusting the model initial conditions to include a cylindrical water vapour plume: a very simple setup to implement, but one that reflects the strong signal in the model results. This plume is visible in the model for years. For the test case we focus on the first time steps. These support the detection of technical errors in the porting of the model code in very short simulations at the final model resolution of 5 km.

We present the scientific use case, the model configuration and some results from test simulations on Lumi.

How to cite: Kornblueh, L. and the Port ICON to Lumi: Modelling of the Hunga Tonga eruption for testing the GPU port of ICON, EGU General Assembly 2024, Vienna, Austria, 14–19 Apr 2024, EGU24-18761, https://doi.org/10.5194/egusphere-egu24-18761, 2024.

EGU24-18964 | ECS | Posters on site | CL4.5

On the detection and tracking of mesoscale ocean eddies: Parameter sensitivity 

Stella Bērziņa, Nicolas Gruber, and Matthias Münnich

The characteristics of coherent mesoscale eddies are an important point of evaluation for high-resolution ocean and coupled climate models. Mesoscale eddies are rotating features in the ocean on horizontal scales from 10 to 100 km that transport physical, chemical and biological properties of the ocean water. There are many possible ways to identify and track eddies (sea surface height anomalies, sea surface temperature anomalies, vorticity, etc.) and even within one method parameters can be adjusted to lead to different eddy identification results, for example, the allowed shape error of eddies.  

Here we explore systematically the sensitivity of the identification and tracking results to choices made with regard to data, allowed eddy size and shape error and the use of different high-pass filters. Additionally, eddy identification and tracking are done on a regular latitude-longitude grid rather than the native model grid, therefore, the impact of the chosen grid size is assessed.

To this end, we use “py-eddy-tracker” (Mason et al. 2014) a commonly used open-source geometry-based approach. The algorithm uses sea level anomaly data and several adjustable parameters to identify eddies. It then joins the identified eddies to form tracks by using the ellipsoid method described in Chelton et al. 2011, where the two closest lying eddies in subsequent time steps are connected if they occur within a restricted search region.

We apply this identification and tracking algorithm to high frequency output from different high-resolution coupled climate models run as part of the EERIE project and compare the results of eddy characteristics to observations. This study will help to make more informed and study-specific choices when setting threshold values in eddy identification algorithms for model assessment or creating eddy observational data set from satellite altimetry data.

How to cite: Bērziņa, S., Gruber, N., and Münnich, M.: On the detection and tracking of mesoscale ocean eddies: Parameter sensitivity, EGU General Assembly 2024, Vienna, Austria, 14–19 Apr 2024, EGU24-18964, https://doi.org/10.5194/egusphere-egu24-18964, 2024.

EGU24-19072 | ECS | Orals | CL4.5

Surface irradiance variability over land in storm-resolving models. 

Menno Veerman and Chiel van Heerwaarden

With increasing horizontal resolution in global models, we may expect an increasingly more realistic representation of cloud development over land as both large-scale circulations and local surface heterogeneities, such as orography and land use type, are better resolved. As clouds are a dominant contributor to inter- and intra-diurnal variations in both solar and thermal surface irradiance, the spatiotemporal irradiance variability should then be better represented than in conventional climate models. Here, we use the 5-year coupled atmosphere-ocean global simulations performed in Cycle 3 of the nextGEMS project to evaluate the surface irradiance variability over land. These 5-year simulations were performed at different resolution, from 4.4 to 28 km, and with two different global models, the Integrated Forecasting System (IFS) and the Icosahedral Nonhydrostatic model (ICON), allowing us to separate the impacts of horizontal resolution and of implementation choices concerning model physics. We select a couple of representative locations with varying climate and land surface characteristics where high-quality irradiance observations from the Baseline Surface Radiation Network (BSRN) are available. While first results show some benefits of increased horizontal resolution, higher resolutions simulations do not consistently produce more accurate surface irradiances than simulations at lower resolution. Furthermore, differences between the IFS and ICON models are often larger than differences between the IFS simulations at varying resolutions. These results suggest that if realistic surface irradiance predictions are concerned, e.g. for solar energy applications, the road to model improvement by increasing horizontal resolution is not straightforward. 

How to cite: Veerman, M. and van Heerwaarden, C.: Surface irradiance variability over land in storm-resolving models., EGU General Assembly 2024, Vienna, Austria, 14–19 Apr 2024, EGU24-19072, https://doi.org/10.5194/egusphere-egu24-19072, 2024.

EGU24-19735 | ECS | Posters on site | CL4.5

Network of extremes in ocean eddy-resolving climate models 

Emma Ferri, Nicolas Gruber, Matthias Münnich, and Dian Putrasahan

Marine extreme events, such as marine heatwaves, have a disproportional impact on marine organisms and ecosystems, shaping many of their characteristics. Even though such extremes have become the focus of much research in the last few years, our understanding of the processes that give rise to extreme conditions is still relatively poor. Mesoscale processes have been shown to structure and shape extremes, but also not much is known about their role. Here we use graph theory to detect the correlation between extreme marine events and distant occurrences of atmospheric extremes in the context of mesoscale variability. The data stem from a set of mesoscale resolution model simulation results obtained from the European Eddy RIch Earth System Models (EERIE) project. Common statistical tests such as the Pearson correlation coefficient and the Granger causality will be used to build the graph object. This will permit us to build a network of different oceanographic and atmospheric variables in an attempt to detect teleconnections, such as, for example, the impact of El Niño, on the onset, persistence, and demise of extremes. Our initial networks correlate various variables, such as precipitation and sea surface temperature (SST), eddy kinetic energy and SST, and global SST variations.

How to cite: Ferri, E., Gruber, N., Münnich, M., and Putrasahan, D.: Network of extremes in ocean eddy-resolving climate models, EGU General Assembly 2024, Vienna, Austria, 14–19 Apr 2024, EGU24-19735, https://doi.org/10.5194/egusphere-egu24-19735, 2024.

EGU24-21956 | ECS | Posters on site | CL4.5

Storm Tracks and Jet Streams in ICON: Unravelling Climate Change Responses through Aquaplanet Horizontal Grid Spacing Sensitivity Experiments 

Angel Peinado Bravo, Tiffany Shaw, Daniel Klocke, and Bjorn Stevens

General Circulation Models (GCMs) are widely used to understand our climate and to simulate and predict the effects of global warming, revealing the dynamical convergence of storm tracks and jet streams at horizontal grid spacing of 50 km (e.g., Lu et al. 2015). Nevertheless, they have shown persistent biases in the large-scale features of the general circulation and basic climate statistics, which are attributed mainly to the parameterization, specifically, convection parameterization. To address this, Global storm-resolving models (GSRMs) provide an alternative approach to parameterization by explicitly resolving convection and its interaction with other processes,  through the refinement of the horizontal grid, thus, offering new insights into the climate system. In a prior study, we showed the physical convergence of the tropical and general circulation structure at horizontal grid spacing of 2.5 km using aquaplanets. However, questions linger: Does the response under climate change of the storm tracks and jet streams converge at similar horizontal grid spacing, and what mechanism controls this convergence?


We will present the effect of increasing horizontal grid spacing on the convergence of the storm tracks and jet stream location and intensity using the global storm-resolving model ICON. Control runs and idealised climate change experiments (increasing sea-surface temperature by 4 Kelvin) were conducted at horizontal grid spacing from 160 km to 2.5 km using an aqua-planet configuration. We adopt an aqua-planet configuration to focus on atmospheric phenomena, specifically convection and cloud feedback, meanwhile reducing the effect of complex interaction with land, topography, sea ice, and seasons. We will discuss the convergence rate of the eddy driven jet, subtropical jet, storm track, and large-scale circulation and their response to climate warming, characterised by the location, width, and intensity. 

How to cite: Peinado Bravo, A., Shaw, T., Klocke, D., and Stevens, B.: Storm Tracks and Jet Streams in ICON: Unravelling Climate Change Responses through Aquaplanet Horizontal Grid Spacing Sensitivity Experiments, EGU General Assembly 2024, Vienna, Austria, 14–19 Apr 2024, EGU24-21956, https://doi.org/10.5194/egusphere-egu24-21956, 2024.

EGU24-2928 | Orals | ST4.7

Long-term Solar Spectral Irradiance Observations by the TSIS-1 Spectral Irradiance Monitor 

Erik Richard, Odele Coddinton, Dave Harber, Peter Pilewskie, and Tom Woods

The NASA’s Total and Spectral Solar Irradiance Sensor (TSIS-1) launched on December 15th, 2017 and was integrated on the International Space Station (ISS) to measure long-term total solar irradiance (TSI) and solar spectral irradiance (SSI). The direct measurement of the SSI is made by the LASP Spectral Irradiance Monitor (SIM) and provides data essential to interpreting how the Earth system responds to solar spectral variability. Extensive advances in TSIS-1 SIM instrument design and new SI-traceable spectral irradiance calibration techniques have resulted in improved absolute accuracy with uncertainties of less than 0.5% over the continuous 200 to 2400 nm spectral range. Furthermore, improvements in the long-term spectral stability corrections provide lower trend uncertainties in SSI variability from those of the previous SORCE SSI instruments. We present the early mission results of the TSIS-1 SIM SSI observations for the first 5 years of operations – a time-period that includes the descending phase of solar cycle 24, the last solar minimum, and the ascending phase of solar cycle 25. Comparisons are made to previous spectral measurements both in the absolute scale of the solar spectrum and the time dependence of the SSI variability. The TSIS-1 SIM SSI spectrum shows lower IR irradiance (by as much as 6% near 2400 nm) and small visible irradiance increases (~0.5%) from the previous ATLAS3 and WHI reference solar spectra, but more consistent agreement with recent SCIAMACHY and SOLAR2 reanalysis results. We also show initial comparisons to current NRLSSI2 and SATIRE-S SSI model results both for short-term (solar rotation) spectral variability and, for the first time, the longer-term (near half solar cycle) spectral variability across the solar spectrum from the UV to the IR.

How to cite: Richard, E., Coddinton, O., Harber, D., Pilewskie, P., and Woods, T.: Long-term Solar Spectral Irradiance Observations by the TSIS-1 Spectral Irradiance Monitor, EGU General Assembly 2024, Vienna, Austria, 14–19 Apr 2024, EGU24-2928, https://doi.org/10.5194/egusphere-egu24-2928, 2024.

EGU24-5966 | Posters on site | ST4.7

The JSTIM-DARA  product derived from the TSI Observations Recorded by the FY3E/JTSIM/DARA Radiometer 

Jean-Philippe Montillet, Wolfgang Finsterle, Margit Haberreiter, Daniel Pfiffner, Ping Zhu, Duo Wu, Silvio Koller, Xin Ye, Dongjun Yang, Wei Fang, Jin Qi, and Peng Zhang

Since the late 1970s, successive satellite missions have been monitoring solar activity and recording Total Solar Irradiance (TSI) data. The Digital Absolute
Radiometer (DARA) on board the Chinese FY3E spacecraft was launched on July 4, 2021, and  has since been recording TSI observations. Here, we analyze these observations and assess the performance of DARA, including sensor degradation of 5 ppm after 2 years in orbit, resulting from exposure to ultraviolet and extreme ultraviolet radiation. Comparing the new dataset’s mean values with observations from active  instruments on other spacecraft (i.e., PMO6 on board the VIRGO/SOHO and the TIM/TSIS), along with the Solar Irradiance Absolute Radiometer (SIAR) also on board  FY3E/JTSIM, we find that DARA observations closely align with TIM/TSIS, with a difference of approximately 0.07 W/m2. Based on these findings, we generate a new TSI dataset (JTSIM-DARA product) at a 6-hour sampling interval. Finally, we have incorporated this new dataset into the TSI composite time series released by the PMOD/WRC. The results indicate that the inclusion of DARA-recorded observations does not alter the consistency, reliability, and stability of the time series.

How to cite: Montillet, J.-P., Finsterle, W., Haberreiter, M., Pfiffner, D., Zhu, P., Wu, D., Koller, S., Ye, X., Yang, D., Fang, W., Qi, J., and Zhang, P.: The JSTIM-DARA  product derived from the TSI Observations Recorded by the FY3E/JTSIM/DARA Radiometer, EGU General Assembly 2024, Vienna, Austria, 14–19 Apr 2024, EGU24-5966, https://doi.org/10.5194/egusphere-egu24-5966, 2024.

The accurate determination of sea surface height begins with the precise characterization of the orbit of altimetric satellites with respect to the Earth’s center of mass. To produce precise estimates of the orbital height of such altimetric satellites, Precision Orbit Determination (POD) combines satellite-tracking information with force models, including gravity, atmospheric drag, radiation, and others, which govern the motion of these satellites.
However, it’s important to note that uncertainties arising from the modeling of non-gravitational forces, stemming from the interaction between photons, molecules, atoms, and satellite surfaces, constitute a significant source of error.


With the goal of achieving radial orbit errors below 0.1 mm/year at regional and decadal time scales, an update in the modeling of non-gravitational forces, specifically addressing Earth radiation pressure, was performed. Indeed, the traditional model used in CNES' ZOOM orbit determination software was based on an average approach (Knocke et al., 1988) accounting for latitude and time dependent reflected/emitted radiations which did not consider the spatial and temporal complexity of reflection phenomena, such as cloud dynamics.


To address this issue, an approach involving the use of observations from Earth radiation fluxes, such as CERES (NASA) and ERA5 (ECMWF), was adopted and tested during the lifetime of the Sentinel-6A and CryoSat-2 satellites. These efforts led to substantial improvements in the dynamic modeling of satellite orbits. Comparisons were made between the resulting satellite orbits and those based on the legacy model, with the aim of assessing their impact on sea level measurements. Although a slight discrepancy was observed between the two derived orbits, this difference was attributed to the introduction of empirical forces, typically employed to correct dynamic modeling errors. Consequently, an analysis of these empirical forces confirmed their relevance and underscored the value of the new force model

How to cite: Nocet-Binois, M.: Enhancing satellite orbit accuracy for sea level monitoring through Earth radiation pressure modeling, EGU General Assembly 2024, Vienna, Austria, 14–19 Apr 2024, EGU24-6134, https://doi.org/10.5194/egusphere-egu24-6134, 2024.

EGU24-10172 | ECS | Orals | ST4.7

Lunar Imaging Earthshine Telescope, juLIET, for Earth Albedo Measurements  

Katcha Winther, Peter Thejll, and René Fléron

The average global temperature of Earth is governed by the energy balance equation, comparing energy entering and leaving the Earth system. A key parameter in this balance is the Earth’s albedo, determining the ratio of the Sun’s energy being reflected from or absorbed by Earth. The global albedo varies on several different timescales – daily due to changes in cloud cover, seasonally due to changes in foliage and snowfall, and on greater timescales a change in albedo is a reflection of our changing climate. To measure these changes, multi-decadal data is needed.

Data of top-of-the-atmosphere shortwave radiation used in albedo estimation, are primarily gathered by LEO satellites using absolute measurement techniques. These are however affected by the harsh space environment, especially radiation, which causes drift errors in the data, requiring in-flight calibration. The purpose of NASA’s and ESA’s upcoming missions CLARREO and TRUHTS respectively, is to provide state of the art calibration data to account for these errors. However, they do not remove the issue all together.

As an alternative to these absolute measurements, the space based earthshine telescope juLIET (ju Lunar Imaging Earthshine Telescope) aims to estimate the albedo through relative measurements. The Earthshine albedo technique is based on comparing the intensity of Moonlight coming from the visible dayside of the Moon and the Earthshine reflected off the visible nightside of the Moon. As a relative measurement, it is more resilient to calibration drift.

Albedo measurements using the Earthshine technique have been successfully carried out from Earth, but due to Moonlight being several magnitudes brighter than Earthshine, atmospheric scattering of Moonlight reduces the possible precision on the Earthshine intensity. While the issue of atmospheric scattering is removed by going into orbit, measuring the dim Earthshine with a sufficiently high precision to be used for albedo estimation, using the same sensor that measures the Moonlight, still poses a significant challenge, due to scattering and diffraction of Moonlight within the telescope.

To determine the feasibility of the juLIET instrument, an analysis of the optical noise of the telescope is conducted. This analysis is carried out using Zemax OpticStudio and MATLAB, where main contributors to the uncertainty of the measurement are isolated and quantified.

The results of this noise analysis will be extended to determine which lunar phases juLIET can provide measurements of the Earth albedo, during its mission time as primary payload on the small-sat ROMEO developed by IRS, University of Stuttgart. 

How to cite: Winther, K., Thejll, P., and Fléron, R.: Lunar Imaging Earthshine Telescope, juLIET, for Earth Albedo Measurements , EGU General Assembly 2024, Vienna, Austria, 14–19 Apr 2024, EGU24-10172, https://doi.org/10.5194/egusphere-egu24-10172, 2024.

EGU24-10791 | ECS | Posters virtual | ST4.7

A Novel Empirical EUV Model with Uncertainty Quantification 

Daniel Brandt and Aaron Ridley

The ubiquitous usage of solar proxies in the nowcasting and forecasting of ionospheric and thermospheric conditions has seen the application of a multitude of techniques to ensure high fidelity representation of the effects of solar EUV forcing on the atmospheric state. The inherent limitations of reliance on a single solar proxy have encouraged the development of numerous EUV irradiance models in which the EUV irradiance in multiple bands is reconstructed from F10.7 solar flux. These models have progressed from lower to higher resolution, as well as higher-fidelity parameterization of time-varying components of the EUV irradiance. We contribute to this development in presenting NEUVAC, a simple, but novel empirical solar EUV model trained on FISM2 data. NEUVAC models the solar EUV irradiance from F10.7 and 81-day averaged F10.7 in 59 wavelength bands between 1 and 1750 Angstroms using a nonlinear parameterization, and performs uncertainty quantification in each band with the assistance of exclusively data-driven methods that exploit the dynamical properties of EUV, and intercorrelations between irradiance in each band. The irradiances provided by NEUVAC highlight the success of the FISM2 program, are suitable for direct ingestion into global ionosphere-thermosphere models, and are structured so that ensembles of irradiance estimates can be generated for principled forecasting and statistical assessment of downstream parameters generated by ionosphere-thermosphere models.

How to cite: Brandt, D. and Ridley, A.: A Novel Empirical EUV Model with Uncertainty Quantification, EGU General Assembly 2024, Vienna, Austria, 14–19 Apr 2024, EGU24-10791, https://doi.org/10.5194/egusphere-egu24-10791, 2024.

EGU24-11445 | Orals | ST4.7

A change in solar radio spectrum during the decay of the Modern Maximum 

Kalevi Mursula, Alexei Pevtsov, Timo Asikainen, Ismo Tähtinen, and Anthony Yeates

The Sun experienced a period of unprecedented activity during solar cycle 19 in 1950s and 1960s, now called the Modern Maximum (MM). The decay of the MM has changed the Sun, the heliosphere and the planetary environments in many ways. However, this decay may not have proceeded synchronously in all solar parameters. One of the related key issues is if the relation between the two long parameters of solar activity, sunspot number and the solar 10.7cm radio flux, has remained the same during this decay. While a number of studies agree that this relation has indeed changed, no consensus on its validity exists. A recent study argues that there is an inhomogeneity in the 10.7cm radio flux in 1980, which led to a step-like jump ("1980 jump") in this relation. If true, this would imply that the 10.7cm radio flux is ineligible for long-term studies, which would seriously impede versatile studies of the Sun during the MM.

Here we use the 10.7cm radio flux and four other, independent radio flux measurements, the sunspot number, the MgII index and the number of solar active regions in order to study their mutual relations during the decay of MM. We find that all the five radio fluxes depict an increasing trend with respect to the sunspot number from 1970s to 2010s. This excludes the interpretation of the "1980 jump" as an inhomogeneity in the 10.7cm flux, and re-establishes the 10.7cm flux as a reliable and homogeneous long-term measure of solar activity.

We find that the fluxes of longer radio waves increased with respect to the shorter waves, which implies a long-term change in the solar spectrum at radio frequencies. We also find that both the MgII index and the number of active regions increased with respect to the sunspot number, indicating a difference in the long-term evolution in chromospheric and photospheric parameters.

Our results give evidence for important structural changes in solar magnetic fields and solar atmosphere during the decay of the MM when solar activity weakened considerably. These changes have not been reliably documented so far. We also emphasise that the changing relation between the different (e.g. photospheric and chromospheric) parameters should be taken into account when using sunspot number or any single parameter in long-term studies of solar activity.

How to cite: Mursula, K., Pevtsov, A., Asikainen, T., Tähtinen, I., and Yeates, A.: A change in solar radio spectrum during the decay of the Modern Maximum, EGU General Assembly 2024, Vienna, Austria, 14–19 Apr 2024, EGU24-11445, https://doi.org/10.5194/egusphere-egu24-11445, 2024.

EGU24-11721 | Orals | ST4.7

Radiation budget at the Baltic Sea surface in 2010 – 2023 from SatBałtyk System 

Tomasz Zapadka, Mirosława Ostrowska, Damian Stoltmann, and Marcin Paszkuta

Global climate change, which causes, among other things, an accumulation of energy in the oceans, may cause irreversible changes to their ecosystems. This can be particularly quickly apparent in bodies of water that are shallow and small in relation to the Oceans, such as the Baltic Sea. In the SatBałtyk System (http://www.satbaltyk.pl), which aims to observe the state of the Baltic Sea environment based on satellite data, maps of the distributions of values of a number of physical biological and chemical parameters of the sea are collected and made available. Within the framework of this System, the SBRB (SatBałtyk Radiation Budget) model was launched, determining data on radiation budget (NET) at the sea surface. Daily maps of the spatial distribution of the radiation budget  and its components at the Baltic Sea surface are created based on data from SEVIRI, AVHRR, MODIS, SBUV/2, TOVS radiometers, and forecast auxiliary models. The component algorithms of this model were developed and validated against empirical data measured directly in the Baltic Sea (Zapadka et al. 2020). The uncertainties in the estimation of the radiation budget for the monthly averages are: RMSD 4 Wm-2 and BIAS -0.5 Wm-2. The individual downward and upward shortwave radiation fluxes are determined with an accuracy of RMSD 3 Wm-2, 1 Wm-2, BIAS 3 Wm-2, 0.1 Wm-2 respectively, and downward and upward longwave radiation fluxes are RMSD 4.5 Wm-2, 3.7 Wm-2, BIAS -0.8 Wm-2, 2.6 Wm-2 respectively. The uniform methodology used since 2010 has enabled an analysis of the variability of the radiation budget and its components at the surface of the Baltic Sea covering 14 years. Despite the natural variation in NET values and its components year-on-year, the analyses showed an annual growth trend of c. 0.7 Wm-2. Interestingly, the increasing trend applies to all NET components. An analysis of the possible causes of the trend observed in recent years may confirm the role of the anthropological factor in these changes.

How to cite: Zapadka, T., Ostrowska, M., Stoltmann, D., and Paszkuta, M.: Radiation budget at the Baltic Sea surface in 2010 – 2023 from SatBałtyk System, EGU General Assembly 2024, Vienna, Austria, 14–19 Apr 2024, EGU24-11721, https://doi.org/10.5194/egusphere-egu24-11721, 2024.

EGU24-12284 | Posters on site | ST4.7

Towards Determining the Earth Energy Imbalance from Space - Outcome of a recent ISSI International Team 

Margit Haberreiter, Julien Amand, Edward Baudrez, Wolfgang Finsterle, Nigel Fox, Dave Harber, Norman Loeb, Mustapha Meftah, Jean-Philippe Montillet, Stijn Nevens, Peter Pilewskie, Bill Swartz, Martin Wild, Duo Wu, Xin Ye, and Ping Zhu

A positive Earth Energy Imbalance (EEI) is the energy, which is continuously stored by the Earth and will ultimately released to the atmosphere, causing global warming. The "imperative to monitor Earth’s energy imbalance” (von Schuckmann et al., 2016) has been continuously reported by the Earth’s climate community. The EEI has been identified to be around 0.5 to 1.0 Wm−2. To determine its exact value both the Total Solar Irradiance (TSI) and the Top of the Atmosphere (ToA) Outgoing Radiation (TOR) need to be measured with unprecedented accuracy and precision.However, so far, the EEI could not be determined as the measurements were not sufficiently accurate. This calls for improved instrument technologies as well as a traceable calibration chain of the space instrumentation. To pave the way in that direction, the ISSI International Team "Towards Determining the Earth Energy Imbalance from Space" has been established. We collect the current knowledge of ERB measurements and identify missing elements for measuring EEI from space. Specifically, we collect past and ongoing measurements of the ERB components obtained with instruments such as CLARA, RAVAN, SIMBA, GERB, and CERES. The goal is to evaluate the performance and uncertainty of each of the instruments to identify observational challenges that need to be overcome to be able to measure both TSI and the Earth’s outgoing radiation with the required accuracy to ultimately be able to determine the absolute level of EEI from space.

How to cite: Haberreiter, M., Amand, J., Baudrez, E., Finsterle, W., Fox, N., Harber, D., Loeb, N., Meftah, M., Montillet, J.-P., Nevens, S., Pilewskie, P., Swartz, B., Wild, M., Wu, D., Ye, X., and Zhu, P.: Towards Determining the Earth Energy Imbalance from Space - Outcome of a recent ISSI International Team, EGU General Assembly 2024, Vienna, Austria, 14–19 Apr 2024, EGU24-12284, https://doi.org/10.5194/egusphere-egu24-12284, 2024.

EGU24-13691 | Orals | ST4.7

AI to Enhance the Capabilities of EUV-observing Satellites and Estimate Spectral Irradiance 

Benoit Tremblay, Robert Jarolim, Anna Jungbluth, Andrés Munoz-Jaramillo, Kyriaki-Margarita Bintsi, Miraflor Santos, James P. Mason, Angelos Vourlidas, and Sairam Sundaresan

Multiple satellites capture images of the Sun in Extreme Ultraviolet (EUV) light. However, only the Solar Dynamics Observatory (SDO) was equipped with instruments that measure the Sun's EUV spectral irradiance (i.e., MEGS-A and MEGS-B onboard the Extreme Ultraviolet Variability Experiment (EVE) suite). The MEGS-A instrument malfunctioned in 2014, making it impossible to measure the full irradiance spectrum ever since. 


Using AI, we explore the translation of a set of EUV images of the Sun into spectral irradiance, effectively replacing the malfunctioning MEGS-A instrument onboard SDO. In other words, we generate a virtual irradiance instrument, MEGS-AI, for SDO. Using an Image-to-Image translation tool (ITI), this virtual instrument can also be trained and added on other EUV-observing satellites like STEREO, GOES, SolO, and the upcoming VIGIL satellite, enabling unprecedented irradiance estimates from additional satellite missions. In the case of the STEREO twin-satellites and VIGIL, this enables estimates of spectral irradiance prior to the Sun rotating into Earth’s view, which directly enables the forecast of enhanced irradiance. Additionally, we explore different combinations of images in different EUV channels and evaluate their contributions in estimating different irradiance channels. Finally, when combined with a neural radiance field model of the Sun (SuNeRFs), MEGS-AI can estimate spectral irradiance from any viewpoint in the solar system, enabling for the first time a complete 4pi spectral irradiance map of the Sun. This can be directly used to estimate the Sun’s impact on other planets in the solar system and to determine the total solar irradiance output in multiple EUV spectral bands.

How to cite: Tremblay, B., Jarolim, R., Jungbluth, A., Munoz-Jaramillo, A., Bintsi, K.-M., Santos, M., Mason, J. P., Vourlidas, A., and Sundaresan, S.: AI to Enhance the Capabilities of EUV-observing Satellites and Estimate Spectral Irradiance, EGU General Assembly 2024, Vienna, Austria, 14–19 Apr 2024, EGU24-13691, https://doi.org/10.5194/egusphere-egu24-13691, 2024.

One of the instruments on the Geostationary Operational Environmental Satellites is the Extreme and Ultraviolet Sensor (EUVS).  Channel C of EUVS measures the Magnesium II core-to-wing ratio with high signal-to-noise ratio at a cadence of three seconds.  This presentation will describe the design of the instrument and give an overview of the data collected so far.  Available data products range from the full-cadence operational data measured every three seconds to science-quality daily averages. 


The instrument measures the spectrum of the Sun from 275 to 285 nm with a spectral resolution of 0.1 nm.  It uses a diode array with a sampling width of 0.02 nm, providing five samples per slit width. 


The first of these instruments became operational in January 2017 and continues through the present.

How to cite: Snow, M. and McClintock, W.: High Precision, High Time Cadence Measurements of the Mg II Index of Solar Activity by the Extreme Ultraviolet Sensor aboard the NOAA GOES-R Series, EGU General Assembly 2024, Vienna, Austria, 14–19 Apr 2024, EGU24-15007, https://doi.org/10.5194/egusphere-egu24-15007, 2024.

EGU24-15999 | ECS | Orals | ST4.7

Sampling the diurnal and annual cycles of Earth’s energy imbalance with constellations of satellite-borne radiometers 

Thomas Hocking, Thorsten Mauritsen, and Linda Megner

The Earth’s energy imbalance (EEI), i.e. the difference between incoming solar radiation and outgoing reflected and emitted radiation, is the one quantity that ultimately controls the evolution of our climate system. Despite its importance, the exact magnitude of the energy imbalance is not well known, and because it is a small net difference of about 1 Wm−2 between two large fluxes (approximately 340 Wm−2), it is difficult to measure directly. There has recently been a renewed interest in applying wide-field-of-view radiometers onboard satellites to measure the outgoing radiation, and hence deduce the global annual mean energy imbalance.

Here we investigate how to sample with a limited number of satellite orbits, in order to correctly determine the global annual mean imbalance. Using observational and model data, we have investigated the importance of the local and global diurnal cycles, as they are observed by a satellite, in the determination of the EEI. We simulate satellites in polar (90° inclination), sun-synchronous (98°) and precessing orbits (73°, 82°), as well as constellations of these types of satellite orbits. We present the results of ongoing work concerning different orbits, and how they affect the estimated global annual mean EEI.

How to cite: Hocking, T., Mauritsen, T., and Megner, L.: Sampling the diurnal and annual cycles of Earth’s energy imbalance with constellations of satellite-borne radiometers, EGU General Assembly 2024, Vienna, Austria, 14–19 Apr 2024, EGU24-15999, https://doi.org/10.5194/egusphere-egu24-15999, 2024.

EGU24-16132 | Orals | ST4.7

Estimate of the global and regional Ocean Heat Content changes from space gravimetry and altimetry observations to assess the Earth Energy Imbalance variations and trend 

Robin Fraudeau, Florence Marti, Benoit Meyssignac, Alejandro Blazquez, Sebastien Fourest, Michael Ablain, Victor Rousseau, Gilles Larnicol, Marco Restano, Jérôme Benveniste, Roberto Sabia, and Gérald Dibarboure

The Earth energy imbalance (EEI) at the top of the atmosphere (TOA) is the cause of the energy accumulation in the climate system. Measuring the EEI is challenging because it is a globally integrated variable whose variations are small (0.5-1 W.m−2) compared to the amount of energy entering and leaving the climate system (~ 340 W.m-2). 91% of the excess of energy stored by the planet in response to the EEI is accumulated in the ocean in the form of heat making the ocean heat content (OHC) change an accurate proxy of EEI.

In this work, we adopt the space geodetic approach which relies on the sea level budget equation to estimate the OHC changes. The thermosteric sea level change is derived at regional scale from a combination of space altimetry and space gravimetry observations, and divided by the integrated expansion efficiency of heat  to estimate the OHC changes. The global OHC (GOHC) change is then estimated by a spatial integration of the regional OHC changes. The uncertainty in GOHC is estimated by propagation of the uncertainty of input data using the input data error variance-covariance matrix to account for the instrumental and post-processing errors and for the time correlation in errors.

Regional estimates of the OHC changes are validated over the Atlantic Ocean directly against data from in-situ Argo profiles and indirectly by an energy budget approach. In the energy budget approach, surface heat flux derived from ERA5 and CERES TOA radiation budget are combined with regional OHC changes to estimate the north Atlantic meridional heat transport which is then validated against in-situ RAPID and OSNAP estimates. Both validations show good agreement in terms of signal amplitudes and variability with time correlations above 0.6. 


Over the period 1993-2022, the GOHC shows a significant positive trend of 0.75 W m-2 [0.61, 1.04] at the 90% confidence level, indicating a positive mean ocean heat uptake or EEI. Comparisons with GOHC estimates based on in-situ ocean temperature measurements over the full ocean depth show good agreement over 2005-2019 (Marti et al. 2023, in review). Over 2000-2020, the ocean heat uptake presents a positive trend of 0.33 W/m²/decade, significant at the 90% confidence level and in agreement with CERES estimate. This EEI trend  reflects an acceleration in ocean warming.


The two space geodetic products based on space altimetry and space gravimetry are freely available on the AVISO website. One estimating the GOHC and EEI (https://doi.org/10.24400/527896/a01-2020.003), the other estimating regional OHC over the Atlantic Ocean (https://doi.org/10.24400/527896/a01-2022.012).

How to cite: Fraudeau, R., Marti, F., Meyssignac, B., Blazquez, A., Fourest, S., Ablain, M., Rousseau, V., Larnicol, G., Restano, M., Benveniste, J., Sabia, R., and Dibarboure, G.: Estimate of the global and regional Ocean Heat Content changes from space gravimetry and altimetry observations to assess the Earth Energy Imbalance variations and trend, EGU General Assembly 2024, Vienna, Austria, 14–19 Apr 2024, EGU24-16132, https://doi.org/10.5194/egusphere-egu24-16132, 2024.

The Earth energy imbalance (EEI) is a fundamental climate variable that characterizes the energy state of the climate system. When integrated over multiple years, EEI estimates provide the net energy gain (or loss) by the climate system. In addition, measuring accurately the EEI along with surface temperature and atmospheric composition is essential to separate the role of different radiative forcing from the role of feedbacks on the global energy budget enabling further to constraint effective and equilibrium climate sensitivities. In this presentation I review the current EEI observing system performance and uncertainty. I intercompare the different EEI datasets, originating from in-situ and space-based observing systems to evaluate their differences and to assess their uncertainty.

Since 2000 the Clouds and the Earth’s Radiant Energy System (CERES) project provides satellite-based observations of the Earth radiation budget and the EEI with the highest precision (±0.3W.m-2 -1s- on a monthly basis). Nevertheless, because of limitation in the absolute calibration of CERES radiometers the CERES final product needs a bias correction (of about ±2.5W.m-2 -1s-) on the EEI mean. The current best approach to estimating the mean EEI is to estimate the ocean heat uptake (OHU)  which represent 89% of the energy storage  due to the EEI.  Today, the OHU can be derived with the highest accuracy (±0.18W.m-2 -1s- on the mean OHU), from in situ ocean temperature measured by Argo or from the thermal expansion estimated by the difference between satellite altimetry sea level and ocean mass from GRACE. On 2-yr and longer time scales, OHU and CERES EEI estimates show good agreement in EEI variability. But OHU approaches cannot resolve the EEI variability below 1 yr because the energy gain (or loss) induced by EEI over such small time-scales is of the same order of magnitude as the global exchanges of energy between the atmosphere and the ocean.

The different EEI measurements have enabled since 2005 a robust estimate of the mean EEI of +0.75±0.18W.m-2 that is essentially due to anthropogenic emissions of greenhouse gases (GHG). They have also allowed to detect a significantly positive trend in EEI of 0.4±0.3W.m-2 per decade, leading to a doubling of the EEI during the past 20 years in response to continued increases in GHG emissions combined with decreases in aerosol emissions. In addition, on interannual time scales, they showed that the variability in EEI is mostly sensitive to low cloud variability, with ENSO controlling the ±0.5W.m-2 variability on the 4-7yr time scale.  Today, new scientific challenges related to EEI are emerging like the closure of the energy budget from top of the atmosphere to the bottom of the ocean at monthly to decadal time scales, the estimate of the current effective climate sensitivity, the monitoring of the physical climate system response to GHG mitigation policies and others. These new challenges lead to new requirements on the EEI observing system ranging from sustained continuity to higher precision and accuracy. I discuss briefly the need to refine these requirements and some opportunities to meet them in the future.

How to cite: Meyssignac, B.: Mean, Trend, variability and uncertainty in Earth's Energy Imbalance over the last two decades, EGU General Assembly 2024, Vienna, Austria, 14–19 Apr 2024, EGU24-16610, https://doi.org/10.5194/egusphere-egu24-16610, 2024.

TRUTHS (Traceable Radiometry Underpinning Terrestrial- and Helio-Studies) is an operational climate mission, aiming to enhance, up to an order-of-magnitude, our ability to estimate the Earth radiation budget, spectrally resolved to support attribution. Through direct measurements of incoming total and spectrally resolved solar irradiances and Earth reflected radiances, spatially resolved, it establishes ‘benchmarks’ against which change/trends can be detected in as short a time as possible. These fiducial reference data sets can be combined with data from other sensors and also serve as ‘gold standard’ references to anchor and upgrade the performance of other space sensors through in-orbit calibration.

TRUTHS will become a founding member of a new class of satellites called SITSats, SI-Traceable Satellites, with payloads explicitly designed to achieve and evidence an uncertainty, in-orbit, at a level commensurate with the exacting goals of long-time-base climate studies. SITSats also facilitate interoperability and enhanced trust in the data from the Earth observation system as a whole, helping to provide observational evidence-based confidence in actions addressing the climate emergency. 

The unprecedented uncertainty of TRUTHS’ globally sampled hyperspectral data underpins many additional applications:

  • Establishing an interoperable, harmonised Earth Observing system incorporating agency and commercial satellites: large and small
  • Top and Bottom of atmosphere reflectances impacting carbon cycle (e.g. land cover, ocean colour, vegetation, methane etc together with similar applications of other hyper/multi-spectral missions). Low uncertainty also facilitates improvements in retrieval algorithms.
  • Transferring radiometric reference values to existing Cal/Val infrastructure (e.g. RadCalNet, Pseudo-Invariant Calibration sites, In-situ ocean colour reference observations; selected surface reflectance test-sites (fluxnet, …), both nadir and multi-angular) and Moon observations.

The mission comprises an “agile” satellite capable to point and image the Earth, Moon and Sun from a 90°polar orbit by the Hyperspectral Imaging Spectrometer (HIS). The HIS provides spectrally continuous observations from 320 to 2400 nm, with a spectral sampling between 2 and 6 nm and a spatial sampling of 50 m. The payload utilises a novel SI-traceable on-board calibration system (OBCS), comprising of the Cryogenic Solar Absolute Radiometer (CSAR), able to realise SI-traceability in space and also measure incoming solar radiation. Together with other optical elements the OBCS links the HIS observations to the CSAR with a target expanded uncertainty 0.3% (k=2).

TRUTHS is implemented by the European Space Agency (ESA) as a UK-led Earth Watch mission in collaboration with Switzerland, Czech Republic, Greece, Romania and Spain. The mission was conceived by the UK national metrology institute, NPL, in response to challenges highlighted by the worlds space agencies, through bodies such as CEOS addressing observational needs of GCOS. The mission is under development by an industrial consortium led by Airbus Defence and Space UK, with a target launch date of 2030 and minimal operations life-time of 5 years with a goal of 8 yrs.

Together with FORUM (ESA) and IASI-NG (CNES/EUMETSAT) it will provide spectrally resolved Earth radiance information from the UV to the Far-Infrared in the coming decade, and in partnership with CLARREO-Pathfinder (NASA) and CSRB (CMA) inaugurate a future constellation of SITSats.

How to cite: Fox, N., Fehr, T., Marini, A., August, T., and Remedios, J.: Traceable Radiometry Underpinning Terrestrial- and Helio- Studies (TRUTHS) – A ‘gold standard’ imaging spectrometer in space for radiation imbalance and in support of the climate emergency , EGU General Assembly 2024, Vienna, Austria, 14–19 Apr 2024, EGU24-18864, https://doi.org/10.5194/egusphere-egu24-18864, 2024.

EGU24-1036 | ECS | Orals | NP1.5

Exploring Noise-induced and CO2-driven AMOC collapses in the PlaSIM-LSG climate model with a Rare Event Algorithm. 

Matteo Cini, Giuseppe Zappa, Francesco Ragone, and Susanna Corti

Earth-system Models of Intermediate Complexity (EMICs) are climate models featuring a simplified representation of climate processes and a much lower computation cost. This makes them particularly suitable for exploring phenomena with a large ensemble simulation approach. Here we use the coupled atmosphere-ocean PlaSIM-LSG EMIC to study the possibility of Atlantic Meridional Overturning Circulation (AMOC) spontaneous collapses and how this is altered in the presence of external anthropogenic forcing. Understanding the stability of the AMOC and its response to anthropogenic forcing is of key importance for advancing climate science. The idea of a “safe-operating space” has been proposed in order to define a threshold on anthropogenic forcing within which the AMOC does not lose stability. This requires understanding the combined action of CO2-driven and noise-induced processes in climate tipping events

 First, we address the occurrence of noise-induced AMOC collapses, i.e. spontaneous abrupt weakening  events induced by chaotic internal climate variability in absence of any external forcing. We address the problem of finding these extreme events via the application of a Rare Event Algorithm, which - via a selective cloning of the most interesting model trajectories -  allows a faster exploration of the model phase space in the direction of an AMOC decrease. The algorithm is applied to a PlaSIM-LSG ensemble simulation run at T21 spectral resolution in the atmosphere, and 3.5 degrees in the ocean, with fixed pre-industrial conditions. A number of collapse events, unseen in the pre-industrial control run, are sampled by the algorithm. Looking at the mechanisms causing the AMOC spontaneous collapse, we find that zonal wind stress over the North Atlantic is the main driver of the initial AMOC slowdown, while the suppression of surface convection in the Labrador sea is the likely cause of the subsequent AMOC collapse. Then, we investigate the influence of increasing CO2 levels on the frequency of these spontaneous AMOC collapses. We show that a higher CO2 not only leads to the well-known weakening of the AMOC mean state, but it also increases the possibility of incurring in abrupt noise-induced transitions. The employment of EMICs, combined with the proposed approach, samples a large number of rare phenomena. This procedure allows us to explore statistical properties that are not accessible with a deterministic approach in state-of-the-art high resolution models.

How to cite: Cini, M., Zappa, G., Ragone, F., and Corti, S.: Exploring Noise-induced and CO2-driven AMOC collapses in the PlaSIM-LSG climate model with a Rare Event Algorithm., EGU General Assembly 2024, Vienna, Austria, 14–19 Apr 2024, EGU24-1036, https://doi.org/10.5194/egusphere-egu24-1036, 2024.

EGU24-2167 | ECS | Posters on site | NP1.5

Early-Warning Signs for SPDEs under Boundary Noise 

Paolo Bernuzzi, Christian Kuehn, and Henk Dijkstra

The search of early-warning signs able to predict the approach of a parameter to a deterministic bifurcation threshold is relevant in climate as it aims to enable a proper prediction of qualitative changes in the studied models. The observation of such objects in SPDEs (stochastic partial differential equations) permits the consideration of space variables and the ensuing heterogeneity in the behaviour of their solutions.

The presence of Gaussian noise on the boundary of the studied space is used in order to build the signals, whose properties are discussed thoroughly. An example in the form of application of such tools on a climate model is presented and justified. The utility and appropriate use of the results on a more applied perspective are shown.

How to cite: Bernuzzi, P., Kuehn, C., and Dijkstra, H.: Early-Warning Signs for SPDEs under Boundary Noise, EGU General Assembly 2024, Vienna, Austria, 14–19 Apr 2024, EGU24-2167, https://doi.org/10.5194/egusphere-egu24-2167, 2024.

Aeolus 2.0 is an open-source numerical atmosphere model with intermediate complexity designed to capture the dynamics of the atmosphere, especially extreme weather and climate events. The model's dynamical core is built on a novel multi-layer pseudo-spectral moist-convective Thermal Rotating Shallow Water (mcTRSW) model, and it utilizes the Dedalus algorithm, renowned for its efficient handling of spin-weighted spherical harmonics in solving pseudo-spectral problems. Aeolus 2.0 comprehensively characterizes the temporal and spatial evolution of key atmospheric variables, including vertically integrated potential temperature, thickness, water vapor, precipitation, and the influence of bottom topography, radiative transfer, and insolation. It provides a versatile platform with resolutions ranging from smooth to coarse, enabling the exploration of a wide spectrum of dynamic phenomena with varying levels of detail and precision.

The model has been utilized to investigate the adjustment of large-scale localized buoyancy anomalies in mid-latitude and equatorial regions, along with the nonlinear evolution of key variables in both adiabatic and moist-convective environments. Our findings highlight the triggering mechanisms of phenomena such as the Madden-Julian Oscillation (MJO) and the circulation patterns induced by temperature anomalies and buoyancy fields. Furthermore, our simulations of large-scale localized temperature anomalies reveal insights into the impact of perturbation strength, size, and vertical structure on the evolution of eddy heat fluxes, including poleward heat flux, energy, and meridional elongation of the buoyancy field. We observe the initiation of atmospheric instability, leading to precipitation systems, such as rain bands, and asymmetric latent heat release due to moist convection in diabatic environments. This study identifies distinct patterns, including the formation of a comma cloud pattern in the upper troposphere and a comma-shaped buoyancy anomaly in the lower layer, accompanied by the emission of inertia gravity waves. Additionally, the role of buoyancy anomalies in generating heatwaves and precipitation patterns is emphasized, particularly in mid-latitude regions.

In summary, Aeolus 2.0, with its specific capabilities, contributes to our understanding of the complex interactions of moist convection, buoyancy anomalies, and atmospheric dynamics, shedding light on the dynamics of extreme weather events and their implications for climate studies.

References

1. Rostami, M., Zhao, B., & Petri, S. (2022). On the genesis and dynamics of MaddenJulian oscillation-like structure formed by equatorial adjustment of localized heating. Quarterly Journal of the Royal Meteorological Society, 148 (749), 3788-3813. Retrieved from https://rmets.onlinelibrary.wiley.com/doi/abs/10.1002/qj.4388 doi: https://doi.org/10.1002/qj.4388

2. Rostami, M., Severino, L., Petri, S., & Hariri, S. (2023). Dynamics of localized extreme heatwaves in the mid-latitude atmosphere: A conceptual examination. Atmospheric Science Letters, e1188. Retrieved from https://rmets.onlinelibrary.wiley.com/doi/abs/10.1002/asl.1188 doi: https://doi.org/10.1002/asl.1188

How to cite: Rostami, M. and Petri, S.: Exploring Extreme Weather and Climate Events with Aeolus 2.0: A Multi-layer moist-convective Thermal Rotating Shallow Water (mcTRSW) Dynamical Core, EGU General Assembly 2024, Vienna, Austria, 14–19 Apr 2024, EGU24-2867, https://doi.org/10.5194/egusphere-egu24-2867, 2024.

EGU24-4539 | ECS | Posters on site | NP1.5

Extreme value methods in dynamical systems of different complexity 

Ignacio del Amo, George Datseris, and Mark Holland

Extreme value theory provides a universal limit for the extremes of continuous independent and identically distributed random variables and has proven to be robust to generalisation to wider classes of random variables, including stationary processes, some nonstationary processes and even trajectories on deterministic chaotic systems. This universality, together with the fact that these methods require data from only one realization of the system, has been exploited in applications to study many series of climate data.

Fitting a probability distribution to the extreme events of a data series generated by a chaotic dynamical system gives us not only probabilistic predictions of the intensity and return time of the events themselves, but also geometrical information about the local structure of the attractor and the predictability and persistence of the extreme events.

However, these methods are sensitive to the mathematical properties of the dynamical system that generates the data, and are seldomly even mentioned when they are applied to real climate data. One further caveat of these methods is that they are hard to falsify, i.e. we cannot verify easily if an answer is wrong. For these reasons, we explore how these methods respond to different systems with different complexity and different mathematical properties, trying to understand which of the results on the literature could meaningful and which could be numerical artifacts.

How to cite: del Amo, I., Datseris, G., and Holland, M.: Extreme value methods in dynamical systems of different complexity, EGU General Assembly 2024, Vienna, Austria, 14–19 Apr 2024, EGU24-4539, https://doi.org/10.5194/egusphere-egu24-4539, 2024.

Within the climate model hierarchy, simple models usually play the important role of highlighting dynamical processes that can possibly govern climate phenomena. If, in addition, their results are in significant agreement with observations, the processes thus identified are even more likely to regulate the actual phenomena. In this context, the dynamical process of intrinsic variability paced by a deterministic forcing (also called deterministic excitation, DE [1]) is highlighted here by two simple models of different degrees of complexity and set in the different contexts of paleoclimate and physical oceanography. In both cases, despite the simplicity of the models, the results show significant agreement with observations.

The DE mechanism requires the system (i) to possess intrinsic nonlinear relaxation oscillations (ROs) and (ii) to be in the excitable state (i.e., ROs do not emerge spontaneously but can be excited, and therefore paced, by a suitable forcing); moreover, (iii) ROs are excited by a deterministic forcing if a given tipping point is passed.

In the first case [1], the abrupt late Pleistocene glacial terminations are shown by a conceptual model to correspond to the excitation, by the astronomical forcing, of ROs describing glacial-interglacial transitions (e.g., [2]). In the second case [3], ROs describing the Kuroshio Extension low-frequency variability [4] are shown, by a primitive equation ocean model, to be excited remotely by the North Pacific Oscillation. These results show how simple modeling approaches of different complexity advance process understanding and can, therefore, provide theoretical guidelines for interpreting state-of-the-art ESM results.

[1] Pierini S., 2023: The deterministic excitation paradigm and the late Pleistocene glacial terminations. Chaos, 33, 033108.

[2] Gildor H. and E. Tziperman, 2001: A sea ice climate switch mechanism for the 100-kyr glacial cycles. J. Geophys. Res., 106, 9117–9133.

[3] Pierini S., 2014: Kuroshio Extension bimodality and the North Pacific Oscillation: a case of intrinsic variability paced by external forcing. J. Climate, 27, 448-454.

[4] Pierini S., 2006: A Kuroshio Extension System model study: decadal chaotic self-sustained oscillations. J. Phys. Oceanogr., 36, 1605-1625.

How to cite: Pierini, S.: Simple oceanographic and paleoclimate modeling highlights the same dynamical process: intrinsic variability paced by a deterministic forcing, EGU General Assembly 2024, Vienna, Austria, 14–19 Apr 2024, EGU24-4679, https://doi.org/10.5194/egusphere-egu24-4679, 2024.

EGU24-5570 | ECS | Orals | NP1.5

The critical precipitation threshold for the Amazon forest biomass in the LPJmL vegetation model 

Da Nian, Sebastian Bathiany, Boris Sakschewski, Markus Drüke, Lana Blaschke, Maya Ben-Yami, Werner von Bloh, and Niklas Boers

The Amazon rainforest, one of the most important biomes in the world, and recognized as a potential tipping element in the Earth system, has received increasing attention in recent years. Theory and observations suggest that regional climate change from greenhouse gas emissions and deforestation may push the remaining forest toward a catastrophic tipping point.

Despite the urgency to assess the future fate of the Amazon, it remains unclear if state-of-the-art Dynamic Global Vegetation Models (DGVMs) can capture the highly nonlinear dynamics underlying such potentially abrupt dynamics and there is a noticeable scarcity of DGVM evaluations regarding their potential to predict forthcoming tipping points.

In our manuscript, we systematically investigate how the Amazon forest responds in idealized scenarios where precipitation is linearly decreased and subsequently increased between current levels and zero, using the state-of-the-art model LPJmL. We investigate whether large-scale abrupt changes and tipping points occur, and whether early warning signals as expected from theory can be detected. 

Our results indicate a pronounced nonlinearity but reversible behavior between vegetation aboveground biomass (AGB) and mean annual precipitation (MAP) in the LPJmL simulations. In particular, there exists a threshold at a critical rainfall level below which there is a rapid decrease in forest biomass. The value of the threshold is determined by seasonality, evapotranspiration and the adaptive capacity of roots. Significant "early warning signs" can be detected before the transition.

How to cite: Nian, D., Bathiany, S., Sakschewski, B., Drüke, M., Blaschke, L., Ben-Yami, M., von Bloh, W., and Boers, N.: The critical precipitation threshold for the Amazon forest biomass in the LPJmL vegetation model, EGU General Assembly 2024, Vienna, Austria, 14–19 Apr 2024, EGU24-5570, https://doi.org/10.5194/egusphere-egu24-5570, 2024.

EGU24-8104 | ECS | Posters on site | NP1.5

Disentangling the dynamics of the subpolar gyre and its interaction with the AMOC in the CMIP6 ensemble 

Swinda Falkena and Anna von der Heydt

The subpolar gyre (SPG) is one of the climate tipping elements which could have a large impact on the climate in the northern hemisphere. Improving our understanding of its dynamics is key to assessing the likelihood of it passing a tipping point. Some CMIP6 models exhibit abrupt transitions in the sea surface temperature in the SPG region, but the majority does not. The differences in the model response can be related to the stratification bias, with many models having a too strong stratification preventing them from exhibiting bistable gyre dynamics.

To better understand the SPG we study the (lagged) partial correlations between the relevant aspects of its dynamics in the CMIP6 ensemble. In contrast to standard correlations, partial correlations correct for the effect of autocorrelation and the effect of (the past of) other relevant variables. Therefore, it gives a better indication of there being a causal relation. Based on the partial correlation between the sea surface temperature and mixed layer depth we split the ensemble into two groups (strong or negligible relation) and for each select one model to study its dynamics in detail. In addition, we discuss the interaction of the SPG with the Atlantic Meridional Overturning Circulation (AMOC) using the same methods. These results can help in better informing more conceptual climate models of the SPG, AMOC and their interactions, which can be used to study potential tipping dynamics.

How to cite: Falkena, S. and von der Heydt, A.: Disentangling the dynamics of the subpolar gyre and its interaction with the AMOC in the CMIP6 ensemble, EGU General Assembly 2024, Vienna, Austria, 14–19 Apr 2024, EGU24-8104, https://doi.org/10.5194/egusphere-egu24-8104, 2024.

EGU24-8117 | Posters on site | NP1.5

Using a simple model to measure the differences between climate model land surface simulations and FLUXNET observations 

F. Hugo Lambert, Claire Zarakas, Monisha Natchiar S. R., Abigail L. S. Swann, and Charles D. Koven

Complex numerical models of climate consist of simulation of fluid dynamics and thermodynamics on a discrete grid, and parameterizations, which are algorithms that approximate processes smaller than gridscale. Because parameterizations of a given process may be written as different functions of different, potentially non-observable variables, it can be difficult to quantify the process differences between individual climate models and between climate models and the real world.

Here, we attempt to write down a simple linear model that represents the response of the Earth's tropical land surface to atmospheric forcing on monthly timescales in terms of the same observable variables using a technique called continuous structural parameterization. Simulated data are taken from complex General Circulation Models (GCMs) run under the AMIP protocol and a CESM2 perturbed physics ensemble (PPE) of our own devising;  observed measurements are taken from FLUXNET flux tower sites. We find that the simple model captures land surface behaviour well except in mountainous regions.

Establishing a generalised parameter space, we see that most GCMs are in reasonable agreement with FLUXNET at FLUXNET sites, although there is evidence that GCMs consistently slightly overestimate the response of surface turbulent fluxes to downward radiation. Further, it is found that the differences between structurally different AMIP models are considerably greater than the differences between CESM2 PPE members -- even though the PPE parameters are varied across their realistic domain. If the simple model is trained only at GCM spatial gridpoints that contain a FLUXNET site, there is little degradation in simple model performance compared with global training, suggesting that even the few available tropical FLUXNET sites are useful for constraining land surface model response throughout the tropics. This is of course contingent on whether or not point measurements taken by FLUXNET are representative of the wider area around FLUXNET sites.

How to cite: Lambert, F. H., Zarakas, C., Natchiar S. R., M., Swann, A. L. S., and Koven, C. D.: Using a simple model to measure the differences between climate model land surface simulations and FLUXNET observations, EGU General Assembly 2024, Vienna, Austria, 14–19 Apr 2024, EGU24-8117, https://doi.org/10.5194/egusphere-egu24-8117, 2024.

EGU24-8397 | ECS | Orals | NP1.5

AMOC Stability amid Tipping Ice Sheets from Conceptual to Intermediate Complexity Models 

Sacha Sinet, Anna S. von der Heydt, Peter Ashwin, and Henk A. Dijkstra

The Atlantic Meridional Overturning Circulation (AMOC) and polar ice sheets are considered susceptible to critical transitions under climate change. Identified as core tipping elements, their collapse would have global and drastic consequences. Furthermore, the AMOC and polar ice sheets form a complex interacting system, where the collapse of one component can heavily impact the stability of others. In the worst case, this could result in a large-scale domino effect, otherwise known as a cascading tipping event.

In this presentation, our focus is on assessing the stability of the AMOC in the presence of tipping Greenland ice sheet (GIS) and West Antarctica ice sheet (WAIS). While most existing studies agree on the destabilizing impact of a GIS collapse on the AMOC, the consequences of a WAIS collapse remain uncertain. A previous conceptual study suggested that a WAIS tipping event might actually prevent an AMOC collapse against both climate warming and increased GIS meltwater fluxes. Using a better conceptual model of the AMOC, we demonstrate that both the melting rate and natural variability associated with surface meltwater fluxes are decisive factors for this phenomenon to occur. Finally, we present preliminary findings in which the relevance of this stabilizing effect is investigated in the model of intermediate complexity CLIMBER-X.

How to cite: Sinet, S., von der Heydt, A. S., Ashwin, P., and Dijkstra, H. A.: AMOC Stability amid Tipping Ice Sheets from Conceptual to Intermediate Complexity Models, EGU General Assembly 2024, Vienna, Austria, 14–19 Apr 2024, EGU24-8397, https://doi.org/10.5194/egusphere-egu24-8397, 2024.

EGU24-8729 | ECS | Orals | NP1.5

Quantifying risk of a noise-induced AMOC collapse from northern and tropical Atlantic Ocean variability 

Ruth Chapman, Peter Ashwin, Richard Wood, and Jonathan Baker

The Atlantic Meridional Overturning Circulation (AMOC) exerts a major influence on global climate. There is much debate about whether the current strong AMOC may collapse as a result of anthropogenic forcing and/or natural variability. Here, we ask whether internal decadal variability could affect the likelihood of AMOC collapse. We examine natural variability of basin-scale salinities and temperatures in four CMIP6 pre-industrial runs. We fit the CMIP6 variability to several empirical, linear noise models, and to a nonlinear, process-based AMOC model. The variability is weak and its processes inconsistent among the CMIP6 models considered. Based on the CMIP6 variability levels we find that noise-induced AMOC collapse is unlikely in the pre-industrial climate, but plausible if external forcing has shifted the AMOC closer to a threshold, which can be identified for the non-linear model using bifurcation analysis. However the CMIP6 models may systematically underestimate current Atlantic Ocean variability, and we find that substantially stronger variability would increase the likelihood of noise-induced collapse.

How to cite: Chapman, R., Ashwin, P., Wood, R., and Baker, J.: Quantifying risk of a noise-induced AMOC collapse from northern and tropical Atlantic Ocean variability, EGU General Assembly 2024, Vienna, Austria, 14–19 Apr 2024, EGU24-8729, https://doi.org/10.5194/egusphere-egu24-8729, 2024.

EGU24-9253 | ECS | Posters on site | NP1.5

The impact of model resolution on variability in a coupled land atmosphere model 

Oisín Hamilton, Jonathan Demaeyer, Anupama Xavier, and Stéphane Vannitsem

Reduced order quasi-geostrophic land-atmosphere coupled models display qualitatively realistic mid-latitude atmosphere behaviour, meaning that such models can produce typical atmospheric dynamical features such as atmospheric blocking. At the same time, due to a low number of degrees of freedom, they are still simple enough to allow for analysis of the system dynamics. These features mean that these models are well suited to investigating bifurcations in atmospheric dynamics, and use a dynamical systems approach to better understand the corresponding atmospheric behaviour. 

This project introduces a symbolic python workflow for using the flexible  land-atmosphere (qgs, 2020) spectral model with the continuation software AUTO. This work builds on the results of Xavier et al. (2023) to understand how the model variability and predictability is impacted by the model resolution. We also use bifurcation diagrams to better understand how parameters such as atmosphere-land friction impact the atmospheric blocking, and in turn the model atmosphere predictability. This is done for a range of model resolutions to investigate how the number of degrees of freedom impacts both the realism of the model, but also the structures found in the dynamics.


Demaeyer, Jonathan & De Cruz, Lesley & Vannitsem, S.: qgs: A flexible Python framework of reduced-order multiscale climate models. Journal of Open Source Software. 5. 2597. 10.21105/joss.02597, 2020. 


Xavier, A. K., Demaeyer, J., and Vannitsem, S.: Variability and Predictability of a reduced-order land atmosphere coupled model, EGUsphere [preprint], https://doi.org/10.5194/egusphere-2023-2257, 2023.

How to cite: Hamilton, O., Demaeyer, J., Xavier, A., and Vannitsem, S.: The impact of model resolution on variability in a coupled land atmosphere model, EGU General Assembly 2024, Vienna, Austria, 14–19 Apr 2024, EGU24-9253, https://doi.org/10.5194/egusphere-egu24-9253, 2024.

EGU24-10070 | ECS | Posters on site | NP1.5

Spatial fluctuations of the Arctic sea ice border 

Clara Hummel

Every year, the area of the Arctic sea-ice decreases in the boreal spring and summer and reaches its yearly minimum in the early autumn. Due to global warming, Arctic summer sea ice will most probably disappear. As the sea ice cover decreases, its border is retreating northwards towards the central Arctic. This retreat is not uniform in space and the variability of the border’s movement further North could yield an early warning signal for summer sea ice loss. Here, we track the sea ice border from time series obtained from models of various complexity and observations to study the spatial variability of the border’s movement as Arctic summer sea ice approaches its disappearance.

How to cite: Hummel, C.: Spatial fluctuations of the Arctic sea ice border, EGU General Assembly 2024, Vienna, Austria, 14–19 Apr 2024, EGU24-10070, https://doi.org/10.5194/egusphere-egu24-10070, 2024.

EGU24-11984 | Posters on site | NP1.5

Dependence of simulated variability of surface climate on model complexity – insights from an ensemble of transient simulations of the Last Deglaciation 

Elisa Ziegler, Nils Weitzel, Jean-Philippe Baudouin, Marie-Luise Kapsch, Uwe Mikolajewicz, Lauren Gregoire, Ruza Ivanovic, Paul Valdes, Christian Wirths, and Kira Rehfeld

Climate variability is crucial to our understanding of future climate change and its impacts on societies and the natural world. However, the climate records of the observational era are too short to explore long-term variability. Conversely, an exploration of long transient simulations from state-of-the-art Earth System Models (ESMs) poses high computational demands. It is therefore pertinent to identify the level of complexity sufficient to simulate the variability of surface climate from annual to centennial and longer timescales.

To this end, we use an ensemble of transient simulations of the Last Deglaciation, the last period of significant global warming. The ensemble covers an energy balance model (EBM), models of intermediate complexity (EMICs), general circulation models (GCMs) and ESMs. This constitutes a hierarchy that we categorize based on employed atmosphere and ocean components and their resolution, as well as implemented radiation, land hydrology, vegetation and aerosol schemes.

To investigate the simulated variability of surface temperature and precipitation, we analyze changes in the shapes of their distributions as characterized by their higher order moments – variance, skewness, kurtosis – with warming. These higher order moments relate the tails to the extremes of the distributions. We identify spatial and temporal patterns and how they depend on model complexity. The EMICs can generally match the global and latitudinal changes in temperature variability found in more complex models. However, they lack in precipitation variability. We further find that the EMICs fail to simulate the tails of the precipitation distributions. We observe dependency of variability on the background state, generally increasing with model complexity. However, there is still a large spread between models of similar complexity, some of which can be related to differences in forcings. Furthermore, questions remain on the abilities of models of any complexity to simulate a magnitude of long-term variability similar to that found regionally in proxy reconstructions. Our analysis offers implications as to the complexity needed and sufficient for capturing the full picture of climate change and we offer some first insights into how the findings translate to future projections of climate change.

How to cite: Ziegler, E., Weitzel, N., Baudouin, J.-P., Kapsch, M.-L., Mikolajewicz, U., Gregoire, L., Ivanovic, R., Valdes, P., Wirths, C., and Rehfeld, K.: Dependence of simulated variability of surface climate on model complexity – insights from an ensemble of transient simulations of the Last Deglaciation, EGU General Assembly 2024, Vienna, Austria, 14–19 Apr 2024, EGU24-11984, https://doi.org/10.5194/egusphere-egu24-11984, 2024.

EGU24-12421 | Posters on site | NP1.5

A Novel Process Model of Ocean-Sea-Ice Interaction Using CESM 

Paul Hall, Christopher Horvat, Baylor Fox-Kemper, Samuel Brenner, and Alper Altuntas

We report on the development of a novel process model created to study ocean-sea ice interaction and the dynamics of the upper ocean in the marginal ice zone (MIZ), built using the Community Earth System Model (CESM). Our model uses the MOM6 ocean model and CICE6 sea-ice model as active components within CESM, on a custom ~50km x ~50km grid with a horizontal resolution of ~50m, extending to a depth of 75m (30 vertical layers). The model allows for either reflecting or zonally re-entrant boundary configurations. Atmospheric forcing is imposed through a simplified data atmosphere component that provides constant forcing over the model domain. Results from several simple scenarios are presented and compared to results obtained using the MITgcm.

By working within CESM, we are able to leverage CESM’s existing infrastructure and capabilities, including the use of the Community Mediator for Earth Prediction Systems (CMEPS) for coupling between active components. Furthermore, additional model components that are already available within CESM (e.g., waves, atmosphere) can be incorporated into the process model in a straightforward way. Future work will include incorporation of a modified sea-ice component that allows tracking of individual floes utilizing a discrete element method approach.

How to cite: Hall, P., Horvat, C., Fox-Kemper, B., Brenner, S., and Altuntas, A.: A Novel Process Model of Ocean-Sea-Ice Interaction Using CESM, EGU General Assembly 2024, Vienna, Austria, 14–19 Apr 2024, EGU24-12421, https://doi.org/10.5194/egusphere-egu24-12421, 2024.

EGU24-14067 | ECS | Orals | NP1.5

A Forecast Test for Reducing Dynamical Dimensionality of Model Emulators 

Tongtong Xu, Matthew Newman, Michael Alexander, and Antonietta Capotondi

The climate system can be numerically represented by a set of physically-based dynamical equations whose solution requires substantial computational resources. This makes computationally efficient, low dimensional emulators that simulate trajectories of the underlying dynamical system an attractive alternative for model evaluation and diagnosis. We suggest that since such an emulator must adequately capture anomaly evolution, its construction should employ a grid search technique where maximum forecast skill determines the best reference model. In this study, we demonstrate this approach by testing different bases used to construct a Linear Inverse Model (LIM), a stochastically-forced multivariate linear model that has often been used to represent the evolution of coarse-grained climate anomalies in both models and observations. LIM state vectors are typically represented in a basis of the leading Empirical Orthogonal Functions (EOFs), but while dominant large-scale climate variations often are captured by a subset of these statistical patterns, key precursor dynamics involving relatively small scales are not. An alternative approach is balanced truncation, where the dynamical system is transformed into its Hankel space, whose modes span both precursors and their subsequent responses. Constructing EOF- and Hankel-based LIMs from monthly observed anomalous Pacific sea surface temperatures, both for the 150-yr observational record and a perfect model study using 600 yrs of LIM output, we find that no balanced truncation model of any dimension can outperform an EOF-based LIM whose dimension is chosen to maximize independent skill. However, the dynamics of a high-dimensional EOF-based LIM can be efficiently reproduced by far fewer Hankel modes.

How to cite: Xu, T., Newman, M., Alexander, M., and Capotondi, A.: A Forecast Test for Reducing Dynamical Dimensionality of Model Emulators, EGU General Assembly 2024, Vienna, Austria, 14–19 Apr 2024, EGU24-14067, https://doi.org/10.5194/egusphere-egu24-14067, 2024.

EGU24-14439 | ECS | Posters on site | NP1.5

Nonlocal energy fluxes and fractional operators in updated, stochastic, Budyko-Sellers models 

dustin lebiadowski and shaun Lovejoy

We introduce a stochastic, energy-balance, climate model defined over the macroweather regime (approximately 15 days or longer). Together, the energy balance principle, combined with the model’s natural scaling, demonstrate quite promising results despite the relative simplicity. A special case of the model can also be derived from a very classical basis, and, because of some similarities, we propose this model as a development upon the work of Budyko and Sellers.

When the classical Budyko-Sellers energy balance model is updated by using the (correct) radiative-conductive surface boundary conditions, one obtains the Fractional Energy Balance Equation (FEBE). The FEBE involves fractional space-time operators and its generic solutions are scaling, in agreement with much atmospheric and oceanic data. In time, it implies long range memories that have been successfully used to make both multi-decadal climate projections as well as monthly and seasonal (long range) forecasts. In space, the FEBE is nonlocal so that energy flux imbalances at any location can affect the balance in locations far away. This is possible because the model operates over monthly and longer time scales; over these scales, energy can be both stored and transported in the atmosphere, ocean, and subsurface.

Until now, the FEBE’s full nonlocal space-time interaction operator has been only approximated. Here, by introducing a numerical model, the nonlocal dynamics of the FEBE and corresponding Earth-system FEBE energy flows over the 2D Earth surface are fully detailed.

We propose the FEBE as an alternative to more conventional, deterministic, weather-regime-based climate models. Given the generality of the ideas pursued here - the use of fractional operators; the use of stochasticity and the macroweather regime - there seems a great potential for these to be used much more widely. Hopefully this research, and possibly related works, will encourage a greater diversity of pursuits and be inspiring to others in their own work.

How to cite: lebiadowski, D. and Lovejoy, S.: Nonlocal energy fluxes and fractional operators in updated, stochastic, Budyko-Sellers models, EGU General Assembly 2024, Vienna, Austria, 14–19 Apr 2024, EGU24-14439, https://doi.org/10.5194/egusphere-egu24-14439, 2024.

EGU24-14831 | ECS | Orals | NP1.5

SPEEDY-NEMO: performance and applications of a fully-coupled intermediate-complexity climate model 

Paolo Ruggieri, Muhammad Adnan Abid, Javier Garcia-Serrano, Carlo Grancini, Fred Kucharski, Salvatore Pascale, and Danila Volpi

A fully-coupled general circulation model of intermediate complexity is documented. The study presents an overview of the model climatology and variability, with particular attention for the phenomenology of processes that are relevant for the predictability of the climate system on seasonal-to-decadal time-scales. It is shown that the model can realistically simulate the general circulation of the atmosphere and the ocean, as well as the major modes of climate variability on the examined time-scales: e.g. El Niño-Southern Oscillation, North Atlantic Oscillation, Tropical Atlantic Variability, Pacific Decadal Variability, Atlantic Multi-decadal Variability. We demonstrate the ability of the model in simulating non-stationarity of coupled ocean-atmosphere modes of variability. Potential applications of the model are discussed, with emphasis on the possibility to generate sets of low-cost large-ensemble retrospective forecasts. We argue that the presented model is suitable to be employed in traditional and innovative model experiments that can play a significant role in future developments of seasonal-to-decadal climate prediction.

How to cite: Ruggieri, P., Abid, M. A., Garcia-Serrano, J., Grancini, C., Kucharski, F., Pascale, S., and Volpi, D.: SPEEDY-NEMO: performance and applications of a fully-coupled intermediate-complexity climate model, EGU General Assembly 2024, Vienna, Austria, 14–19 Apr 2024, EGU24-14831, https://doi.org/10.5194/egusphere-egu24-14831, 2024.

EGU24-16958 | Orals | NP1.5

The Challenge of Non-Markovian Energy Balance Models in Climate 

Nicholas Wynn Watkins, Raphael Calel, Sandra Chapman, Aleksei Chechkin, Rainer Klages, and David Stainforth

Hasselmann’s paradigm, introduced in 1976 and recently honoured with the Nobel Prize, can, like many key innovations in the sciences of climate and complexity, be understood on several different levels, both technical and conceptual. It can be seen as a mathematical technique to add stochastic variability into pioneering energy balance models (EBMs) of Budyko and Sellers. On a more conceptual level, it used the mathematics  of Brownian motion to provide an  abstract superstructure linking slow climate variability to fast weather fluctuations, in a context broader than EBMs, leading Hasselmann to posit the need for negative feedback in climate modelling.

Hasselmann's paradigm itself has much still to offer us [e.g. Calel et al, Naure Communications, 2020], but naturally, since the 1970s a number of newer developments have built on his pioneering ideas. One important one has been the development of a rigorous mathematical hierarchy that embeds Hasselmann-type models in the more comprehensive Mori-Zwanzig (MZ) framework  (e.g.  Lucarini and Chekroun, Nature Reviews Physics, 2023). Another has been the interest in long range memory in stochastic EBMs, notably Lovejoy et al’s Fractional Energy Balance Equation [FEBE, discussed in this week’s Short Course SC5.15 ]. These have a memory with slower decay and thus longer range than the exponential form seen in Hasselmann’s EBM. My presentation [based on Watkins et al, in review at Chaos] attempts to build a bridge between MZ-based extensions of  Hasselmann, and the fractional derivative-based FEBE model.  I will argue that the Mori-Kubo overdamped Generalised Langevin Equation, as widely used in statistical mechanics, suggests the form of a relatively simple stochastic EBM with memory for the global temperature anomaly, and will discuss how this relates to FEBE.

How to cite: Watkins, N. W., Calel, R., Chapman, S., Chechkin, A., Klages, R., and Stainforth, D.: The Challenge of Non-Markovian Energy Balance Models in Climate, EGU General Assembly 2024, Vienna, Austria, 14–19 Apr 2024, EGU24-16958, https://doi.org/10.5194/egusphere-egu24-16958, 2024.

EGU24-18360 | Posters on site | NP1.5

Eddy Saturation and Latitudinal Storm Track Shift in a Reduced Two-level Model of the Atmosphere 

Valerio Lucarini, Melanie Kobras, and Maarten Ambaum

We introduce a minimal dynamical system derived from the classical Phillips two-level model with the goal of elucidating the essential mechanisms responsible for the interaction between eddies and mean flow. The choice of a two-level model as starting points allows for appreciating the relative role of barotropic and baroclinic processes. Specifically, we wish to explore the eddy saturation mechanism, whereby, when average conditions are considered, direct forcing of the zonal flow increases the eddy kinetic energy, while the energy associated with the zonal flow does not increase. The eddy-driven jet stream and storm tracks in the mid-latitude atmosphere are known to shift in latitude on various timescales, but the physical processes that cause these shifts are still unclear. Using our low-order model, we aim to understand the link between the structure of the eddies and the shift of the latitudinal maximum of the zonal flow in the mid-latitude atmosphere. Our findings elucidate the basic mechanisms behind baroclinic adjustment and provide insights into the properties of the storm track change between the jet entrance and jet exit regions of the North Atlantic.

How to cite: Lucarini, V., Kobras, M., and Ambaum, M.: Eddy Saturation and Latitudinal Storm Track Shift in a Reduced Two-level Model of the Atmosphere, EGU General Assembly 2024, Vienna, Austria, 14–19 Apr 2024, EGU24-18360, https://doi.org/10.5194/egusphere-egu24-18360, 2024.

EGU24-18412 | ECS | Orals | NP1.5

Rapid Emulation of Spatially Resolved Temperature Response Functions to Effective Radiative Forcing 

Christopher Womack, Noelle Eckley Selin, and Sebastian Eastham

We utilize ideas from signal processing to demonstrate a novel methodology for climate emulation based on the response of the climate system to effective radiative forcing (ERF). While previous work has demonstrated the efficacy of impulse response functions as a tool for climate emulation, these methods are largely non-generalizable to new scenarios and are inaccessible to more general audiences. To remedy this, we propose a generalizable framework for emulation of climate variables such as near-surface air temperature, representing the climate system through the surrogate of spatially resolved impulse response functions. These response functions are derived through the deconvolution of ERF and near-surface air temperature profiles, treating ERF and near-surface air temperature as input and output signals, respectively. Using this framework, new scenarios can be quickly and easily emulated through convolution and other sets of impulse response functions can be derived from any pair of climate variables. We present results from an application to near-surface air temperature based on ERF and temperature data taken from experiments in the sixth phase of the Coupled Model Intercomparison Project (CMIP6). We evaluate the emulator using additional experiments taken from the CMIP6 archive, including the Shared Socioeconomic Pathways (SSPs), demonstrating accurate emulation of global mean and spatially resolved temperature change with respect to the outputs of the CMIP6 ensemble. Global absolute error in emulated temperature averages 0.25 degrees Celsius with a bias ranging from -0.14 to -0.04 degrees Celsius. We additionally show how our emulator can be implemented as a tool for climate education through integration with the En-ROADS platform, providing fast visualizations of spatially resolved temperature change for a number of policy-relevant scenarios. While it is unable to capture state-dependent climate feedbacks, such as the non-linear effects of Arctic sea ice melt in high-warming scenarios, our results show that the emulator is generalizable to any scenario independent of the specific forcings present.

How to cite: Womack, C., Eckley Selin, N., and Eastham, S.: Rapid Emulation of Spatially Resolved Temperature Response Functions to Effective Radiative Forcing, EGU General Assembly 2024, Vienna, Austria, 14–19 Apr 2024, EGU24-18412, https://doi.org/10.5194/egusphere-egu24-18412, 2024.

EGU24-22102 | Orals | NP1.5 | Highlight

From conceptual to complex earth system models: why are models so linear? 

Victor Brovkin, Tobias Stacke, Philipp de Vrese, Thomas Kleinen, and Alexander Winkler

The evolution of the Earth’s climate from the past to the future is explored by a hierarchy of models ranging from conceptual models to full-complexity, high-resolution Earth System Models (ESMs) (Claussen et al., 2002). The strength of conceptual models lies in the clarity of representing the concept of interactions between different climate processes, while ESMs  offer greater realism when it comes to spatial or temporal detail. Intermediate complexity models are somewhere in between, they are able to provide a big picture for long timescales. A common pattern throughout the model hierarchy, except for conceptual models illustrating multiple steady states, is often linearity of model responses to external forcing. This linearity can be visible in transient experiments, but also in equilibrium simulations. The question arises: is this linearity an artefact of our models, or is it reflective of reality?


In most cases, the linear response is likely representative of reality. As an example, we will focus on the linearity of land-related processes, such as climate-carbon feedbacks and permafrost-hydrology interactions. Permafrost systems have thresholds at 0°C, leading to nonlinearities at the local scale, but the combined response at large spatial scales tends to be more linear. However, nonlinear and abrupt changes are evident in geological records. For instance, the abrupt onset of the Bölling/Alleröd warming about 14.8 thousand years ago indicates that nonlinear changes on large spatial scales are indeed a real, albeit very rare, phenomenon. We will discuss possible reasons for the predominant linearity of the models and explore whether high-resolution models might show more nonlinear responses than coarse-grid models.


Reference:

Claussen, M., Mysak, L., Weaver, A. et al. Earth system models of intermediate complexity: closing the gap in the spectrum of climate system models. Climate Dynamics 18, 579–586 (2002). https://doi.org/10.1007/s00382-001-0200-1

How to cite: Brovkin, V., Stacke, T., de Vrese, P., Kleinen, T., and Winkler, A.: From conceptual to complex earth system models: why are models so linear?, EGU General Assembly 2024, Vienna, Austria, 14–19 Apr 2024, EGU24-22102, https://doi.org/10.5194/egusphere-egu24-22102, 2024.

EGU24-1427 | ECS | Orals | NP6.2

Experimental study of gravity current propagation over rough tilted surfaces 

Mostafa Shehata, Marie Rastello, Florence Naaim, and Herve Bellot

Numerous previous studies have been done to understand the physics of gravity currents. Some considered the propagation over smooth or rough horizontal surfaces (Tokyay et al. (2014), Zhou et al. (2017)), and others studied inclined surfaces without any roughness. What about the more complex situation of inclined rough surfaces? We have studied, experimentally, how a finite volume of heavy fluid (salted water with a clay suspension) rushing down a slope (20° & 30°) is affected by the multiple obstacles it counters on its way. Our setup is a classic volume release configuration in a 2D flume immersed in a 20 m3 water tank at INRAE Grenoble. The study tests (352 experiments per tilt) different initial conditions of the released flow (volume and density) and various surface conditions from smooth to rough:

  • For the initial conditions: the experiments show that the front velocity is monotonically related to its initial volume and density. Although the initial mass of the flow is the product of its density times volume, the mass effect on the flow front velocity cannot come in replacement of both volume and density effects, as it was found that the front velocity is non-monotonically related to its initial mass.
  • For the surface conditions: besides testing the smooth case, we have covered a wide range of roughness configurations using obstacles with different shapes, heights, and spacings. Walls or barriers blocking the whole width of the flume have been used (see Fig.1-a). Testing various heights and spacings shows that higher barriers decrease the flow front velocity, while non-monotonic relations were found when the spacing between successive barriers in the flow direction is changed. Flow propagation over and through an array of obstacles has also been studied with various obstacles arrangement (in-line and staggered) and different obstacles' cross-sections (rectangular and circular). For circular obstacles, the (x𝑓-t) curve is no longer smooth but takes the shape of stairsteps, and they are found to be more efficient in decelerating the flow (see Fig.1-b).

Studying both 20° and 30°-flume tilts enables us to look through the slope effect. The analysis shows that, in general, increasing the slope results in higher front velocity values. Nevertheless, the degree of influence is dependent on diverse factors (volume, density, bed surface conditions). In addition, we have studied the effect of the initial flow parameters on the flow height just after the lock release (at an accurate predetermined distance from the lock chosen based on 252 experiments). This height depends only on the initial volume and density effect is negligible. Determination of this height is essential for our non-dimensional analysis: to study the temporal evolution of the non-dimensional front position (𝑥𝑓−𝑥o)/𝑥o versus the non-dimensional time (t𝑓/to). Indeed, it will enable us to avoid using the initial flow depth at the lock that is highly dependent on the inclination angle, or an estimated virtual height after the lock that would be less representative (see Fig.1-c).

Fig. 1: 


How to cite: Shehata, M., Rastello, M., Naaim, F., and Bellot, H.: Experimental study of gravity current propagation over rough tilted surfaces, EGU General Assembly 2024, Vienna, Austria, 14–19 Apr 2024, EGU24-1427, https://doi.org/10.5194/egusphere-egu24-1427, 2024.

EGU24-1871 | Posters on site | NP6.2

Internal solitary wave energy transformations under ridged ice cover 

Kateryna Terletska, Vladimir Maderich, and Elena Tobisch

Propagation of internal solitary waves (ISW) under the edge of the ice cover may lead to their
destabilization through overturning and breaking events. Factors such as ice cover depth, ridging
intensity, and internal wave amplitudes play crucial roles in the evolution and disintegration of ISW
beneath the ice cover. In the study, a numerical investigation of the transformation of ISW
propagating from open water in the stratified sea under ridged ice cover is carried out. A
nonhydrostatic numerical model, that is based on the Reynolds averaged Navier-Stokes equations in
the Boussinesq approximation for a continuously stratified fluid, was used in the investigation. The
study focused on an idealized scenario with a vertical distribution of potential density anomalies
designed to replicate the summer profile of potential density observed over the Yermak Plateau in
the Arctic Ocean. In the numerical experiments, number of ice keels were placed beneath a
uniform-thickness ice layer. The ice keel shape was approximated by the Versoria function. It is
carried out calculations with a different ridging intensity, that is, the ratio of the maximum height of
the keel to the distance between the keels. In present calculations, it varies from 1/1000 for
moderately ridged ice to 1/20 for heavily ridged ice, which is broadly consistent with the ocean
values. The transformation of ISW of depression is additionally governed by the blocking
parameter β for a single keel, which is the ratio of the height of the minimum thickness of the upper
layer under the ice keel to the incident wave amplitude. An important characteristic of the ISW-
ridged ice interaction is the loss of kinetic and available potential energy during the ISW
transformation. Energy transformation due to mixing leads to the transition of energy to background
potential energy and energy dissipation. To characterize the dependence of energy loss on keel
height and distance between keels, we introduced the parameter, which is the ratio of the sum of
submerged ice thickness and maximal keel penetration to the distance between keels. An energy
loss was estimated based on a budget of depth-integrated pseudoenergy before and after the wave
transformation. The results revealed that the energy loss increases with a decrease in distance
between keels or an increase in keel height. The level of energy loss is highest for β values near
zero. For values β greater than 0.8, interaction is moderate or weak, and distance between the keels
no longer affects energy loss.

How to cite: Terletska, K., Maderich, V., and Tobisch, E.: Internal solitary wave energy transformations under ridged ice cover, EGU General Assembly 2024, Vienna, Austria, 14–19 Apr 2024, EGU24-1871, https://doi.org/10.5194/egusphere-egu24-1871, 2024.

EGU24-2296 | Posters on site | NP6.2

Obliquely interacting breathers in a three-layer fluid 

Keisuke Nakayama and Kevin Lamb

In a three-layer system with equal upper and lower thin layers with the same density jump across each interface, fully nonlinear governing equations have revealed that breathers exist under the Boussinesq approximation. Also, it has been demonstrated that breathers may occur in the Baltic Sea. Additionally, in previous studies, it has been shown that the larger the upper- and lower-layer thicknesses, the more the breathers behave like solitons and that phase shifts occur after two breathers interact, with a forward/backward shift of the faster/slower breather, while the properties of the breathers are preserved. Still, the oblique interaction of breathers has yet to be explored. Thus, we aimed to investigate oblique breather interactions in a three-layer system by using fully nonlinear numerical simulations to clarify the characteristics of breathers. The ratio of the thin layer thicknesses to the total depth was 0.25 in this study. Breathers have two significant parameters, p and q, corresponding to the wavelength of a breather and the envelope amplitude. So, we had several configurations to clarify the influence of incident angles and amplitudes on the breather interactions by changing the parameters p and q. Stably progressing breathers, where p and q are 0.025 and 0.006, were examined by changing the incident angles from 10 to 40 degrees to estimate a critical angle. Also, the oblique breather interactions with a larger envelope amplitude were simulated to analyse the amplitude dependence of the critical angle. A Mach stem was found to occur in oblique breather interactions. Also, the critical angle was revealed to decrease as the envelope amplitude decreases. The behaviour of obliquely-interacting breathers provides further evidence that breathers in a three-layer fluid have soliton-like characteristics.

How to cite: Nakayama, K. and Lamb, K.: Obliquely interacting breathers in a three-layer fluid, EGU General Assembly 2024, Vienna, Austria, 14–19 Apr 2024, EGU24-2296, https://doi.org/10.5194/egusphere-egu24-2296, 2024.

EGU24-3505 | ECS | Orals | NP6.2

Direction Symmetry of Wave Field Modulation by Tidal Current and its Consequences for Extreme Nonlinear Waves 

Saulo Mendes, Ina Teutsch, and Jérôme Kasparian

Theoretical studies on the modulation of unidimensional regular waves over a flat bottom due to a current typically assign an asymmetry between the effects of opposing/following streams on the evolution of major sea variables, such as significant wave height. The significant wave height is expected to monotonically increase with opposing streams and to decrease with following streams. To some extent, observations on data sets containing a few thousand of waves or over a continuous series of about a day confirm this prediction. Here we show that in very broad-banded seas with high directional spread, the asymptotic behavior of sea variables over large data sets is highly non-trivial and does not follow the theoretical predictions, especially at high values of the ratio between tidal stream and group velocity. Furthermore, we analyze the anomalous statistics originating from both forward and opposing non-stationary currents. Despite the sea states being dominantly broad-banded and featuring a large directional spread, we found that anomalous statistics are of the same order of magnitude of those observed in unidirectional laboratory experiments and symmetrical in regard to the orientation of the tidal current.

How to cite: Mendes, S., Teutsch, I., and Kasparian, J.: Direction Symmetry of Wave Field Modulation by Tidal Current and its Consequences for Extreme Nonlinear Waves, EGU General Assembly 2024, Vienna, Austria, 14–19 Apr 2024, EGU24-3505, https://doi.org/10.5194/egusphere-egu24-3505, 2024.

We investigate the properties of, and can carry out a stability analysis of a baroclinic current in, a stratified thermal rotating shallow-water model for the subinertial dynamics of the upper ocean, a key player in the global climate system where most of the ocean variability is concentrated affecting the lateral transport of floating material such as plastic garbage, oil, and Sargassum seaweed.  Unlike the standard thermal model, the model considered here includes linear buoyancy variation in the vertical, still maintaining its two-dimensional structure and that of the adabatic (constant density) model.  Like the standard thermal model, the stratified thermal model produces submesoscale circulations resembling those observed in satellite imagery, yet taking longer to manifest.  Our study is motivated by this numerical observation. The model possesses a Lie--Poisson Hamiltonian structure.  A particular aspect of the model is that it supports motion integrals which neither form the kernel of the corresponding bracket nor are related to any explicit symmetries via Noether's theorem.  Among other things, we investigate the role of these conservation laws in constraining the growth of finite-amplitude perturbations to a zonal flow with quadratic vertical shear. Joint work with Maria J. Olascoaga.

How to cite: Beron-Vera, F.: Properties and baroclinic instability of stratified thermal ocean flow, EGU General Assembly 2024, Vienna, Austria, 14–19 Apr 2024, EGU24-3654, https://doi.org/10.5194/egusphere-egu24-3654, 2024.

Internal waves have a wide range of scales but are typically unresolved in climate or global models. With an unprecedented capability of observing and simulating these processes, they are becoming increasingly important to quantify the upscale effect of these processes. As the largest marginal sea in the western Pacific, the South China Sea has the most energetic and frequent internal waves around the world. These waves are also affected by multiscale processes, climate changes, and anthropogenic impacts. There have been considerable advances in exploring the generation and propagation of internal waves in recent years. However, the understanding of the formation and fate of internal solitary-like waves on the continental shelf is still very limited. It is widely accepted that these internal waves generally originate from the Luzon Strait. They usually have regular occurrence and are phase-locked to tidal forcing in the Luzon Strait. However, we present field measurements showing an irregular occurrence of nonlinear internal waves on the northern shelf of the South China Sea. This irregular occurrence is in striking contrast to the prominent predictability of internal waves originating from the Luzon Strait. We reveal that the intermittent nature of the occurrence is due to the local generation of nonlinear internal waves on the continental shelf, in addition to the fission of shoaling internal waves. The results reported here are expected to apply to other shelf regions of the world's oceans.

How to cite: Bai, X.: Intermittent Generation of Nonlinear Internal Waves on Continental Shelf, EGU General Assembly 2024, Vienna, Austria, 14–19 Apr 2024, EGU24-4294, https://doi.org/10.5194/egusphere-egu24-4294, 2024.

EGU24-5897 | ECS | Orals | NP6.2

On the turbulent structures generated by intruding downslope rotating gravity currents 

Tassigny Axel, Negretti Maria Eletta, and Wirth Achim

Gravity currents play a crucial role in the formation of deep waters in the ocean, contributing to the vorticity and energy transfers towards the ocean interior. We present results from an experimental study on downslope intruding and rotating gravity currents into an initially two-layer stably stratified ambient at high buoyancy Reynolds numbers. A new turbulent process of downslope transport, intermittent and localized, is identified, taking the form of cascades. The lifetime of cascades presents a power law relationship, and the related transport does not exhibit any characteristic length scale, suggesting self-organized criticality. Cascades reveal to be the main contributor to the vorticity and turbulence in the ocean interior, with a dependence on the Coriolis parameter and the density anomaly to the surrounding ambient. Vorticity is produced both by the spreading of the cascade into the interior, and by the meandering and the break up of the deep boundary current (formed from downward Ekman transport). When the intrusion spreads at the pycnocline only, anticyclonic eddies are formed in the intrusion and top layers, whereas for intrusions spreading through the full bottom layer, vortices of both signs are generated due to bottom friction. The turbulence in the receiving ambient reveals to be horizontally isotropic, non-stationary and non-homogeneous. In the intrusion area close to the slope, the turbulence is forced by energy injection at the penetration length scale through the cascades. The central area far from the boundaries is characterized, instead, by freely evolving two-dimensional turbulence, forced at large scales.


How to cite: Axel, T., Maria Eletta, N., and Achim, W.: On the turbulent structures generated by intruding downslope rotating gravity currents, EGU General Assembly 2024, Vienna, Austria, 14–19 Apr 2024, EGU24-5897, https://doi.org/10.5194/egusphere-egu24-5897, 2024.

EGU24-5954 | Posters on site | NP6.2 | Highlight

A physical model of the Gibraltar Strait: the HERCULES experiment 

Maria Eletta Negretti, Axel Tassigny, and Louis Gostiaux

Gravity currents are one of the key sub-mesoscale processes that drive energy transfer, impact the thermohaline structure and the vertical exchange of water masses in the ocean. At present, their representation remains difficult in numerical models. The targeted study area is the Strait of Gibraltar between the Mediterranean and the Atlantic Ocean. We present preliminary results of experiments obtained using the first realistic implementation of the Strait of Gibraltar with the adjacent Gulf of Cadiz and Alboran Sea, including all main forcings: the density difference, the barotropic tide, the Earth’s rotation and the realistic topography, scaled using available in-situ data. Detailed measurements of the velocity and density fields reveal that the large-scale circulation and the further faith of the Mediterranean waters flowing into the Atlantic Ocean are strongly influenced by the turbulent processes at small scale that take place in the main control areas, i.e. the Camarinal and Espartell sills. Two-dimensional velocity and density fields in these key regions and in several locations in the Gulf of Cadiz and Alboran Sea are obtained and turbulent fluxes and mixing are estimated. Finally, internal solitary waves are observed, possibly degenerating in a train of internal waves, generated by the tide in interaction with the topography at Camarinal sill and propagating toward the Alboran Sea. These results are analyzed to assess the impact of the parameter variation (barotropic and baroclinic forcings).

How to cite: Negretti, M. E., Tassigny, A., and Gostiaux, L.: A physical model of the Gibraltar Strait: the HERCULES experiment, EGU General Assembly 2024, Vienna, Austria, 14–19 Apr 2024, EGU24-5954, https://doi.org/10.5194/egusphere-egu24-5954, 2024.

EGU24-6066 | Posters on site | NP6.2

Density-driven flow propagating over a bottom large-scale roughness 

Claudia Adduce, Maria Rita Maggi, and Giovanni Di Lollo

The hydrostatic imbalance between two adjacent fluids, driven by density variations associated with temperature, salinity, or sediment concentration gradients, often initiates the formation of gravity currents. These phenomena play a crucial role in various geophysical and engineering applications, influencing atmospheric, terrestrial, and subaqueous environments. In recent years, there has been growing research interest in understanding the interaction of gravity currents with obstacles on the seafloor. These obstacles can be artificial structures like pipelines and gas pipelines situated in the oceanic environment. Therefore, it is essential to investigate the dynamics of gravity currents over complex topography and analyze their characteristics and behavior as the initial conditions vary. This study experimentally examines the evolution of bottom-propagating gravity currents in the presence of an array of submerged cylindrical obstacles. The laboratory experiments were conducted within a Perspex tank with dimensions of 3 m in length, 0.3 m in height, and 0.2 m in width, using the lock-release technique by filling the left and right volumes of the tank to the same water depth. The density difference was reproduced through a salinity gradient. Submerged roughness was introduced by arranging a series of rigid plastic cylinders at a specified location, covering the entire width of the channel. Two different diameters, 2 cm and 2.5 cm, were analyzed, and the initial current depths were varied. A total of 24 full-depth lock-exchange experiments were performed. We employ an innovative image analysis technique based on light reflection to evaluate the instantaneous density fields. To apply the light attenuation technique and visualize the dense fluid, a controlled quantity of dye was introduced into the saline water. A calibration method was used to establish the correlation between light intensity and dye concentration for each pixel in the captured images. The conducted study clearly illustrates that an adequate height of obstacles results in a substantial portion of denser fluid being impeded by the foremost obstacle in an array. Additionally, transitioning from densified to less-densified array geometries induces distinct changes in flow morphologies. Upon concluding the analysis of this study, it is evident that all the experiments are affected by the presence of substantial bottom roughness.

How to cite: Adduce, C., Maggi, M. R., and Di Lollo, G.: Density-driven flow propagating over a bottom large-scale roughness, EGU General Assembly 2024, Vienna, Austria, 14–19 Apr 2024, EGU24-6066, https://doi.org/10.5194/egusphere-egu24-6066, 2024.

EGU24-6081 | ECS | Posters on site | NP6.2

The asymmetric evolution of three-dimensional gravity currents in cold, fresh water 

Nicolas Castro-Folker, Andrew P. Grace, and Marek Stastna

In a single-component system density depends only on temperature. If this dependence is linear, then we can expect a pair of floating and sinking gravity currents with i) the same absolute initial density difference between intruding and ambient fluids, and ii) initial conditions that (under a certain non-dimensionalisation) obey reflectional symmetry across mid-depth to maintain that symmetry throughout their evolution. However, water attains its maximum density at approximately 4°C, so the density of a cold (<10°C), freshwater system has an effectively quadratic, and therefore nonlinear, dependence on temperature. Work in two dimensions shows that the profile, speed, and shear instabilities of initially reflectional-symmetric currents evolve asymmetrically under the influence of a nonlinear equation of state. We extend this work to three-dimensional systems with no-slip boundary conditions. This allows us to also consider the lobe-cleft instability: an inherently three-dimensional instability that produces dynamic patterns of folds and protrusions along the front of gravity currents. In this talk we will discuss how the lobe-cleft instability is modulated by the nonlinear equation of state. We will also discuss how the lobe-cleft instability three-dimensionalises the billows produced by the shear instability along the top/bottom of sinking/floating currents, and how this, too, is affected by the nonlinear dependence on temperature.

How to cite: Castro-Folker, N., Grace, A. P., and Stastna, M.: The asymmetric evolution of three-dimensional gravity currents in cold, fresh water, EGU General Assembly 2024, Vienna, Austria, 14–19 Apr 2024, EGU24-6081, https://doi.org/10.5194/egusphere-egu24-6081, 2024.

EGU24-6404 | ECS | Orals | NP6.2 | Highlight

The Stratified Inclined Duct: a new canonical laboratory experiment to study ocean turbulence and mixing 

Adrien Lefauve, Miles Couchman, and Paul Linden

We present a relatively recent laboratory experiment, the Stratified Inclined Duct (SID), that sustains a buoyancy-driven exchange flow and allows to accurately control and measure stratified sheared turbulence. The submesoscale turbulent mixing of momentum, heat, and salinity in the ocean have a leading-order but poorly constrained large-scale impact. We argue that SID may serve as a fruitful testbed for studying these processes, especially near boundaries, such as in estuaries.

First, we introduce SID, which consists of two large (400 litres) reservoirs containing salt solutions connected by a long rectangular duct. The long-lasting  exchange within the duct has a Reynolds number of order Re ~ 1,000-10,000. The apparatus can be tilted at a small angle θ with respect to the horizontal, which energises the flow and increases turbulence levels, due to the emergence of 'hydraulic control'.

Second, we present high-resolution experimental measurements of the three-dimensional velocity and density field within the duct which allow to delve into the energetics of stratified turbulence. SID uniquely allows the experimenter to control the level of turbulent kinetic energy dissipation, and to sweep through increasingly turbulent regimes by varying the key product Re*θ. The levels of turbulent intensity are comparable to those found in moderately turbulent patches in the ocean.

Third, we demonstrate that a data-driven analysis combining automated image analysis, data reduction and unsupervised clustering discovered previously unsuspected patterns in a large SID turbulence dataset. Multiple types of energetic turbulence were found, as well as intermittent turbulence that cycles between these types through distinct transition pathways. We argue that this data-driven identification of turbulence is a stepping stone towards better physics-based parameterizations.

How to cite: Lefauve, A., Couchman, M., and Linden, P.: The Stratified Inclined Duct: a new canonical laboratory experiment to study ocean turbulence and mixing, EGU General Assembly 2024, Vienna, Austria, 14–19 Apr 2024, EGU24-6404, https://doi.org/10.5194/egusphere-egu24-6404, 2024.

EGU24-6447 | Posters on site | NP6.2

Simulations of the three-dimensional structure of instabilities beneath shoaling internal waves 

Marek Stastna and Nico Castro-Folker

The simulation of instability and transport in the bottom boundary layer by internal solitary waves has been documented for over twenty years.  However, the challenge of shallow slopes and a disparity of scales between the large scale wave and the small scale boundary layer has proven challenging for simulations.  We present laboratory scale simulations that resolve the three-dimensionalisation in the boundary layer during the entire shoaling process.  We find that the late stage, in which the incoming wave fissions into boluses, provides the most consistent source of three-dimensionalisation.  In the early stage of shoaling, three-dimensionalisation occurs not so much due to separation bubble instability, but to the interaction of vortices shed from the separation bubble with the overlying pycnocline.

How to cite: Stastna, M. and Castro-Folker, N.: Simulations of the three-dimensional structure of instabilities beneath shoaling internal waves, EGU General Assembly 2024, Vienna, Austria, 14–19 Apr 2024, EGU24-6447, https://doi.org/10.5194/egusphere-egu24-6447, 2024.

EGU24-8014 | ECS | Orals | NP6.2

A new approach to understanding fluid mixing in process-study models of stratified fluids 

Sam Hartharn-Evans, Marek Stastna, and Magda Carr

Well established energy-based methods of quantifying diapycnal mixing in process-study numerical models are often used to provide information about when mixing occurs, and how much mixing has occurred. However, describing how and where this mixing has taken place remains a challenge. Moreover, methods based on sorting the density field struggle with under resolution and uncertainty as to the definition of the reference density when bathymetry is present. Here, an alternative method of understanding mixing is proposed. Paired histograms of user selected variables (which we abbreviate USP) are employed to identify mixing fluid, and are then used to display regions of fluid in physical space that are undergoing mixing. Here, two case studies are presented to showcase this method: shoaling internal solitary waves and a shear instability in cold water influenced by the nonlinearity of the equation of state. For the first case, the USP method identifies differences in the mixing processes associated with different internal solitary wave breaking types, including differences in the horizontal extent and advection of mixed fluid. For the second case, the method is used to identify how density, and passive tracers are mixed within the core of the asymmetric cold-water Kelvin-Helmholtz instability.

How to cite: Hartharn-Evans, S., Stastna, M., and Carr, M.: A new approach to understanding fluid mixing in process-study models of stratified fluids, EGU General Assembly 2024, Vienna, Austria, 14–19 Apr 2024, EGU24-8014, https://doi.org/10.5194/egusphere-egu24-8014, 2024.

EGU24-9523 | ECS | Posters virtual | NP6.2

Continuous motion conditions of turbidity current in Xiaolangdi reservoirs, China 

Fei Yang, Qiang Wang, Yuangjian Wang, and Enhui Jiang

Turbidity currents venting is most efficient method for Xiaolangdi reservoir under normal water level when tackling sediment-laden floods to reduce sedimentation. The concept of continuous motion conditions of turbidity current was introduced as the requirements for the main part of turbidity current reach the dam site. Dynamics of turbidity currents in Xiaolangdi reservoir were investigated using the layer-averaged equations of motion. Water-sediment exchange with bed and above have been concealed for simplicity, by which the mechanism that drives continuous motion is subjected to the gravitational force. Two major control parameters, the relative longitudinal bed slope and the relative length of turbidity current, are proposed regarding topography and hydrodynamics. The ratio of the average riverbed longitudinal gradient J from the plunging point to the dam site to the critical gradient Jc of the turbidity current, J/Jc, represents the relative longitudinal bed slope. The ratio of the product of the equilibrium velocity u and duration T of the turbidity current to the radial distance L from the plunging point to dam site, uT/L, represents the relative length of turbidity current. Therefore, a discrimination diagram for continuous motion conditions of turbidity current was determined based on J/Jc and uT/L, successfully differentiated whether turbidity currents can reach the Xiaolangdi dam site.

How to cite: Yang, F., Wang, Q., Wang, Y., and Jiang, E.: Continuous motion conditions of turbidity current in Xiaolangdi reservoirs, China, EGU General Assembly 2024, Vienna, Austria, 14–19 Apr 2024, EGU24-9523, https://doi.org/10.5194/egusphere-egu24-9523, 2024.

EGU24-9933 | Posters on site | NP6.2 | Highlight

An operational model for wind-blown volcanic umbrella clouds 

Chris Johnson, Frank Millward, and Helen Webster

The plume of ash and gas released by large explosive volcanic eruptions rises to its neutral buoyancy level in the atmosphere, then spreads laterally to form an umbrella cloud. Density stratification of the atmosphere generates buoyancy forces in the cloud, which drive the outward spread as an intrusion. Although umbrella clouds are often modelled as circular axisymmetric structures, in practice they are usually influenced quite strongly by the meteorological wind, with spread in the upwind direction halted by the oncoming wind, and different rates of spreading in the downwind and crosswind directions. Here, we present a physically based shallow-layer intrusion model for wind-blown volcanic umbrella clouds, and derive a simple parametrization of non-axisymmetric umbrella cloud spreading based on this shallow-layer model. The simplified parametrization is quick to evaluate and so is suitable for use in operational Volcanic Ash Transport and Dispersion Models (VATDMs) that are used to predict ash hazard operationally. In contrast to previous parametrizations, in which there is assumed to be no interaction between a circular umbrella cloud and the meteorological wind, here the umbrella cloud is influenced by the wind and adopts a shape determined by the balance of buoyant spreading and downwind drag forces. We test our scheme within the UK Met Office 'NAME' dispersion model, and apply it to four diverse case studies of eruptions at Puyehue 2011, Pinatubo 1991, Ulawun 2019, and Calbuco 2015. We demonstrate that buoyant spreading is important even in plumes that are highly wind-blown, and obtain better descriptions of cloud spread and ash distribution than existing parametrizations based on an axisymmetric umbrella cloud dynamics.

How to cite: Johnson, C., Millward, F., and Webster, H.: An operational model for wind-blown volcanic umbrella clouds, EGU General Assembly 2024, Vienna, Austria, 14–19 Apr 2024, EGU24-9933, https://doi.org/10.5194/egusphere-egu24-9933, 2024.

EGU24-10029 | ECS | Orals | NP6.2

The characterization of the dynamics of a continuous gravity current 

Mohamad Harrouk, Rabah Mehaddi, Boris Arcen, and Yvan Dossmann

The present work investigates the dynamical characteristics of a gravity current produced by a continuous and steady release of a dense fluid, with a source density ρ0, into a lighter ambient fluid, with density ρa < ρ0. A planar geometry is considered in which the ambient fluid is initially at rest inside a rectangular tank and the dense current is continuously released from a source located at the bottom-left corner of the tank.  The released current propagates along the horizontal bottom boundary of the domain displacing the ambient fluid. This configuration has been considered experimentally by Sher & Woods (2017). A numerical study has been carried out using the Direct Numerical Simulations (DNS) of the governing equations via the NEK5000 solver. Instantaneous three-dimensional velocity, pressure and density fields were extracted and two-dimensionalized by width-averaging. The state of the release is characterized by the source Froude number Fr0 = u0 / √(g'0 h0 ) with u0 being the velocity of the release, h0 being the height at the inlet, and g'0 = g (ρ0 - ρa)/ρa being the source buoyancy. Throughout the series of simulations, we control the state of the current at the source by only varying the source density ρ0, resulting in a range of source Froude number between 0.6 < Fr0 < 2.7, and we seek to record the effects of this variation on the dynamics. The source discharge Q0 = u0 h0 and buoyancy flux B0 = Qg'0 are kept constant over time. The front speed, uf, was shown to remain steady; a well-known feature of continuous gravity currents. A dimensionless parameter, λ = uf/B01/3, that characterizes the front speed was computed as a function of Fr0 and the result shows a good agreement with the range recorded by Sher & Woods (2017). The entrainment of ambient fluid into the current is parametrized with two methods. First, we estimate the rate of change of the volume of the current, dV/dt, and we recorded the range 1.8Q0 < dV/dt < 2.1Q0 for the selected Fr0  range. Secondly, the theory of inclined plumes introduced by Ellison & Turner (1959) was considered to estimate a local entrainment parameter, E, as a function of the local stratification represented by the local Richardson number Ri. The well-known relation, E proportional to Ri-1, was held when Ri < 0.8; otherwise, the entrainment parameter tends to near-zero values.

How to cite: Harrouk, M., Mehaddi, R., Arcen, B., and Dossmann, Y.: The characterization of the dynamics of a continuous gravity current, EGU General Assembly 2024, Vienna, Austria, 14–19 Apr 2024, EGU24-10029, https://doi.org/10.5194/egusphere-egu24-10029, 2024.

EGU24-10281 | Orals | NP6.2

Analyzing the Dynamics of Multiple ISW Emissions in the Strait of Gibraltar 

Jean-Baptiste Roustan, Lucie Bordois, Franck Dumas, Francis Auclair, and Xavier Carton

Internal solitary waves with large amplitude have long been observed in the Strait of Gibraltar (SoG). Beautiful satellite images depict the ISW observed at the entrance of the Alboran Sea, generated by the interaction between tides and the topography at Camarinal Sill, the most important topographic obstacle in the Strait. As the tidal current heads west, it becomes supercritical over the sill, leading to the development of an internal hydraulic jump. When the current weakens, the flow reverts to subcritical,  the internal hydraulic jump is released, leading to the eastward propagation of an internal bore. This bore progressively transforms into an ISW train due to non-hydrostatic dispersion and non-linear effects. While the main mechanism of generation is now well understood, there are still open questions about the intricate dynamics of these nonlinear internal waves and their evolution along the Strait. Previous studies show an important variability in the shape, intensity and arrival time of this internal solitary train. 


Recent field experiments have revealed a complex network of local hydraulic jumps forming near Camarinal Sill. From the same dataset, the potential generation of not just one but two ISW trains has been addressed.  Then, we have investigated the implication on the evolution of these trains during their journey in the Strait of Gibraltar. 


Our mooring data reveal the presence of two trains of ISWs with slightly different north-south fronts east of Camarinal Sill. We propose hypotheses to explain the tilting of the fronts based on differential mixing and meridional tidal variability . Moreover, these findings prompt us to reconsider our understanding of the physics responsible for the observation of non-rank ordered ISW trains in the eastern part of the strait. To deeply investigate the consequences of nonlinear wave-wave interaction in the disorganization of the train, we implemented a simplified 3D non-hydrostatic configuration. 

How to cite: Roustan, J.-B., Bordois, L., Dumas, F., Auclair, F., and Carton, X.: Analyzing the Dynamics of Multiple ISW Emissions in the Strait of Gibraltar, EGU General Assembly 2024, Vienna, Austria, 14–19 Apr 2024, EGU24-10281, https://doi.org/10.5194/egusphere-egu24-10281, 2024.

EGU24-13002 | Orals | NP6.2

On the contribution of ocean fronts to the anomalous scaling of the structure functions 

Jordi Isern-Fontanet, Antonio Turiel, Cristina González-Haro, and Viktor G. Gea

The upper ocean is crowded with fronts of different intensities and extensions,  which are known to play a major role in the dynamics of the oceanic upper layers and contribute to set some properties such as the spectral slopes of Sea Surface Temperatures (SST), among others. Here, we show that the upper layers of the ocean can be modeled by the multifractal theory of turbulence and, then, we use this theory to predict the link between the most intense fronts and the scaling properties of the structure functions. This prediction is, finally, verified with a wide range of observations and numerical simulations.

In particular, we show that the behavior of thermal gradients at small enough scales can be characterized by singularity exponents. Then, we use the singularity exponents of thermal gradients as a measure of the intensity of thermal fronts; and the fractal dimension of the set of points with the same singularity exponent, known as the singularity spectrum, as a measure of their extension. This allows us to connect fronts with the structure functions of temperature using the multifractal formalism. Assuming that the turbulent cascade can be modeled with the log-Poisson model, we analytically shown that the anomalous scaling of the structure functions is a function of the intensity of the strongest front, i.e. the smallest singularity exponent. This prediction is verified using the SST provided by numerical simulations of an upwelling system; simulations of the global ocean; and satellite observations. Moreover, we show that the predicted relationship is also valid for other variables such as velocities.

Our results not only provide insight on the functioning of the upper ocean, but also provide a guide to develop and adjust numerical models. Indeed, our results imply that numerical models have to correctly model, or parametrize, those processes generating the most intense fronts, in order to properly reproduce some of the statistics of ocean temperatures.


How to cite: Isern-Fontanet, J., Turiel, A., González-Haro, C., and Gea, V. G.: On the contribution of ocean fronts to the anomalous scaling of the structure functions, EGU General Assembly 2024, Vienna, Austria, 14–19 Apr 2024, EGU24-13002, https://doi.org/10.5194/egusphere-egu24-13002, 2024.

EGU24-14146 | Orals | NP6.2

Sediment remobilization over subaqueous sand waves: Insights from in-situ observation in the northern South China Sea 

Yulong Zhao, Yanwei Zhang, Pengfei Ma, Xiaodong Zhang, and Zhifei Liu

Subaqueous sand waves are widely observed in the world′s oceans, but few in-situ observations have been performed to understand the dynamic processes of how they form and migrate. Large-amplitude subaqueous sand waves, 1.5 to 20 m in height and 55 to 510 m in length, are found on upper continental slope of the northern South China Sea, at water depths of ~ 150 to 800 m. Herein, high-resolution tripod observations were conducted in this sandwave field to understand the dynamic mechanism how sandy sediments are remobilized by oceanic dynamic processes, in particular internal solitary waves and internal tides. Our results indicate that near-critical reflection of diurnal internal tides at the continental slope can cause high suspended sediment concentration within the bottom water at a narrow belt further upslope to the observation site downslope locations. These sediments are transported downslope by the ebb tides to the observation site, forming the daily-recurring high suspended sediment concentration. The passage of episodic extreme internal solitary waves can result in much denser high sediment clouds with a thickness of up to ~ 40–50 m above the seafloor. These high suspended sediment concentration events are caused by in-situ resuspension of sediments from the seabed and upward transport of these sediments out of the boundary layer in response to passing of internal solitary waves. The two sub-processes of sediment resuspension are regulated by distinct dynamic mechanisms: incipient sediment resuspension from seafloor is controlled by current-induced strong bed shear stress, while the upward transport of sediments out of the bottom boundary layer is driven by the upwelling convergent currents at the rear of the internal solitary waves. Such results provide new insights into understanding the dynamic mechanism of the so-called ‘resuspension’ process in marine sedimentology. Our results also highlight the importance of internal solitary waves and internal tides in modulating sediment remobilization over subaqueous sandwave fields.

How to cite: Zhao, Y., Zhang, Y., Ma, P., Zhang, X., and Liu, Z.: Sediment remobilization over subaqueous sand waves: Insights from in-situ observation in the northern South China Sea, EGU General Assembly 2024, Vienna, Austria, 14–19 Apr 2024, EGU24-14146, https://doi.org/10.5194/egusphere-egu24-14146, 2024.

EGU24-14658 | ECS | Posters on site | NP6.2

Temperature imaging of density currents using phosphor micrometric particles 

Gauthier Rousseau, Nathan Pellerin, Benoît Fond, and Koen Blanckaert

Recent advancements in fluid flow imaging techniques have made it possible to visualize local temperature in flows by observing the response of photoluminescent dye or particles to light excitation. This has sparked increased interest in exploring laboratory-scale density currents induced by temperature differences. However, unlike the commonly investigated saltwater-freshwater or turbidity currents, heat transfer through boundaries can occur, potentially influencing the dynamics of the density current.

In this study, we utilize the dependence of the luminescence persistence time following pulse excitation on ambient fluid temperature of micrometric phosphor particles (YAG:Cr) to spatially and temporally resolve gravity currents produced by a lock-exchange flow. Notably, we introduce a novel inexpensive approach, which combine the use of LEDs and inexpensive high resolution CMOS sensors operated in a multi gate accumulation mode to extract temperature information with high spatial resolution. This simple method holds promise as it significantly enhances the accessibility of high resolution temperature imaging techniques for experimentalists. It can be applied to various thermal fluid experiments, to study for example thermal convection in fluid bodies.

How to cite: Rousseau, G., Pellerin, N., Fond, B., and Blanckaert, K.: Temperature imaging of density currents using phosphor micrometric particles, EGU General Assembly 2024, Vienna, Austria, 14–19 Apr 2024, EGU24-14658, https://doi.org/10.5194/egusphere-egu24-14658, 2024.

Two-dimensional Navier-Stokes turbulence on a rotating sphere is one of the most fundamental mathematical models for describing the dynamics of planetary atmospheres and oceans. Despite its great simplicity, this system is known to have a solution with an anisotropic non-uniform large-scale structure similar to the zonal flows similar to those on Jupiter and other giant gas planets. Although westward circumpolar zonal flows are formed in the free-decay problem [1, 2] and multiple zonal band structure is formed in the forced problem [3, 4], the formation mechanism of the large-scale zonal flows has not yet been fully clarified. From the mean flow non-acceleration theorem based on the weakly non-linear theory [5, 6, 7], the effect of viscosity is sometimes considered to be its essential factor. However, there is no guarantee that the suggestion from the weakly nonlinear theory hold for fully nonlinear systems. In fact, Obuse and Yamada [8] reported the formation of large-scale westward circumpolar zonal flows in an unforced two-dimensional turbulence on a rotating sphere even when considering inviscid flows, which strongly suggests that the main factor in the formation mechanism of large-scale zonal flows is the nonlinearity of the Navier-Stokes or Euler equations, not the dissipation by viscosity.

In this study, we consider two-dimensional Navier-Stokes equations on a rotating sphere, and focus on three-wave nonlinear interactions of Rossby waves, which are linear solutions of this system, to investigate the factors directly involved in the mechanism of large-scale zonal flow formation. The three-wave non-resonant nonlinear interactions of Rossby waves are investigated in detail, by calculating the time derivative of energy of zonal Rossby modes. The obtained results suggest that the formation of the westward circumpolar large-scale zonal flows is directly caused by non-local energy transfer due to near-resonant interactions.

[1] S. Yoden and M. Yamada, “A numerical experiment on two-dimensional decaying turbulence on a rotating sphere,"  J. Atomos. Sci., 50, 631-643 (1993)

[2] S. Takehiro, M. Yamada, Y.-Y. Hayashi, "Energy accumulation in easterly circumpolar jets generated by two-dimensional barotropic decaying turbulence on a rapidly rotating sphere", J. Atmos. Sci., 64, 4084-4097 (2006)

[3] T. Nozawa and S. Yoden, "Formation of zonal band structure in forced two-dimensional turbulence on a rotating sphere," Phys. Fluids, 9, 2081-2093 (1997)

[4] K. Obuse, S. Takehiro, M. Yamada, "Long-time asymptotic states of forced two-dimensional barotropic incompressible flows on a rotating sphere", Phys. Fluids., 22, 156601 (2010)

[5] G. Charney and P.G. Drazin,"Propagation of planetary-scale disturbances from the lower into the upper atmosphere",  J. Geophys. Res., 66, 83-110 (1961)

[6] A. Eliassen and E. Palm, "On the transfer of energy in stationary mountain waves",  Geofys Publ., 22(3), 1-23 (1961)

[7] D.G. Andrews and M.E. McIntyre, "Planetary waves in horizontal and vertical shear: The generalized Eliassen-Palm relation and the mean zonal acceleration", J. Atoms. Sci., 30(11), 2031-2048 (1976)

[8] K. Obuse and M. Yamada, in preparation


How to cite: Obuse, K., Hagimori, Y., and Yamada, M.: Rossby wave nonlinear interactions and large-scale zonal flow formation in two-dimensional turbulence on a rotating sphere, EGU General Assembly 2024, Vienna, Austria, 14–19 Apr 2024, EGU24-15282, https://doi.org/10.5194/egusphere-egu24-15282, 2024.

EGU24-15689 | Posters on site | NP6.2

Particle-laden gravity currents: the lock-release slumping regime at the laboratory scale 

Laurent Lacaze, Cyril Gadal, Jean Schneider, Cyrille Bonamy, Julien Chauchat, Yvan Dossmann, Sébastien Kiesgen de Richter, Matthieu Mercier, Florence Naaim-Bouvet, and Marie Rastello

Particle-laden gravity currents (PLGCs) are driven by the mass difference between a heavy fluid-particle mixture and a lighter ambient liquid. They often occur in natural and industrial situations, among which a typical situation is the release of a finite volume. Here, we focus on such `dam-break' situations, which are studied using lock-release devices at the laboratory scale. The objective of the presententation is to provide a description at the macroscopic scale of the early moments of the flow, namely the slumping regime, with respect to the relevant dimensionless parameters. For this, we combine a total of 288 runs from three different lock-release devices and from two-fluids numerical simulations, which allow us to cover a large range of particle types (size and density), volume fractions, bottom slopes and geometries. By tracking the front propagation through time, we extract the dimensionless slumping velocity Fr and dimensionless characteristic slumping duration τ, on which we base our description. Our results show that the slumping velocity increases with the bottom slope, but decreases with the particle volume fraction when the latter exceeds a critical value. However, it remains independent of particle settling processes, which on the other hand affects the slumping duration. Hence, above a critical threshold, τ decreases as the ratio between the settling velocity and characteristic current velocity increases. For all these regimes, we derive scalings and energetic balances that reproduce the observed trends. The latter comparison confirms the role of initial energy transfer from the initial state towards the slumping phase on the resulting dynamics. This initial process and its characterisation remain crucial to prescribe relevant initial conditions for large-scale predictive modelling.

How to cite: Lacaze, L., Gadal, C., Schneider, J., Bonamy, C., Chauchat, J., Dossmann, Y., Kiesgen de Richter, S., Mercier, M., Naaim-Bouvet, F., and Rastello, M.: Particle-laden gravity currents: the lock-release slumping regime at the laboratory scale, EGU General Assembly 2024, Vienna, Austria, 14–19 Apr 2024, EGU24-15689, https://doi.org/10.5194/egusphere-egu24-15689, 2024.

EGU24-16445 | Orals | NP6.2

Transport and fluxes of atmospheric models deduced from laboratory data  

Uwe Harlander and Ana M. Mancho

Isaac M. Held writes in his introduction of the book by Schneider and Sobel (2007) "A theory for the general circulation of the atmosphere has at its core a theory for the quasi-horizontal eddy fluxes of energy, angular momentum, and water vapor by the macro-turbulence of the troposphere." An analog of this atmospheric macro-turbulence can be studied by using data from the differentially heated rotating annulus laboratory experiment (e.g. Fowlis and Hide, 1965). From simultaneous measurements of surface temperature and horizontal flow it is possible to study elementary structures of Lagrangian tracer fluxes (Agaoglou, 2024) as well as eddy fluxes of heat and momentum. In a fluid layer, the three fluxes for PV, momentum M, and heat  T are connected via the Margules equation PV=∂M/∂y + f/H T. Here y is the north-south direction, f is the Coriolis parameter and H the layer depth. From our data we are able to compute all three fluxes and it is instructive to compare the results with fluxes from simplified models. E.g., in the Eady model T does not depend on z and we can thus obtain the total heat flux from this model using the surface data. Moreover, since M is zero for the Eady model, the PV flux is proportional to the heat flux. Using an even simpler model, the surface geostrophic approximation, we can deduce the flow from the temperature field alone. However, this model does not have the correct phase difference between the velocity and the temperature field and gives a wrong mean heat flux. Applying a phase difference such that the heat flux becomes comparable to the one from the Eady model allows to estimate the vertical flow structure from the temperature field alone. The result might be helpful for the construction of flow fields from satellite sea surface temperature data (LaCasce and Mahadevan, 2006).  

M. Agaoglou and V. J. García-Garrido and U. Harlander and A. M. Mancho (2024) Building transport models from baroclinic wave experimental data, Physics of Fluids, in press.

W. W. Fowlis and R. Hide (1965) Thermal convection in a rotating annulus of liquid: effect of viscosity on the transition between axisymmetric and non-axisymmetric flow regimes, J. Atmos. Sci., 22, 541-558.
 
J. H. LaCasce and A. Mahadevan (2006) Estimating subsurface horizontal and vertical velocities from sea-surface temperature, Journal of Marine Research 64, 695–721.
    
T. Schneider and A. H. Sobel (Eds.) (2007) The Global Circulation of the Atmosphere, Princeton University Press.

How to cite: Harlander, U. and Mancho, A. M.: Transport and fluxes of atmospheric models deduced from laboratory data , EGU General Assembly 2024, Vienna, Austria, 14–19 Apr 2024, EGU24-16445, https://doi.org/10.5194/egusphere-egu24-16445, 2024.

EGU24-16782 | ECS | Orals | NP6.2

Investigating the dynamics of particle-laden gravity currents using two-fluid simulations 

Manohar Kumar Sharma, Cyrille Bonamy, Marie Rastello, Cyril Gadal, Laurent Lacaze, and Julien Chauchat

Particle-laden gravity currents are extremely important in geophysical flow applications. They are the major pathway of sediments in subaqueous environments such as deep lakes and oceans and, to some extent, in the shallower seas of the continental shelves [1]. Various approaches have been developed to model these currents with different complexities ranging from box models, shallow water models, single-phase and two-phase flow models. The starting point of the present analysis is based on Gadal et al. [2] who investigated the role of non-dimensional parameters such as the bed slope (α), the Reynolds number (Re), the Stokes number (St), and the volume fraction (φ) on the dynamics of the front velocity at the early stage of the current propagation using both experimental and numerical approaches. The front velocity at short time scales as the square root of the reduced gravity times the initial lock-height. Overall, it is an increasing function of the bed slope and a decreasing function of the initial volume fraction (for φ>0.45). It is also shown that the duration of the initial constant velocity regime decreases with the particle settling velocity or Stokes number at small bed slope angles. The 2D two-fluid simulations performed with sedFOAM [3] have been shown to reproduce almost quantitatively these trends however a comprehensive description of the detailed underlying physical mechanisms is still missing. In this contribution, we propose to use the two-fluid model to address this question. To achieve this goal, 3D two-fluid simulations have been performed and the numerical results have been depth-averaged over the current shape. The mass balance is used to quantify the entrainment at the current interface and the various terms entering in the momentum balance are extracted from the simulation results. These analysis are used to understand the origin of the current dynamics attenuation such as fluid viscous and turbulent stresses, particle-particle interactions, and fluid-particle interactions.

References:

[1] Meiburg, E. and Kneller, B. (2010). Turbidity currents and their deposits. Annual Review of Fluid Mechanics, 42(1):135–156.

[2] Gadal C., Mercier M. J., Rastello M., and Lacaze L. (2023). “Slumping regime in lock-release turbidity currents”,. J. Fluid Mech., 974:A4,

[3] Chauchat, J., Cheng, Z., Nagel, T., Bonamy, C., and Hsu, T.-J. (2017). Sedfoam- 2.0: a 3-d two-phase flow numerical model for sediment transport.    Geoscientific Model Development, 10(12):4367–4392.

How to cite: Sharma, M. K., Bonamy, C., Rastello, M., Gadal, C., Lacaze, L., and Chauchat, J.: Investigating the dynamics of particle-laden gravity currents using two-fluid simulations, EGU General Assembly 2024, Vienna, Austria, 14–19 Apr 2024, EGU24-16782, https://doi.org/10.5194/egusphere-egu24-16782, 2024.

EGU24-16920 | Orals | NP6.2

Influence of particle's buoyancy on turbidity currents from continuous influx 

Matthieu Mercier, Jean Schneider, Cyril Gadal, and Laurent Lacaze

We investigate experimentally the dynamics of particle-laden gravity currents originating from a continuous influx in a nearly steady regime. We seek to characterize the influence of suspended particles on the inner structure of the current, depending on their settling/rising properties.

The compositional fluid for the current is obtained by adding salt (NaCl) to the ambient fluid of the density ρ0, the density difference of the current with the ambient fluid is noted Δρ0. In the case of particle-laden gravity currents, we add plastic particles (diameter 500 µm and density 1050 kg/m3) in a semi-dilute concentration (Φ ~ 1%). We can also change the settling/rising properties of the particles by choosing the density of the fluid in the current, the density ratio varying between R=0.98 (rising particles) and R=1.02 (settling particles). Once prepared, the compositional fluid, stored and continuously stirred in a large reservoir, is injected in a nearly two-dimensional long tank by a pump at fixed flow rate Q, long durations of injection are possible by using either a very long tank, or an open channel configuration. Two setups have been used, associated to turbulent regimes, with typical Reynolds number of the order of 103 to 104 respectively. Within the body of the current, the density/concentration profiles are estimated by light attenuation technique [1].

Our results show that the front velocity Uf is well controlled by a characteristic velocity based on the buoyancy of the current and the flow rate per unit width, as shown in Figure 1(a). Depending on the height of the injection inlet h0, the current can exhibit different hydraulic features near the front, depending on the value of the Froude number at the inlet F0, defined as the ratio of Uf over (Δρ00 . g . h0)1/2, with g the gravity constant, being supercritical (F0>1) or subcritical (F0<1). For the body of the current, as shown in Figure 1(b) with extractions made along a vertical profile 1.8m after the inlet, the mean concentration profiles are very different for slightly floating (R=0.98) or settling (R=1.02) particles from the case of neutrally buoyant particles (R=1.0). They all differ from the density profile of saline gravity currents (no particles case). Implications for the transport of particles and mixing processes within and at the interface of the current will be discussed.

Figure 1: (a) Front velocity vs. injection properties. (b) Mean concentration profiles with depth (rescaled by the mean current depth <hc>), extracted at 1.8m from the inlet for rising (red)-neutral (magenta)-settling (blue) particles. Density profile for a density current is indicated with a dashed (black) line. Shaded areas indicate fluctuations around the mean profiles.
 

References
[1] Schneider et al. Investigation of particle laden gravity currents using the light attenuation technique. Exp. Fluids 64, 23 (2023).

How to cite: Mercier, M., Schneider, J., Gadal, C., and Lacaze, L.: Influence of particle's buoyancy on turbidity currents from continuous influx, EGU General Assembly 2024, Vienna, Austria, 14–19 Apr 2024, EGU24-16920, https://doi.org/10.5194/egusphere-egu24-16920, 2024.

EGU24-17638 | ECS | Orals | NP6.2

The dynamics of low-latitude sub-surface oceanic jets 

Shi-Wei Jian and Peter Haynes

A complex system of alternating zonal jets has been observed in the low latitude Pacific ocean, both on the equator and extending away into the subtropics. The dynamics of the subtropical jets, which also seem to be associated with strong cross-jet gradients in chemical tracers, may be similar to those of much-studied beta-plane zonal jets, but the effect of longitudinal boundaries, which are present in oceanic cases, on such jets is still puzzling. The forcing mechanism behind this set of oceanic zonal jets and what determines its horizontal and vertical structure are also poorly understood. We consider a beta-plane two-dimensional model with rigid boundary conditions and apply stochastic forcing, which without rigid boundaries would generate zonal jets. The instantaneous flow field is strongly time-dependent, with a large component of stochastically forced basin modes. This seems to disrupt the formation of alternating zonal jets, which, in contrast to the case without rigid boundaries, are observable only in the time-mean field and much weaker than the instantaneous flow. There is some evidence that these apparent time-mean jets are primarily the signature of stochastically forced basin modes rather than genuinely persistent jet-like flows. Adding tracers to the model allows the investigation of the relation between jet structure and the transport and mixing of tracers, and act as an important diagnostic to verify the presence or absence of jets. The instantaneous tracer field in the case with rigid boundaries is highly unsteady and, unlike the doubly periodic case, the jet structure is not manifested in the tracer field. Two-dimensional simulations with simple rigid boundary geometry may overestimate the generation of basin modes relative to the real ocean. Non-uniform damping is applied as a model device to break the interaction between the flow and boundaries and test whether it can inhibit basin modes and hence allow generation of steady zonal jets. With this non-uniform damping, jets present in the zonal mean field become more persistent as our redefined zonostrophy parameter increases, but there exist caveats we need to examine further, such as small ratio of energy in the zonal flow to the total energy as compared to much-studied cases without boundaries.

How to cite: Jian, S.-W. and Haynes, P.: The dynamics of low-latitude sub-surface oceanic jets, EGU General Assembly 2024, Vienna, Austria, 14–19 Apr 2024, EGU24-17638, https://doi.org/10.5194/egusphere-egu24-17638, 2024.

EGU24-17856 | ECS | Orals | NP6.2

Quantifying Turbulent Mixing in Plunging River Inflows: Insights from Field Measurements in Lake Geneva 

Stan Thorez, Ulrich Lemmin, D. Andrew Barry, and Koen Blanckaert

Hyperpycnal river inflows discharging into lakes or reservoirs will plunge and trigger gravity-driven underflows near the bed. Such underflows are called turbidity currents if the density excess is mainly caused by a high sediment concentration. These underflows can reach the bottom of the lake or, alternatively, detach from the bed and intrude horizontally into the lake waters to form an interflow if a layer of equal density is encountered. As underflows carry a number of constituents fed to them by the river or eroded from the bed, such as sediment, contaminants, nutrients and oxygen, their pathway and final destination have an impact on lake or reservoir water quality. The mixing processes in the plunging region are known to be of dominant importance for the dilution of the inflowing river water by entrainment of ambient water, thereby exerting a primary control on the final intrusion depth of underflows. Understanding and quantifying these processes is therefore key. Until now, the majority of estimations of the mixing extent in the plunging region were made within laterally confined laboratory experiments or via passive tracer methodologies. This study focuses on quantifying plunging mixing from flow velocity measurements in a laterally unconfined river inflow in the field and investigating its dependency on inflow conditions.

Field measurements of the plunging Rhône River entering Lake Geneva were conducted using a boat-towed ADCP along a grid of transects for six inflow conditions characterized by the inflow densimetric Froude number Frd. The plunging mixing coefficient Ep, which compares the underflow discharge immediately post-plunging to the initial river inflow discharge, was used to quantify the plunging mixing.

Results indicate that for larger Frd values (Frd > 4) Ep estimates align with laterally confined lab experiments (Ep = O(0.1)). Conversely, for smaller Frd values Ep estimates correlate with field tracer measurements of laterally unconfined inflows (Ep = O(1)). Ep decreases with increasing Frd, challenging existing numerical simulations predicting the opposite relationship.

This study offers key insights into turbulent mixing rates associated with hyperpycnal river inflows and highlights the need to incorporate realistic field conditions for accurate modeling of plunging river inflows and intrusion depth.

How to cite: Thorez, S., Lemmin, U., Barry, D. A., and Blanckaert, K.: Quantifying Turbulent Mixing in Plunging River Inflows: Insights from Field Measurements in Lake Geneva, EGU General Assembly 2024, Vienna, Austria, 14–19 Apr 2024, EGU24-17856, https://doi.org/10.5194/egusphere-egu24-17856, 2024.

EGU24-22329 | Orals | NP6.2

Mixing and entrainment in inclined gravity currents 

Maarten van Reeuwijk, Lianzheng Cui, and Graham Hughes

We explore the dynamics of inclined temporal gravity currents using direct numerical simulation, and find that the current creates an environment in which the flux Richardson number, gradient Richardson number and turbulent flux coefficient are constant across a large portion of the depth of the outer layer. Changing the slope angle modifies these mixing parameters, and the flow approaches a maximum Richardson number of approx. 0.15 as the angle tends to zero, for which the entrainment coefficient E->0.

The turbulent Prandtl number remains O(1) for all slope angles, demonstrating that E->0 is not caused by a switch-off of the turbulent buoyancy flux. Instead, E->0 occurs as the result of the turbulence intensity going to zero as the angle tends to zero, due to the flow requiring larger and larger shear to maintain the same level of turbulence. We develop a conceptual model which is in excellent agreement with the DNS data.

How to cite: van Reeuwijk, M., Cui, L., and Hughes, G.: Mixing and entrainment in inclined gravity currents, EGU General Assembly 2024, Vienna, Austria, 14–19 Apr 2024, EGU24-22329, https://doi.org/10.5194/egusphere-egu24-22329, 2024.

EGU24-35 | ECS | Orals | NP6.3

Lagrangian Coherence in Atmospheric Blocking 

Henry Schoeller, Robin Chemnitz, Stephan Pfahl, Péter Koltai, and Maximilian Engel

Atmospheric Blocking - also known as Quasi-Stationary Atmospheric States (QSAS) - exert a major influence on mid-latitude atmospheric circulation and are known to be associated with extreme weather events. Previous work has highlighted the importance of the origin of air parcels that define the blocking region, especially with respect to non-adiabatic processes such as moisture transport and latent heating. So far, an objective method for clustering the individual Lagrangian trajectories passing through the QSAS into larger and - more importantly - spatially coherent air streams has not been established, which is the focus of our current work.

    Coherent sets are regions in the phase space of dynamical systems that keep their geometric integrity to a large extent during temporal evolution. We extract a low-dimensional representation of the Lagrangian data via diffusion maps and cluster the trajectories in this representation to estimate coherent sets. Our implementation adapts the existing methodology to the non-Euclidean geometry of Earth's atmosphere and its challenging scaling properties. Several example cases are investigated. 

    The results confirm the existence of spatially coherent feeder airstreams differing with respect to their dynamical properties and, more specifically, their latent heating contribution. Air streams experiencing a considerable amount of latent heating occur mainly during the maturing and maintanence phases of the QSAS and contribute to its stability. In our example cases, trajectories also exhibit an increase in density when passing through the blocking region during its maintanence phase, which is in line with the common understanding of QSAS as regions of high stability. 

How to cite: Schoeller, H., Chemnitz, R., Pfahl, S., Koltai, P., and Engel, M.: Lagrangian Coherence in Atmospheric Blocking, EGU General Assembly 2024, Vienna, Austria, 14–19 Apr 2024, EGU24-35, https://doi.org/10.5194/egusphere-egu24-35, 2024.

EGU24-2652 | ECS | Posters on site | NP6.3

FLEXPART-11: Advancements in a Lagrangian Atmospheric Model for Enhanced Accuracy, Efficiency, and Flexibility 

Lucie Bakels, Daria Tatsii, Anne Tipka, Marina Dütsch, Michael Blaschek, Silvia Bucci, Andreas Plach, Martin Vojta, Petra Seibert, Ignacio Pisso, Sabine Eckhardt, Massimo Cassiani, Christine Groot Zwaaftink, Marie Mulder, and Andreas Stohl

Numerical methods and advanced simulation codes play a crucial role in helping us understand complex atmospheric processes. As technology progresses, it's important to develop sophisticated code for accurate and efficient simulations. In this update to FLEXPART, a Lagrangian model used in numerous studies for the past 30 years, we've made significant improvements. This version of FLEXPART shows improvements in accuracy and computational efficiency. By using native ECMWF coordinates, we reduced conservation errors by about 8-10% for semi-conserved quantities like potential vorticity. The shape of aerosol particles are now properly accounted for, greatly improving the accuracy of the deposition of non-spherical particles (e.g. microplastic fibers). Additionally, the incorporation of OpenMP parallelisation makes the model better suited for handling large input data and extended simulation periods. We've also introduced new methods for the input and output of particles in FLEXPART. Users can now run FLEXPART with their own particle input data, making it more adaptable for specific research scenarios.

How to cite: Bakels, L., Tatsii, D., Tipka, A., Dütsch, M., Blaschek, M., Bucci, S., Plach, A., Vojta, M., Seibert, P., Pisso, I., Eckhardt, S., Cassiani, M., Groot Zwaaftink, C., Mulder, M., and Stohl, A.: FLEXPART-11: Advancements in a Lagrangian Atmospheric Model for Enhanced Accuracy, Efficiency, and Flexibility, EGU General Assembly 2024, Vienna, Austria, 14–19 Apr 2024, EGU24-2652, https://doi.org/10.5194/egusphere-egu24-2652, 2024.

EGU24-3997 | ECS | Orals | NP6.3

A global Lagrangian eddy dataset based on satellite altimetry  

Tongya Liu and Ryan Abernathey

The methods used to identify coherent ocean eddies are either Eulerian or Lagrangian in nature, and nearly all existing eddy datasets are based on the Eulerian method. In this study, millions of Lagrangian particles are advected by satellite-derived surface geostrophic velocities over the period of 1993–2019. Using the method of Lagrangian-averaged vorticity deviation (LAVD), we present a global Lagrangian eddy dataset (GLED v1.0). This open-source dataset contains not only the general features (eddy center position, equivalent radius, rotation property, etc.) of eddies with lifetimes of 30, 90, and 180 days, but also the trajectories of particles trapped by coherent eddies over the lifetime. We present the statistical features of Lagrangian eddies and compare them with those of the most widely used sea surface height (SSH) eddies, focusing on generation sites, size, and propagation speed. A remarkable feature is that Lagrangian eddies are generally smaller than SSH eddies, with a radius ratio of about 0.5. Also, the validation using Argo floats indicates that coherent eddies from GLED v1.0 exist in the real ocean and have the ability to transport water parcels. Our eddy dataset provides an additional option for oceanographers to understand the interaction between coherent eddies and other physical or biochemical processes in the Earth system.

How to cite: Liu, T. and Abernathey, R.: A global Lagrangian eddy dataset based on satellite altimetry , EGU General Assembly 2024, Vienna, Austria, 14–19 Apr 2024, EGU24-3997, https://doi.org/10.5194/egusphere-egu24-3997, 2024.

EGU24-4656 | ECS | Orals | NP6.3

Three-dimensional influencers in the Western Baltic Sea: finite time coherent sets and their role for biological processes 

Rahel Vortmeyer-Kley, Bronwyn Cahill, Maximilian Berthold, and Ulrike Feudel

Describing and tracking three-dimensional flow structures in an ocean setting may explain elemental and biodiversity pattern. A possible tool can be finite time coherent sets. These sets are Lagrangian Coherent Structures characterized by minimal leakage and minimal exchange with their surrounding environment.

In oceanic settings, they can be understood as separated waterbodies or eddies playing an important role for transport and mixing processes.

Due to limited interaction with their surroundings, they even influence biological processes by providing competitive advantages for some species, for example, optimal temperature or nutrient conditions.

In a case study of three-dimensional finite time coherent sets in the Western Baltic Sea in May and July 2018, we show some different impacts on biological processes:

  • enhancement of phytoplankton growth in the set's surrounding,
  • transport of cold nutrient rich water from shallower to deeper regions, and
  • the formation of transient, moving dynamical niches with higher temperature inside the coherent set compared to its surrounding, prolonging the life of an existing phytoplankton bloom that is trapped during the formation of the coherent set.

Moreover, different dynamical patterns can be observed inside the finite time coherent sets during their travel and lifetime. Temporal stratification and mixing inside the coherent sets suppress or enhance growth temporally and locally.

In the coherent set’s surrounding, the formation of a “sticking” manifold supports the development of a local phytoplankton bloom in the upper water column.

Our case study in the Western Baltic Sea provides a first step towards understanding the impact of three-dimensional coherent sets on transport processes and phytoplankton growth in the Baltic Sea, as well as, the formation of dynamical pattern inside three-dimensional coherent sets.

How to cite: Vortmeyer-Kley, R., Cahill, B., Berthold, M., and Feudel, U.: Three-dimensional influencers in the Western Baltic Sea: finite time coherent sets and their role for biological processes, EGU General Assembly 2024, Vienna, Austria, 14–19 Apr 2024, EGU24-4656, https://doi.org/10.5194/egusphere-egu24-4656, 2024.

EGU24-6434 | Orals | NP6.3

A Maxey-Riley modeling framework for Sargassum raft drift 

M. Josefina Olascoaga

Sargassum has historically been found in the subtropical North Atlantic gyre where it provides important habitat for diverse marine species. However, since 2011 with the development of the Great Atlantic Sargassum Belt in the equatorial Atlantic, abundance has greatly increased, resulting in shorelines mass stranding. These coastal inundations of Sargassum have major impacts on the ecology, economies, and health of affected areas.
Understanding the Sargassum raft's motion is required to be able to predict the areas that could be affected by Sargassum. The motion of the rafts is fundamentally unlike Lagrangian (i.e., infinitesimally small, neutrally buoyant) particle motion since they represent finite-size, buoyant objects subjected to the action of ocean currents, wind, and waves. In this talk, we will present a Maxey-Riley model for the motion of Sargassum rafts that takes their inertial nature into account as well as the elastic interactions within a raft and physiological changes affecting the structure of the rafts.  This will be accompanied by a discussion of results from field and laboratory experiments used to validate the model. Joint work with F. J. Beron-Vera and G. Bonner.

How to cite: Olascoaga, M. J.: A Maxey-Riley modeling framework for Sargassum raft drift, EGU General Assembly 2024, Vienna, Austria, 14–19 Apr 2024, EGU24-6434, https://doi.org/10.5194/egusphere-egu24-6434, 2024.

EGU24-6839 | ECS | Posters on site | NP6.3

Impact of high-frequency motions on oceanic surface dispersion 

Laura Gomez-Navarro, Erik van Sebille, Clement Ubelmann, Veronica Morales-Marquez, Ismael Hernandez-Carrasco, Joey Richardson, Duarte Soares, Pierre Daniel, Aurelie Albert, Jean-Marc Molines, Julien Le Sommer, and Laurent Brodeau

Understanding the oceanic surface dispersion has important applications in ocean pollution scenarios. Of the different ocean pollution events, some of which have the most impact both on the marine environment and, on society and economy are: marine plastics, oil spills and Sargassum inundation events. Understanding the ocean dynamics that affect their trajectories is vital to simulate their pathways, and thus know their sources and sinks. This can then be used to implement clean-up strategies and to better manage MPAs. It can also help reduce the impact of ocean pollution on the marine environment and some major economic sectors like tourism. High frequency motions have an important impact on the surface dynamics, but high temporal resolution data is necessary to study their effects. New datasets and methodologies have allowed to obtain better representations of high frequency motions. Here, we specifically focus on the high frequency motions due to tides (like for example internal waves), as well as inertial oscillations. We simulate surface trajectories of plastic, oil and Sargassum using the OceanParcels Lagrangian simulator. We focus on three regions in the Atlantic Ocean: Açores Islands, North Atlantic and Tropical Atlantic, respectively. For the plastic simulations we look at the effect of tides by using velocity outputs from a high-resolution model which is a twin simulation without and with tidal forcing. For the oil spills and Sargassum outputs we use a new surface currents product generated by combining velocity data from drifters, high-frequency winds and altimetry to reconstruct high-frequency surface currents. We find that considering high-frequency motions is key to correctly simulate their surface trajectories, but that further work is necessary to understand the ocean dynamics at the fine-scales that can drive the variability in these Lagrangian trajectories.

How to cite: Gomez-Navarro, L., van Sebille, E., Ubelmann, C., Morales-Marquez, V., Hernandez-Carrasco, I., Richardson, J., Soares, D., Daniel, P., Albert, A., Molines, J.-M., Le Sommer, J., and Brodeau, L.: Impact of high-frequency motions on oceanic surface dispersion, EGU General Assembly 2024, Vienna, Austria, 14–19 Apr 2024, EGU24-6839, https://doi.org/10.5194/egusphere-egu24-6839, 2024.

EGU24-7549 | ECS | Orals | NP6.3

Impact of Swimmer Dynamics on Odor Transport by Mesoscale Swimmers in Turbulent Environments 

Martin James, Francesco Viola, and Agnese Seminara

Odor transport in fluidic environments is a subject of great importance, holding implications for numerous scientific disciplines, including fluid dynamics, biological studies, and engineering disciplines. Odor tracking serves as the foundation for various natural processes, such as the navigation of marine organisms and the foraging behavior of insects. Turbulent fluctuations add another level of complexity to the problem of odor transport in fluidic environments. 

The odor emitted by swimmers is not only influenced by the environment but also by hydrodynamic fluctuations caused by their dynamics. This effect is evident in large swimmers, where the wakes caused by their swimming dynamics could potentially alter odor distribution. However, it is much less clear whether and how hydrodynamic interactions affect the odor distribution of mesoscale swimmers. 

In this work, we explore the coupling of chemical and mechanical signals from mesoscale swimmers (Reynolds number <= 50), immersed in a turbulent open channel flow. We use a model system comprising a collection of swimmers in an open channel flow to explore the propagation and interaction of these signals. Furthermore, we vary their Reynolds numbers and evaluate the consequential changes in odor distribution. We show that the velocity fluctuations due to the swimmers play a significant role in changing the range and distribution of odor signals by screening the intensity and fluctuations of odor distribution downstream. We found substantial differences in odor screening depending on whether the swimmers are 'pushers' or 'pullers', the latter being more effective in screening their odor from predators. Our findings provide valuable insights into the coupling of mechanical and chemical signals of mesoscale swimmers in turbulence with novel considerations regarding the evolutionary preferences of specific swimming modes. 

How to cite: James, M., Viola, F., and Seminara, A.: Impact of Swimmer Dynamics on Odor Transport by Mesoscale Swimmers in Turbulent Environments, EGU General Assembly 2024, Vienna, Austria, 14–19 Apr 2024, EGU24-7549, https://doi.org/10.5194/egusphere-egu24-7549, 2024.

EGU24-8754 | Orals | NP6.3

Assessment of turbulent dispersion in the Red River plume region, northeast Vietnam, based on Lagrangian observations and modeling 

Alexei Sentchev, Duc Thinh Nguyen, Duy Vinh Vu, and Stefano Berti

The study aims to assess turbulent dispersion processes in the coastal regions of northeastern Vietnam, in order to meet the major challenge of monitoring the fate of particulate materials in this part of the East Vietnam Sea, home to the most famous tourist sites and economic sites. The study area is strongly influenced by the freshwater discharge of the Red River, which creates a large river plume, greatly affecting coastal circulation and turbulent dispersion. The monsoon wind profoundly alters the dynamics of the river plume, pushing light surface water seaward over long distances, in summer, and toward the coast, in winter. Sea surveys were organized for the first time in this region in 2022 and 2023 to better characterize the processes controlling coastal flow variability and turbulent dispersion in the plume region and surrounding waters. Surface drifters, released in the  plume region, were tracked during short periods of time, lfrom one to a few days. Current velocity profiling and CTD profiling have been also done. Estimates of the relative dispersion based on surface drifter measurements have revealed that the dispersion regime is local, mainly ballistic and Richardson, induced by turbulent eddies whose size does not exceed a few km. Local wind variability, combined with variations in bathymetry, considerably affects the transport pathways of real drifters and modifies the dispersion regime. A coastal circulation model was used to better assess dispersion processes over the entire study area and for a wide range of variability in the main forcing terms. Virtual surface drifters were tracked in the model velocity field during the surveying periods. The results revealed that, on scale of several days, the transport of passive tracers is considerably affected by irregularities in current velocity fields associated with zones of current convergence and divergence. The results also demonstrated that merging observations with model outputs significantly improves the representation of small scale features of current variability, turbulent mixing, and horizontal stirring of tracers in the plume region.

How to cite: Sentchev, A., Nguyen, D. T., Vu, D. V., and Berti, S.: Assessment of turbulent dispersion in the Red River plume region, northeast Vietnam, based on Lagrangian observations and modeling, EGU General Assembly 2024, Vienna, Austria, 14–19 Apr 2024, EGU24-8754, https://doi.org/10.5194/egusphere-egu24-8754, 2024.

In this presentation, I will describe a maritime oil spill case that affected the Eastern Mediterranean and several Middle Eastern countries' shorelines in early 2021 [1]. The sequence of events was successfully reconstructed, supported by remote sensing images and Lagrangian Coherent Structures. The comparison of the performance of various datasets found connections between Lagrangian Coherent Structures and Uncertainty Quantification [2].

Acknowledgments

Support from PIE project Ref. 202250E001 funded by CSIC, from grant PID2021-123348OB-I00 funded by MCIN/ AEI /10.13039/501100011033/ and by FEDER A way for making Europe.

References

[1] G. García-Sánchez, A. M. Mancho, A. G. Ramos, J. Coca, S. Wiggins. Structured pathways in the turbulence organizing recent oil spill events in the Eastern Mediterranean.   Scientific Reports 12, 3662 (2022).

[2] G. Garcia-Sanchez, A.M. Mancho, M. Agaoglou, S. Wiggins. New links between invariant dynamical structures and uncertainty quantification. Physica D 453, 133826 (2023).

How to cite: Mancho, A. M.: Quantifying Uncertainty in Lagrangian Transport for Assessing Environmental Problems, EGU General Assembly 2024, Vienna, Austria, 14–19 Apr 2024, EGU24-10330, https://doi.org/10.5194/egusphere-egu24-10330, 2024.

EGU24-10533 | Posters on site | NP6.3

Vertical distribution of net zooplankton biomass at the time of winter vertical mixing in the open southern Adriatic Sea (Mediterranean Sea) 

Mirna Batistić, Rade Garić, Marijana Hure, Nika Pasković, Laura Ursella, Vanessa Cardin, Giussepe Civitarese, Miroslav Gačić, and Stefano Miserocchi

The open southern Adriatic Sea with a maximum depth of 1242 m is one of the three sites of open deep-sea convection in the Mediterranean Sea. The effects of winter vertical mixing on zooplankton biomass were investigated in the open southern Adriatic Sea in February 2023. Samples were collected using Nansen nets (250 µm mesh size) in eight layers from 0 to 1200 m depth during day and night. The highest biomass values were sampled in the deeper layers below 300 m depth (twice as high as in the upper layers) both in the day and night samples. This could be related to vertical mixing in several pathways. This event was triggered by cold winter conditions and significant heat loss in the previous days, which together with the inflow of high salinity water from the eastern Mediterranean (38.96) caused strong vertical mixing down to 600 m depth. As a result of this event, relatively high chlorophyll-a concentrations (max. 0.33 mgm-3) were measured down to 600 m depth. Therefore, due to the vertical mixing, deeper layers received more food than usual from the surface, so that more food was available for deep-sea zooplankton organisms and they did not have to migrate upwards. The effect of vertical mixing in winter was also clearly visible in some zooplankton organisms that cannot effectively resist the vertical currents, so that they also contribute to the increase in biomass at depth. This is confirmed by the backscattering strength (Sv) data, which show that convective mixing resulted in a smeared Sv signal, indicating that the plankton was transported to deeper layers and no migration took place.

Future studies should consider the influence of open-sea convective events on vertical carbon export in the oligotrophic southern Adriatic.


How to cite: Batistić, M., Garić, R., Hure, M., Pasković, N., Ursella, L., Cardin, V., Civitarese, G., Gačić, M., and Miserocchi, S.: Vertical distribution of net zooplankton biomass at the time of winter vertical mixing in the open southern Adriatic Sea (Mediterranean Sea), EGU General Assembly 2024, Vienna, Austria, 14–19 Apr 2024, EGU24-10533, https://doi.org/10.5194/egusphere-egu24-10533, 2024.

EGU24-12049 | ECS | Posters on site | NP6.3

Lagrangian Coherent Structure regimes in the Baltic Sea and impact on algal blooms 

Dimitrios Antivachis, Kristofer Döös, Lars Axell, Lars Arneborg, and Inga Monika Koszalka

Algal blooms are common in the Baltic Sea during the summer, where they pose a significant threat to coastal services and industries. Lagrangian Coherent Structures (LCS) have been shown to play an important role in driving the mixing and transport of water masses and tracers in other ocean basins, such as the Mediterranean Sea (Antivachis et al. 2023), and are thus expected to have a strong effect on transport processes and the development and spread of algal blooms in the Baltic Sea.

In this work, we use trajectory-derived Largangian diagnostics to investigate the distribution and variability of LCS in the Baltic Sea, using a series of 10-day trajectory experiments during summer 2022. Finite Size Lyapunov Exponent (FSLE), Trajectory Rotation Angle (TRA) and related metrics are
used to assess the impact of LCS on horizontal mixing and dispersion processes in the basin. The potential influence of LCS on the spread and impact of algal blooms by opening/closing off transport pathways and exposing/shielding coastal regions is investigated by relating the spatiotemporal distribution of LCS to surface cyanobacteria concentrations obtained from satellite observations. The LCS regime in the Baltic Sea is compared to the ones observed in the Mediterranean in the author’s previous work (Antivachis et al. 2023). This is the first study to map the LCSs of the Baltic Sea and investigate their impact on algal blooms in that basin.

This work is part of the ongoing ALGOTL project, funded by the Swedish research council for sustainable development (FORMAS), aiming to develop a Lagrangian modelling and forecasting framework for algae growth and dispersion for assessing the risk posed by algal blooms. Particle advection is carried out using velocity fields from the Swedish Hydrological and Meteorological Institute (SMHI) NEMO-Nordic configuration (Hordoir et al. 2019) and the TRACMASS Lagrangian trajectory code (Aldama-Campino et al. 2020).

References

Dimitrios Antivachis, Vassilios Vervatis, and Sarantis Sofianos. Lagrangian coherent structures in the mediterranean sea: Seasonality and basin regimes. Progress in Oceanography, 215:103051, 2023. https://doi.org/10.1016/j.pocean.2023.103051

Hordoir, R., Axell, L., Höglund, A., Dieterich, C., Fransner, F., Gröger, M., Liu, Y., Pemberton, P., Schimanke, S., Andersson, H., Ljungemyr, P., Nygren, P., Falahat, S., Nord, A., Jönsson, A., Lake, I., Döös, K., Hieronymus, M., Dietze, H., Löptien, U., Kuznetsov, I., Westerlund, A., Tuomi, L., and Haapala, J.: Nemo-Nordic 1.0: a NEMO-based ocean model for the Baltic and North seas – research and operational applications, Geosci. Model Dev., 12, 363–386, https://doi.org/10.5194/gmd-12-363-2019, 2019. 

Aldama-Campino, Aitor, Döös, Kristofer, Kjellsson, Joakim, & Jönsson, Bror. (2020, December 17). TRACMASS: Formal release of version 7.0 (Version v7.0-beta). Zenodo. http://doi.org/10.5281/zenodo.4337926

How to cite: Antivachis, D., Döös, K., Axell, L., Arneborg, L., and Koszalka, I. M.: Lagrangian Coherent Structure regimes in the Baltic Sea and impact on algal blooms, EGU General Assembly 2024, Vienna, Austria, 14–19 Apr 2024, EGU24-12049, https://doi.org/10.5194/egusphere-egu24-12049, 2024.

EGU24-12353 | Posters on site | NP6.3

Lagrangian tracking of key demersal species in the western Mediterranean Sea: a high-resolution model approach 

Juan-Manuel Sayol, Isabel Vigo, David Garcia Garcia, and Cesar Bordehore

In this study we explore the most frequent trajectories of relevant demersal species in the western Mediterranean Sea. In particular, we focus on the Ibiza Channel, a region characterized by the interaction of water masses with distinct properties and by an intense fishing activity. Demersal species are suposed to be in planktonic stage, thus they behave, almost, as passive particles, being driven by the dominant ocean currents. The origin of selected demersal species, their preferred water mass properties, and their temporal variability are evaluated with a set of 2D and 3D backward Lagrangian simulations performed over a high-resolution ocean model. The model we use is the IBI-MFC, part of the Copernicus catalogue with a spatial resolution of 1/36º and 50 vertical layers. Moreover, the Lagrangian tracking is done with OceanParcels software.


With the above approach we get the most probable pathways, and associated water mass characteristics, of those demersal species of interest. Besides, a detailed evaluation of simulated trajectories provides interesting insights on the spatial and temporal changes in the origin of demersal species weeks before they reach the Ibiza Channel. These results are especially important to stablish new biodiversity hotspots that should be protected, e.g., as
eggs and larvae exportation areas.

How to cite: Sayol, J.-M., Vigo, I., Garcia Garcia, D., and Bordehore, C.: Lagrangian tracking of key demersal species in the western Mediterranean Sea: a high-resolution model approach, EGU General Assembly 2024, Vienna, Austria, 14–19 Apr 2024, EGU24-12353, https://doi.org/10.5194/egusphere-egu24-12353, 2024.

EGU24-13046 | ECS | Orals | NP6.3

Non-negligible impact of Stokes drift and wave-driven Eulerian currents on simulated surface particle dispersal in the Mediterranean Sea 

Siren Rühs, Erik van Sebille, Aimie Moulin, Emanuela Clementi, and Ton van den Bremer

Marine surface particle dispersal simulations are crucial for addressing societal issues such as plastic pollution, oil spills, biological connectivity, and recovery missions. However, the quality of these Lagrangian simulations depends on how well the underlying numerical model represents the prevalent ocean circulation features.

Here, we investigate how simulated surface particle dispersal changes, if the – often neglected or only approximated – impact of surface waves is included. Under the influence of surface waves, a particle not only moves with the Eulerian current velocity but also experiences a net drift in the direction of wave propagation, known as Stokes drift. Moreover, wave-current interactions result in wave-driven Eulerian currents. We use the output of a coupled ocean-wave model configuration for the Mediterranean Sea to answer the following questions: What is the relative impact of Stokes drift and wave-driven Eulerian currents? How well can the total wave impact be represented by the commonly used approximation consisting of the superposition of Eulerian currents and Stokes drift obtained from independenntly run ocean and wave models?

We find that Stokes drift as well as wave-driven Eulerian currents can have a non-negligible impact on surface particle dispersal. While both tend to act in opposing directions, they do not necessarily cancel each other out, due to different temporal and spatial variability. Our analyses suggest a seasonal dependency of the wave impact. For a major part of the Mediterranean Sea, ocean-wave coupling increases the simulated mean Lagrangian surface speed in winter through a dominant impact of Stokes drift and decreases it in summer through a dominant impact by wave-driven Eulerian currents. Yet, some regions also exhibit a dominance of either Stokes drift or wave-driven Eulerian current impact throughout the year. Consequently, applying the commonly used approximation is not always beneficial for surface particle simulations. The advantage or disadvantage of the approximation compared to neglecting any wave impact depends on the season, region, and Lagrangian measure of interest, and is difficult to estimate a priori. Hence, whenever possible, coupled ocean-wave models should be employed for surface particle dispersal simulations.


How to cite: Rühs, S., van Sebille, E., Moulin, A., Clementi, E., and van den Bremer, T.: Non-negligible impact of Stokes drift and wave-driven Eulerian currents on simulated surface particle dispersal in the Mediterranean Sea, EGU General Assembly 2024, Vienna, Austria, 14–19 Apr 2024, EGU24-13046, https://doi.org/10.5194/egusphere-egu24-13046, 2024.

EGU24-14799 | Posters on site | NP6.3

Offline-Coupling of the Lagrangian Particle Dispersion Model FLEXPART to ICON 

Stephan Henne, Pirmin Kaufmann, Lukas Emmenegger, and Dominik Brunner

Over the last years, the numerical weather prediction (NWP) and climate model ICON has become the operational forecasting tool for several national weather services and research groups. Operational analysis or re-analysis fields from NWP models are often used as input for offline-coupled atmospheric chemistry and transport models. Among the latter, Lagrangian Particle Dispersion Models (LPDMs) allow computationally efficient simulations, especially for point sources such as hazardous releases and for receptor-oriented studies such as determining the sensitivity of a concentration observation to upstream surface fluxes (i.e., estimating concentration footprints). One frequently used LPDM is the FLEXible PARTticle (FLEXPART) model, which is available for inputs from different global and regional NWPs (e.g., ECMWF-IFS, WRF, COSMO). Although these versions differ in the applied horizontal and vertical coordinate systems, they have in common that they interpolate gridded NWP output from a rectangular grid to particle positions. In contrast, ICON solves its state variables on a triangular grid. To make best use of ICON output, a direct interpolation from its native grid to particle positions is required. However, compared to a rectangular grid, where interpolation can be done in a straightforward fashion applying bi-linear or bi-cubic interpolation, interpolation from a triangular grid requires additional considerations concerning the choice of interpolation stencil and weight calculations.

Starting from FLEXPART for COSMO, which shares the same vertical grid system with ICON, we revised and generalized how FLEXPART interpolates from grid input to particle positions. Four different direct interpolation methods were implemented: next neighbor (containing triangle), inverse distance weight, barycentric interpolation, and radial basis function interpolation. The resulting FLEXPART version is runs efficiently with outputs from both COSMO and ICON. Next to the direct implementation, we also evaluated an indirect coupling in which ICON output is first interpolated onto a COSMO-like, staggered grid and then used as input for FLEXPART-COSMO.

Both direct and indirect FLEXPART-ICON approaches were thoroughly evaluated by comparison of individual plume simulations resulting from point sources. As a reference simulation, the same point sources were simulated with the Aerosols and Reactive Trace gases (ART) extension of the ICON model. We discuss differences in the performance between the direct and indirect approach and between the interpolation methods. Computational costs for the different approaches are evaluated and trade-offs between model performance and computational efficiency are discussed. 

How to cite: Henne, S., Kaufmann, P., Emmenegger, L., and Brunner, D.: Offline-Coupling of the Lagrangian Particle Dispersion Model FLEXPART to ICON, EGU General Assembly 2024, Vienna, Austria, 14–19 Apr 2024, EGU24-14799, https://doi.org/10.5194/egusphere-egu24-14799, 2024.

EGU24-15051 | Orals | NP6.3

FLEXWEB - A flexible particle dispersion model web interface 

Michael Blaschek, Lucie Bakels, Marina Dütsch, and Andreas Stohl

Flexpart (FLEXible PARTicle dispersion model) is a numerical model that simulates the dispersion of gases and aerosols in the atmosphere. In order for Flexpart to be used, it must be installed and run on a (super)computer. However, this is associated with obstacles, as not all scientists have access to a supercomputer and there are often technical problems during installation or execution. In this project, we therefore want to develop a Flexpart Web Service (FLEXWEB) in which Flexpart can be run via a website. We will show first results and details on the implementation of a test project for a potential operational service. Flexpart will be containerized and the service will be run in a Kubernetes cluster (in “the” cloud or on premises) to calculate trajectories and make these results easily accessible to users. As soon as the simulation is complete, the output files will be made available for download and displayed graphically. In this way, we hope to simplify access to Flexpart for scientists worldwide.

How to cite: Blaschek, M., Bakels, L., Dütsch, M., and Stohl, A.: FLEXWEB - A flexible particle dispersion model web interface, EGU General Assembly 2024, Vienna, Austria, 14–19 Apr 2024, EGU24-15051, https://doi.org/10.5194/egusphere-egu24-15051, 2024.

EGU24-15769 | Posters on site | NP6.3

Using Ensemble Ocean Currents for Drift Predictions 

Knut-Frode Dagestad, Johannes Rohrs, Martina Idzanovic, Edel Rikardsen, and Gaute Hope

Predicting the drift of objects and substances in the ocean is relevant for several important applications, such as assisting search and rescue and oil cleanup operations, and for understanding and analysing the drift and distribution of plastics or fish eggs and larvae in the ocean.

The largest uncertainty of such simulations is normally due to currents obtained from ocean models, in particular for the short-term applications such as oil spill accidents and search and rescue operations. Assimilation of observations help make the ocean models more precise, but unfortunately only a limited amount of observations with high spatial resolution are available.

Trajectory models compensate for the imprecise forcing data by adding horizontal diffusivity, providing a spatial spread to encompass the most likely drift. However, a more realistic spread can be obtained by running an ensemble ocean model, where current fields are perturbed in a more physically sound way.

In this study, we are analysing a set of ocean surface drifters released in the Fram Strait and Barents Sea, within the domain of an 24 member ensemble setup of ROMS with 2.5km pixel size, run operationally by MET Norway.

We explore and demonstrate methods to combine the ensemble current fields to improve the predictability of the drifter trajectories. Also, we demonstrate a method for further improvement of future predictability for situations where a recent part of the drift trajectory is known, e.g. for an object with GPS tracking that has lost connection.

How to cite: Dagestad, K.-F., Rohrs, J., Idzanovic, M., Rikardsen, E., and Hope, G.: Using Ensemble Ocean Currents for Drift Predictions, EGU General Assembly 2024, Vienna, Austria, 14–19 Apr 2024, EGU24-15769, https://doi.org/10.5194/egusphere-egu24-15769, 2024.

EGU24-15796 | ECS | Posters on site | NP6.3

Time-lagged Ensemble Model Verification for Short-term Prediction of Drifter Trajectories  

Victor de Aguiar, Martina Idžanović, Johannes Röhrs, Malin Johansson, and Torbjørn Eltoft

Predicting trajectories of objects at the ocean’s surface, such as oil slicks or their utilization in search-and-rescue operations, relies heavily on underlying geophysical models. Uncertainties are inevitably present in the modeled ocean and atmospheric fields, and are inherited by the Lagrangian models, thus limiting drift forecasts up to a few days. Estimating and subsequently addressing the uncertainty of the background hydrodynamic model is critical for short-window response and preparedness. Uncertainty estimation in drift modeling has traditionally been performed by varying the magnitude of the so-called wind drift factor. Such an approach results essentially in a greater diffusion of the cloud of virtual particles as the geophysical dynamic system is fundamentally the same. This can be overcome by perturbing by hydrodynamic ensemble generation through e.g. initial condition and surface forcing perturbations.

To derive estimates of the uncertainties, we evaluate short-term (1-5 days) trajectory forecasts forced by the Barents-2.5 km operational ensemble prediction system (EPS) against observed trajectories of undrogued drifters deployed in Fram Strait and Barents Sea. Seventeen low-cost devices (OpenMetBuoy) were deployed in sea ice free conditions during two field campaigns in April and August 2022, respectively, with life spans varying between 10 days and 10 months. Using 48 time-lagged ensemble members, the uncertainty in drift predictions is quantified via error/spread ratio, two-dimensional (2D) rank histograms and reliability diagrams. The ability of the EPS to capture physical processes is verified through rotary auto- and cross-spectral analysis on 5-day segments.

Our results show that the EPS manages to capture the main rotary spectral features well, but it underestimates with up to two orders of magnitude the spectral energy density towards the higher frequencies (> 0.08 cycles per hour) for both regions. High coherence (> 0.7) between observed and modeled drifter velocities, obtained through rotary cross-spectral, was found for the Barents Sea region, decreasing to less than 0.4 for the simulations performed in the Fram Strait. Additionally, we did not find indications that the observed and modeled drifter velocities are coherent to each other relative to the wind forcing in the latter area. 

The error/spread and 2D rank histograms revealed that Barents-2.5 is underdispersive, with the Fram Strait simulations presenting higher deviation from the ideal uniform distribution and higher error/spread (2.5-5) in comparison to the Barents Sea case (1-2). Despite its lack of dispersion, the EPS is nonetheless reliable in the Barents Sea for cumulative traveled distances up to approximately 1 inertial cycle. In Fram Strait, the model over- (under-) estimates trajectory displacements for super- (sub-) inertial frequencies.

Three key outcomes are highlighted in this work: (1) Forcing simulations with wind observations marginally improves the energy spectral density, indicating that modeling improvements should focus on the ocean model; (2) Adding further ensemble members through time-lagging does not necessarily improve ensemble dispersion; (3) Ensemble underdispersion does not imply lack of reliability if the main driving forces (e.g. wind and tides) are well resolved by the model.

How to cite: de Aguiar, V., Idžanović, M., Röhrs, J., Johansson, M., and Eltoft, T.: Time-lagged Ensemble Model Verification for Short-term Prediction of Drifter Trajectories , EGU General Assembly 2024, Vienna, Austria, 14–19 Apr 2024, EGU24-15796, https://doi.org/10.5194/egusphere-egu24-15796, 2024.

EGU24-17084 | ECS | Posters on site | NP6.3

Scaling and intermittent properties of atmospheric and oceanic turbulent pCO2 time series and their difference 

Kévin Robache, François G. Schmitt, and Yongxiang Huang

The oceans interact and exchange CO2 with the atmosphere through different processes that form the biological and physical pumps. The atmospheric and oceanic partial pressures of CO2 are therefore chemical tracers impacted by numerous forcing processes, including turbulence. Turbulence thus has an impact on the fluctuations of pCO2 and on their difference, the sign of which determines the direction of the air-sea flux of CO2.

Here, we used a published database (Sutton et al., 2019) to study the scaling properties of sea temperature, sea salinity, atmospheric and oceanic pCO2 and their difference ∆pCO2 time series recorded at 38 locations every 3 hours. Fourier spectral analysis revealed scaling for ranges between 3 days and 3 months approximately. The statistics of spectral slopes over this scaling range has been considered. Then, empirical mode decomposition and Hilbert spectral analysis were used to study the intermittency properties of the time series of 3 buoys having a large enough data points. For all three locations the intermittent multifractal properties of pCO2 were considered. Some main parameters were extracted assuming a lognormal multifractal model.

How to cite: Robache, K., Schmitt, F. G., and Huang, Y.: Scaling and intermittent properties of atmospheric and oceanic turbulent pCO2 time series and their difference, EGU General Assembly 2024, Vienna, Austria, 14–19 Apr 2024, EGU24-17084, https://doi.org/10.5194/egusphere-egu24-17084, 2024.

EGU24-19490 | ECS | Orals | NP6.3

What information can be gathered from patterns in turbulent free-surface flows? 

Omer Babiker, Jørgen Aanes, Anqing Xuan, Lian Shen, and Simen A Ellingsen

Gas transfer between ocean and atmosphere is largely governed by the turbulence in the topmost centimetres beneath the free surface. It has been frequently observed that areas of strong positive divergence of the surface-tangential velocity field correspond to efficient surface renewal and consequently increased transfer of gas across the interface. Patches of strong positive surface divergence occur through intermittent upwelling events visible as ``boils'' on the surface.

It has been qualitatively observed that surface-attached ``bathtub'' vortices tend to appear at the edges of upwelling boils, as well as sharp valleys, sometimes referred to as ``scars”. Surface-attached vortices and scars leave imprints on the surface which are particularly simple to detect: the vortices are circular and live for a long time, while scars are sharp and elongated structures.

From direct numerical simulations, we show that a very high correlation exists between the time-dependent number of surface-attached vortices and the mean square of the surface divergence. We use a newly developed method whereby the surface-attached vortices are identified with high precision and accuracy from their surface imprint only.

We also looked at the turbulent structures just beneath the surface-attached vortices and the scars, noting how far under the surface these structures propagate and, thus, how far into the flow subsurface features can be read from patterns on the surface only.

The main application is in remote sensing, as these patterns on the surface can be easily detected using camera footage, for example. These patterns would give estimates of the subsurface quantities without the need for expensive measurement.

How to cite: Babiker, O., Aanes, J., Xuan, A., Shen, L., and Ellingsen, S. A.: What information can be gathered from patterns in turbulent free-surface flows?, EGU General Assembly 2024, Vienna, Austria, 14–19 Apr 2024, EGU24-19490, https://doi.org/10.5194/egusphere-egu24-19490, 2024.

EGU24-20185 | Orals | NP6.3

Lagrangian modelling of plastic transport in marine waters.  

Guttorm Alendal, Prithvinath Madduri, Anna Oleynik, Helge Avlesen, and James R. Clark

We will report on two studies we have done related to Lagrangian transport of plastic particle in marine waters.

In the first study, we investigate the particle dynamics of tyre-wear microplastics that come from road traffic across two major bridges in Byfjorden, namely the Nordhordland Bridge and the Askøy Bridge. We employ a Lagrangian particle tracking framework, OpenDrift, with background horizontal velocities from Bergen Ocean Model (BOM), paired with a vertical sinking velocity obtained from Stokes law to track individual particle paths along the flow field until they reach the seafloor. The sinking velocity is picked from a distribution that is designed based on results from point source experiments, enabling us to cover the particle dynamics for a spectrum of sinking velocities. The basis of this study lies in using the variability in local currents, by conducting multiple experiments with distinct initial locations and release times to understand the similarities and differences in the footprint. In the particle simulation, the horizontal velocity experienced by individual particles depends on release time which is related to when in the tidal cycle the particle is released. We seek insights to discover potential aggregation zones and their corresponding gradients along the bottom of the fjord. We plan to shed light on ‘how particle dynamics change when we vary the sinking velocity’. These results could be applicable in identifying the mechanisms behind particle transport in fjords and can assist in designing sampling campaigns.

In the second, we assess the amount of transboundary plastic coming along the coast of western Norway, employing a nested modelling approach. We utilize emissions data of buoyant plastics from major European rivers (Meijer et al., 2021), as an input to our Lagrangian particle tracking model simulated using OpenDrift. The background currents are provided by the nested model which includes surface currents from three grids: A 4km model of the North Atlantic - Nordic4K (Lein et al., 2013), An 800m model covering Norway’s coastline - Norkyst800 (Albertsen et al., 2011), and 160m hydrodynamical model - NorFjords160 (Dalsøren et al., 2020). As particles transit through these nested grids, we precisely track the plastic pathways into the western Norwegian fjords around the city of Bergen. Employing this nested grid setup addresses problems with boundary conditions and mass balance. We present the estimates for the fraction of plastic moving into the fjord with focus on relative influence of wind and ocean currents on the transboundary movement of plastic. This study sheds light on processes responsible for near and far field transport, providing valuable insights for agencies working on trans-national pollution laws and implementing ocean clean-up strategies.

How to cite: Alendal, G., Madduri, P., Oleynik, A., Avlesen, H., and R. Clark, J.: Lagrangian modelling of plastic transport in marine waters. , EGU General Assembly 2024, Vienna, Austria, 14–19 Apr 2024, EGU24-20185, https://doi.org/10.5194/egusphere-egu24-20185, 2024.

EGU24-20942 | Posters on site | NP6.3

Nordstream pipelines CH4 leak estimates and transport uncertainty using ICOS data and the FLEXPART Lagrangian particle dispersion model 

Ignacio Pisso, Stephen Platt, Norbert Schmidbauer, Sabine Eckhardt, Nikolaos Evangeliou, Erik Marthinsen, Rona Thompson, and Massimo Cassiani

Following the sabotage of the Nord Stream 1 and 2 subsea pipelines on 26 September 2022, natural gas leaks resulted in unprecedented emissions of methane that were detected by several ICOS stations. As the plume traveled North, the detections occurred mainly in Scandinavia. NILU’s initial modeling activities provided a preliminary estimate of 155 KtonCH4 for the leaks that was made public as a press release. A recent collaborative effortorganized by the United Nations Environment Programme’s International Methane Emissions Observatory (UNEP’s IMEO) provided new model-based pipeline rupture outflow rates. In combination with updated ICOS CH4 time series we updated the estimated release values produced. We discuss the uncertainties associated with the atmospheric modelling for this updated analysis with emphasis on the Lagrangian transport aspects of the problem and the associated uncertainties.

How to cite: Pisso, I., Platt, S., Schmidbauer, N., Eckhardt, S., Evangeliou, N., Marthinsen, E., Thompson, R., and Cassiani, M.: Nordstream pipelines CH4 leak estimates and transport uncertainty using ICOS data and the FLEXPART Lagrangian particle dispersion model, EGU General Assembly 2024, Vienna, Austria, 14–19 Apr 2024, EGU24-20942, https://doi.org/10.5194/egusphere-egu24-20942, 2024.

OS5 – Short courses and Sessions of general interest for Ocean Science

EGU24-758 | ECS | Orals | EOS4.4

Méditerranée 2000: Nurturing climate & ocean awareness 

Pimnutcha Promduangsri, Pariphat Promduangsri, and Estelle Bellanger

Humans have been suffering increasingly from the escalating impacts of climate and ocean change.  Well known examples are droughts, flooding, wildfires, acidification, heatwaves, sea-level rise, extreme storms and biodiversity loss.  If global average temperature rises by more than 1.5°C above pre-industrial levels, multiple climate tipping points will be triggered, and indeed, some already are.  This is and will be devastating for people around the world, especially those in coastal areas.  Thus, the need for immediate and informed action has become urgent.

This presentation will outline some of the many concrete, local actions in the area of climate and ocean, undertaken by Méditerranée 2000 (Med2000), an environmental association in the South of France.  Since 1989, the association has committed its efforts and educational programs to promoting sustainable development.  Each year, the association educates more than 25,000 young people and adults, led by a team of ten specialized speakers.  Med2000’s initiatives include awareness campaigns about climate and ocean change, hands-on educational activities in local schools and events for the general public.

How to cite: Promduangsri, P., Promduangsri, P., and Bellanger, E.: Méditerranée 2000: Nurturing climate & ocean awareness, EGU General Assembly 2024, Vienna, Austria, 14–19 Apr 2024, EGU24-758, https://doi.org/10.5194/egusphere-egu24-758, 2024.

Academic researchers have long been advocates of various causes in the public arena; their public advocacy to take normative positions regarding various moral, political or social issues is not new. Today, however, in the face of the many challenges facing our society, the question of researchers' public positions, particularly in relation to the environment and climate change, is being raised anew. A number of climate scientists are committed in a variety of ways, from signing op-eds to participating in the work of NGOs or think tanks, supporting legal actions or writing blog posts. In addition, the development of traditional and social media has significantly increased the public exposure of these researchers. At the same time, serious questions are being raised within the research community. Many of its members are debating the ways in which researchers can engage in such public advocacy, its advisability, and even its very principle. However, these debates are currently taking place in informal settings and, given the extensive individual experience of a number of colleagues, it is probably time to engage in this discussion in a more collective and organised way, as is done in other research communities.

Here are some examples of questions that might be discussed. How can researchers engage in public advocacy safely and responsibly? What is the role of the scientist versus the expert versus the citizen versus the activist? Can a researcher be neutral when taking a public stance? What is the risk of appearing naive, manipulated or irrelevant? How should researchers deal with vested interests and private actors? Should the climate community research geoengineering? For whom should researchers develop climate services?

Because addressing these issues involves a tension between personal values that may go beyond those shared by the scientific community, they are essentially novel ethical questions. Some may be so intimidating that many researchers choose not to engage publicly. Care must therefore be taken to organise the exchange properly, for example by creating safe internal spaces for debate or by inviting experts from other disciplines.

The French CNRS Ethics Committee has recently published on opinions on these issues[1], which I will use as a starting point for a broader discussion.


[1]  https://comite-ethique.cnrs.fr/en/comets-opinion-freedom-and-responsibility-academic-researchers-public-advocacy/

How to cite: Guilyardi, E.: Freedom and Responsibility: the Ethics of Academic Researchers’ Public Advocacy, EGU General Assembly 2024, Vienna, Austria, 14–19 Apr 2024, EGU24-1344, https://doi.org/10.5194/egusphere-egu24-1344, 2024.

EGU24-2053 | Orals | EOS4.4

Perceiving Cape-Town-Geoethics (CTG) through Symbolic Universes (SU) 

Martin Bohle, Rika Preiser, and Eduardo Marone

Cultural milieus determine the worldviews and practices of individuals and groups, including the reception of norms that guide them. Semiotic Cultural Psychological Theory (SCPT) methods, such as Symbolic Universes (SU), describe relationships of reception, worldviews and practice, which also applies to geo-philosophical matters [1]. This essay outlines how geoethics, for example, the Cape Town Geoethics (CTG), might be received in different cultural milieus.

The Cape Town Statement on Geoethics was proposed in 2016 at the 36th IGC [2] and is the most accessible resource on geoethics. It bundles various concepts in a Kantian/Aristotelian virtue ethics framework, illustrated, for example, by the Geoethical Promise [3].

The SU method describes the understanding, insights, and behaviour of groups of people expressing their respective cultural milieus. Extensive fieldwork identified five SU for people of European (Western) cultures [4]. The SUs called "Ordered Universe", "Interpersonal Bond", "Caring Society", "Niche of Belongingness", and "Others' World" categorise milieus, for example, in terms of relation to power and institutions or sources of trust. They corroborated with the Kohlberg hierarchy of the level of societal coordination [5] that is applicable to associate CTG and the worldviews of individuals and groups [6].

Comparing CTG and SU indicates: (1) CTG resonates most positively with people of the cultural milieu “Ordered Universe” (highest Kollberg level); (2) in other milieus, the reception of the CTG will be “measured”; (3) reception will be adverse for the milieu “Others' World” (lowest Kohlberg level). Hence, considering the quantitative distribution of SUs (in Europe), European citizens' reception of CTG is likely restrained.

Given complex-adaptive social-ecological systems of the World and Nature couple world views, human practices, and societal and natural systems [7] (see example: [8]), whether variants of CTG “fitted to different milieus” should be developed is of practical relevance. The perception of norms and their acceptance or rejection is a system feature, of which geoethics should not be agnostic.

[1] Bohle M (2019) “Homo Semioticus” Migrating Out of Area? In: Salvatore S, et al. (eds) Symbolic Universes in Time of (Post)Crisis. Springer Berlin Heidelberg, Cham, pp 295–307

[2] Di Capua G, et al. (2017) The Cape Town Statement on Geoethics. Ann Geophys 60:1–6. https://doi.org/10.4401/ag-7553

[3] Matteucci R, et al. (2014) The “Geoethical Promise”: A Proposal. Episodes 37:190–191. https://doi.org/10.18814/epiiugs/2014/v37i3/004

[4] Salvatore S, et al (2019) The Cultural Milieu and the Symbolic Universes of European Societies. In: Salvatore S, et al. (eds) Symbolic Universes in Time of (Post)crisis. Springer, Cham, pp 53–133

[5] Kohlberg L (1981) The Philosophy of Moral Development: Moral Stages and the Idea of Justice. Harber & Row, San Francisco

[6] Bohle M, Marone E (2022) Phronesis at the Human-Earth Nexus: Managed Retreat. Front Polit Sci 4:1–13. https://doi.org/10.3389/fpos.2022.819930

[7] Preiser R, Woermann M (2019) Complexity, philosophy and ethics. In: Galaz V (ed) Global Challenges, Governance, and Complexity. Edward Elgar Publishing., Cheltenham, pp 38–62

[8] Talukder B, et al. (2023) Complex Adaptive Systems-Based Conceptual Framework for Modeling the Health Impacts of Climate Change. J Clim Chang Heal 100292. https://doi.org/10.1016/j.joclim.2023.100292

How to cite: Bohle, M., Preiser, R., and Marone, E.: Perceiving Cape-Town-Geoethics (CTG) through Symbolic Universes (SU), EGU General Assembly 2024, Vienna, Austria, 14–19 Apr 2024, EGU24-2053, https://doi.org/10.5194/egusphere-egu24-2053, 2024.

EGU24-2607 | Posters on site | EOS4.4

Geoethics literacy:  Clarifying values, principles and behaviour 

David Crookall, Pimnutcha Promduangsri, and Pariphat Promduangsri

Learning about geoethics is not easy partly because the area is relatively new (having emerged in the early 2010s), the concepts are sometimes difficult to fathom and geoethics touches on such a wide area of geoscience phenomena and on such a variety of human issues.

Learning through active, participatory engagement has been developing since the 1960s, and is now deployed, albeit sporadically, across the full educational and training spectrum (from the humanities, through the social sciences to the hard sciences).  Methods that have developed in this learning paradigm include project work, internships, experiential learning, simulation/gaming, values clarification and many more.  We contend that participatory methods are an effective way in which to learn, as supported by much research.

Our poster invites you to participate in a game-like, values clarification exercise.  We have developed a new version of an exercise that we have used in several places (Austria, Costa Rica, France, online) to unravel the knotty relations among values, principles and behaviours related to geoethical issues and dilemmas.

It is possible to play alone, but it is more enlightening and engaging to play in pairs or small groups.  Please bring a friend or two to our poster and participate in our exercise.  The basic process of the exercise can be adapted to your own specific areas of interest.  We look forward to seeing you – please bring a pencil.

(This poster was originally intended as a workshop in a short course, but our SC proposal was declined.)

How to cite: Crookall, D., Promduangsri, P., and Promduangsri, P.: Geoethics literacy:  Clarifying values, principles and behaviour, EGU General Assembly 2024, Vienna, Austria, 14–19 Apr 2024, EGU24-2607, https://doi.org/10.5194/egusphere-egu24-2607, 2024.

EGU24-3568 | Posters on site | EOS4.4

Exploring the horizon of geosciences through the lens of geoethics 

Silvia Peppoloni and Giuseppe Di Capua

Geosciences play an indispensable role in the functioning of contemporary societies. Nevertheless, the technological aspects associated with the practical application of geoscientific knowledge, should not overshadow the fundamental contribution of geosciences to shaping human thought. Geosciences have not only influenced but continue to shape our perception of the world, its interrelationships, and evolution.

The ongoing ecological crisis, with its environmental, social, cultural, economic, and geopolitical implications, has stemmed from an imprudent trajectory in human development. Regrettably, there have been instances where geosciences have contributed to this irresponsible path. This oversight has led to an undervaluation of the social and cultural significance inherent in geological disciplines and the crucial role they can play in addressing current global challenges to support human societies.

Geoethics, as the ethics of responsibility towards the Earth system, is grounded in the comprehensive understanding provided by geoscientific knowledge of the complexity of reality. It stands out as the optimal tool for cultivating a new perspective on geosciences, recognizing them as fundamental disciplines crucial for addressing global environmental challenges. This recognition extends beyond technical considerations, emphasizing their cultural significance. By virtue of their epistemological foundations, the geosciences collectively represent an invaluable reservoir of knowledge for human civilization. They are indispensable for redefining the intricate relationship that binds us, as humans, to the Earth.

For this reason, geoethical thought should serve as a complementary element to knowledge in the education of geoscientists. It aims to furnish them with a principled framework and ethical values, offering guidance for any application of geoscientific knowledge to the natural environment and human communities. Additionally, geoethical thought is the ground on which to set a shared, global ethical foundation, facilitating the advancement of our interactions with nature. It seeks to actualize an ecological humanism that forms the basis for human well-being and a more sustainable development of socio-ecological systems. The geoethical perspective redefines the cultural significance and objectives of the geosciences. Geoeducation and communication emerge as fundamental tools for bridging the gap between geosciences and society. They play a crucial role in promoting geoscientific knowledge, highlighting not only its scientific value in providing technical solutions to the ecological crisis but also emphasizing the philosophical dimension of geosciences, the geosophy of living consciously and responsibly within the Earth system.

How to cite: Peppoloni, S. and Di Capua, G.: Exploring the horizon of geosciences through the lens of geoethics, EGU General Assembly 2024, Vienna, Austria, 14–19 Apr 2024, EGU24-3568, https://doi.org/10.5194/egusphere-egu24-3568, 2024.

EGU24-3586 | Posters on site | EOS4.4

An infrastructure for researching on geoethics and facilitating its international promotion 

Giuseppe Di Capua and Silvia Peppoloni

The development of the theoretical foundations of geoethics and its practical applications have had a notable boost in recent years, seeing the involvement of a growing number of scholars from different disciplines. This has increasingly necessitated the creation of spaces where reflections, discussions, results, and study materials can be shared. The network of scholar relationships has progressively developed physical and conceptual spaces for discussions. The goal has been to sustain conceptual consistency in geoethical thinking by anchoring reflections in the discipline's historical evolution and fostering further developments through open analysis, welcoming contributions from diverse disciplinary backgrounds. Today, what can be defined as a research infrastructure on geoethics and the promotion of its contents possesses a complex structure, serving as a convergence point for various cultural and scientific experiences.

At the core of this infrastructure lies the International Association for Promoting Geoethics - IAPG (https://www.geoethics.org), established in 2012. It consists of an Executive Committee, national sections, and Task Groups focusing on specific topics within geoethics. More recently, two new entities have augmented this infrastructure: i) the Commission on Geoethics of the International Union of Geological Sciences (IUGS), established in February 2023, that is the supporting branch of the IAPG to the IUGS and the IUGS body that officially deals with geoethics and social geosciences for the Union; ii) the Chair on Geoethics of the International Council for Philosophy and Human Sciences (CIPSH, an organization operating under the umbrella of UNESCO), established in December 2023, with the aim of expanding and reinforcing an international research network of institutions, not-governmental organizations, and individual scholars to foster interdisciplinary initiatives for bridging geosciences, humanities, and social sciences through geoethics.

The research infrastructure on geoethics has been enriched over time with two editorial initiatives: a) SpringerBriefs in Geoethics series by Springer Nature (https://www.springer.com/series/16482), founded in 2020 and supported by the IAPG, that envisions a series of short publications that aim to discuss ethical, social, and cultural implications of geosciences knowledge, education, research, practice and communication; b) the Journal of Geoethics and Social Geosciences (https://www.journalofgeoethics.eu/), a diamond open access publication of the National Institute of Geophysics and Volcanology (Rome, Italy) and supported by the IAPG, founded in 2021.

Finally, the research infrastructure on geoethics is complemented by the School on Geoethics and Natural Issues (the “Schola”), founded in 2019 (https://www.geoethics.org/geoethics-school). The “Schola” is a place for teaching and learning of the principles and values of geoethics in the light of the philosophy and history of Earth sciences. The intent is to provide background knowledge and the evaluation skills necessary to understand the complex relationship between human action on ecosystems and the decisions geoscientists make in the discipline that impact society, including improving the awareness of professionals, students, decision-makers, media operators, and the public on an accountable and ecologically sustainable development.

How to cite: Di Capua, G. and Peppoloni, S.: An infrastructure for researching on geoethics and facilitating its international promotion, EGU General Assembly 2024, Vienna, Austria, 14–19 Apr 2024, EGU24-3586, https://doi.org/10.5194/egusphere-egu24-3586, 2024.

The ocean has started to attract more attention in the recent past with the notions of Blue Economy and Blue Growth becoming rallying points for a new frontier for investments [1]. Many countries and institutions prepare policy papers promising to end poverty, a push for new technologies and profits to fund the development. A recent systematic review of the literature [2], however, found no trace of articulated ethics and justice notions in midst of all the lofty hope and hype surrounding the often blurred concepts. The increasing financialisation of technological developments accelerated through digitalisation and the internet are creating increasing injustices to humans and harm to nature. But, as Rushkoff argues [3], the possibilities for feedback and more circular reasoning have potential to teach everybody that there is no escape from the natural world, thus weaning us from the hyperbole of permanent exponential growth. Here it is argued that critically engaged ocean and geo-sciences with their inherent message of a changing planet through deep time can contribute to debunking the ahistorical promise of fixing self-created problems by starting on a presumed ‘clean slate’. We frequently observe a pattern of wanting to solve the damage provoked by one technology with more technology, e.g. deep sea mining [4] or further technology development in fisheries and aquaculture [5]. At country level, these deliberately disruptive industrial approaches often pay little attention to working with the affected small-scale wild food producers who account for a quarter of global production. Instead, harnessing a combination of traditional and indigenous knowledges and providing intelligible access to the sciences holds significant potential for less destructive pathways. That would also be consonant with the promotion of knowledge co-creation during the UN Ocean Decade in pursuit of a vision of ‘the science we need for the ocean we want’. Practice of co-creation will require some rethinking of the self-image of many sciences and adaptations to typical project formulation and flows. In return, this is expected to produce valuable new insights in addition to opportunities for cooperation and blue justice as steps towards transformations based on ethical principles.


[1] World Bank. (2016). Oceans 2030: Financing the blue economy for sustainable development. Blue Economy Development Framework, Growing the Blue Economy to Combat Poverty and Accelerate Prosperity. World Bank Group, Washington DC.

[2] Das, J. (2023). Blue Economy, Blue Growth, Social Equity and Small-scale Fisheries: A Global and National Level Review. Studies in Social Science Research, 4(1):45 p. DOI: https://doi.org/10.22158/sssr.v4n1p38

[3] Rushkoff, D. (2022). Survival of the richest. Escape fantasies of the tech billionaires. Scribepublications, UK, ISBN 978-1-915590-24-4, 212 p.

[4] Zenghui Liu, Kai Liu, Xuguang Chen, Zhengkuo Ma, Rui Lv, Changyun Wei, Ke Ma. (2023). Deep-sea rock mechanics and mining technology: State of the art and perspectives. International Journal of Mining Science and Technology, 33(9):1083-1115. https://doi.org/10.1016/j.ijmst.2023.07.007.

[5] FAO. (2022). The State of World Fisheries and Aquaculture 2022: Towards Blue Transformation. Rome, FAO. doi:10.4060/cc0461en

How to cite: Nauen, C. E.: Can geosciences help inserting social justice notions into Blue Economy narratives?, EGU General Assembly 2024, Vienna, Austria, 14–19 Apr 2024, EGU24-4054, https://doi.org/10.5194/egusphere-egu24-4054, 2024.

Science indicates that human impact on the planet's climate is clear. Over the past 30 years, climate change has shifted from being primarily a scientific concern to emerging as one of the defining environmental challenges within our society. However, science alone cannot guide us on how to address this crisis. This challenge is also about how we envision living together, what we collectively value, and the level of risk we are prepared to assume. It fundamentally pertains to the kind of society we aspire to, making education a pivotal component. Inspired by the Paris Agreement, the time has arrived for Climate Change Education. It derives its momentum from the aspirations and mobilization of the youth, making it the most potent transformative action in response to climate change.

Climate Change Education comes with unique and exciting opportunities. Firstly, it offers a chance to learn about science in general and climate science specifically, drawing from authoritative sources like IPCC reports. Secondly, it provides an avenue to acquire life skills, humanities knowledge, and insights into global citizenship, imparting a holistic perspective to the young generation on a global scale. Lastly, it fosters critical thinking, hopeful hearts, and empathy in an ever-evolving educational landscape. However, Climate Change Education presents numerous challenges as it strives to balance the development of cognitive, emotional, and practical aspects within existing educational systems. Educators need to be prepared for this unique combination of ‘head’, ‘heart’, and ‘hands’.

The mission of the Office for Climate Education (OCE) is precisely to empower educators in preparing young generations with a robust understanding of climate change and the skills needed to act as global citizens in a changing world. The OCE, driven by collaboration between climate science and educational communities, develops sets of pedagogical resources, offers teacher professional development opportunities, and facilitates networks of practice worldwide. As a pivotal participant in the newly established Greening Education Partnership, the OCE serves as a bridge between the global landscape of IPCC-based science and the specific needs of local primary and secondary educational systems in over 20 countries.

How to cite: Guilyardi, E. and Wilgenbus, D.: Exciting times for Climate Change Education – from global opportunities to local challenges, EGU General Assembly 2024, Vienna, Austria, 14–19 Apr 2024, EGU24-6101, https://doi.org/10.5194/egusphere-egu24-6101, 2024.

The National Association of State Boards of Geology (ASBOG) plays an essential role in supporting the licensing of applied geoscientists in more than 30 states in the United States [1] through promulgating model law, rules, and regulations for professional licensure, [2] by developing and implementing the Fundamentals of Geology (FG) and Practice of Geology (PG) exams, and [3] by providing related educational materials.  The content of the FG and PG exams is driven substantially by the results of Task Analysis Surveys (TAS) taken by practicing geologists and academic geologists.  Before 2023, the exams included content related to ethics reflected in the earlier TAS analytical summaries;  however, ethics content is not included in the 2023 TAS or, reportedly, in the current FG or PG exams.
     ASBOG has a history of including applied ethics in its products and organizational structure.  There is a "Code of Conduct/Harassment Policy and Performance Guidelines" for the ASBOG organization on its website (ASBOG.org).  The "Professional Geologist Model Licensure Law" states that each applicant must "submit a signed statement that the applicant has read and shall adhere to any code of professional conduct/ethics and rules established by the Board..." and that the application "be signed and sworn to by the applicant before a notary public" (ASBOG 2017, lines 844-847).  Its "Model Rules and Regulations" includes a sample "Code of Ethics" for licensed professional geologists (ASBOG 2019, p. 27-29).  
     Geoscience professional organizations in the US and internationally affirm the fundamental importance of ethics in academic and applied geoscience.  Virtually all professional organizations relevant to applied-geoscience practice in the United States (e.g., AAPG, AGI, AGU, AIPG, AEG, ASBOG, GSA, SIPES...) have some form of ethics code that their members are obligated to know and adhere to.  The International Association for the Promotion of Geoethics (IAPG -- www.geoethics.org) curates a list of codes of ethics/professional practice and provides publications and educational opportunities supporting geoethics.  Another essential resource is the "Teaching Geoethics" website (serc.carleton.edu/geoethics -- Mogk and Bruckner, 2014-23).
     Robert Tepel (1995) described the essential connection between licensure laws and professional ethics.  To the extent that there is a lack of ethics content in the current 2023 TAS, candidate handbook, exam preparation resources, and FG and PG exams, ASBOG sends a message that applied ethics might not be a core competency for licensed geoscientists -- a message for which there is essentially no support among geoscience professional organizations.
          I suggest that ASBOG collaborate with IAPG and other relevant organizations to address the problems or concerns that resulted in the reported elimination/reduction of ethics content in the application, preparation, and implementation of its FG and PG exams.  Licensed professional geoscientists must continue to understand that geoethics is foundational for their work within society.  For references and resources, visit CroninProjects.org/EGU-Geoethics2024/.

How to cite: Cronin, V.: The need to include ethics content in professional licensure exams in the US (and worldwide), EGU General Assembly 2024, Vienna, Austria, 14–19 Apr 2024, EGU24-6136, https://doi.org/10.5194/egusphere-egu24-6136, 2024.

EGU24-6573 | ECS | Orals | EOS4.4

Proposal for a Geoethics Code for the Geoscientist Community of Chile 

Hernán Bobadilla, Luisa Pinto Lincoñir, Pablo Ramirez, Thiare González, José Benado, Nilda Lay, Tania Villaseñor, Millarca Valenzuela, Mohammad Ayaz Alam, and Alejandro Pérez

The proposal of the Geoethics Code (hereinafter “Code”) of the Geological Society of Chile arises as a strategic objective of the Geoethics Group within this institution. The Code encapsulates the principles and values that ethically guide and protect the professional decisions of geoscientists in Chile to protect society and the environment. Likewise, it establishes standards of conduct from the personal to the environmental dimension of professional and scientific practice. Consequently, the Code serves as a valuable tool to the geoscientist community in Chile, facilitating reflection and decision-making within an ethical framework.

Grounded in the principles and values defined by the Geoethics Group of the Geological Society of Chile and the Cape Town Geoethics Declaration of the International Association Promoting Geoethics (IAPG) from 2016 (Di Capua et al., 2017), the Code is built upon four titles: a) Professional and scientific work; b) Geosciences and its relationship with society; c) Geosciences and its relationship with the environment; and d) Contribution to new generations of scientists and professionals in Geosciences.

The construction strategy of the Code underscores the pivotal role of the Chilean geoscientist community. Thus, the Code proposal was enriched through consultations, including surveys, meetings, discussions, and seminars, engaging the Geoscientist Community of Chile to understand their perspectives on pertinent topics and challenges. Furthermore, consultations and reflections were conducted to validate the Code proposal before and during the XVI Chilean Geological Congress in 2023. Ultimately, the Code underwent validation with experts from the IAPG, including geoscientists representing Latin America. Consequently, the Code authentically represents the concerns and challenges of the national geoscientific community while also resonating with the international geoscientific community.

Financing

This project is sponsored by the Geological Society of Chile.

Acknowledgements

To the geoscientist community of Chile, the IAPG experts and other professionals who have participated in the process of construction and reflection on the titles of the proposed Geoethics Code.

References

Di Capua, G., Peppoloni, S., Bobrowsky, P.T., 2017. The Cape Town Statement on Geoethics. Annals of Geophysics, 60, Fast Track 7: Geoethics at the heart of all geoscience. doi: 10.4401/ag-7553.

Keywords

Geoethics Code, Principles and Values, IAPG, Geoscientist Community.

How to cite: Bobadilla, H., Pinto Lincoñir, L., Ramirez, P., González, T., Benado, J., Lay, N., Villaseñor, T., Valenzuela, M., Alam, M. A., and Pérez, A.: Proposal for a Geoethics Code for the Geoscientist Community of Chile, EGU General Assembly 2024, Vienna, Austria, 14–19 Apr 2024, EGU24-6573, https://doi.org/10.5194/egusphere-egu24-6573, 2024.

EGU24-6593 | ECS | Posters on site | EOS4.4

Invitation to a research project on geography and climate education 

Pimnutcha Promduangsri

Educational approaches around the world are shaped by diverse geographical factors, including topography, climate, distance, urbanization and societal characteristics.  As a consequence, the methods employed for climate change education (CCedu) are expected to vary according to these geographical factors.

The United Nations Educational, Scientific and Cultural Organization (UNESCO) emphasizes the crucial role of CCedu in fostering an understanding of and effective response to the impacts of the climate crisis.  The Intergovernmental Panel on Climate Change (IPCC) highlights the importance of a globally conscious population for effectively addressing and adapting to climate change challenges.

However, rather than exploring the concept of CCedu or its effectiveness, my research project will focus on identifying the influence of geographical factors on climate change education/literacy.  In the long run, this project could potentially contribute to improving the effectiveness of CCedu.  I invite participants to visit my poster to discuss, share ideas and collaborate on this research project.

How to cite: Promduangsri, P.: Invitation to a research project on geography and climate education, EGU General Assembly 2024, Vienna, Austria, 14–19 Apr 2024, EGU24-6593, https://doi.org/10.5194/egusphere-egu24-6593, 2024.

Environmental (in)justice arising from Climate change and urbanization exhibit uneven distributions, specifically impacting disadvantaged communities. While studies in the USA highlight the elevated heat exposure faced by low-income and ethnic minority groups, similar insights are lacking for other countries. This knowledge gap impedes a comprehensive understanding of environmental (in)justice experienced by various socio-economic and ethnic groups and hampers the identification of inadequacy in urban planning policies.

This research seeks to bridge the gap between social and environmental sciences to address environmental (in)justice by establishing a link between extreme heat (at both regional and country level) and socio-economic disparities for Australia and New Zealand. Using remotely sensed satellite data for Land Surface temperature mapping for summer (night time) and Census data of countries, the analysis explores various socio-economic indicators—such as education levels, age demographics, and the proportion of foreign populations.

Australia and New Zealand serve as pertinent case studies due to their distinct socio-economic landscapes and Indigenous populations. By recognizing the unequal distribution of urban heat and its disproportionate impact on vulnerable communities, there emerges a critical mandate to prioritize equitable urban planning policies. This research underscores the urgency for policymakers and urban planners to prioritize environmental justice interventions and integrate strategies that aim to reduce race and class disparities concerning urban heat. The findings also serve as a template for similar analyses globally; fostering inclusive, equitable and resilient urban landscapes.

How to cite: Chawla, J. and Benz, S.: Examining Race and Class Disparities in Urban Heat in Australia and New Zealand: Towards Environmental Justice in Urban Planning, EGU General Assembly 2024, Vienna, Austria, 14–19 Apr 2024, EGU24-6662, https://doi.org/10.5194/egusphere-egu24-6662, 2024.

EGU24-7655 | Orals | EOS4.4

Delivering Critical Raw Materials: Ecological, Ethical and Societal Issues 

Richard Herrington and Sarah Gordon

Leaders across geographical and political boundaries are united behind a pledge to deliver a net zero carbon world by 2050.  Society’s conundrum is that mining is an essential part of that delivery, yet is an activity regarded by many as unpalatable. Projects that have fallen short on ecological, ethical, or social grounds, serve to confirm to many that mining is currently not an industry to be trusted, rather than being the industry that could and should be empowering significant societal development.

Examples of societal failure include the incidents around the 2012 miners’ strike at the Marikana platinum mine in South Africa which escalated into violence and loss of life.  Failure on ethical grounds was most recently highlighted by the settlement of corruption claims in the Democratic Republic of Congo (DRC) where international mining company staff bribed country officials to secure “improper business advantages.”  Ecological failures are all too common and most visible in the failure of tailings storage facilities such as the 2015 Mariana (Brazil), 2019 Brumadinho (Brazil), and 2022 Jagersfontein (South Africa) dam disasters.

The challenge for those who explore, extract, and process the raw materials so vital for the energy transition, is to do so whilst delivering on true Sustainability right from the start of any project.  Mining disasters are rarely a surprise.  The proactive management of both threats and opportunities is therefore key to the urgent delivery of materials to secure our net zero future in a responsible manner.  We must ensure that this delivery is achieved by projects with wholly net positive outcomes for the environment and people.

How to cite: Herrington, R. and Gordon, S.: Delivering Critical Raw Materials: Ecological, Ethical and Societal Issues, EGU General Assembly 2024, Vienna, Austria, 14–19 Apr 2024, EGU24-7655, https://doi.org/10.5194/egusphere-egu24-7655, 2024.

EGU24-8075 | Orals | EOS4.4

Can landslides provide geosystem services? 

Martin Mergili, Christian Bauer, Andreas Kellerer-Pirklbauer-Eulenstein, Jana Petermann, Hanna Pfeffer, Jörg Robl, and Andreas Schröder

The concepts of biodiversity and ecosystem services, focusing on the diversity of life and the services provided to humans by such diversity, in interaction with abiotic ecosystem components, are well established. Only recently, geosciences have started to challenge this rather biocentric view by highlighting that geodiversity – understood as the diversity of minerals, rocks, geological structures, soils, landforms, and hydrological conditions – provides substantial services to society and should be treated as equal partner to biodiversity. It was proposed to use the more general term natural services or, where geodiversity is much more relevant than biodiversity, geosystem services. Even though the term geosystem services is more and more employed in literature, it evolves only slowly into a commonly used concept with a clearly defined meaning. Interpretations range from all services associated with geodiversity which are independent of interactions with biotic nature, to the restriction to subsurface services. None or few of these concepts, however, include risks as negative services, or as costs of services, which is surprising as this would enable a more integrated vision on human-nature relationships. Only very recently, the potential of geosystem service maps to highlight both services and risks related to geomorphological processes was pointed out.

This work picks up landslides as a type of geomorphological process and landform, which is rather negatively connotated in society and associated with risks rather than with chances. We use landslides to develop a broader understanding of geosystem services, together with the common understanding of hazards and risks. We will (i) present a sound and integrated conceptual framework to consider landslides within the field of tension between risks and resources, and (ii) highlight a case study where landslides are used as cultural geosystem services for environmental education in the context of UNESCO Global Geoparks, which are considered important instruments for conserving and promoting geodiversity.

How to cite: Mergili, M., Bauer, C., Kellerer-Pirklbauer-Eulenstein, A., Petermann, J., Pfeffer, H., Robl, J., and Schröder, A.: Can landslides provide geosystem services?, EGU General Assembly 2024, Vienna, Austria, 14–19 Apr 2024, EGU24-8075, https://doi.org/10.5194/egusphere-egu24-8075, 2024.

EGU24-10646 | Posters virtual | EOS4.4

Protects and Heats 

Walter Tavecchio

The project “Protects and Heats” aims to safeguard the environment, to reduce the carbon dioxide emissions and the risk of collapse of buildings affected by earthquakes.

This is a new way to heat and cool buildings and at the same time mitigate the seismic vibrations.


The logic of the project is to create a discontinuity (Moat) in the ground in front of the structures to be protected, similar to damping methods that are implemented to dampen the vibrations produced by mechanical machines and without compromising the stability of the buildings themselves.

The project involves the construction of a double row of aligned micro piles and the insertion of HDPE and steel pipes inside the vertical drilling holes.

Closed circuit geothermal probes will be positioned, inside some vertical holes, with a low enthalpy closed circuit geothermal system.

The method of the project is achieved by combining two types of technologies:

-   The first concerns the interposition, between the direction of the seismic waves and the buildings, of a damping barrier.

The vertical barrier starting from the topographic surface will be positioned outside the buildings, generally orthogonal to the direction of the seismic waves.

-  The second concerns the installation of geo-exchange pipes, in the holes.

How to cite: Tavecchio, W.: Protects and Heats, EGU General Assembly 2024, Vienna, Austria, 14–19 Apr 2024, EGU24-10646, https://doi.org/10.5194/egusphere-egu24-10646, 2024.

EGU24-12918 | Orals | EOS4.4

The most consequential ethical decision for geoscience  

Emlyn Koster and Philip Gibbard

A geological definition of the Anthropocene, shorthand for humanity’s cumulative disruption of the Earth-Human Ecosystem, looms as the planet-and-people focused UN approaches its Summit of the Future in New York City on 22-23 September 2024. The International Union of Geological Sciences (IUGS) “aims to promote development of the Earth sciences through the support of broad-based scientific studies relevant to the entire Earth system”. With the UN recently declaring that the planet is in peril and in need of a rescue plan, Anthropocene considerations with a geoethical lens are urgently needed.

Each potential new interval in the Geological Time Scale begins with a working group mandated by the International Stratigraphic Commission (ICS), in the case of the Anthropocene also by its Subcommission on Quaternary Stratigraphy (SQS). The Anthropocene Working Group (AWG) was formed in 2009. In 2010, its first chair Jan Zalasiewicz with co-authors Mark Williams, Will Steffen and Paul Crutzen recognized that “the Anthropocene represents a new phase in both humankind and of the Earth, when natural forces and human forces become intertwined, so that the future of one determines the fate of the other”. In 2015, the AWG’s second and current chair Colin Waters with ten co-authors posed the question "Can nuclear weapons fallout mark the beginning of the Anthropocene Epoch?" in the Bulletin of the Atomic Scientists. This was affirmed in 2019 and the AWG presented its recommendation to the SQS in early 2024. The remaining review and decision steps are the ICS and IUGS. Reflecting concerns of other geoscience scholars as well as of other professions and an anxious public, an opposing mindset advocates for an Anthropocene event that spans the cumulative and ongoing environmental impacts of Homo sapiens. It views Geological Time Scale protocols as unsuitable for archaeological and contemporary developments, regards unemotive references to humanity’s most abhorrent invention as distasteful, and visualizes the Anthropocene Event as valuably informing a new zeitgeist for our troubled world.

In 1950 astronomer Fred Hoyle anticipated that humanity’s first view of the Earth from space would revolutionize the course of history. Insofar as a ‘giant leap of mankind’ did not result from NASA’s Apollo 1969 lunar mission with its estimated 600 million viewers, the Anthropocene Event fuels an opportunity for geoscience to inform a realistic outlook during NASA’s upcoming Artemis lunar mission. With unique knowledge of once pristine environments, current climate change and incipient sea level rise, ongoing biodiversity loss and ecosystem disruption, finite energy and mineral resources, the geoscience profession should arguably have already become a crucial asset in this troubled world.

How to cite: Koster, E. and Gibbard, P.: The most consequential ethical decision for geoscience , EGU General Assembly 2024, Vienna, Austria, 14–19 Apr 2024, EGU24-12918, https://doi.org/10.5194/egusphere-egu24-12918, 2024.

EGU24-13965 | Orals | EOS4.4

Ocean Futures: A New Paradigm and Teaching in the Age of Ocean Change 

Susanne Neuer, Stephanie Pfirman, Roberta Martin, Katie Kamelamela, Amy Maas, and Nick Bates

The new School of Ocean Futures (oceans.asu.edu) at Arizona State University (Tempe, AZ, USA) has embarked on a novel way of teaching ocean science with a forward-looking philosophy that centers on the current and future states of the ocean. While situated in Arizona State University’s main campus, it leverages the location of its two offshore campuses, the Center of Global Discovery and Conservation Science in Hilo, Hawaii, and the Bermuda Institute of Ocean Sciences (BIOS) in Bermuda. The Ocean Futures programs combine aspects of traditional ocean science teaching with ocean stewardship, partnerships, and Indigenous knowledge, and focus on the communities that live with the ocean and are affected by its rapid change. In this presentation we will introduce the curriculum of the new degree, as well as the challenges encountered, and best practices learned. Novel courses include “Introduction to Ocean Futures”, a capture course that aims at increasing the interdisciplinary knowledge of oceans, while actively seeking to increase diversity and retention in the field via inclusive pedagogical practices, the historical context of oceanography and an emphasis on developing a mindset of empowerment for change. It is followed by “Ocean Communities”, a course that immerses students through an ethnobotanical lens in global mountain to ocean cultural connections, while elaborating on how various human communities engage, exchange, and build relationships with regional resources. The students will receive hands-on aquatic knowledge through field courses at BIOS, the Sea of Cortez, Hawaii, and Antarctica. The curriculum culminates with an ocean workshop and capstone course that will allow the students to work directly with partners to address real-world challenges facing coastal communities and marine systems.


How to cite: Neuer, S., Pfirman, S., Martin, R., Kamelamela, K., Maas, A., and Bates, N.: Ocean Futures: A New Paradigm and Teaching in the Age of Ocean Change, EGU General Assembly 2024, Vienna, Austria, 14–19 Apr 2024, EGU24-13965, https://doi.org/10.5194/egusphere-egu24-13965, 2024.

In the Anthropocentric era, the human-driven climate crisis has become a serious global issue. To mitigate the impacts of climate change, it is crucial for humans to adopt a more sustainable way of living. Human behaviors are shaped by their culture, where religious beliefs play important roles. As a result, people turned to religions for addressing with climate change issues.

Seeming to be unrelated, religions and climate issues have found connections through social systems and communication. By endowing climate issues with religions meanings, religions are able to resonate with the ecological crisis and take meaningful actions. Through this "resonance," religions contribute to climate issues by shaping worldviews, establishing sustainable habits, initiating actions, and influencing policies.

Religious communities have recognized the severity of the human-driven climate crisis. Their call for action reflects the fact that Taiwanese society has failed to respond to the climate crisis due to its endless pursuit of consumerism. To deal with the challenges, religious communities have advocated for “Ecological Conversion”, which persuade people to save the nature for the sake of God.

How religions can empirically contribute to environment issues has been a long-discussed topic. However, previous literatures only focus on the Western-Christian World. Countries with religious beliefs other than Judeo-Christian ethics are seldom discussed. To explore the relationship between religion and climate in Asian contexts, this research will focus on Taiwan, a multicultural country with various religions.

Using the sample data from the 2020 Taiwan Social Change Survey, this study aims to explore the relationship between religion and climate by conducting factor analysis and ordinary least squares regressions.

The evidence reveals a weak connection between religions and people's climate attitudes in Taiwan. Among all the religions in Taiwan, Buddhists and Christians tend to have the most eco-friendly attitudes. The social networks within these two religious communities foster an eco-friendly atmosphere, which highlights the importance of environmental conservation. However, when it comes to peoples’ willingness to pay, faith holders are less likely to show their supports.

By illustrating the religion-climate relationship in Taiwan, this study demonstrates how these two fields intersect in a non-Western society. It also provides implications for how religions can inspire people's willingness to engage in environmental conservation efforts.

How to cite: Tsui, C. H.: Do religions matter? The empirical study of the religion-climate relation in Taiwan, EGU General Assembly 2024, Vienna, Austria, 14–19 Apr 2024, EGU24-14027, https://doi.org/10.5194/egusphere-egu24-14027, 2024.

EGU24-14752 | Posters on site | EOS4.4

Towards sustainable management of georesources: the importance of Cooperation Projects to boost education on responsible and sustainable mining. The example of the SUGERE and GEODES projects. 

Giovanna Antonella Dino, Susanna Mancini, Dolores Pereira, Manuela Lasagna, Francesca Gambino, Guido Prego, Domingos Gonçalves, Aida Jacinto, Daud Jamal, Josè Loite, Hélio Nganhane, Nelson Rodrigues, and Pedro Dinis

Sustainable and responsible management of geo-resources requires a rethinking and redesign of our production and consumption patterns. Awareness of the natural environment as a common good to be preserved, and knowledge of the close link between the natural environment and the socio-economic system are prerequisites for a profound change in human attitudes at both individual and societal levels. In this context, training and education of all actors involved in the management of geo-resources is an indispensable starting point for the acquisition of critical, ethical, and conscious thinking and the technical skills necessary to solve local problems and initiate sustainable development.

The present research focuses on two consequential ERASMUS+ projects: SUGERE and GEODES. Both had the common goal of the international standardization of Higher Education training and teaching in Earth Sciences and Mining Engineering.

SUGERE (Sustainable Sustainability and Wise Use of Geological Resources) was successfully completed in September 2023, involved 3 European universities (from Portugal, Spain, and Italy) and 6 non-European universities (from Mozambique, Cape Verde, and Angola). The objective was to enhance capacity building for the responsible and sustainable use of geological resources by supporting the didactic organization and standardization of 5 degree courses at Bachelor, Master and Doctorate levels in Earth Sciences and Mining Engineering. Both online and face-to-face training sessions were organized in European and African universities.

GEODES, started in June 2023, represents the continuation of the SUGERE project and involves a total of 9 partners. The same 3 European universities and 6 African institutions, formally attributing teaching and training roles to 2 universities that participated in SUGERE, already achieved a good standard in terms of infrastructures and have long teaching experience in the field of geosciences, and receiving 4 young institutions from less favored regions of Angola and Mozambique.

SUGERE and GEODES projects aim to strengthen the role of geosciences in the development of up-to-date strategies for the sustainable management of natural resources and to implement new collaborations thanks to an international network focused on local economic and social development and respect for the natural environment in the geological-mining context. The culture of sustainability and the deepening of skills in the field of geological mining form the basis for the development of the critical thinking necessary for local problem solving, the acquisition of ethical values and the technical skills that underpin sustainable development.

Deepening technical skills in geomining from a sustainable perspective is crucial for developing critical thinking and acquiring ethical values necessary for solving local problems. SUGERE and GEODES contribute to this outcome with a solid network of research, training, sharing and exchange of expertise and research activities between European and non-European universities interested in mining issues. A careful analysis of the local economic development of the countries involved in the projects is required to achieve the most effective methods for the exploration and sustainable exploitation of underground georesources.


How to cite: Dino, G. A., Mancini, S., Pereira, D., Lasagna, M., Gambino, F., Prego, G., Gonçalves, D., Jacinto, A., Jamal, D., Loite, J., Nganhane, H., Rodrigues, N., and Dinis, P.: Towards sustainable management of georesources: the importance of Cooperation Projects to boost education on responsible and sustainable mining. The example of the SUGERE and GEODES projects., EGU General Assembly 2024, Vienna, Austria, 14–19 Apr 2024, EGU24-14752, https://doi.org/10.5194/egusphere-egu24-14752, 2024.

Since time immemorial, nature, and by extension the ocean, have made positive contributions to the health of mankind. Whether it be fertile soil, pollination, medicine, taking part in mindfulness activities, or food, we as a species depend on the many services provided by the natural world.  Our environment can be linked to some fundamental determinants of health, such as clean air, clean water, and balanced nutrition, and emotional wellbeing.  Therefore, any environmental degradation as a result of climate change has undeniable tangible and intangible effects on human health all over the globe, and this is especially true in relation to mental health in populations occupying Large Ocean Island States (LOIS).   As climate change has led to an increase in extreme weather events, and the accompanying devastation, there has been a corresponding decrease in health and quality of life.  This presentation will explore how the impact of climate change and its corresponding impact on the ocean has enduring impacts, both physiologically and mentally.   Therefore, all of the processes and recommendations to combat climate
change will have important co-benefits to mental and physical health, and help to build resilience in the face of the dearth of resources faced by LOIS. This lack of resources must be urgently addressed, and solutions can be explored by fostering collaboration between mental health professionals and climate scientists to collect sufficient data. The resulting findings can be used to expedite access to the funds needed to implement the necessary levels of mitigation and adaptation specifically tailored to the infrastructural realities of LOIS.

How to cite: Alvarez de la Campa, S.: Climate Change, Ocean Health and Quality of Life - An Inextricable Connection in Large Ocean Island States, EGU General Assembly 2024, Vienna, Austria, 14–19 Apr 2024, EGU24-16730, https://doi.org/10.5194/egusphere-egu24-16730, 2024.

EGU24-17346 | Posters on site | EOS4.4

The importance of making geoethics a central concern of Sri Lankan education strategy 

Giuseppe Di Capua and Udaya Gunawardana

Like numerous regions worldwide, Sri Lanka faces significant environmental challenges that endanger its biodiversity, natural resources, and the well-being of its population. Predominant issues encompass water and air pollution, land degradation, deforestation, improper waste disposal, consequences of climate change, disaster risks, as well as the loss of biodiversity and geodiversity. The nexus between political, economic, and social factors contributes to these geo-environmental challenges, often exacerbated by the politicization of the environmental issues in Sri Lanka. However, it is crucial to acknowledge that human activities primarily drive these conditions. Gunnar Myrdal’s Soft State theory asserts that despite the existence of multiple governing bodies, regulations, and laws, humans strategically transcend the environment leading to the depletion of geo-environmental resources within a context of strong societal inequalities, particularly in developing countries influenced by the historical conditioning of colonial interests by developed nations. A philosophical exploration of this issue emphasizes the pivotal role of human indifference towards the environment and natural resources in causing these challenges. To address this issue effectively, a transformation in people's attitudes is imperative, and education emerges as the most potent tool for this purpose. However, a careful analysis of Sri Lanka's primary and secondary school curricula reveals an absence of a dedicated discipline addressing the philosophical and social dimensions of the geo-environmental matter. In light of this, the incorporation of subjects such as geoethics, which specifically addresses the ethical problems in the human-environment interaction, becomes paramount. Integrating geoethics into the educational framework, particularly at primary and secondary levels, stands as the foundation of a sustainable and responsible strategic approach to many societal and environmental problems. This educational strategy should envision as the most important solution to mitigate the majority of geo-environmental problems in Sri Lanka, fostering environmentally sensitive and responsible citizens.

How to cite: Di Capua, G. and Gunawardana, U.: The importance of making geoethics a central concern of Sri Lankan education strategy, EGU General Assembly 2024, Vienna, Austria, 14–19 Apr 2024, EGU24-17346, https://doi.org/10.5194/egusphere-egu24-17346, 2024.

EGU24-17614 | Orals | EOS4.4

Choice Question (MCQ) Peer Construction for Training Students as Climate Change decision-makers or Knowledge Spreaders 

Gérard Vidal, Charles-Henri Eyraud, Carole Larose, and Éric Lejan

After more than 40 years of reasoned alerts from the scientific community directed towards society, with minimal impact, a recent surge in the size and frequency of extraordinary climatic events has begun to reshape the perspectives of ordinary citizens. This situation underscores the challenge of directly influencing society with scientific evidence or models, emphasizing the crucial role of universities in training students who will occupy intermediate or elevated positions that may impact society at large.

While "Climate Fresk" has gained widespread popularity in higher education institutions as an effective tool for raising awareness about climate change and the intricate processes affecting our global earth ecosystem, concerns have arisen at the university level. The repetition of "Climate Fresk" or similar tools may be perceived as greenwashing practices, as university students are already well-acquainted with the issue. Hence, there is a need to surpass mere awareness in higher education.

As TASK Change Leaders at ENS-Lyon, we explored pedagogical and assessment tools provided by Sulitest. This initiative, extends beyond climate and ocean changes, it places a significant emphasis on various topics, including Sustainable Development Goals, earth limits, and driving processes of climate change. One of the major interest of the approach is to address all disciplines (scientific or non scientific).

We built a three-step strategy involving:

  • Administering a positioning test to enable students to assess their performance relative to the institution and the wider community.

  • Utilizing the looping tool from Sulitest, wherein small teams of students generate Multiple Choice Questions accompanied by a list of academic publications validating the terms of their questions. Subsequently, these questions are discussed in large interdisciplinary open groups, compelling students to articulate questions and answers intelligible across all disciplines.

  • Participating in the TASK to receive an assessment of their proficiency in sustainable development, evaluated by an external body.

This strategy, particularly the second step, empowers students to assume the role of a teacher or knowledge spreader in the face of a diverse peer community. It serves as a simulation of their potential future roles as educators, knowledge spreaders or decision-makers, instilling an understanding of the importance of providing validated sources and the challenges associated with crafting questions and answers comprehensible to all, preparing them for future teaching or decision-making scenarios. A notable byproduct is the creation of valuable pedagogical resources in a "connectivist MOOC flavor."

Beyond the training benefits, membership in the TASK Change Leaders group provides opportunities for discussions on the sustainability of education, green education, and competency frameworks, to apply to ourselves the concepts we are teaching.

How to cite: Vidal, G., Eyraud, C.-H., Larose, C., and Lejan, É.: Choice Question (MCQ) Peer Construction for Training Students as Climate Change decision-makers or Knowledge Spreaders, EGU General Assembly 2024, Vienna, Austria, 14–19 Apr 2024, EGU24-17614, https://doi.org/10.5194/egusphere-egu24-17614, 2024.

EGU24-20953 | Posters on site | EOS4.4

Shaping Thriving Ocean Futures – Education to advance healthy coastal communities and marine systems 

Susanne Neuer, Stephanie Pfirman, Roberta Martin, Katie Kamelamela, Amy Maas, Andrew Peters, and Nick Bates

The new Ocean Futures program at Arizona State University (Tempe, AZ, USA) prepares students to become coastal and marine stewards, community leaders, innovators, and researchers capable of shaping the future of the world's oceans.  The program is taught and mentored by faculty and community leaders in an environment that supports our students’ individual and collaborative strengths, creativity, and diversity.  Students learn and work across disciplines, exploring global and local ocean dynamics, ecosystems, and stressors, engaging with community contexts and livelihoods, and advancing culturally-appropriate, reciprocal stewardship.  In support of ASUʻs mission of embeddedness and linking innovation to public value, graduates of the School of Ocean Futures are equipped with the knowledge and skills to work with diverse communities and partners to create innovative solutions for our changing world.

The School of Ocean Futures educational goal is to build student capacity to apply knowledge of coastal and marine systems coupled with community partnerships to help shape thriving futures, both locally and globally.  Students engage in research and work with partners in Arizona, the Bermuda Institute of Ocean Sciences (BIOS) in Bermuda, the Center of Global Discovery and Conservation Science in Hilo, Hawaii, the Sea of Cortez, and Antarctica.

Ocean Futures education at ASU is based on an innovative “cascade” curriculum.  The cascade starts with core classes in Introduction to Ocean Futures and Ocean Communities, followed by foundational courses in sciences and mathematics, an upper-level core class in Oceanography, electives focused on partnerships, stewardship, and advanced problem-solving, and culminates in an applied workshop and capstone course where students work with partners to transfer knowledge to action in addressing problems facing coastal communities and marine systems.

How to cite: Neuer, S., Pfirman, S., Martin, R., Kamelamela, K., Maas, A., Peters, A., and Bates, N.: Shaping Thriving Ocean Futures – Education to advance healthy coastal communities and marine systems, EGU General Assembly 2024, Vienna, Austria, 14–19 Apr 2024, EGU24-20953, https://doi.org/10.5194/egusphere-egu24-20953, 2024.

This ongoing project integrates the concept of science diplomacy, conducting an in-depth exploration of the intricate interrelations among geo-bio-cultural diversity and its pivotal role in peace building, risk management, and climate action in Colombian cities and territories. Leveraging geodiversity assessment and its correlation with biodiversity, we explore how the bio-geo duplex interacts with ethnic diversity in Colombia. The aim is to develop initiatives aligned with the ancestral knowledge of indigenous, African-descended, farmers, and mixed-Colombian communities across cities and territories withing the geoethics concept.
In the realm of science diplomacy, our emphasis lies in cultivating international collaboration and knowledge exchange to tackle intricate societal challenges. We seek to foster dialogue and cooperation among traditional and nontraditional actors, advocating for the integration of scientific expertise with local and indigenous knowledge. The study provides a comprehensive analysis, considering historical, environmental, economic, social, and political contexts. It sheds light on how these interactions unfold and their diverse representations across Colombia, including the Caribbean, Pacific, and Andean regions.

How to cite: Marin-Ceron, M. I.: Science Diplomacy with Nontraditional Actors: Enhancing Geo-Bio-Cultural Diversity in Colombian Cities and Territories, EGU General Assembly 2024, Vienna, Austria, 14–19 Apr 2024, EGU24-22117, https://doi.org/10.5194/egusphere-egu24-22117, 2024.

EGU24-7931 | Orals | ESSI4.4 | Highlight

Advancing Open Data Portals: Learnings from the EPOS Open-Source Solution 

Valerio Vinciarelli, Rossana Paciello, Daniele Bailo, Claudio Goffi, Daniel Warren, Janusz Lavrnja-Czapski, Christopher Card, Philip Atkinson, Wayne Shelley, Jean-Baptiste Roquencourt, Yann Retout, Helen Glaves, Kety Giuliacci, Jan Michalek, Jakob Molander, Harald Nedrebø, Otto Lange, Carmela Freda, Kauzar Saleh-Contell, and Manuela Sbarra

The European Plate Observing System (EPOS), established as a European Research Infrastructure Consortium (ERIC) in 2018, stands as a significant milestone in pan-European research infrastructures, focusing on solid Earth science. The EPOS Data Portal, officially launched in April 2023, is the place where FAIR principles and practices are implemented thanks to the adoption of a co-development approach and  harmonization of actions across communities of scientists, developers, data providers, and users. The EPOS Data Portal currently provides access to data and products from 10 different disciplines: Seismology, Near-Fault Observatories, GNSS Data and Products, Volcano Observations, Satellite Data, Geomagnetic Observations, Anthropogenic Hazards, Geological Information and Modeling, Multi-Scale Laboratories, and Tsunami.

The EPOS Data Portal is based on a user-friendly user interface which provides intuitive visualization methods and interaction modes that significantly simplifies and facilitates the discovery and the access to the geoscientific community assets. Through the portal, users can: i) Perform data searches by combining a set of criteria; ii) Navigate and visualize the retrieved search results in different ways; iii) Fine-tune results using facets and advanced filters; iv) Download selected results or store them in a favorites list.

The underlying system of the Data Portal has been crafted using a blend of open-source technologies, including Java, RabbitMQ, Python, and others. We implemented a modular architecture based on the microservices paradigm, facilitating seamless integration of new data and services through dedicated software interfaces. The source code, collaboratively developed by scientists and IT experts, is now available under a GPL license (https://epos-eu.github.io/epos-open-source/) along with a comprehensive developer’s guide.


In this contribution, we demonstrate the potential impact of our open-source solution in advancing visualizations, interfaces, and best practices within the context of multidisciplinary research. Furthermore, we present how other research infrastructures, projects and initiatives can benefit from the shared knowledge and expertise, accelerating the development of robust and advanced Earth science data portals.

How to cite: Vinciarelli, V., Paciello, R., Bailo, D., Goffi, C., Warren, D., Lavrnja-Czapski, J., Card, C., Atkinson, P., Shelley, W., Roquencourt, J.-B., Retout, Y., Glaves, H., Giuliacci, K., Michalek, J., Molander, J., Nedrebø, H., Lange, O., Freda, C., Saleh-Contell, K., and Sbarra, M.: Advancing Open Data Portals: Learnings from the EPOS Open-Source Solution, EGU General Assembly 2024, Vienna, Austria, 14–19 Apr 2024, EGU24-7931, https://doi.org/10.5194/egusphere-egu24-7931, 2024.

EGU24-11327 | ECS | Orals | ESSI4.4

EOmaps: An open-source python package for geographic data visualization and analysis. 

Raphael Quast and Wolfgang Wagner

EOmaps is a free and open-source python package specifically tailored for geographic data visualization and analysis.

The main goals of the package are twofold:

  • Speed up and simplify the daily struggle of geographic data visualization
  • Directly use the figures as fully customisable interactive data-analysis widgets

EOmaps is built on top of matplotlib and cartopy and integrates well with the scientific python infrastructure (numpy, pandas, xarray, geopandas, datashader, etc.). It provides a flexible and well-documented API to create publication-ready figures and it can be used to visualize (potentially large) structured (e.g. raster) or unstructured (e.g. unordered lists) datasets provided in arbitrary projections. 

In addition, EOmaps comes with many useful features to help with scientific geo-data analysis:

  • Maps can have multiple layers to interactively compare and (transparently) overlay datasets, web-maps etc.
  • Once a dataset is plotted, you can assign arbitrary callback functions to interactively run your analysis-workflow on selected datapoints (e.g. load data from a database, plot underlying timeseries, histograms etc.)

Figures created with EOmaps can be exported as images (png, jpeg, ...), vector-graphics (svg) or embedded in Jupyter Notebooks, web-pages (html) or in GUI frameworks such as Qt or tkinter.

In this presentation we will highlight the capabilities of EOmaps and show how it can be used in a variety of different situations to aid your scientific data analysis workflow.

EOmaps source-code: https://github.com/raphaelquast/EOmaps  
EOmaps documentation: https://eomaps.readthedocs.io/

How to cite: Quast, R. and Wagner, W.: EOmaps: An open-source python package for geographic data visualization and analysis., EGU General Assembly 2024, Vienna, Austria, 14–19 Apr 2024, EGU24-11327, https://doi.org/10.5194/egusphere-egu24-11327, 2024.

EGU24-11805 | Posters on site | ESSI4.4

Next-Gen Zarr Web Map Visualization 

Aimee Barciauskas, Max Jones, Kata Martin, Sean Harkins, and Vincent Sarago

Visualization of Earth science data is crucial for its exploration and understanding. Web browsers, as a universal platform, face the challenge of rendering complex geospatial data swiftly. This led to the creation of pre-generated static map tiles, allowing quick visualization but limiting user control over data representation and imposing storage and update burdens on providers.

While pregenerated map tiles make it possible to visualize data quickly, there are drawbacks. The most significant is the data provider chooses how the data will appear. The user has no power to adjust the visualization, such as modifying the color scale, color map or perform “band math” where multiple variables are combined to produce a new variable. Other drawbacks impact the data provider, such as storage costs and maintaining a pipeline to constantly update or reprocess the tile storage with new and updated data. Next generation approaches give that power to the user, while still giving providers control over the costs.

More recent years have seen the success of the dynamic tiling approach which allows for on-demand map tile creation. This approach has traditionally relied on Cloud-Optimized GeoTIFFs (COGs). When Zarr gained popularity for large-scale n-dimensional data analysis, users started to call for browser-based visualization, but no tools existed to visualize Zarr in the browser.

Now there are 2 options: a dynamic tile server and a dynamic client approach. rio_tiler’s XarrayReader supports tile rendering from anything that is xarray-readable. This means a tile server can render tiles from Zarr stores as well as netCDF4/HDF5 and other formats. However, a tile server still requires running a server while the second option, a “dynamic client”, reads Zarr directly in the browser client and uses WebGL to render map tiles.

The authors have contributed to libraries and testing of both approaches and authored a “Zarr Visualization Report”. This report includes the tradeoffs, requirements for preprocessing the data and performance testing results for when those preprocessing steps were taken or not. We hope that readers will be able to reuse lessons learned and recommendations to deliver their Zarr data to users in web browsers and contribute to the wider adoption of this format for large scale environmental data understanding.

Looking ahead, the focus is on making NASA datasets more accessible through these innovative approaches. The use of Kerchunk reference files, or virtual Zarr datasets, will play a key role in indexing various archival file formats used by NASA, such as HDF5 and NetCDF4. With the capability of titiler-xarray to handle any xarray-readable data, a wide range of NASA datasets can be visualized without the need for duplicating data. Additionally, the creation of data pyramids will further enhance visualization speed at lower resolutions.

How to cite: Barciauskas, A., Jones, M., Martin, K., Harkins, S., and Sarago, V.: Next-Gen Zarr Web Map Visualization, EGU General Assembly 2024, Vienna, Austria, 14–19 Apr 2024, EGU24-11805, https://doi.org/10.5194/egusphere-egu24-11805, 2024.

EGU24-14629 | ECS | Orals | ESSI4.4

Co-designing an interactive tool to communicate the uncertainty of urban air quality models: uncertAIR 

Cristina Carnerero, Jan Mateu Armengol, Alvaro Criado, Antonia Frangeskou, Diana Urquiza, Dragana Bojovic, and Albert Soret

According to the World Health Organization, air pollution is the main environmental threat to public health. Urban environments are particularly critical due to their high-density population centers with often poor air quality. To characterize the exposure of citizens, the use of numerical models corrected with observational data has become a fundamental tool. Despite recent efforts, bias-corrected air quality models at the street scale exhibit significant uncertainty, partly due to the limited number of traffic and air quality observations.

Model uncertainty can critically increase far from measurement points and in regions with characteristics different from those used for calibration. In such locations, modeled data should be interpreted with caution. When the street-scale air quality models are intended to inform policy makers, estimating uncertainty is highly valuable to support decision-making protocols. A simpler air quality model with an estimation of the spatial uncertainty distribution may be preferred over a very sophisticated model that does not give any notion of uncertainty.

Within this context, we aimed at co-designing and co-developing an interactive tool to report the uncertainty of urban air quality simulations, disseminating the results tailored to the users’ needs.

The methodology consists of a geostatistical post-processing of the raw simulations of NO2 concentrations of the CALIOPE-urban air quality model in the city of Barcelona. The methodology is replicable to other cities and pollutants. The uncertainty estimation is based on the error variance of the Universal Kriging technique, which can be subsequently used to produce hourly maps of the probability of exceeding a certain threshold. Additionally, relevant social-ecological-technological variables were identified to explore the interconnections among different types of data, as well as broadening the social impact of this project. For instance, locations associated with vulnerable citizens (e.g., schools and nursing homes), or other variables potentially linked with air quality (e.g., public parks and green spaces). 

A user-centric approach was adopted, involving policymakers from local administrations, urban planners from private companies, environmental social agents and scientific personnel from research institutions and universities. To get a deep understanding of how uncertainty maps can add value to users’ objectives, we conducted a series of individual interviews and a co-design workshop based on design thinking, which allowed for the co-design of the interactive platform. The prototype of the interactive platform was presented in a second workshop, where the users tested the prototype and provided input to further developing the final tool.

The final product is the uncertAIR platform, an open-source interactive tool that integrates modeled NO2 concentrations, their uncertainty and probability of exceedances of legal thresholds, together with  social-ecological-technological variables at different scales of time and spatial resolution. Data can be visualized and downloaded with a temporal resolution of annual or daily averages, and a spatial resolution of 20 m or aggregated at census areas. This integrated dataset serves as the foundational step to integrate uncertainty information on future air quality policy making in Barcelona, such as health impact assessments, official communications, campaign planning, and location optimization of new monitoring stations.

How to cite: Carnerero, C., Mateu Armengol, J., Criado, A., Frangeskou, A., Urquiza, D., Bojovic, D., and Soret, A.: Co-designing an interactive tool to communicate the uncertainty of urban air quality models: uncertAIR, EGU General Assembly 2024, Vienna, Austria, 14–19 Apr 2024, EGU24-14629, https://doi.org/10.5194/egusphere-egu24-14629, 2024.

EGU24-16316 | Posters on site | ESSI4.4

MicroWave Expertise center : a work environment for microwave data exploration 

Marie-Laure Frery, Mathilde Siméon, Roger Fjortoft, Sébastien Charlois, Mélanie Prugniaux, and Matthias Raynal

The MicroWave Expertise center has first been developed to provide a  work environment to support the calibration/validations activities and address the high resolution of Surface Water Ocean Topography (SWOT) mission, launched on December 16th, 2022.  Onboard, the new instrument ‘KaRIn’, is a revolution for both oceanography and hydrology communities and gives access to small scale measurements over ocean, worldwide river heights and flows, and lake heights.

With optimized storage and computation methods, the MicroWave Expertise Center is designed to ease the exploration and studies of 16TB/day products. The tools developed for SWOT are generic and can now be applied to any altimetric mission.

Experts are provided simple and scriptable explore numerous data providers such as copernicus dias, ecmwf, hydroweb.next.

Some tutorials are already available along with visualisation tools. And the list will be growing up in close future from users requirements.

The expertise center is operational and ensure SWOT calval activities. Prospects address SWOT ocean and hydrology studies but could be enlarged to  hydrological research, multi-sensor comparison

How to cite: Frery, M.-L., Siméon, M., Fjortoft, R., Charlois, S., Prugniaux, M., and Raynal, M.: MicroWave Expertise center : a work environment for microwave data exploration, EGU General Assembly 2024, Vienna, Austria, 14–19 Apr 2024, EGU24-16316, https://doi.org/10.5194/egusphere-egu24-16316, 2024.

EGU24-16475 | Orals | ESSI4.4

NASA's FIRMS: Enabling the Use of Earth System Science Data for Wildfire Management 

Otmar Olsina, Jennifer Hewson, Diane Davies, Asen Radov, Brad Quayle, Louis Giglio, and Joanne Hall

NASA’s Fire Information for Resource Management System (FIRMS) enables users to find and analyze a range of earth system science data and information relevant to the complex and evolving field of wildfire management, impacts, and mitigation. FIRMS facilitates the use of earth system science data to inform science-based decision making through a standardized, readily interpretable interface that supports operational users, researchers, and non-scientific stakeholders. This community-driven interface enables user-friendly exploration of data that are increasingly findable, accessible, interoperable, and reproducible (FAIR), and the interface is regularly refined to support the diversity, equity, and inclusion of potential end-users. FIRMS offers fire-based maps through Web Map Service (WMS) and Web Feature Service (WFS), and makes available multiple APIs to support area, country, fire footprint features for stakeholders needing to ingest data into software such as QGIS, ArcGIS, etc. FIRMS developers are also creating a Fire Data Academy to build capacity around the use of Jupyter notebooks, Google Colab, and Python to perform data ingest, manipulation, and visualization. As the impacts of wildfires expand, affecting increasing swaths of population and biodiversity through immediate infrastructure and habitat destruction, and causing longer-term air quality impacts, a transdisciplinary approach to research and response is required. FIRMS supports a transdisciplinary approach through the range of data and information available, ensuring that all users, including those in historically underrepresented communities, can access wildfire data.

How to cite: Olsina, O., Hewson, J., Davies, D., Radov, A., Quayle, B., Giglio, L., and Hall, J.: NASA's FIRMS: Enabling the Use of Earth System Science Data for Wildfire Management, EGU General Assembly 2024, Vienna, Austria, 14–19 Apr 2024, EGU24-16475, https://doi.org/10.5194/egusphere-egu24-16475, 2024.

EGU24-17568 | Posters on site | ESSI4.4

Community based services providing Open Science in water management worldwide 

Frida Gyllensvärd and Berit Arheimer

Water is the basis for life and ultimately the reason why our society could develop the way it did, and thus, water security is an indirect core component in all 17 UN sustainable development goals. However, scientific water data and information are rarely accessible in an easy and understandable way for managers and policy makers. Moreover, hydrological sciences are fragmented with less tradition of sharing results, data and tools between scientists than in many other disciplines. Numerous efforts from development projects have launched prototypes and demonstrators of web-based applications to overcome these issues, but without long-term maintenance most of them disappear at project end. Here we will present experience from developing, maintaining and using three non-commercial operational services to facilitate actions in water security and promote scientific engagement with stakeholders.


https://hypeweb.smhi.se/ provides readily available modelled hydrological data for continent or global scale at sub-catchment resolution of on average 1000 km2 (Arheimer et al., 2020), along with open source code with documentation and data compilation/visualization/training tools. The visitor can explore data for the past, present or future, download the numerical model, or order data subscriptions. The service also provides tutorials, model documentation and training material for model setup. The website is linked to an annual open (free) training course in HYPE modelling for various societal needs.


https://climateinformation.org/ is co-designed with sectorial users in low- and middle-income countries, on behalf of the World Meteorological Organisation (WMO) and the Green Climate Fund (GCF). It offers guidance for non-climate experts and access to two different tools to explore climate-change impact on water resources: 1) instant summary reports of climate change for any site on the globe, 2) easy access to many pre-calculated climate indicators. The main purpose of this new service is to provide scientific data to argue for climate mitigation and adaptation investments in vulnerable countries (Photiadou et al., 2021). Pre-calculated water variables are based on an extensive production chain using global model ensembles from global modelling communities, e.g. CMIP, Cordex, WWH and a rigorous quality assurance protocol.


https://dwg.smhi.se/dwg/ is co-designed with the community of the International Association of Hydrological Sciences (IAHS). It is a brand-new platform to search and find (based on key-words) where on Earth there are: scientific results available from research projects (case-studies), monitoring programs (data repositories), publications (in HSJ, PIAHS) and researchers (personal profiles). The aim is to stimulate and facilitate engagement, interactions and dialogues among scientists and between scientists and stakeholders. The Digital Water Globe offers co-creation and re-examines the role of scientific outreach; it is a scientific community effort completely dependent on content from the users to explore networking and science communication in action.


The presentation will focus on obtained feedback, opportunities and challenges in running operational services with aim to share scientific data and tools with a wide range of users.


Reference:

Arheimer et al., 2020: Global catchment modelling using World-Wide HYPE (WWH), open data and stepwise parameter estimation, HESS 24, 535–559, https://doi.org/10.5194/hess-24-535-2020   

Photiadou et al. 2021. Designing a climate service for planning climate actions in vulnerable countries. Atmosphere 12:121. https://doi.org/10.3390/atmos12010121 

How to cite: Gyllensvärd, F. and Arheimer, B.: Community based services providing Open Science in water management worldwide, EGU General Assembly 2024, Vienna, Austria, 14–19 Apr 2024, EGU24-17568, https://doi.org/10.5194/egusphere-egu24-17568, 2024.

EGU24-18613 | Orals | ESSI4.4

How to benefit from multi-sensor synergy using open Ocean Virtual Laboratory tools 

Lucile Gaultier, Fabrice Collard, Craig Donlon, Ziad El Khoury Hanna, Sylvain Herlédan, and Guillaume Le Seach

In the past decade, the emergence of new satellites and sensors has facilitated the observation of a diverse range of oceanic physical variables across various scales. For instance, the Sentinel 1-2-3-6 program encompasses sensors like SAR, Ocean Color, Temperature brightness, or altimeter, each with an individual long revisit time but a rapid revisit from a constellation perspective. Additionally, geostationary sensors such as SEVIRI contribute by providing Infra Red SST every hour, significantly enhancing coverage in cloudy areas. These variables contain crucial information about the ocean's state.

Despite the wealth of data, discovering, collocating, and analyzing a heterogeneous dataset can be challenging and act as a barrier for potential users wishing to leverage Earth Observation (EO) data. Accessing low-level data and preparing them for analysis requires a diverse set of skills. Addressing this challenge, the Ocean Virtual Laboratory Next Generation (OVL-NG) project has developed two tools, which will be introduced.

Firstly, online data visualization websites, such as https://ovl.oceandatalab.com, have been made publicly accessible. These platforms empower users to explore various satellite, in-situ, and model data with just a few clicks. Users can navigate through time and space, easily compare hundreds of products (some in Near Real-Time), and utilize drawing and annotation features. The OVL web portal also facilitates sharing interesting cases with fellow scientists and communicating about captivating oceanic structures.

Secondly, a complementary tool named SEAScope offers additional features for analyzing pre-processed data and user-generated data. SEAScope is a free and open-source standalone application compatible with Windows, Linux, and macOS. It allows users to collocate data in time and space, rendering them on a 3D globe. Users can adjust rendering settings on the fly, extract data over a specific area or transect, and interface with external applications like Jupyter notebooks. This functionality enables users to extract data on a shared grid, analyze them, and import the results back into SEAScope for visualization alongside the input data.

                                         The OVL-NG tools will be showcased at the OceanDataLab booth


How to cite: Gaultier, L., Collard, F., Donlon, C., El Khoury Hanna, Z., Herlédan, S., and Le Seach, G.: How to benefit from multi-sensor synergy using open Ocean Virtual Laboratory tools, EGU General Assembly 2024, Vienna, Austria, 14–19 Apr 2024, EGU24-18613, https://doi.org/10.5194/egusphere-egu24-18613, 2024.

EGU24-19105 | ECS | Posters on site | ESSI4.4

3D Digital Twins of the Ocean: towards an intuitive and realistic visualization of wave parameters 

Gerard Llorach-Tó, Enoc Martínez, Joaquín Del-Río, Gonzalo Simarro, Martino Pani, Andrea Bucchi, Ya Huang, and Emilio García-Ladona

Understanding and picturing the state of the sea surface according to wave parameters can be difficult for non-expert users. 3D digital twins of the ocean, i.e., realistic virtual copies of the sea state with live updates, can provide user-friendly visualizations. An animated visual representation offers users a more tangible reference to the actual sea state in the field than conventional swell and wind forecasts. Our work presents an interactive web-based open-source visualization of wave data in a 3D realistic environment. The wave data used is provided by a forecast model, CMEMS [1], and the in-situ observation platform OBSEA [2]. Both of these data products provide an open access API that can be accessed via the browser, following the FAIR principles. The challenge of this work is to translate the wave parameters of the data products into a real-time computer graphics simulation representing the real sea state. Different data products provide different parameters, for example, CMEMS forecast model computes wave significant height, wave period, and direction for ‘sea surface wave’, ‘wind wave’, ‘swell 1’, and ‘swell 2’, whereas OBSEA measures wave properties with an acoustic doppler wave array such as ‘Hm0’, ‘H1/10’, ‘H1/3’, and ‘directional spread’. We will discuss algorithms based on empirical observations to generate the virtual sea state from a selection of wave parameters. Subsequently both quantitative and qualitative metrics based on observations will be used to compare between the 3D digital twin and the real sea state. Preliminary results of the digital twin can be found at https://icatmar.github.io/CasablancaBuoy/ and https://cgi-dto.github.io/OBSEA/. 


[1] Korres, G., Oikonomou, C., Denaxa, D., & Sotiropoulou, M. (2023). Mediterranean Sea Waves Analysis and Forecast (Copernicus Marine Service MED-Waves, MEDWAΜ4 system) (Version 1) [Data set]. Copernicus Marine Service (CMS). DOI: 10.25423/CMCC/MEDSEA_ANALYSISFORECAST_WAV_006_017_MEDWAM4

[2] Del Rio, J. [et al.]. Obsea: a decadal balance for a cabled observatory deployment. "IEEE access", 13 Febrer 2020, vol. 8, p. 33163-33177.

How to cite: Llorach-Tó, G., Martínez, E., Del-Río, J., Simarro, G., Pani, M., Bucchi, A., Huang, Y., and García-Ladona, E.: 3D Digital Twins of the Ocean: towards an intuitive and realistic visualization of wave parameters, EGU General Assembly 2024, Vienna, Austria, 14–19 Apr 2024, EGU24-19105, https://doi.org/10.5194/egusphere-egu24-19105, 2024.

EGU24-21547 | ECS | Orals | ESSI4.4

Lexcube for Jupyter: Interactive Earth System Data Cube Visualization in Jupyter Notebooks 

Maximilian Söchting, Miguel D. Mahecha, David Montero Loaiza, and Gerik Scheuermann

Data streams representing the Earth system both through modeling and remote sensing approaches, encompass a diverse range and massive amount of information. Unveiling insights at global and local scales becomes increasingly challenging for the wider public and the broader scientific audience as the temporal and spatial resolutions of data sets continually improve. An effective solution to this involves the development of fully interactive visualizations capable of rendering terabytes of data in real-time, spanning time, space, variables, and model variants. Lexcube.org, the Leipzig Explorer of Earth Data Cubes, was the first tool that allowed to explore and interact with large Earth system data sets in the form of an interactive data cube visualization in the web browser, but was limited to a few preset data sets.

Here we present Lexcube for Jupyter, a Jupyter notebook extension building on top of the existing Lexcube.org software components, that allows to visualize any spatiotemporal or otherwise three-dimensional data as an interactive 3D data cube. The data cube visualization treats all three dimensions equally and, e.g., in the case of a spatiotemporal data cube, allows to inspect temporal patterns in a novel way. Interaction with the data cube is designed to be intuitive, also allowing touch gestures on touch-capable devices. Building on top of the powerful open-source libraries Xarray and Numpy, Lexcube for Juypter integrates effortlessly into the existing ecosystem of open-source data cube software components as it is able to visualize any gridded data set from those libraries, including remotely stored and chunked data sets. Furthermore, Lexcube for Jupyter allows to export the currently visible data cube as a new Xarray or Numpy object, allowing scientists to use Lexcube in their workflow for data selection and curation. In addition, new disciplines such as the atmospheric sciences may profit from Lexcube for Juypter as they can now visualize their own three-dimensional data that is not necessarily spatiotemporal, e.g., three-dimensional atmospheric humidity data cubes (latitude×longitude×pressure level) as seen on lexcube.org. Lexcube for Jupyter is open-source and available on GitHub and PyPi since January 2024.

How to cite: Söchting, M., Mahecha, M. D., Montero Loaiza, D., and Scheuermann, G.: Lexcube for Jupyter: Interactive Earth System Data Cube Visualization in Jupyter Notebooks, EGU General Assembly 2024, Vienna, Austria, 14–19 Apr 2024, EGU24-21547, https://doi.org/10.5194/egusphere-egu24-21547, 2024.

EGU24-22039 | Orals | ESSI4.4

The East Africa Hazards Watch - Meeting the growing need of risk Information due to increasing climate extremes 

Erick Otenyo, Abubakr Salih Babiker, Marta Baraibar, and Viola Otieno

The East Africa Hazards Watch is an online web platform that supports tracking extreme events such as drought, cyclones, pests (desert locust), heavy rainfall, floods or crop failures, which are increasing in frequency and intensity due to climate change in East Africa.

About 90% of the disasters in East Africa are due to weather, climate hazards, leaving the region to be one of the most vulnerable to extreme events. Considering the high dependency of the economic systems in the region on natural resources, the impacts of weather and climate extremes have far-reaching socioeconomic consequences. To protect the population against these hazards and to support the resilience of the local communities, there is a dire need for efficient early warning systems and actionable information for decision making. The East Africa Hazards Watch was developed to fill this gap.

The system aggregates risk information from different specialized systems and presents them in one platform. The main goal of the new system is to collect, store, and analyze risk data from different sources and present it in a color-coded system indicating a different level of alert and urgency.  This public regional multi-hazards watch system aims at providing decision ready information, to support transnational coordination and early action across borders. 

Forecasting and Monitoring Components

  • Weather Forecast data - Presents weather forecasts of total rainfall, heavy precipitation and temperatures in weekly, monthly and seasonal timescales, generated at ICPAC.
  • Drought Monitoring - The East Africa Drought Watch is a near-real time system that uses Earth Observation and Weather information to monitor drought conditions in the East Africa region. It contains drought-relevant information such as maps of indicators derived from different data sources (e.g., precipitation measurements, satellite measurements, modeled soil moisture content)
  • Agriculture and Rangelands Monitoring - Every 10 days, the system generates automatic warnings about low or delayed vegetation performance at province level plus weather and Earth Observation vegetation indicators
  • Food Security Monitoring - ICPAC produces a monthly bulletin on the state of food security in the region using Integrated Phase Classification (IPC). This information is presented in a color-coded system that reflects the state of acuteness in each impacted area in the region
  • Climate Change - Presents temperature variation during the past years for the region, showing the warmest years in the record and how the trend is doing in the past years. Also includes climate change projections until 2100
  • Time Series Analysis - The system allows users to click at any point on the map and get time series analysis charts that show the trend for the past time periods for the different enabled layers.
  • Impact and Vulnerability analysis - For some layers like heavy rainfall forecasts and Drought indicators, the application provides information about the population that might be affected by the hazard for any selected location. 

The system also allows to overlay hazard layers with other socio-economic and infrastructure data. This enables identification of infrastructure like schools and health facilities that are at risk of being affected by an impending hazard.


How to cite: Otenyo, E., Babiker, A. S., Baraibar, M., and Otieno, V.: The East Africa Hazards Watch - Meeting the growing need of risk Information due to increasing climate extremes, EGU General Assembly 2024, Vienna, Austria, 14–19 Apr 2024, EGU24-22039, https://doi.org/10.5194/egusphere-egu24-22039, 2024.

EGU24-22080 | ECS | Orals | ESSI4.4

Showcasing Advances in Climate Prediction and Early Warning Systems in the Greater Horn of Africa 

Titike Bahaga, Zewdu Segele, Hussen Endris, Anthony Mwanthi, Masilin Gudoshava, and Eunice Koech

The Greater Horn of Africa (GHA) region is most vulnerable to climate-related risks. The effects of climate change have become increasingly evident in the region through a rise in the frequency and intensity of extreme weather and climate events, notably recurrent and severe droughts, floods, landslides, and tropical cyclones. These extreme climatic events have had far-reaching consequences on the key socio-economic sectors. The extended drought experienced in 2020/2022 led to the loss of millions of livestock and plunged millions of individuals into poverty, prompting forced displacement and insecurity. In contrast, the strong El Niño and positive Indian Ocean Dipole (IOD) events in 2023/2024 brought substantial rainfall to Somalia, Ethiopia, and Kenya in October and November 2023, resulting in flooding that has caused the loss of over 100 lives and displaced more than 700,000 people. Thus, providing reliable and timely climate information is essential for climate services and is increasingly crucial in supporting decision-making processes across a range of climate-sensitive sectors and reducing extreme climate impact. 

The IGAD Climate Prediction and Applications Centre (ICPAC), as a World Meteorological Organization (WMO) Regional Climate Centre (RCC), currently performs the mandatory and recommended RCC functions covering the domains of climate monitoring, climate forecasting, capacity development, and generation of regional and sub-regional tailored products relevant to the various socio-economic sectors. ICPAC has developed improved and tailored climate products and innovative decision support tools to enhance early warning services. It is also one of the first RCCs to adopt the objective forecasting technique and produce a traceable, reproducible, and verifiable forecast based on WMO’s recommendation. Innovative approaches to user engagement through co-production, communication channels, user-friendly interfaces, and dissemination of climate information have also been developed. 

In this session, we would like to showcase the innovative early warning methods, products, services, and platforms developed by ICPAC for response planning and anticipatory actions to enhance community resilience in the GHA region. This includes improved objective forecasting methods for monthly and seasonal forecast products, innovative approaches to user engagement through co-production, communication channels, and sector-tailored products (onset, cessation, dry and wet spells, probability of exceedance). 

How to cite: Bahaga, T., Segele, Z., Endris, H., Mwanthi, A., Gudoshava, M., and Koech, E.: Showcasing Advances in Climate Prediction and Early Warning Systems in the Greater Horn of Africa, EGU General Assembly 2024, Vienna, Austria, 14–19 Apr 2024, EGU24-22080, https://doi.org/10.5194/egusphere-egu24-22080, 2024.

CC BY 4.0